 Deutsch
 English
 Español
 Français
 Italiano
 Nederlands
 Polski
 Português
 Русский
 Türkçe
 Svenska
 Chinese
 Magyar
微星 CX62 7QL 笔记本电脑简短评测


| SD Card Reader | |
| average JPG Copy Test (av. of 3 runs) | |
| HP Pavilion 15t-au100 CTO (W0P31AV) | |
| MSI CX62 7QL | |
| Asus Zenbook UX510UW-CN044T | |
| maximum AS SSD Seq Read Test (1GB) | |
| HP Pavilion 15t-au100 CTO (W0P31AV) | |
| Asus Zenbook UX510UW-CN044T | |
| MSI CX62 7QL | |
| Networking | |
| iperf3 transmit AX12 | |
| MSI GT73VR 6RF | |
| MSI CX62 7QL | |
| HP Pavilion 15t-au100 CTO (W0P31AV) | |
| iperf3 receive AX12 | |
| MSI GT73VR 6RF | |
| MSI CX62 7QL | |
| HP Pavilion 15t-au100 CTO (W0P31AV) | |
| |||||||||||||||||||||||||
Brightness Distribution: 85 %
Center on Battery: 196.1 cd/m²
Contrast: 261:1 (Black: 0.75 cd/m²)
ΔE Color 10.9 | 0.5-29.43 Ø5
ΔE Greyscale 12.6 | 0.57-98 Ø5.3
60.6% sRGB (Argyll 1.6.3 3D)
38.4% AdobeRGB 1998 (Argyll 1.6.3 3D)
41.56% AdobeRGB 1998 (Argyll 2.2.0 3D)
60.5% sRGB (Argyll 2.2.0 3D)
40.22% Display P3 (Argyll 2.2.0 3D)
Gamma: 2.18
| MSI CX62 7QL TN LED, 15.60, 1366x768 | HP Pavilion 15t-au100 CTO (W0P31AV) BOE0693, IPS, 15.60, 1920x1080 | Lenovo Yoga 510-15IKB 80VC000XGE BOE HF NV156FHM-N42, IPS, 15.60, 1920x1080 | Asus Zenbook UX510UW-CN044T LG Philips LP156WF6-SPB6, IPS, 15.60, 1920x1080 | MSI GL62-6QFi781H11 CMN N156HGE-EAL (CMN15D2), TN LED, 15.60, 1920x1080 | |
|---|---|---|---|---|---|
| Display | 8% | 4% | 42% | 93% | |
| Display P3 Coverage | 40.22 | 43.27 8% | 41.92 4% | 61.5 53% | 85.8 113% |
| sRGB Coverage | 60.5 | 64.9 7% | 62.9 4% | 80.4 33% | 99.8 65% |
| AdobeRGB 1998 Coverage | 41.56 | 44.71 8% | 43.32 4% | 58.8 41% | 84.1 102% |
| Response Times | -2% | 1% | 14% | 17% | |
| Response Time Grey 50% / Grey 80% * | 50.4 ? | 42 ? 17% | 53 ? -5% | 40 ? 21% | 43 ? 15% |
| Response Time Black / White * | 28 ? | 33.6 ? -20% | 26 ? 7% | 26 ? 7% | 23 ? 18% |
| PWM Frequency | 198.4 | 50 ? | 1000 ? | ||
| Screen | 46% | 70% | 65% | 31% | |
| Brightness middle | 196.1 | 186.5 -5% | 236 20% | 326 66% | 216 10% |
| Brightness | 196 | 174 -11% | 212 8% | 316 61% | 202 3% |
| Brightness Distribution | 85 | 69 -19% | 78 -8% | 80 -6% | 83 -2% |
| Black Level * | 0.75 | 0.18 76% | 0.18 76% | 0.35 53% | 0.48 36% |
| Contrast | 261 | 1036 297% | 1311 402% | 931 257% | 450 72% |
| Colorchecker dE 2000 * | 10.9 | 5.7 48% | 3.92 64% | 5.49 50% | 9.98 8% |
| Colorchecker dE 2000 max. * | 19 | 22.5 -18% | 9.2 52% | 11.36 40% | 17.12 10% |
| Greyscale dE 2000 * | 12.6 | 4.4 65% | 2.35 81% | 4.84 62% | 10.91 13% |
| Gamma | 2.18 101% | 2.35 94% | 2.34 94% | 2.23 99% | 2.31 95% |
| CCT | 14195 46% | 6963 93% | 6161 106% | 5971 109% | 13185 49% |
| Color Space (Percent of AdobeRGB 1998) | 38.4 | 44.71 16% | 40 4% | 53 38% | 75 95% |
| Color Space (Percent of sRGB) | 60.6 | 64.95 7% | 63 4% | 80 32% | 100 65% |
| Total Average (Program / Settings) | 17% /
32% | 25% /
48% | 40% /
54% | 47% /
42% |
* ... smaller is better
Display Response Times
| ↔ Response Time Black to White | ||
|---|---|---|
| 28 ms ... rise ↗ and fall ↘ combined | ↗ 10 ms rise |  |
| ↘ 18 ms fall | ||
| The screen shows relatively slow response rates in our tests and may be too slow for gamers. In comparison, all tested devices range from 0.1 (minimum) to 240 (maximum) ms. » 67 % of all devices are better. This means that the measured response time is worse than the average of all tested devices (21.5 ms). | ||
| ↔ Response Time 50% Grey to 80% Grey | ||
| 50.4 ms ... rise ↗ and fall ↘ combined | ↗ 24 ms rise | 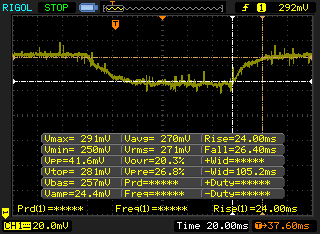 |
| ↘ 26.4 ms fall | ||
| The screen shows slow response rates in our tests and will be unsatisfactory for gamers. In comparison, all tested devices range from 0.2 (minimum) to 636 (maximum) ms. » 85 % of all devices are better. This means that the measured response time is worse than the average of all tested devices (33.7 ms). | ||
Screen Flickering / PWM (Pulse-Width Modulation)
| Screen flickering / PWM not detected | 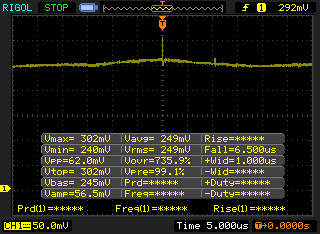 | ||
In comparison: 53 % of all tested devices do not use PWM to dim the display. If PWM was detected, an average of 17900 (minimum: 5 - maximum: 3846000) Hz was measured. | |||


| Cinebench R15 | |
| CPU Single 64Bit | |
| HP Envy x360 15t-w200 | |
| Asus GL702VM-GC102D | |
| Asus Zenbook UX510UW-CN044T | |
| MSI CX62 7QL | |
| HP ProBook 640 G2-T9X60ET | |
| HP 250 G4 T6P08ES | |
| Lenovo IdeaPad Z40-59422614 | |
| CPU Multi 64Bit | |
| Asus GL702VM-GC102D | |
| HP Envy x360 15t-w200 | |
| MSI CX62 7QL | |
| Asus Zenbook UX510UW-CN044T | |
| HP ProBook 640 G2-T9X60ET | |
| HP 250 G4 T6P08ES | |
| Lenovo IdeaPad Z40-59422614 | |
| Cinebench R11.5 | |
| CPU Single 64Bit | |
| HP Envy x360 15t-w200 | |
| Asus GL702VM-GC102D | |
| Asus Zenbook UX510UW-CN044T | |
| MSI CX62 7QL | |
| HP ProBook 640 G2-T9X60ET | |
| HP 250 G4 T6P08ES | |
| Lenovo IdeaPad Z40-59422614 | |
| CPU Multi 64Bit | |
| Asus GL702VM-GC102D | |
| HP Envy x360 15t-w200 | |
| MSI CX62 7QL | |
| Asus Zenbook UX510UW-CN044T | |
| HP ProBook 640 G2-T9X60ET | |
| HP 250 G4 T6P08ES | |
| Lenovo IdeaPad Z40-59422614 | |
| Cinebench R10 | |
| Rendering Multiple CPUs 32Bit | |
| Asus GL702VM-GC102D | |
| MSI CX62 7QL | |
| Asus Zenbook UX510UW-CN044T | |
| HP ProBook 640 G2-T9X60ET | |
| HP 250 G4 T6P08ES | |
| Lenovo IdeaPad Z40-59422614 | |
| Rendering Single 32Bit | |
| Asus GL702VM-GC102D | |
| MSI CX62 7QL | |
| Asus Zenbook UX510UW-CN044T | |
| HP ProBook 640 G2-T9X60ET | |
| HP 250 G4 T6P08ES | |
| Lenovo IdeaPad Z40-59422614 | |
| wPrime 2.10 - 1024m | |
| Lenovo IdeaPad Z40-59422614 | |
| HP Envy x360 15t-w200 | |
| Super Pi Mod 1.5 XS 32M - 32M | |
| Lenovo IdeaPad Z40-59422614 | |
| HP Envy x360 15t-w200 | |
* ... smaller is better
| PCMark 8 | |
| Home Score Accelerated v2 | |
| Lenovo Yoga 510-15IKB 80VC000XGE | |
| MSI GL62-6QFi781H11 | |
| MSI CX62 7QL | |
| HP Pavilion 15t-au100 CTO (W0P31AV) | |
| Asus Zenbook UX510UW-CN044T | |
| Work Score Accelerated v2 | |
| MSI GL62-6QFi781H11 | |
| MSI CX62 7QL | |
| Asus Zenbook UX510UW-CN044T | |
| HP Pavilion 15t-au100 CTO (W0P31AV) | |
| Creative Score Accelerated v2 | |
| MSI GL62-6QFi781H11 | |
| Asus Zenbook UX510UW-CN044T | |
| HP Pavilion 15t-au100 CTO (W0P31AV) | |
| MSI CX62 7QL | |
| PCMark 8 Home Score Accelerated v2 | 3594 points | |
| PCMark 8 Creative Score Accelerated v2 | 4035 points | |
| PCMark 8 Work Score Accelerated v2 | 4364 points | |
Help | ||
| MSI CX62 7QL WDC Scorpio Blue WD10JPVX-22JC3T0 | HP Pavilion 15t-au100 CTO (W0P31AV) Toshiba MQ01ABD100 | Lenovo Yoga 510-15IKB 80VC000XGE Samsung MZYTY256HDHP | Asus Zenbook UX510UW-CN044T SanDisk SD8SNAT256G1002 | MSI GL62-6QFi781H11 Toshiba HG6 THNSNJ128G8NY | |
|---|---|---|---|---|---|
| CrystalDiskMark 3.0 | -18% | 8589% | 5301% | 6073% | |
| Read Seq | 113.7 | 109.5 -4% | 529 365% | 459.3 304% | 530 366% |
| Write Seq | 113.3 | 105.2 -7% | 508 348% | 325.5 187% | 442.7 291% |
| Read 512 | 38.42 | 34.08 -11% | 409.8 967% | 279.2 627% | 409.1 965% |
| Write 512 | 55.8 | 40.02 -28% | 316.5 467% | 280.1 402% | 417.3 648% |
| Read 4k | 0.48 | 0.429 -11% | 36.01 7402% | 22.43 4573% | 21.81 4444% |
| Write 4k | 1.282 | 1.008 -21% | 106.7 8223% | 74.9 5742% | 93 7154% |
| Read 4k QD32 | 1.172 | 0.81 -31% | 384.8 32733% | 149 12613% | 257 21828% |
| Write 4k QD32 | 1.296 | 0.893 -31% | 237.3 18210% | 234 17956% | 168.3 12886% |

| 3DMark | |
| 1280x720 Cloud Gate Standard Graphics | |
| Asus Zenbook UX510UW-CN044T | |
| Acer Aspire E5-575G-549D | |
| Intel Skull Canyon NUC6i7KYK | |
| MSI CX62 7QL | |
| HP ProBook 440 G4-Y8B51EA | |
| Dell Latitude 15 3550-0123 | |
| HP Pavilion x360 13t-u100 | |
| 1920x1080 Fire Strike Graphics | |
| Asus Zenbook UX510UW-CN044T | |
| Acer Aspire E5-575G-549D | |
| Intel Skull Canyon NUC6i7KYK | |
| MSI CX62 7QL | |
| HP ProBook 440 G4-Y8B51EA | |
| Dell Latitude 15 3550-0123 | |
| HP Pavilion x360 13t-u100 | |
| 3DMark 11 | |
| 1280x720 Performance GPU | |
| Asus Zenbook UX510UW-CN044T | |
| Acer Aspire E5-575G-549D | |
| Intel Skull Canyon NUC6i7KYK | |
| MSI CX62 7QL | |
| HP ProBook 440 G4-Y8B51EA | |
| Dell Latitude 15 3550-0123 | |
| HP Pavilion x360 13t-u100 | |
| 1280x720 Performance Combined | |
| Asus Zenbook UX510UW-CN044T | |
| Acer Aspire E5-575G-549D | |
| Intel Skull Canyon NUC6i7KYK | |
| MSI CX62 7QL | |
| HP ProBook 440 G4-Y8B51EA | |
| Dell Latitude 15 3550-0123 | |
| HP Pavilion x360 13t-u100 | |
| 3DMark 11 Performance | 2529 points | |
| 3DMark Ice Storm Standard Score | 65002 points | |
| 3DMark Cloud Gate Standard Score | 6847 points | |
| 3DMark Fire Strike Score | 1473 points | |
| 3DMark Fire Strike Extreme Score | 753 points | |
Help | ||
| low | med. | high | ultra | |
| BioShock Infinite (2013) | 97.2 | 54.3 | 44 | |
| Metro: Last Light (2013) | 51.3 | 39.5 | 28.5 | |
| Thief (2014) | 50.7 | 29.3 | ||
| Batman: Arkham Knight (2015) | 28 | |||
| Metal Gear Solid V (2015) | 60 | 58 | ||
| Fallout 4 (2015) | 34.6 | |||
| Rise of the Tomb Raider (2016) | 40.1 | 23.2 | ||
| Ashes of the Singularity (2016) | 19.4 | |||
| Overwatch (2016) | 73.5 | 51.4 |
Noise Level
| Idle |
| 32.1 / 32.2 / 32.2 dB(A) |
| Load |
| 37.4 / 51.4 dB(A) |
 | ||
30 dB silent 40 dB(A) audible 50 dB(A) loud |
||
min: | ||
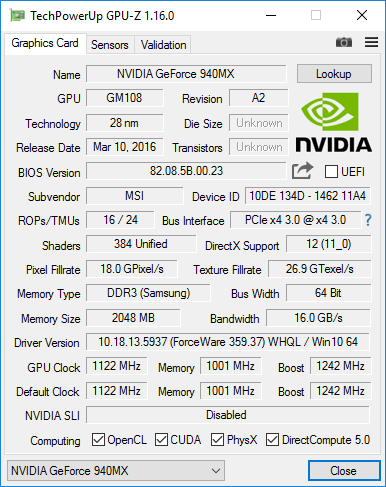
| MSI CX62 7QL GeForce 940MX, i5-7200U, WDC Scorpio Blue WD10JPVX-22JC3T0 | HP Pavilion 15t-au100 CTO (W0P31AV) GeForce 940MX, i7-7500U, Toshiba MQ01ABD100 | Lenovo Yoga 510-15IKB 80VC000XGE Radeon R7 M460, i5-7200U, Samsung MZYTY256HDHP | Asus Zenbook UX510UW-CN044T GeForce GTX 960M, 6500U, SanDisk SD8SNAT256G1002 | MSI GL62-6QFi781H11 GeForce GTX 960M, 6700HQ, Toshiba HG6 THNSNJ128G8NY | |
|---|---|---|---|---|---|
| Noise | 2% | 6% | -1% | -6% | |
| off / environment * | 29 | 30.15 -4% | 31.6 -9% | 30 -3% | |
| Idle Minimum * | 32.1 | 32.2 -0% | 30.2 6% | 31.6 2% | 35 -9% |
| Idle Average * | 32.2 | 32.2 -0% | 30.2 6% | 31.6 2% | 36 -12% |
| Idle Maximum * | 32.2 | 33.7 -5% | 31 4% | 33.4 -4% | 37 -15% |
| Load Average * | 37.4 | 39.4 -5% | 38 -2% | 41.7 -11% | 41 -10% |
| Load Maximum * | 51.4 | 42.2 18% | 38.6 25% | 44.8 13% | 46 11% |
* ... smaller is better
(+) The maximum temperature on the upper side is 38.4 °C / 101 F, compared to the average of 36.9 °C / 98 F, ranging from 21.1 to 71 °C for the class Multimedia.
(+) The bottom heats up to a maximum of 35.8 °C / 96 F, compared to the average of 39.1 °C / 102 F
(+) In idle usage, the average temperature for the upper side is 24 °C / 75 F, compared to the device average of 31.2 °C / 88 F.
(+) The palmrests and touchpad are reaching skin temperature as a maximum (32.2 °C / 90 F) and are therefore not hot.
(-) The average temperature of the palmrest area of similar devices was 28.8 °C / 83.8 F (-3.4 °C / -6.2 F).
MSI CX62 7QL audio analysis
(±) | speaker loudness is average but good (74.8 dB)
Bass 100 - 315 Hz
(-) | nearly no bass - on average 19.6% lower than median
(±) | linearity of bass is average (11.1% delta to prev. frequency)
Mids 400 - 2000 Hz
(±) | higher mids - on average 9.5% higher than median
(-) | mids are not linear (15.2% delta to prev. frequency)
Highs 2 - 16 kHz
(±) | higher highs - on average 7.4% higher than median
(±) | linearity of highs is average (9.5% delta to prev. frequency)
Overall 100 - 16.000 Hz
(-) | overall sound is not linear (38.2% difference to median)
Compared to same class
» 99% of all tested devices in this class were better, 1% similar, 1% worse
» The best had a delta of 5%, average was 18%, worst was 45%
Compared to all devices tested
» 94% of all tested devices were better, 1% similar, 6% worse
» The best had a delta of 4%, average was 25%, worst was 134%
Apple MacBook 12 (Early 2016) 1.1 GHz audio analysis
(+) | speakers can play relatively loud (83.6 dB)
Bass 100 - 315 Hz
(±) | reduced bass - on average 11.3% lower than median
(±) | linearity of bass is average (14.2% delta to prev. frequency)
Mids 400 - 2000 Hz
(+) | balanced mids - only 2.4% away from median
(+) | mids are linear (5.5% delta to prev. frequency)
Highs 2 - 16 kHz
(+) | balanced highs - only 2% away from median
(+) | highs are linear (4.5% delta to prev. frequency)
Overall 100 - 16.000 Hz
(+) | overall sound is linear (10.2% difference to median)
Compared to same class
» 5% of all tested devices in this class were better, 2% similar, 93% worse
» The best had a delta of 5%, average was 19%, worst was 53%
Compared to all devices tested
» 3% of all tested devices were better, 1% similar, 96% worse
» The best had a delta of 4%, average was 25%, worst was 134%
| Off / Standby | |
| Idle | |
| Load |
|
| MSI CX62 7QL i5-7200U, GeForce 940MX, WDC Scorpio Blue WD10JPVX-22JC3T0, TN LED, 1366x768, 15.60 | HP Pavilion 15t-au100 CTO (W0P31AV) i7-7500U, GeForce 940MX, Toshiba MQ01ABD100, IPS, 1920x1080, 15.60 | Lenovo Yoga 510-15IKB 80VC000XGE i5-7200U, Radeon R7 M460, Samsung MZYTY256HDHP, IPS, 1920x1080, 15.60 | Asus Zenbook UX510UW-CN044T 6500U, GeForce GTX 960M, SanDisk SD8SNAT256G1002, IPS, 1920x1080, 15.60 | MSI GL62-6QFi781H11 6700HQ, GeForce GTX 960M, Toshiba HG6 THNSNJ128G8NY, TN LED, 1920x1080, 15.60 | |
|---|---|---|---|---|---|
| Power Consumption | -15% | 6% | -36% | -110% | |
| Idle Minimum * | 6.3 | 6.16 2% | 3.9 38% | 5 21% | 10 -59% |
| Idle Average * | 7 | 8.48 -21% | 7.8 -11% | 8.9 -27% | 14 -100% |
| Idle Maximum * | 7.2 | 9.62 -34% | 8.4 -17% | 11.8 -64% | 19 -164% |
| Load Average * | 35.1 | 41.63 -19% | 37 -5% | 55 -57% | 82 -134% |
| Load Maximum * | 61.2 | 63.22 -3% | 46 25% | 93 -52% | 118 -93% |
* ... smaller is better
| MSI CX62 7QL i5-7200U, GeForce 940MX, 41 Wh | HP Pavilion 15t-au100 CTO (W0P31AV) i7-7500U, GeForce 940MX, 41 Wh | Lenovo Yoga 510-15IKB 80VC000XGE i5-7200U, Radeon R7 M460, 35 Wh | Asus Zenbook UX510UW-CN044T 6500U, GeForce GTX 960M, 48 Wh | MSI GL62-6QFi781H11 6700HQ, GeForce GTX 960M, 41.4 Wh | |
|---|---|---|---|---|---|
| Battery Runtime | -22% | 13% | 20% | -44% | |
| Reader / Idle | 613 | 438 -29% | 816 33% | 339 -45% | |
| WiFi v1.3 | 283 | 220 -22% | 320 13% | 430 52% | 158 -44% |
| Load | 125 | 106 -15% | 95 -24% | 71 -43% |
Pros
Cons

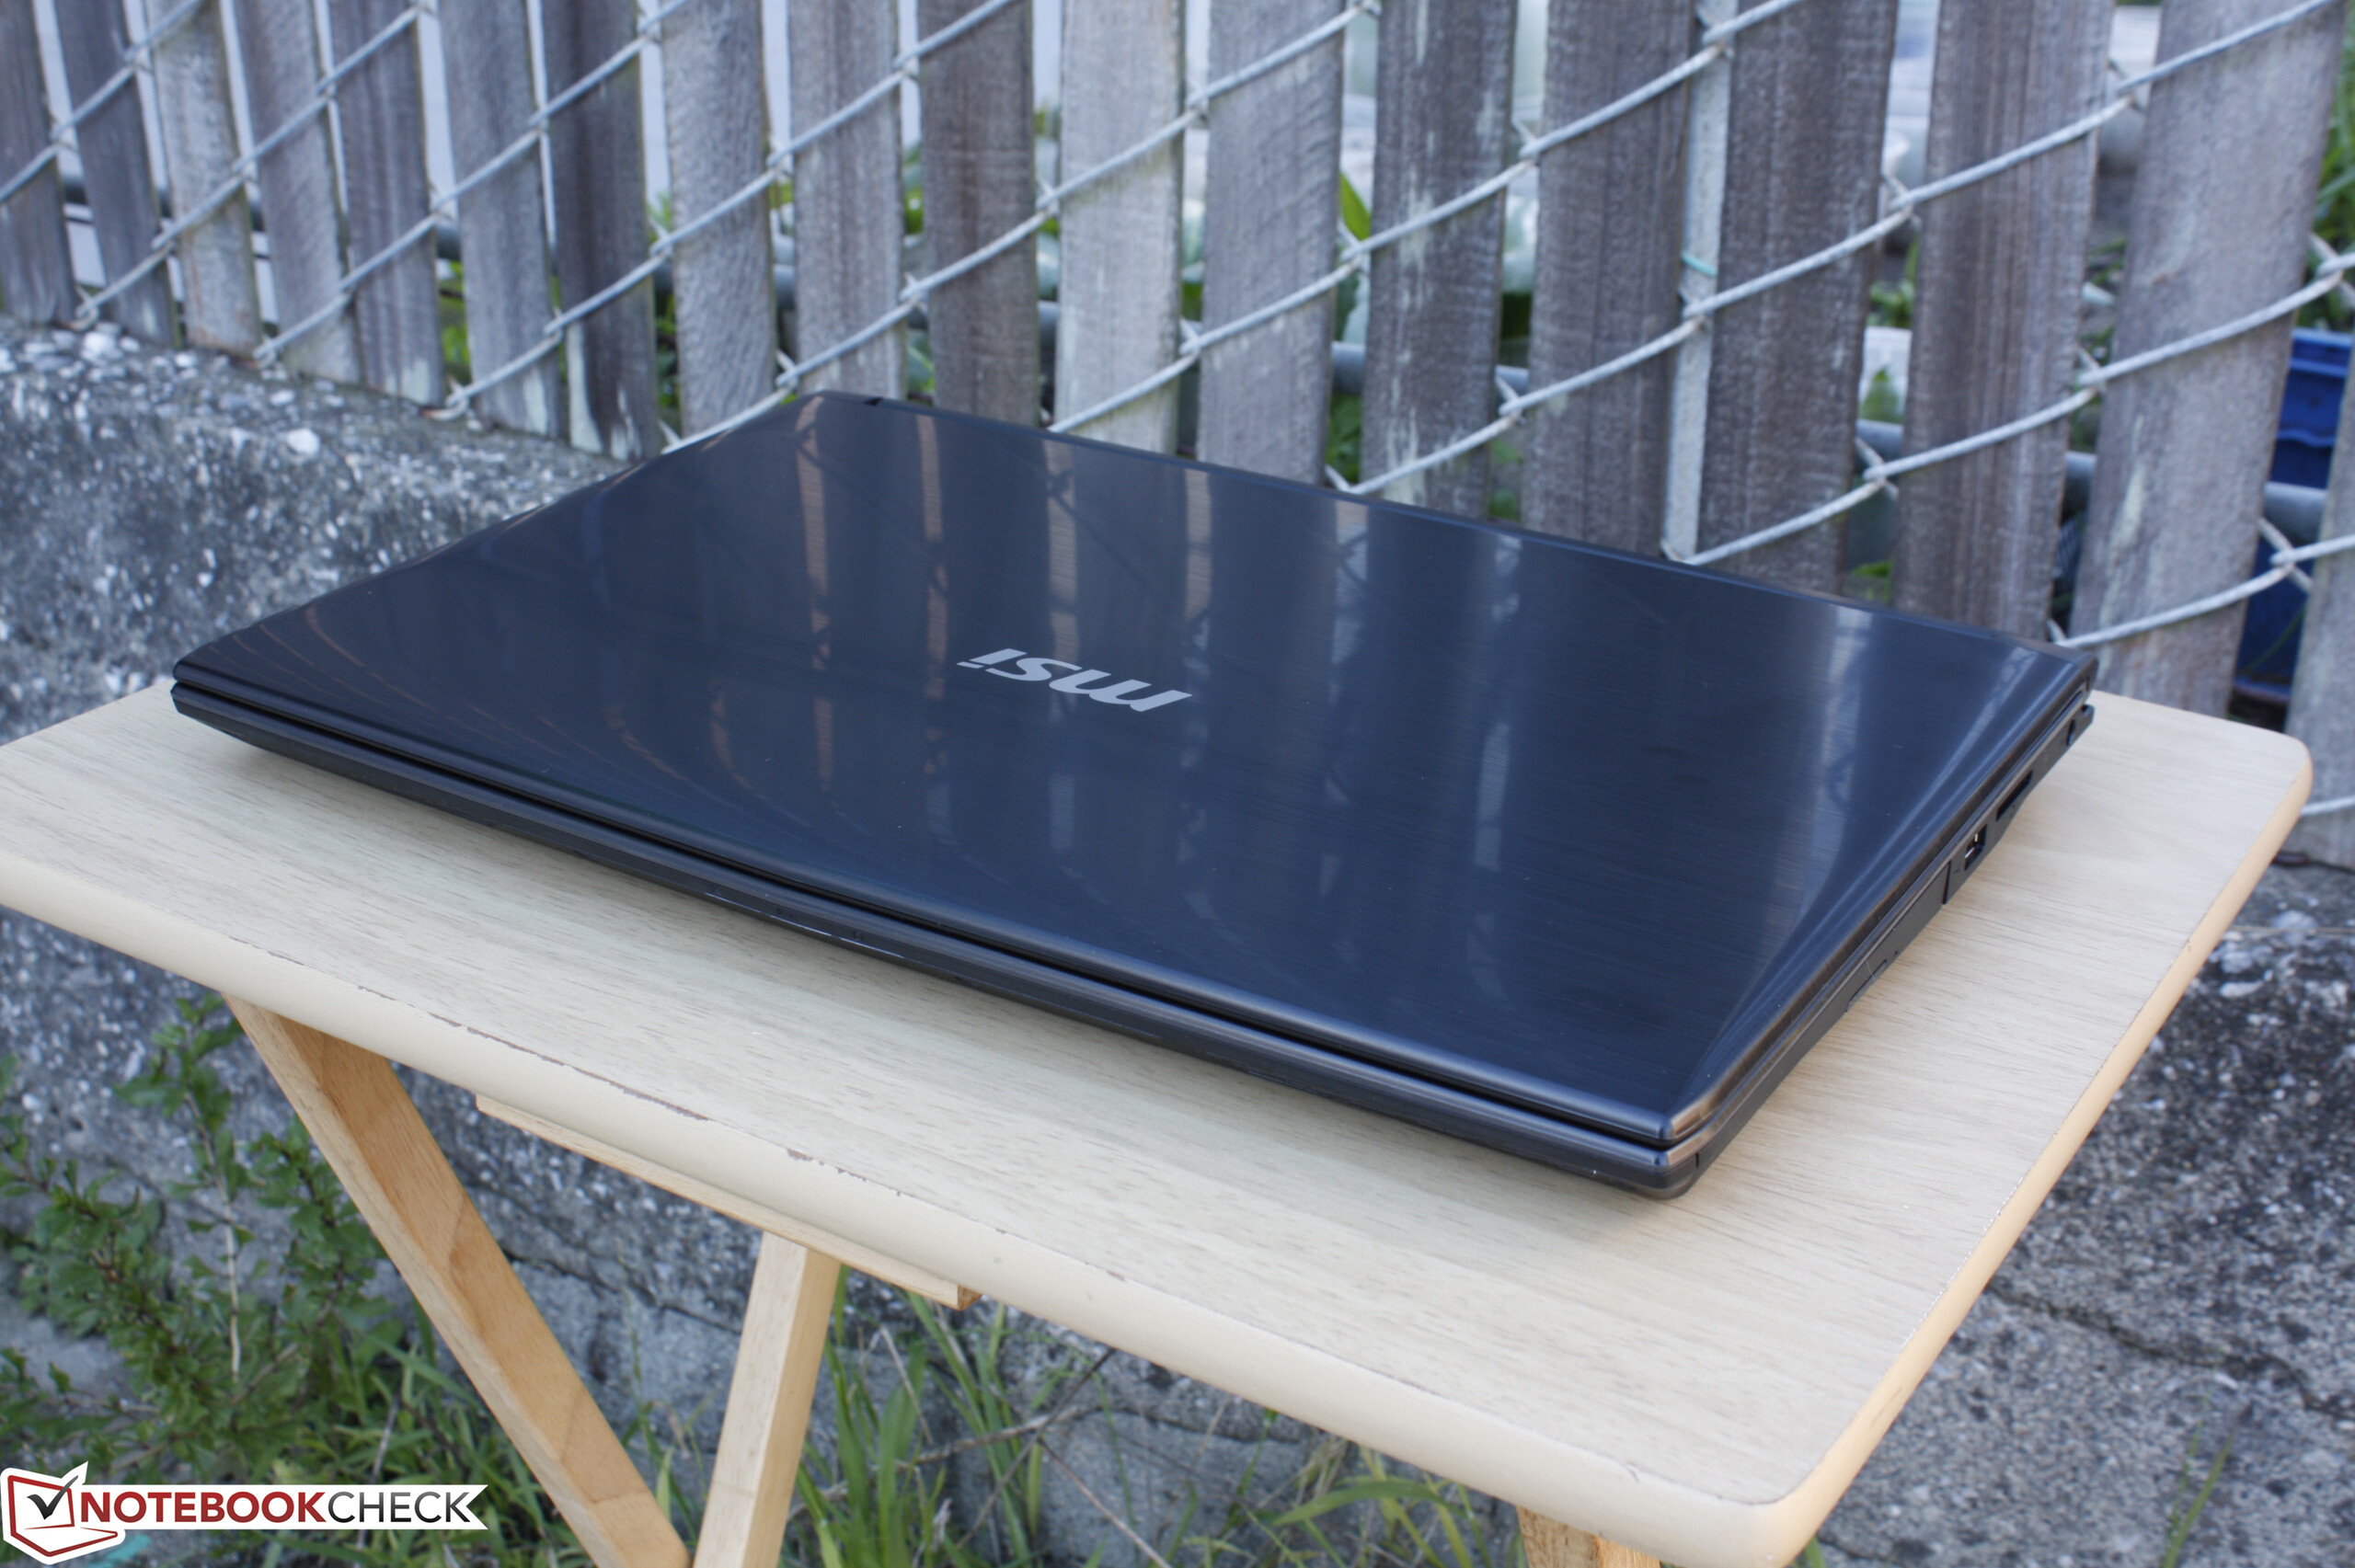
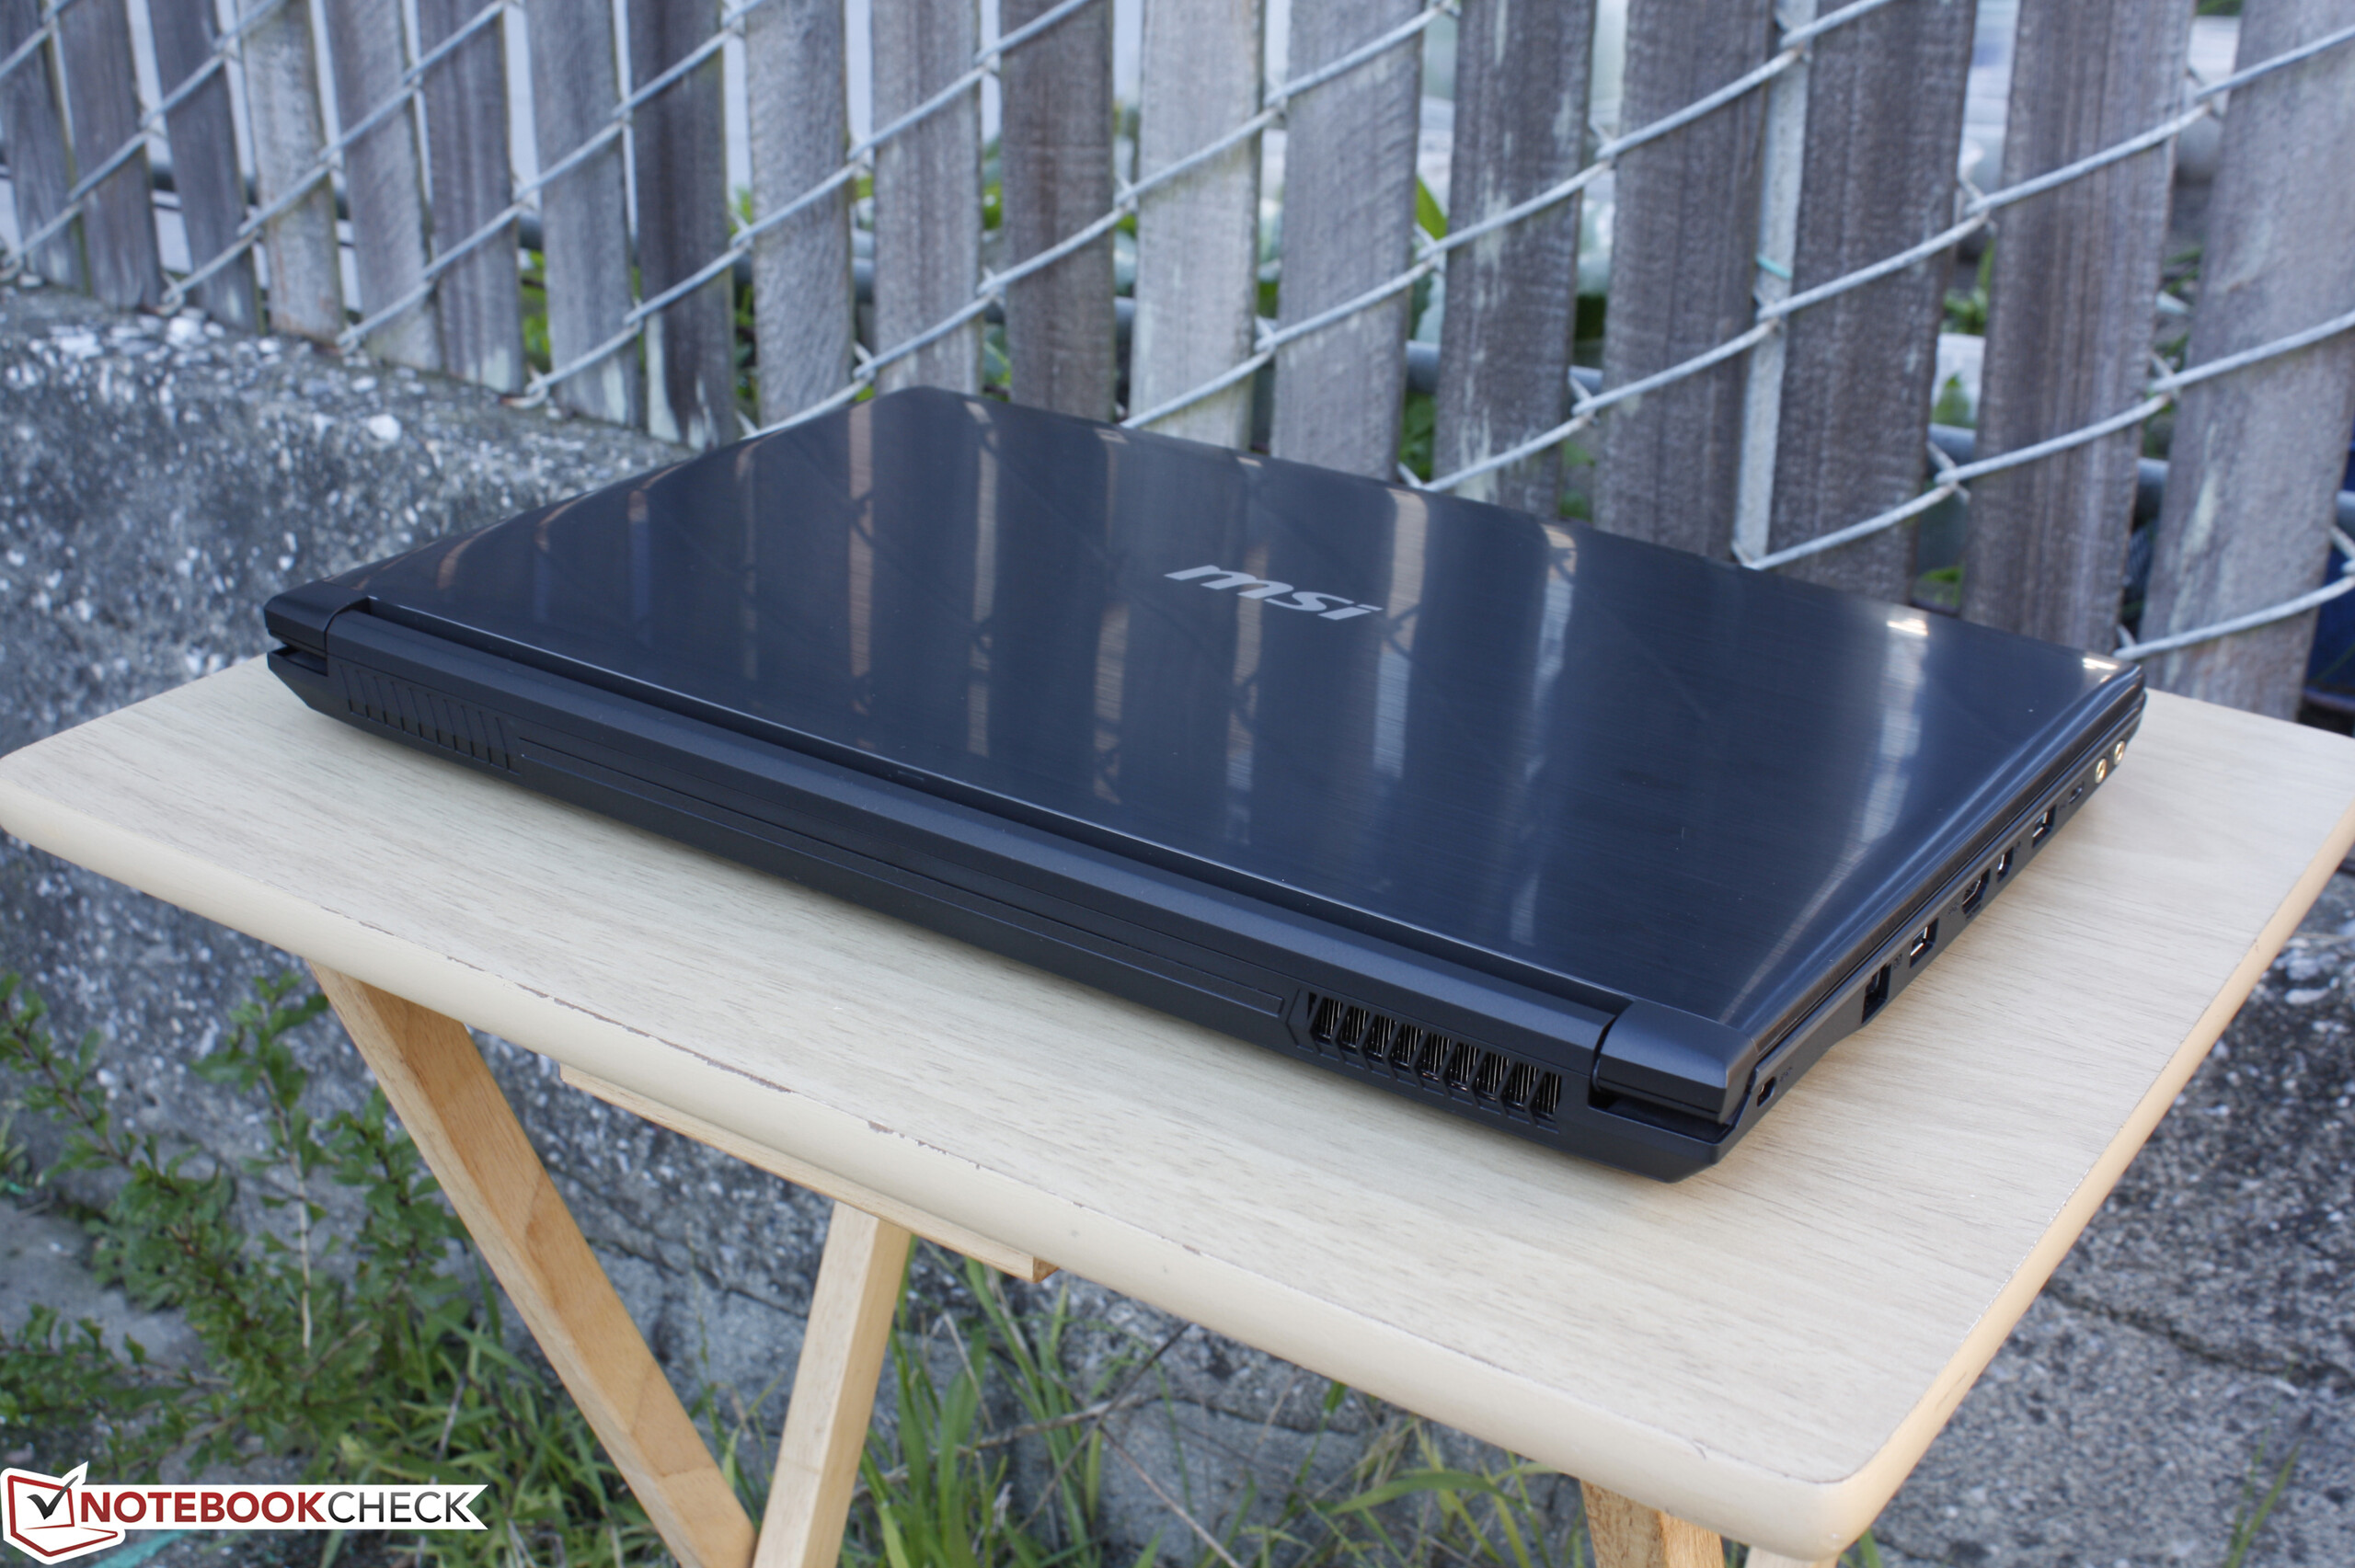
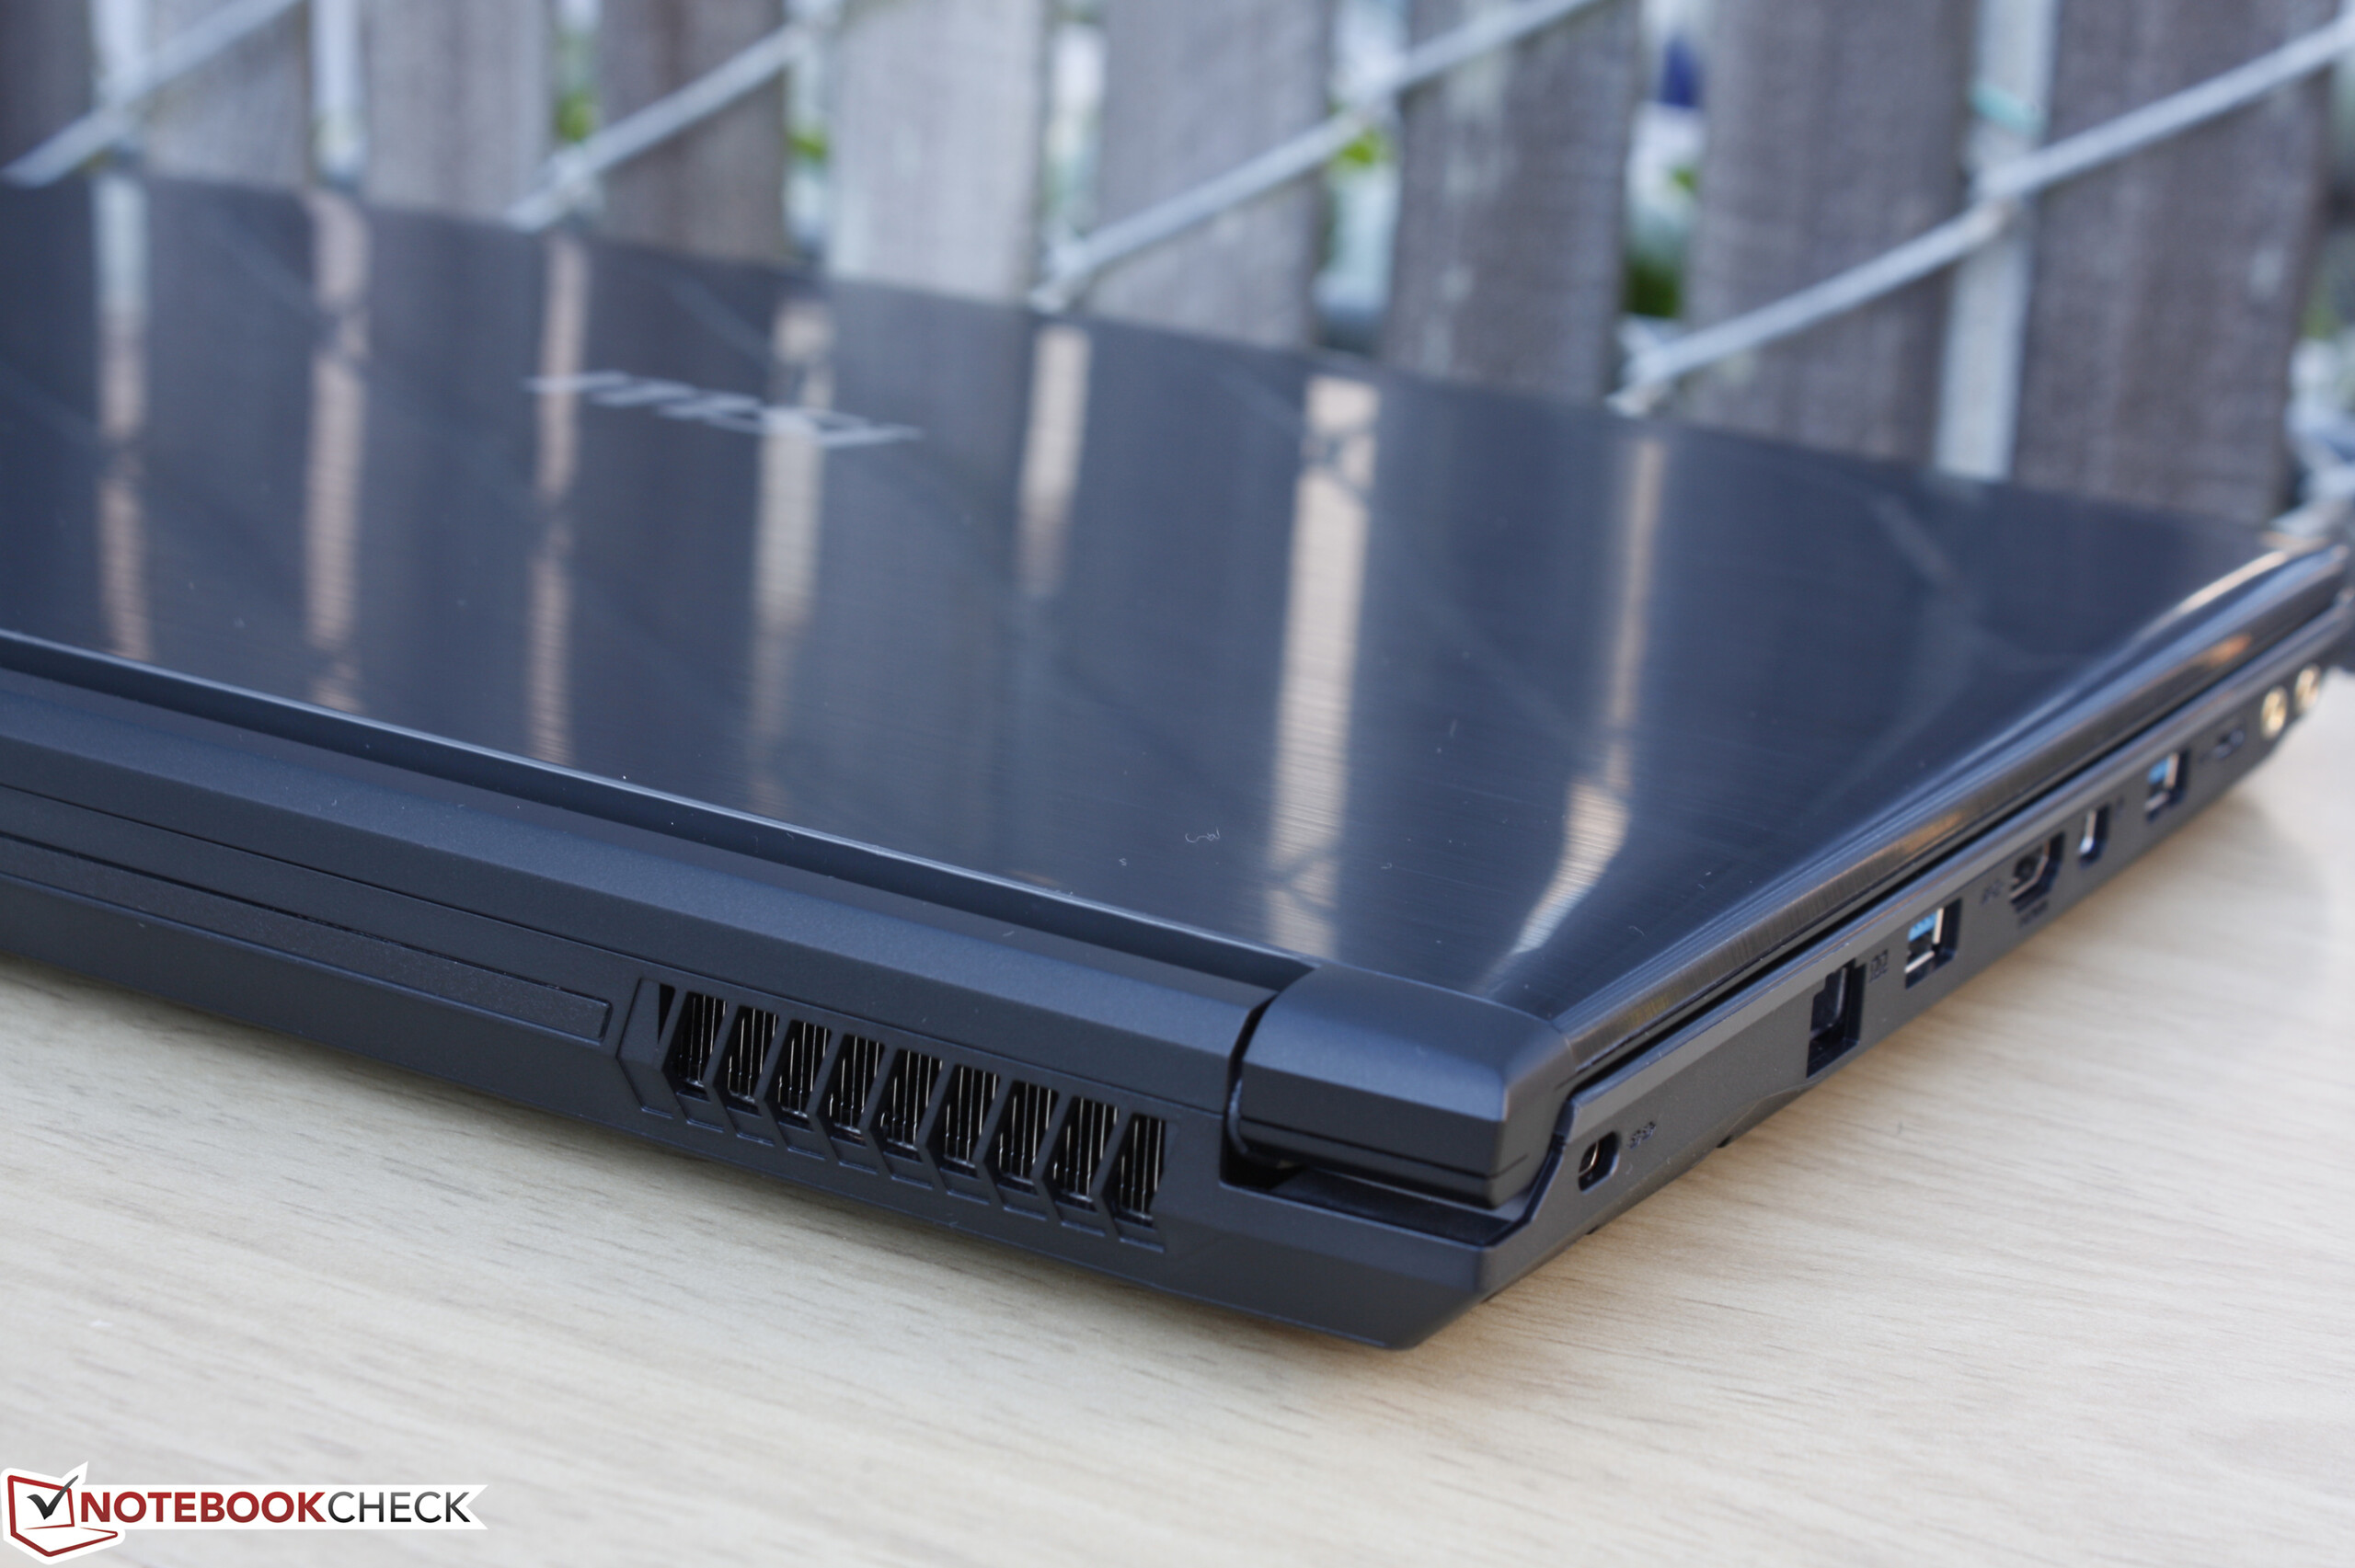
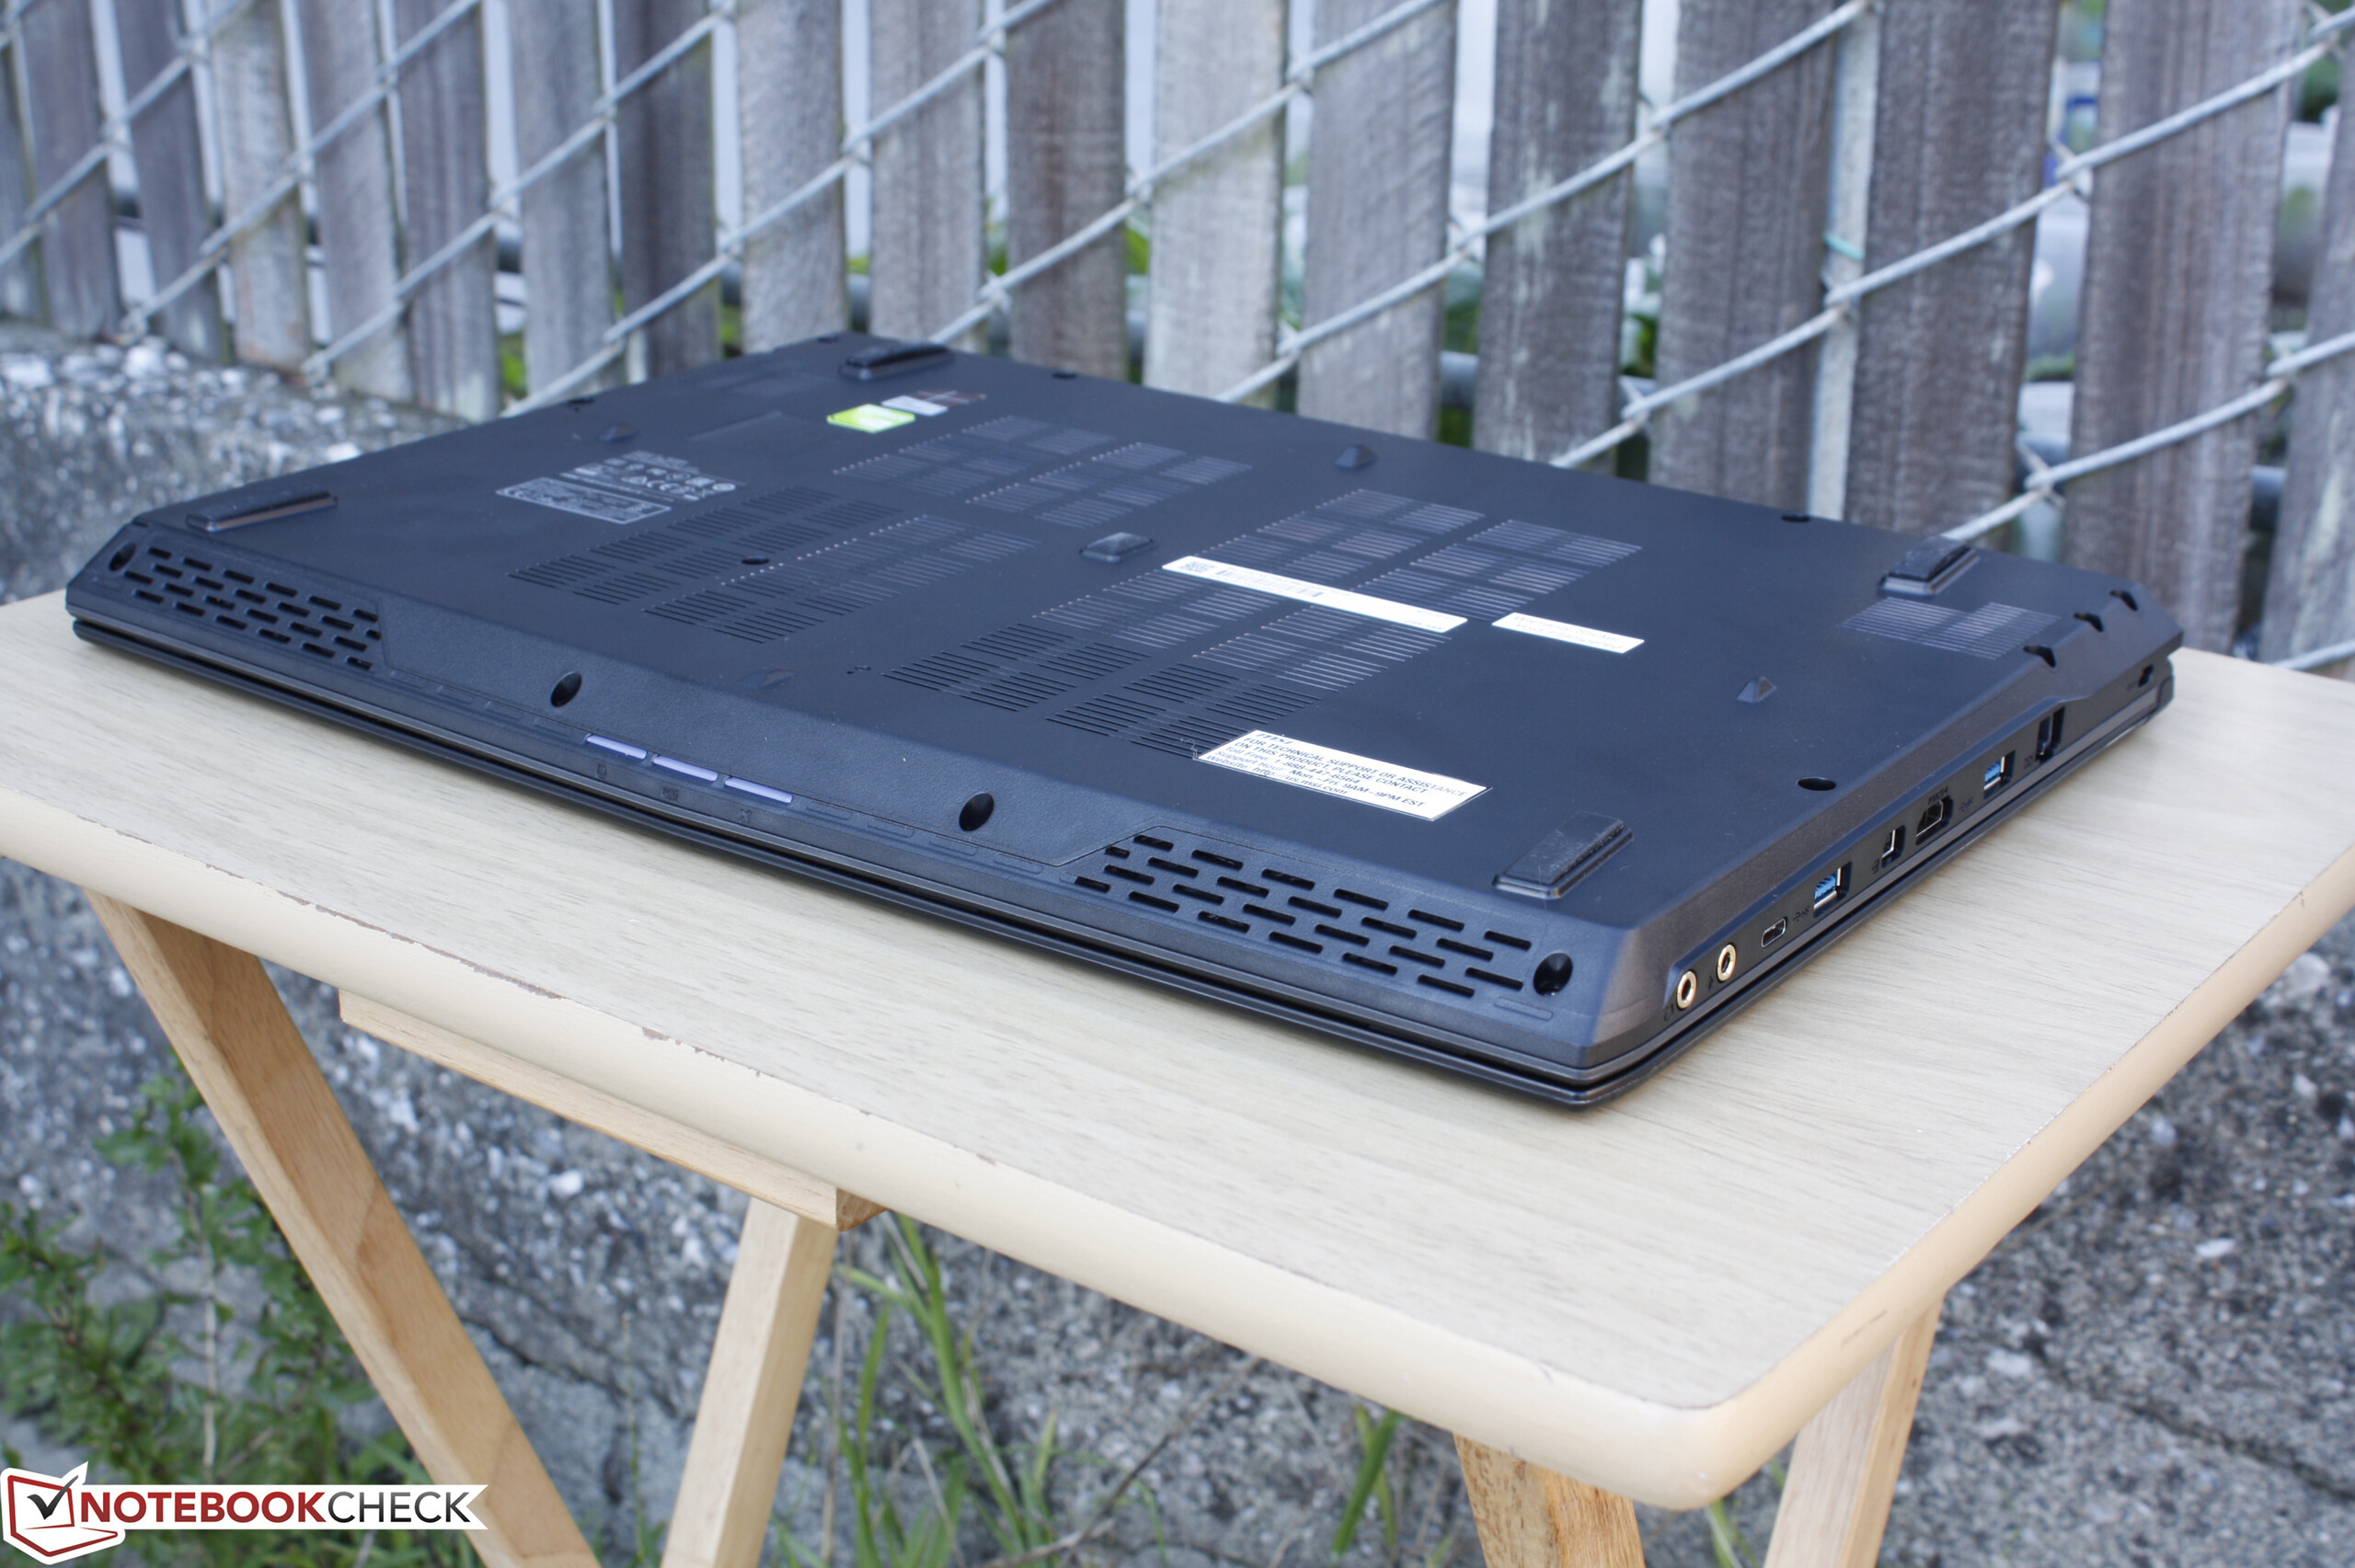
考虑到笨重的机身,CX62的性能相对较弱。超低电压Kaby Lake处理器和GeForce 940MX显卡对于除了网页浏览和多媒体播放之外的用途来说都显得有些薄弱。它的游戏性能对于最新3D游戏基本只能够满足768p和低设定下流畅运行的水平,同时在负载之下它的风扇会发出不规则的呜呜声。它的机身虽然在外观上和广受欢迎的GE62十分相近,但在质感和坚固度上都远远不如。更让人遗憾的是,它的TN屏幕出场色彩偏差严重,同时对比度和背光亮度都较差。
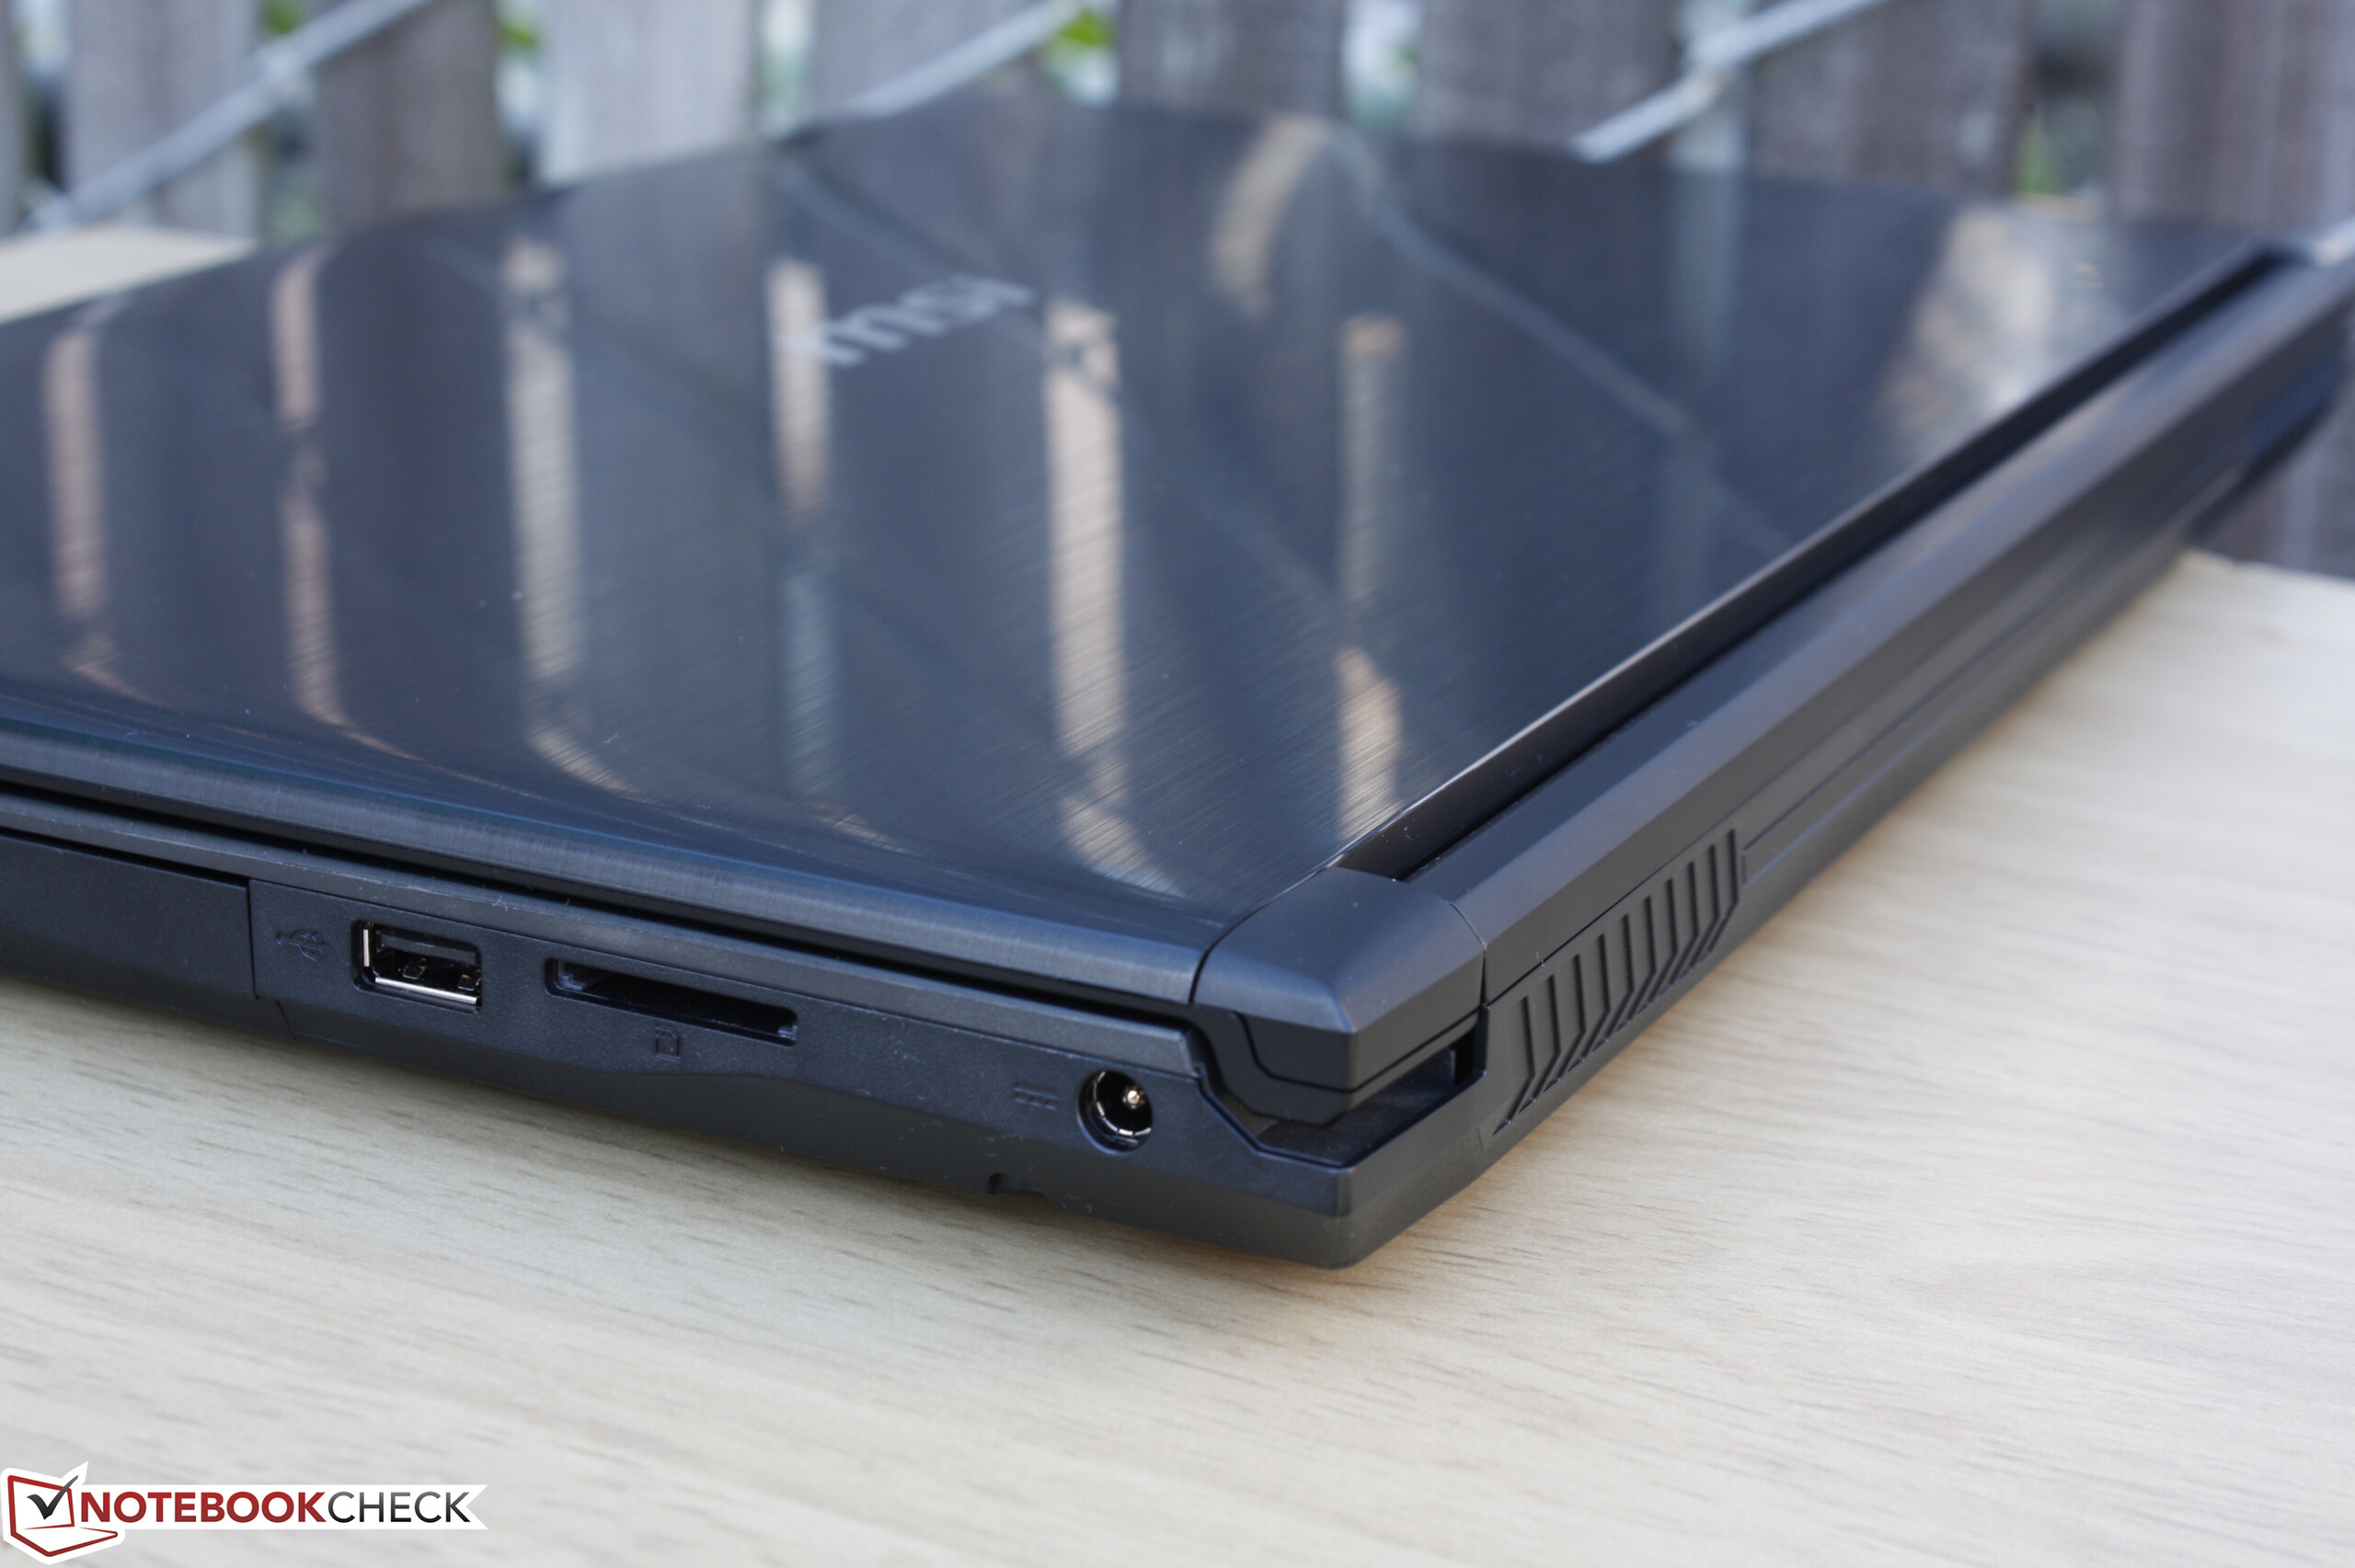
能够帮它略微挽回颜面的功能包括对NVMe M.2接口的支持,和低发热量。前者可以帮助我们的机械硬盘测试机大幅提升系统响应速度,不过用户自行升级会破坏质保。同时,较低的核心温度对于和其他搭载更高功率硬件的G系列机型同样的机身来说并不成问题。这让GX62可以在运行中保持较快的Turbo Boost速度,相比大部分ULV处理器系统在更低温度运行。
CX62本质上是一台搭配多媒体水平硬件的缩水版游戏笔记本电脑。它在太多方面都节省了成本,用户不如多支出1000到2000人民币选择搭配同样或更好处理器和屏幕的高品质超级本。
注:本文是基于完整评测的缩减版本,阅读完整的英文评测,请点击这里。
MSI CX62 7QL
-
01/16/2017 v6(old)
Allen Ngo
Pricecompare
