

华为 P10 Plus 智能手机简短评测
| Networking | |
| iperf3 transmit AX12 | |
| Samsung Galaxy S8 Plus | |
| Huawei P10 | |
| OnePlus 3T | |
| LG G6 | |
| Huawei P10 Plus | |
| iperf3 receive AX12 | |
| Samsung Galaxy S8 Plus | |
| LG G6 | |
| Huawei P10 | |
| OnePlus 3T | |
| Huawei P10 Plus | |


| |||||||||||||||||||||||||
Brightness Distribution: 92 %
Center on Battery: 568 cd/m²
Contrast: 1321:1 (Black: 0.43 cd/m²)
ΔE ColorChecker Calman: 2.4 | ∀{0.5-29.43 Ø4.79}
ΔE Greyscale Calman: 2.5 | ∀{0.09-98 Ø5}
Gamma: 2.37
CCT: 6779 K
| Huawei P10 Plus LTPS, 2560x1440, 5.5" | Apple iPhone 7 Plus IPS, 1920x1080, 5.5" | Huawei P10 LTPS, 1920x1080, 5.1" | OnePlus 3T Optic-AMOLED, 1920x1080, 5.5" | Samsung Galaxy S8 Plus Super AMOLED, 2960x1440, 6.2" | LG G6 IPS LCD, 2880x1440, 5.7" | Lenovo Moto Z AMOLED, 2560x1440, 5.5" | |
|---|---|---|---|---|---|---|---|
| Screen | 19% | -41% | -122% | 13% | -21% | -11% | |
| Brightness middle (cd/m²) | 568 | 557 -2% | 547 -4% | 421 -26% | 560 -1% | 646 14% | 485 -15% |
| Brightness (cd/m²) | 562 | 553 -2% | 556 -1% | 430 -23% | 562 0% | 611 9% | 490 -13% |
| Brightness Distribution (%) | 92 | 97 5% | 86 -7% | 84 -9% | 93 1% | 89 -3% | 92 0% |
| Black Level * (cd/m²) | 0.43 | 0.35 19% | 0.43 -0% | 0.23 47% | |||
| Contrast (:1) | 1321 | 1591 20% | 1272 -4% | 2809 113% | |||
| Colorchecker dE 2000 * | 2.4 | 1.4 42% | 4.8 -100% | 7.1 -196% | 1.7 29% | 4.5 -88% | 2.1 12% |
| Colorchecker dE 2000 max. * | 3.8 | 3.1 18% | 8.8 -132% | 15.3 -303% | 3.4 11% | 8.3 -118% | 5.5 -45% |
| Greyscale dE 2000 * | 2.5 | 1.3 48% | 4.5 -80% | 6.8 -172% | 1.6 36% | 6 -140% | 2.6 -4% |
| Gamma | 2.37 93% | 2.21 100% | 2.39 92% | 2.23 99% | 2.13 103% | 2.27 97% | 2.23 99% |
| CCT | 6779 96% | 6667 97% | 7194 90% | 7866 83% | 6435 101% | 7996 81% | 6843 95% |
| Color Space (Percent of AdobeRGB 1998) (%) | 63.1 | 81.57 | 67.74 | 88.14 | |||
| Color Space (Percent of sRGB) (%) | 99.83 | 99.87 | 99.05 | 100 |
* ... smaller is better
Screen Flickering / PWM (Pulse-Width Modulation)
| Screen flickering / PWM not detected | 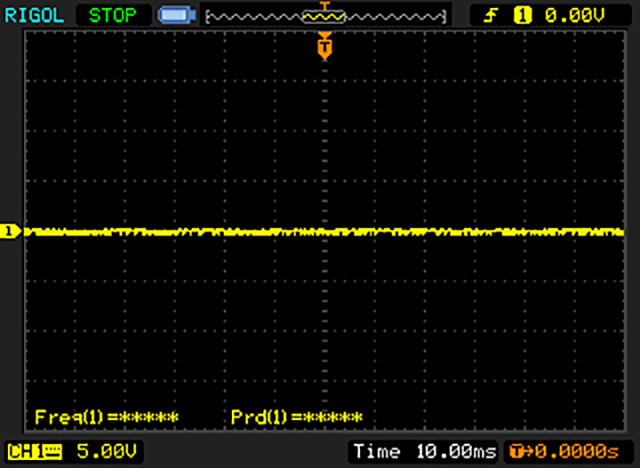 | ||
In comparison: 53 % of all tested devices do not use PWM to dim the display. If PWM was detected, an average of 8167 (minimum: 5 - maximum: 343500) Hz was measured. | |||
Display Response Times
| ↔ Response Time Black to White | ||
|---|---|---|
| 17.6 ms ... rise ↗ and fall ↘ combined | ↗ 5.2 ms rise | 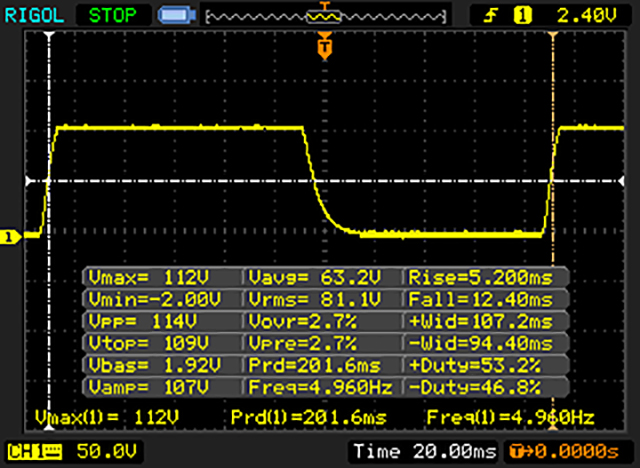 |
| ↘ 12.4 ms fall | ||
| The screen shows good response rates in our tests, but may be too slow for competitive gamers. In comparison, all tested devices range from 0.1 (minimum) to 240 (maximum) ms. » 38 % of all devices are better. This means that the measured response time is better than the average of all tested devices (20.3 ms). | ||
| ↔ Response Time 50% Grey to 80% Grey | ||
| 38 ms ... rise ↗ and fall ↘ combined | ↗ 17.6 ms rise | 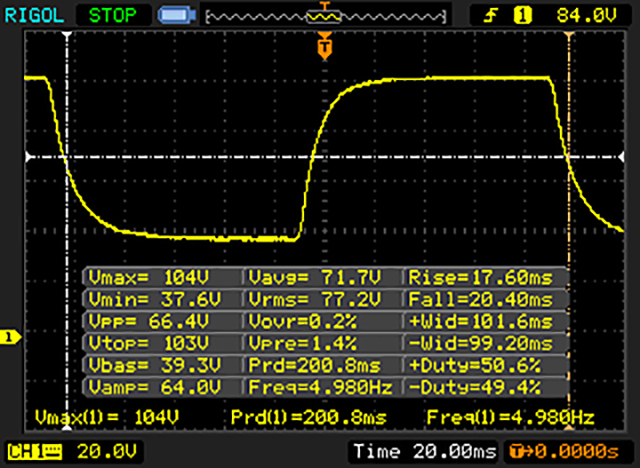 |
| ↘ 20.4 ms fall | ||
| The screen shows slow response rates in our tests and will be unsatisfactory for gamers. In comparison, all tested devices range from 0.165 (minimum) to 636 (maximum) ms. » 54 % of all devices are better. This means that the measured response time is worse than the average of all tested devices (31.7 ms). | ||
| AnTuTu v6 - Total Score (sort by value) | |
| Huawei P10 Plus | |
| Apple iPhone 7 Plus | |
| Huawei P10 | |
| OnePlus 3T | |
| Samsung Galaxy S8 Plus | |
| LG G6 | |
| Lenovo Moto Z | |
| Geekbench 4.4 | |
| 64 Bit Single-Core Score (sort by value) | |
| Huawei P10 Plus | |
| Huawei P10 | |
| Samsung Galaxy S8 Plus | |
| LG G6 | |
| 64 Bit Multi-Core Score (sort by value) | |
| Huawei P10 Plus | |
| Huawei P10 | |
| Samsung Galaxy S8 Plus | |
| LG G6 | |
| GFXBench (DX / GLBenchmark) 2.7 | |
| T-Rex Onscreen (sort by value) | |
| Huawei P10 Plus | |
| Apple iPhone 7 Plus | |
| Huawei P10 | |
| OnePlus 3T | |
| Samsung Galaxy S8 Plus | |
| LG G6 | |
| Lenovo Moto Z | |
| 1920x1080 T-Rex Offscreen (sort by value) | |
| Huawei P10 Plus | |
| Apple iPhone 7 Plus | |
| Huawei P10 | |
| OnePlus 3T | |
| Samsung Galaxy S8 Plus | |
| LG G6 | |
| Lenovo Moto Z | |
| GFXBench 3.0 | |
| on screen Manhattan Onscreen OGL (sort by value) | |
| Huawei P10 Plus | |
| Apple iPhone 7 Plus | |
| Huawei P10 | |
| OnePlus 3T | |
| Samsung Galaxy S8 Plus | |
| LG G6 | |
| Lenovo Moto Z | |
| 1920x1080 1080p Manhattan Offscreen (sort by value) | |
| Huawei P10 Plus | |
| Apple iPhone 7 Plus | |
| Huawei P10 | |
| OnePlus 3T | |
| Samsung Galaxy S8 Plus | |
| LG G6 | |
| Lenovo Moto Z | |
| GFXBench 3.1 | |
| on screen Manhattan ES 3.1 Onscreen (sort by value) | |
| Huawei P10 Plus | |
| Apple iPhone 7 Plus | |
| Huawei P10 | |
| OnePlus 3T | |
| Samsung Galaxy S8 Plus | |
| LG G6 | |
| Lenovo Moto Z | |
| 1920x1080 Manhattan ES 3.1 Offscreen (sort by value) | |
| Huawei P10 Plus | |
| Apple iPhone 7 Plus | |
| Huawei P10 | |
| OnePlus 3T | |
| Samsung Galaxy S8 Plus | |
| LG G6 | |
| Lenovo Moto Z | |
| PCMark for Android - Work performance score (sort by value) | |
| Huawei P10 Plus | |
| Huawei P10 | |
| OnePlus 3T | |
| Samsung Galaxy S8 Plus | |
| LG G6 | |
| Lenovo Moto Z | |
| Octane V2 - Total Score (sort by value) | |
| Huawei P10 Plus | |
| Apple iPhone 7 Plus | |
| Huawei P10 | |
| OnePlus 3T | |
| Samsung Galaxy S8 Plus | |
| LG G6 | |
| Lenovo Moto Z | |
| Mozilla Kraken 1.1 - Total (sort by value) | |
| Huawei P10 Plus | |
| Apple iPhone 7 Plus | |
| Huawei P10 | |
| OnePlus 3T | |
| Samsung Galaxy S8 Plus | |
| LG G6 | |
| Lenovo Moto Z | |
| WebXPRT 2015 - Overall (sort by value) | |
| Huawei P10 Plus | |
| Apple iPhone 7 Plus | |
| Huawei P10 | |
| OnePlus 3T | |
| Samsung Galaxy S8 Plus | |
| LG G6 | |
| Lenovo Moto Z | |
| JetStream 1.1 - Total Score (sort by value) | |
| Huawei P10 Plus | |
| Apple iPhone 7 Plus | |
| Huawei P10 | |
| OnePlus 3T | |
| Samsung Galaxy S8 Plus | |
| LG G6 | |
| Lenovo Moto Z | |
* ... smaller is better
| Huawei P10 Plus | Huawei P10 | OnePlus 3T | Samsung Galaxy S8 Plus | LG G6 | Lenovo Moto Z | |
|---|---|---|---|---|---|---|
| AndroBench 3-5 | 0% | -32% | -0% | -18% | -8% | |
| Sequential Read 256KB (MB/s) | 733 | 738 1% | 436.4 -40% | 788 8% | 428.7 -42% | 439.7 -40% |
| Sequential Write 256KB (MB/s) | 182.6 | 189.8 4% | 165.3 -9% | 194.2 6% | 122.8 -33% | 168.3 -8% |
| Random Read 4KB (MB/s) | 173.1 | 168.4 -3% | 123.6 -29% | 127.2 -27% | 95.2 -45% | 117.2 -32% |
| Random Write 4KB (MB/s) | 149.8 | 152.3 2% | 74.4 -50% | 15.27 -90% | 16.58 -89% | 74.9 -50% |
| Sequential Read 256KB SDCard (MB/s) | 54 | 54.2 0% | 71.1 32% | 77.6 44% | 78.5 45% | |
| Sequential Write 256KB SDCard (MB/s) | 33.61 | 32.19 -4% | 57.2 70% | 53.3 59% | 45.64 36% |
| Asphalt 8: Airborne | |||
| Settings | Value | ||
| high | 30 fps | ||
| very low | 30 fps | ||
| Dead Trigger 2 | |||
| Settings | Value | ||
| high | 56 fps | ||
(-) The maximum temperature on the upper side is 49.1 °C / 120 F, compared to the average of 35.2 °C / 95 F, ranging from 21.9 to 247 °C for the class Smartphone.
(±) The bottom heats up to a maximum of 44.2 °C / 112 F, compared to the average of 34 °C / 93 F
(±) In idle usage, the average temperature for the upper side is 37.7 °C / 100 F, compared to the device average of 32.9 °C / 91 F.
Huawei P10 Plus audio analysis
(±) | speaker loudness is average but good (75.6 dB)
Bass 100 - 315 Hz
(-) | nearly no bass - on average 17.3% lower than median
(±) | linearity of bass is average (12.4% delta to prev. frequency)
Mids 400 - 2000 Hz
(+) | balanced mids - only 3.1% away from median
(+) | mids are linear (6.9% delta to prev. frequency)
Highs 2 - 16 kHz
(+) | balanced highs - only 1% away from median
(+) | highs are linear (3.9% delta to prev. frequency)
Overall 100 - 16.000 Hz
(±) | linearity of overall sound is average (16.8% difference to median)
Compared to same class
» 8% of all tested devices in this class were better, 7% similar, 85% worse
» The best had a delta of 12%, average was 35%, worst was 134%
Compared to all devices tested
» 28% of all tested devices were better, 7% similar, 64% worse
» The best had a delta of 4%, average was 24%, worst was 134%
Huawei P10 audio analysis
(+) | speakers can play relatively loud (82.7 dB)
Bass 100 - 315 Hz
(-) | nearly no bass - on average 20.9% lower than median
(±) | linearity of bass is average (12.6% delta to prev. frequency)
Mids 400 - 2000 Hz
(+) | balanced mids - only 4.2% away from median
(+) | mids are linear (6% delta to prev. frequency)
Highs 2 - 16 kHz
(±) | higher highs - on average 5.5% higher than median
(+) | highs are linear (4.9% delta to prev. frequency)
Overall 100 - 16.000 Hz
(±) | linearity of overall sound is average (23.6% difference to median)
Compared to same class
» 52% of all tested devices in this class were better, 8% similar, 39% worse
» The best had a delta of 12%, average was 35%, worst was 134%
Compared to all devices tested
» 70% of all tested devices were better, 6% similar, 24% worse
» The best had a delta of 4%, average was 24%, worst was 134%
Apple iPhone 7 Plus audio analysis
(±) | speaker loudness is average but good (81.4 dB)
Bass 100 - 315 Hz
(-) | nearly no bass - on average 24.1% lower than median
(±) | linearity of bass is average (7.4% delta to prev. frequency)
Mids 400 - 2000 Hz
(+) | balanced mids - only 4.7% away from median
(±) | linearity of mids is average (7.6% delta to prev. frequency)
Highs 2 - 16 kHz
(+) | balanced highs - only 4.3% away from median
(+) | highs are linear (6.9% delta to prev. frequency)
Overall 100 - 16.000 Hz
(±) | linearity of overall sound is average (22% difference to median)
Compared to same class
» 44% of all tested devices in this class were better, 8% similar, 48% worse
» The best had a delta of 12%, average was 35%, worst was 134%
Compared to all devices tested
» 62% of all tested devices were better, 7% similar, 31% worse
» The best had a delta of 4%, average was 24%, worst was 134%
| Off / Standby | |
| Idle | |
| Load |
|
Key:
min: | |
| Huawei P10 Plus 3750 mAh | Apple iPhone 7 Plus 2915 mAh | Huawei P10 3200 mAh | OnePlus 3T 3400 mAh | Samsung Galaxy S8 Plus 3500 mAh | LG G6 3300 mAh | Lenovo Moto Z 2600 mAh | |
|---|---|---|---|---|---|---|---|
| Power Consumption | 23% | 15% | 21% | 46% | 30% | 44% | |
| Idle Minimum * (Watt) | 1.03 | 0.77 25% | 0.83 19% | 0.61 41% | 0.68 34% | 0.62 40% | 0.66 36% |
| Idle Average * (Watt) | 2.61 | 2.04 22% | 2.1 20% | 1.77 32% | 1.13 57% | 1.43 45% | 1.01 61% |
| Idle Maximum * (Watt) | 2.83 | 2.24 21% | 2.18 23% | 1.81 36% | 1.16 59% | 1.48 48% | 1.09 61% |
| Load Average * (Watt) | 7.03 | 4.69 33% | 6.57 7% | 6.67 5% | 4.69 33% | 5.52 21% | 3.97 44% |
| Load Maximum * (Watt) | 10.08 | 8.66 14% | 9.32 8% | 10.98 -9% | 5.24 48% | 10.47 -4% | 8.34 17% |
* ... smaller is better
| Huawei P10 Plus 3750 mAh | Apple iPhone 7 Plus 2915 mAh | Huawei P10 3200 mAh | OnePlus 3T 3400 mAh | Samsung Galaxy S8 Plus 3500 mAh | LG G6 3300 mAh | Lenovo Moto Z 2600 mAh | |
|---|---|---|---|---|---|---|---|
| Battery runtime | 7% | -1% | 5% | 12% | 12% | 4% | |
| Reader / Idle (h) | 27.6 | 30.6 11% | 25.7 -7% | 23.7 -14% | 26.1 -5% | 29.8 8% | 22.9 -17% |
| H.264 (h) | 12.6 | 13.6 8% | 9.7 -23% | 13.5 7% | 12.4 -2% | 13 3% | 12.1 -4% |
| WiFi v1.3 (h) | 12.7 | 9.8 -23% | 16.1 27% | 8.2 -35% | 12.3 -3% | 11.5 -9% | 6.8 -46% |
| Load (h) | 2.9 | 3.8 31% | 2.9 0% | 4.7 62% | 4.6 59% | 4.2 45% | 5.3 83% |
Pros
Cons

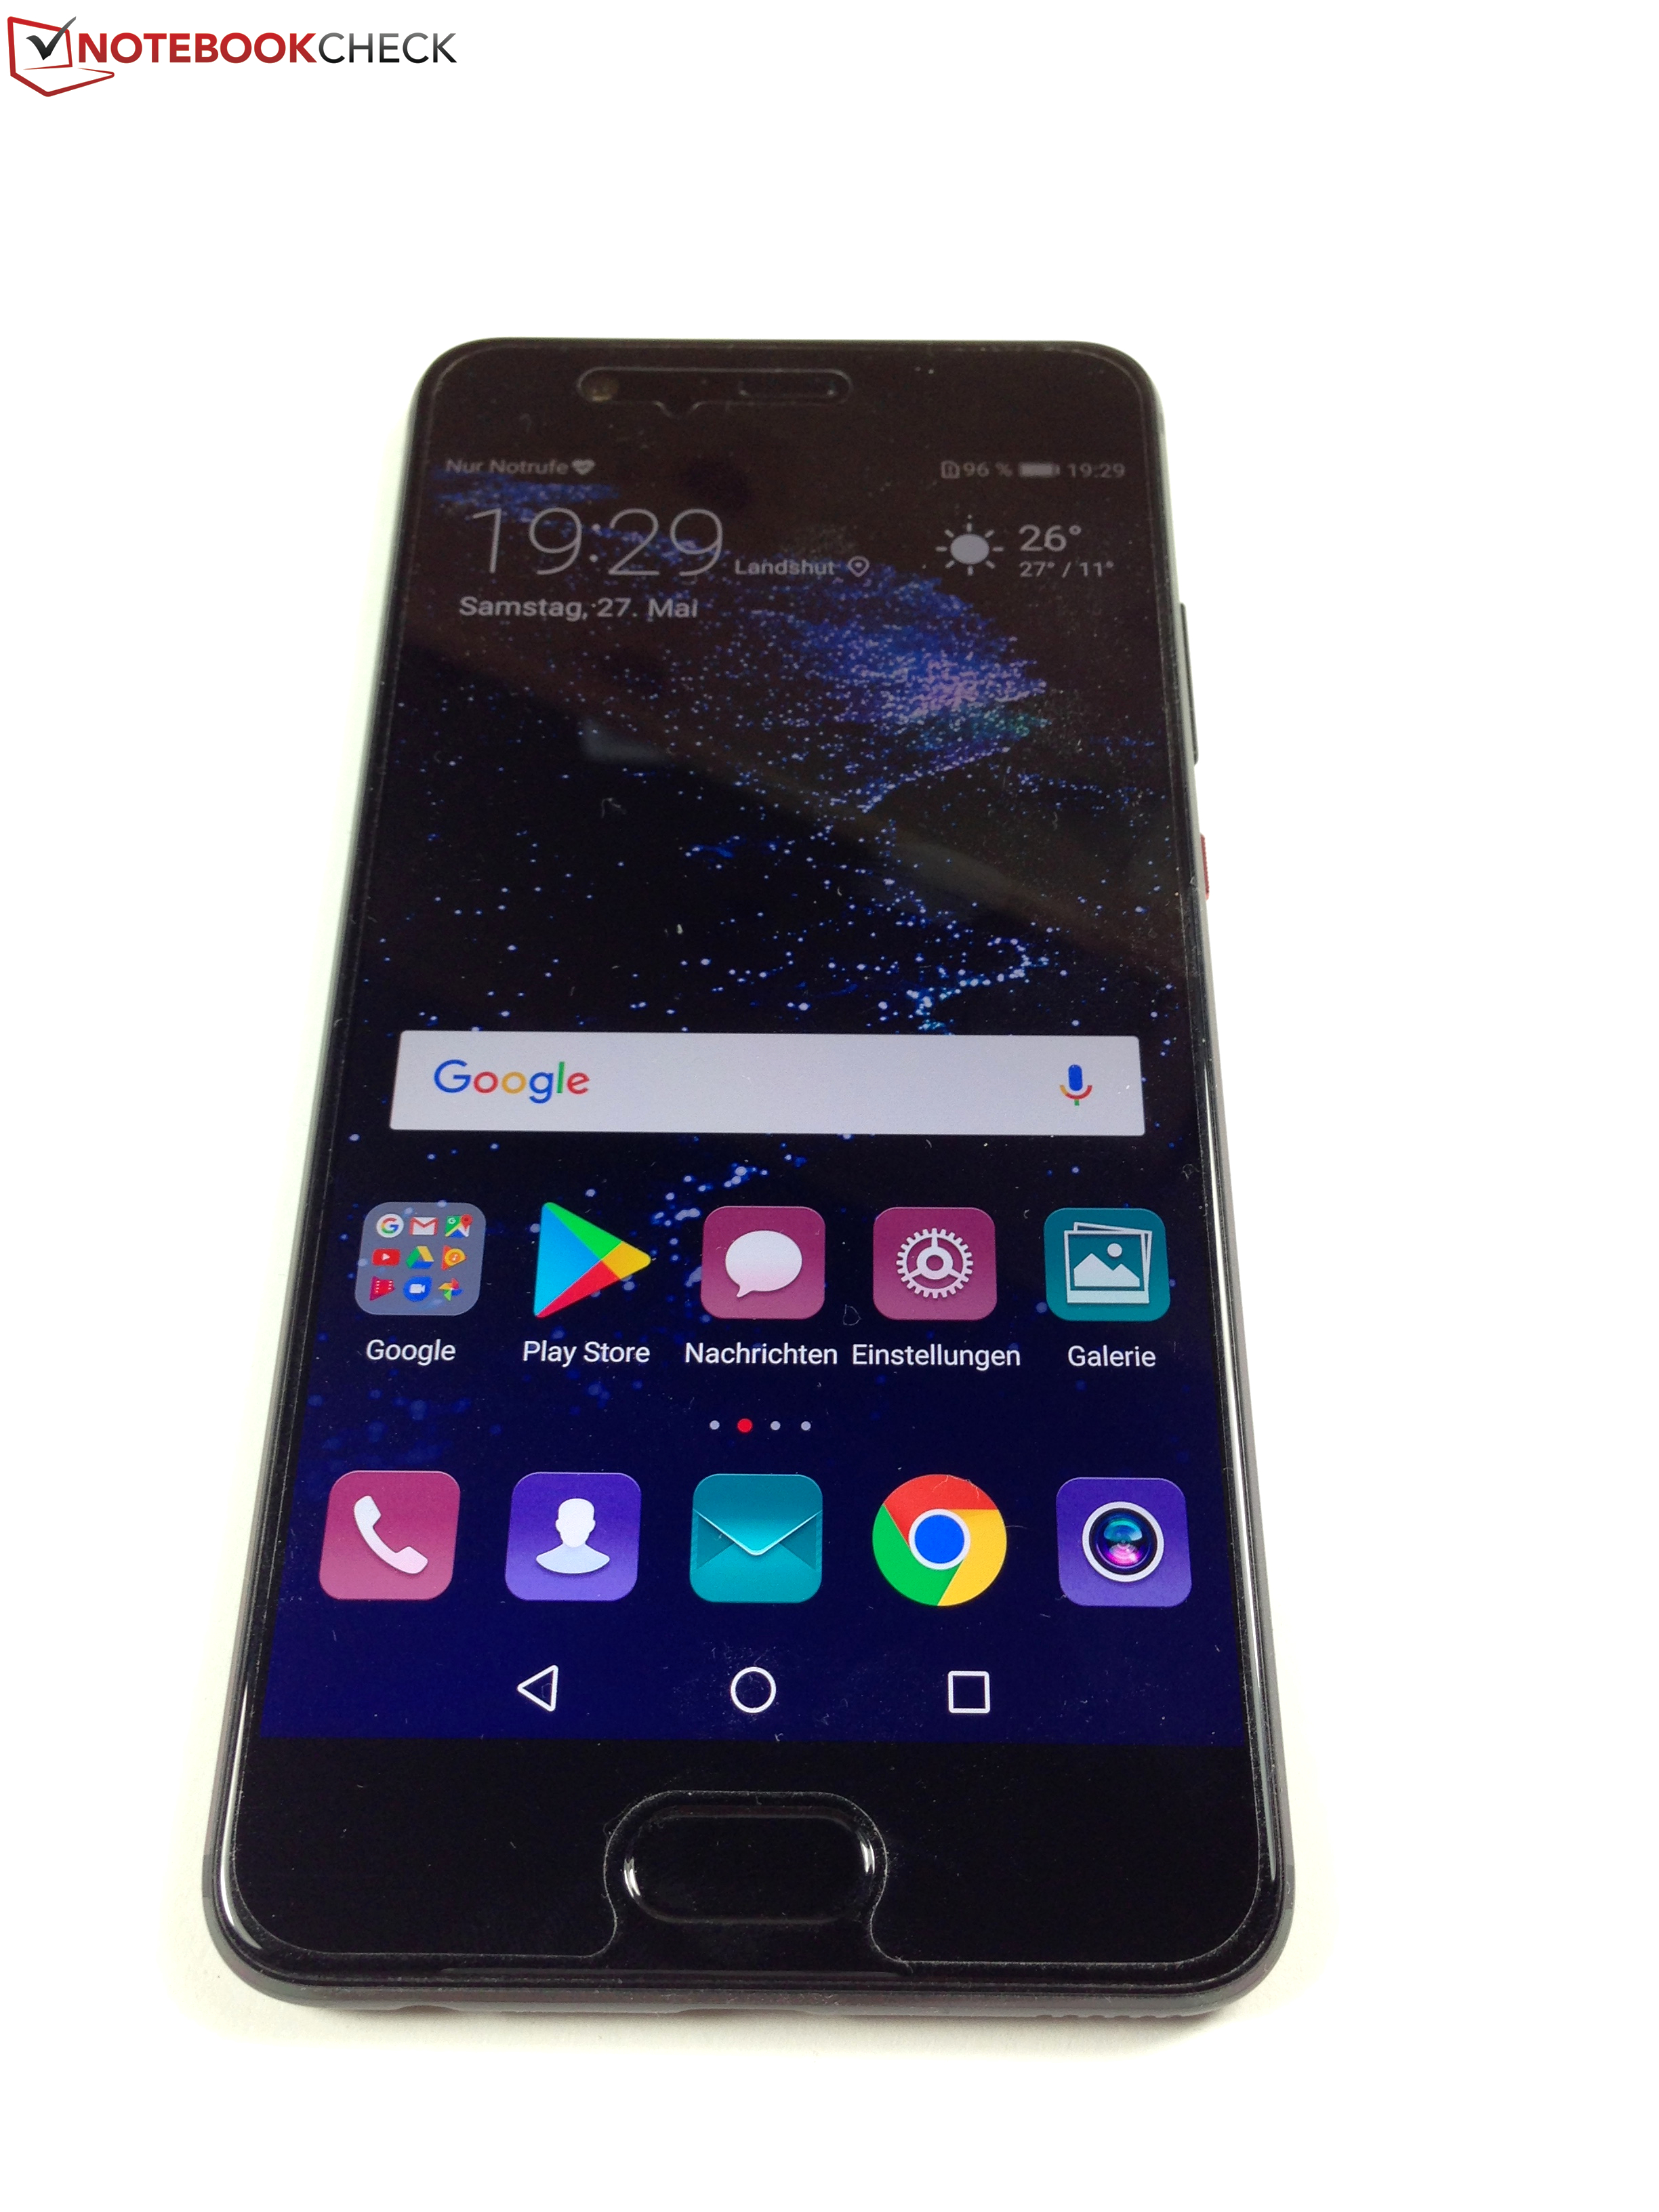
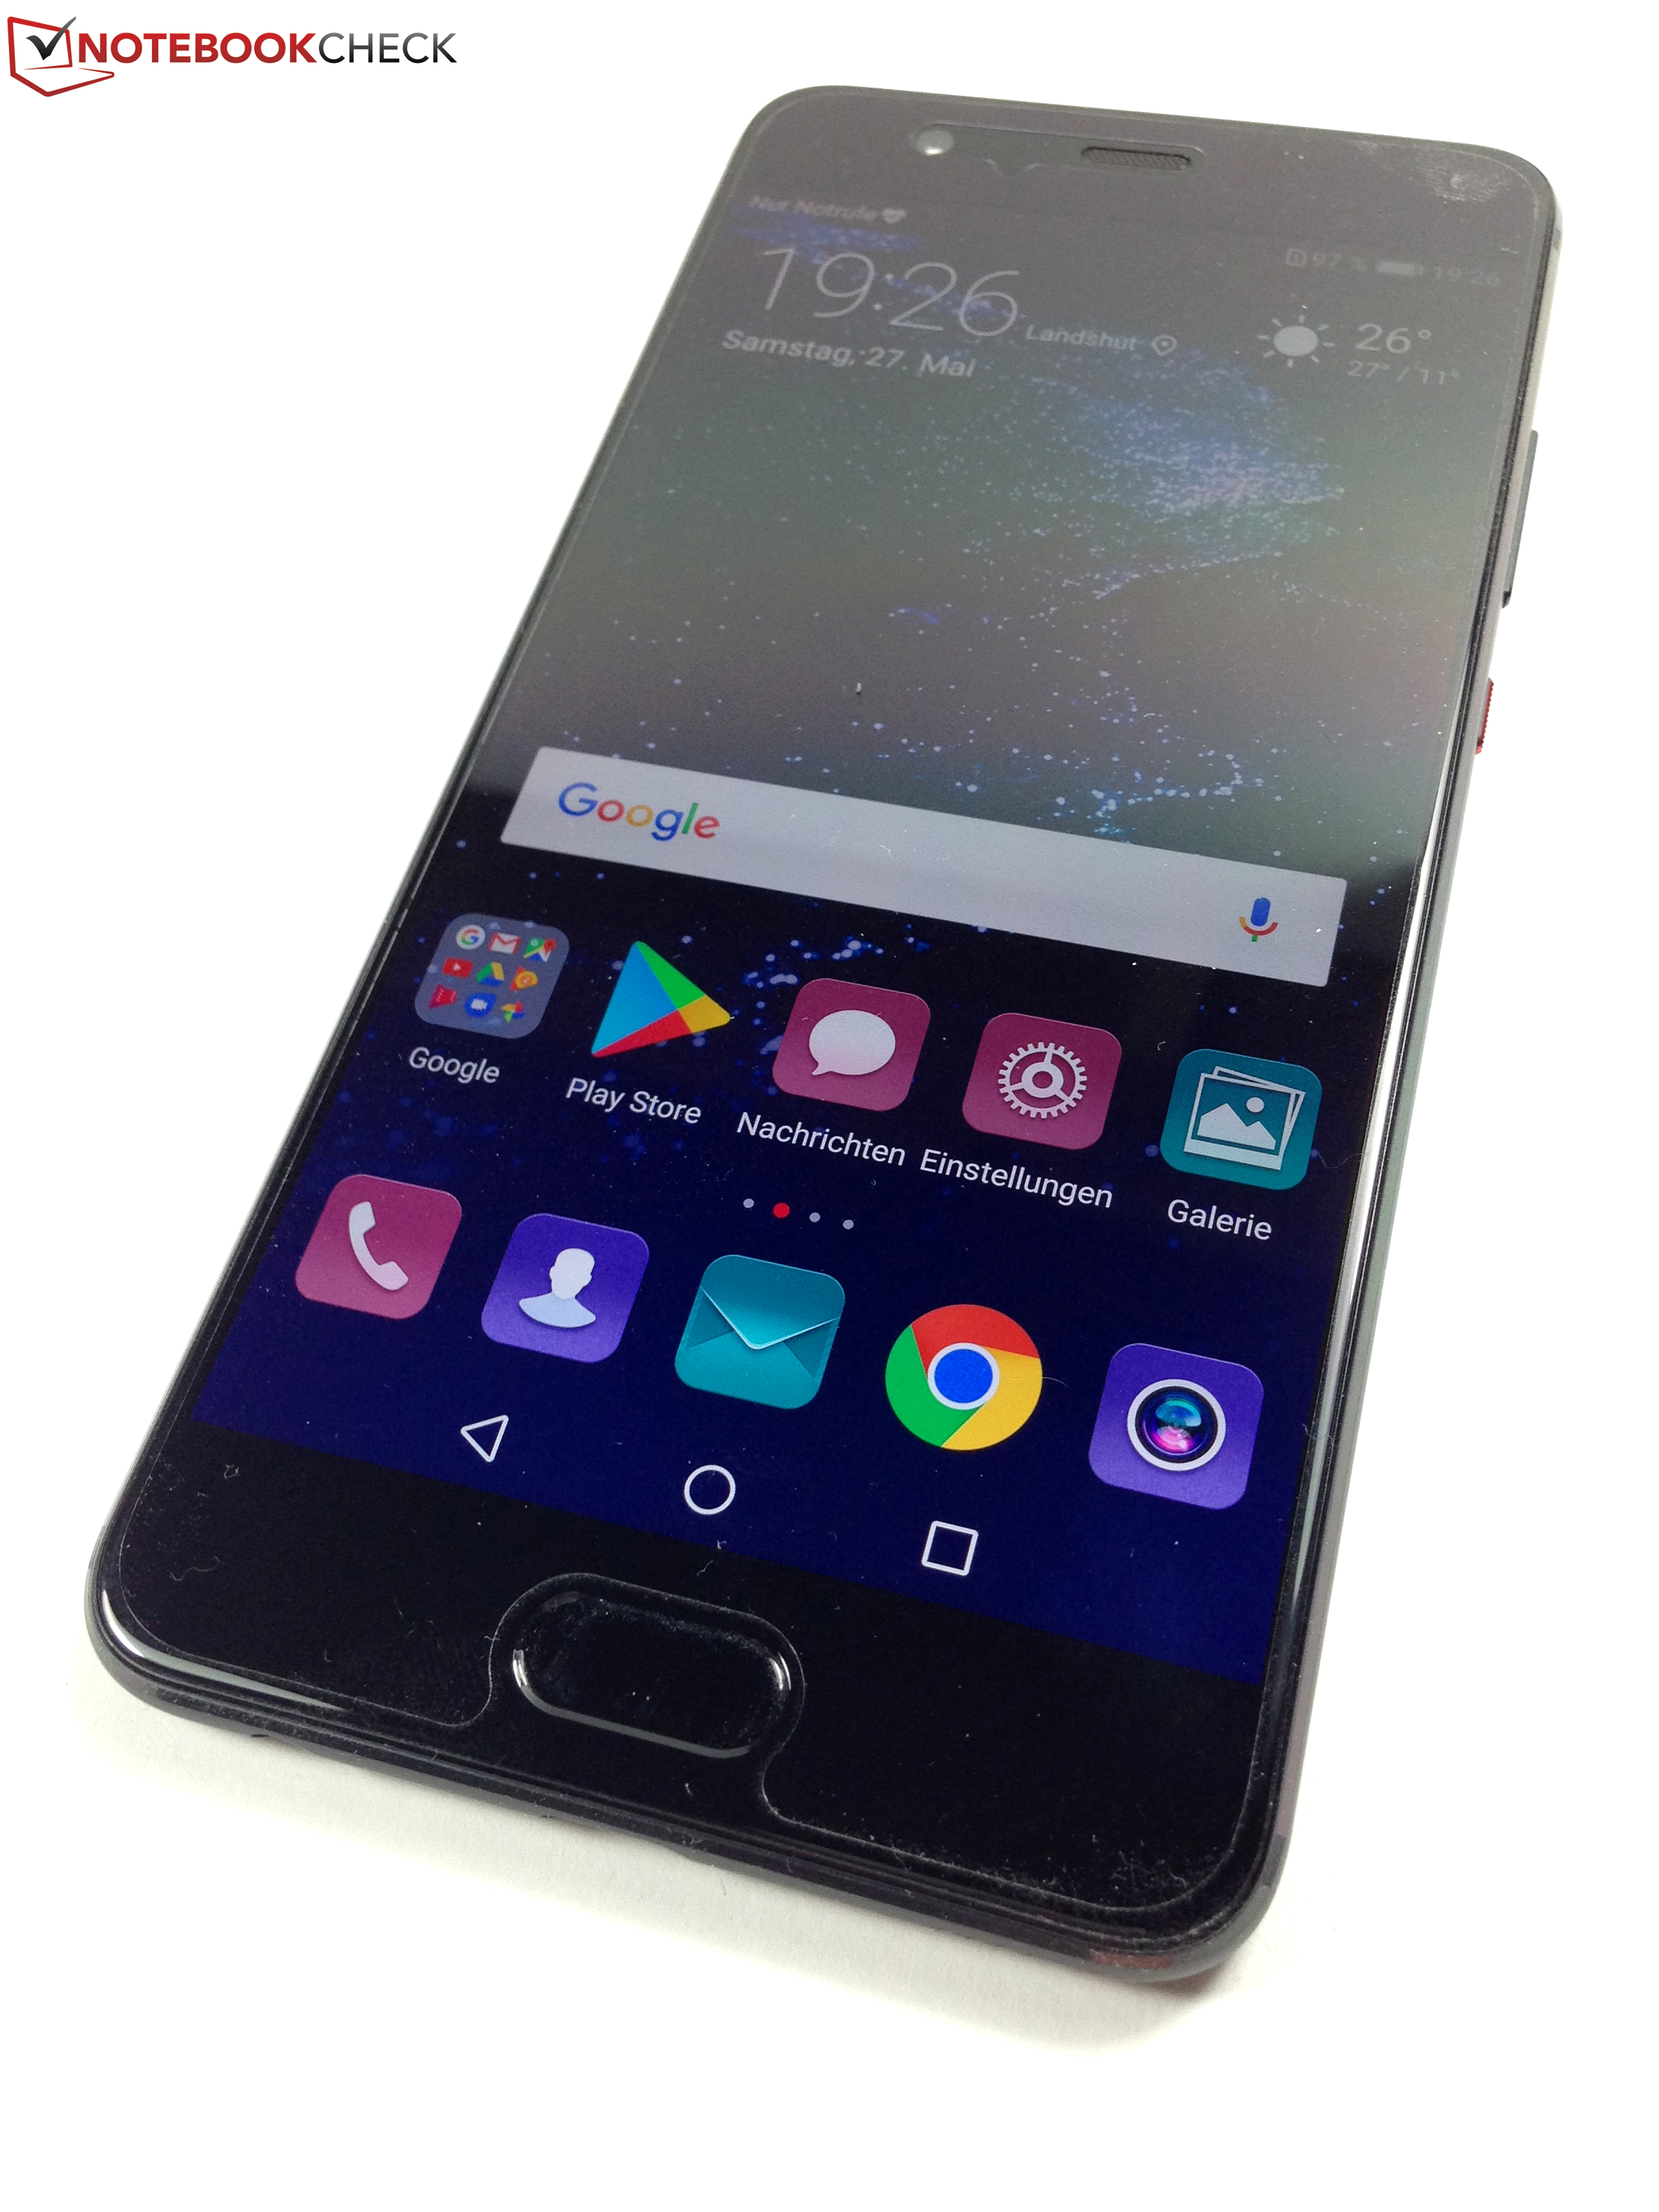
就像5.1英寸的 华为 P10 那样, 更大的5.5英寸华为P10 Plus不必接受批评。P10 Plus还配备了丰富的高端组件——从无可挑剔的机身到UFS 2.1存储和LTE Cat.12,再到高速HiSilicon Kirin 960 系统芯片。
毫无疑问,华为P10 Plus是一款优质的高端智能手机。但是,尽管华为P10配置更优,但它并没有从廉价版的华为P10中脱颖而出。
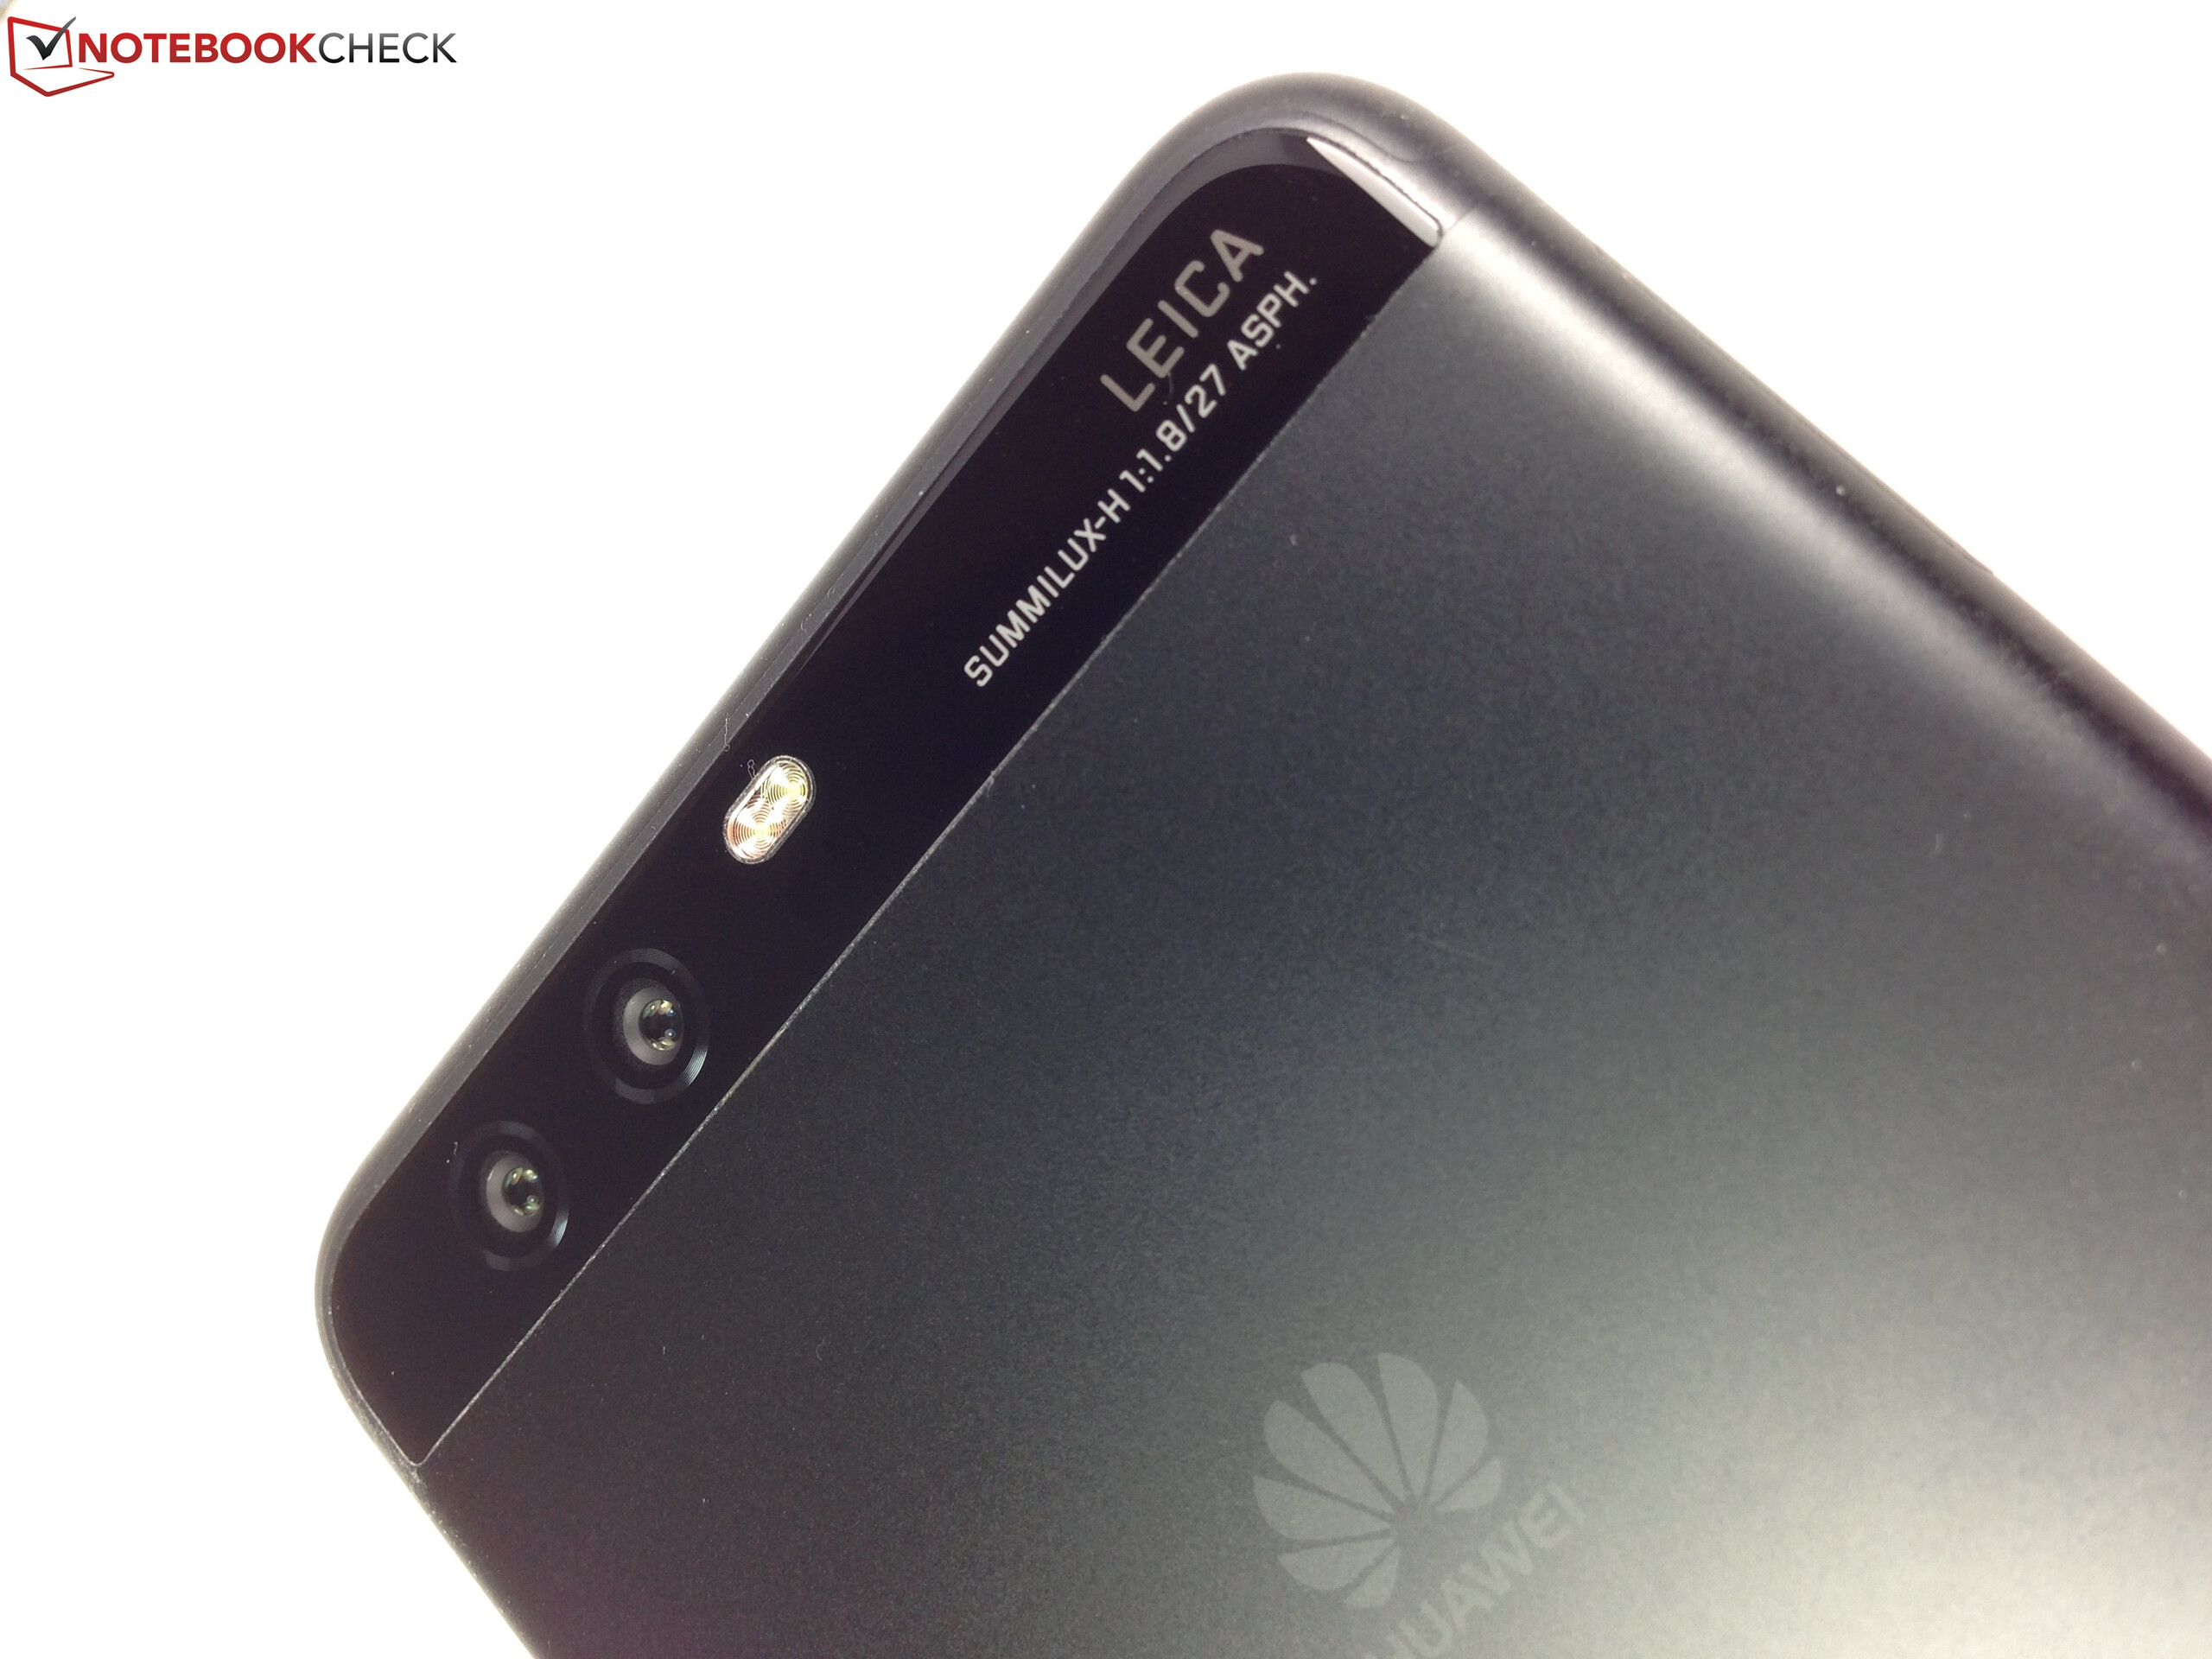
749欧元(〜700美元)的官方价格,对比600欧元(〜646美元)版本的P10,多出了一些性能。它配备了6 GB的运行内存,128 GB的存储空间,一个超高清而不是全高清分辨率的屏幕,一块更强大的电池和稍微改进的莱卡双摄像头。这些改进让P10 Plus在数据上看起来比P10更好,但在实践中并没有很明显。当忽略明显数值的增加时,性能差异不明显。
该机是不错的智能手机,但是,有着和华为 P10 一样缺点。这包括薄弱的Wi-Fi模块,缓慢的micro-SD读卡器,在负载时的节流,存储会损耗固件,以及在测试时不稳定的内存表现。这将会是一个概率游戏:用户买到的是具有快速闪存还是eMMC缓存的机器。
注:本文是基于完整评测的缩减版本,阅读完整的英文评测,请点击这里。
Huawei P10 Plus
- 06/06/2017 v6 (old)
Manuel Masiero