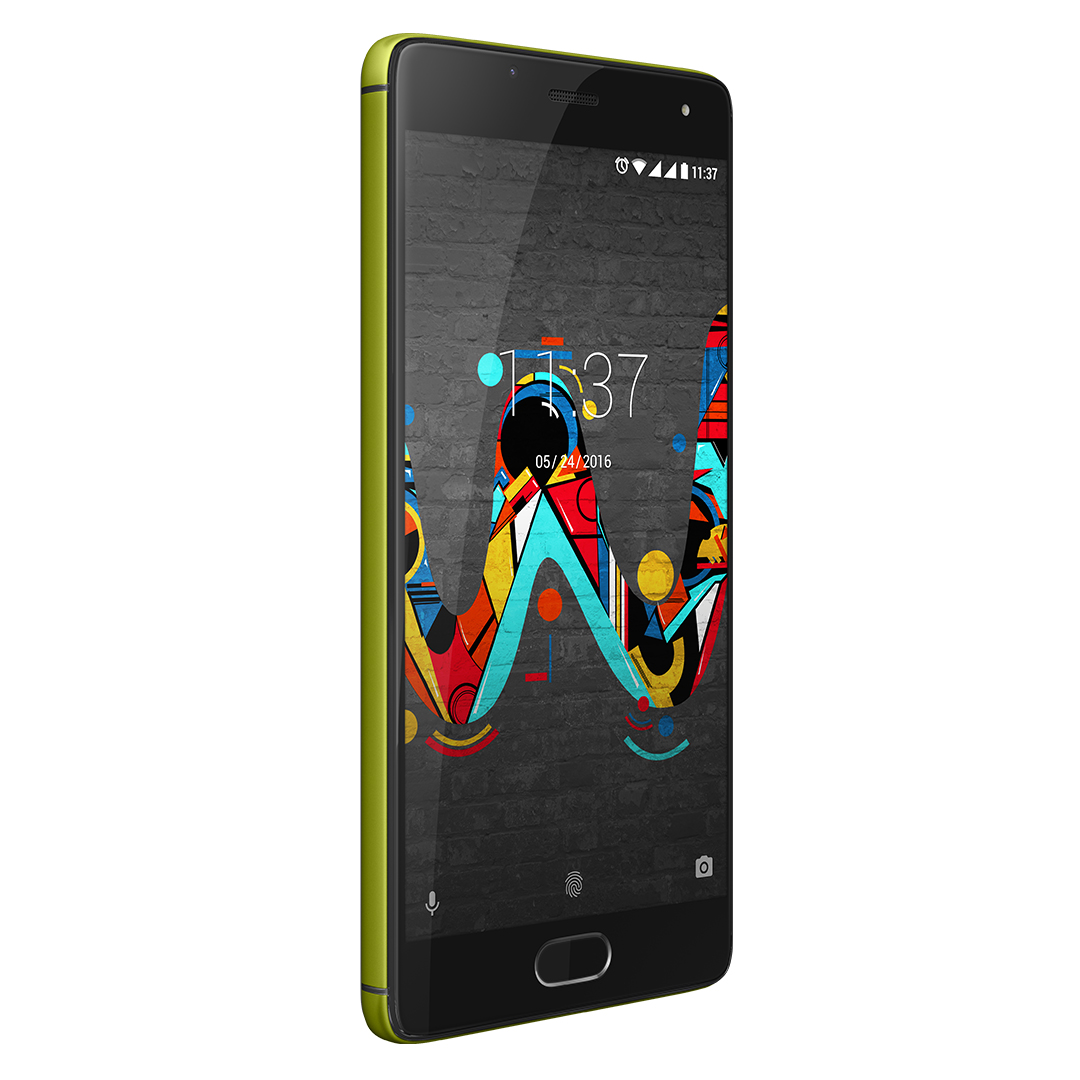
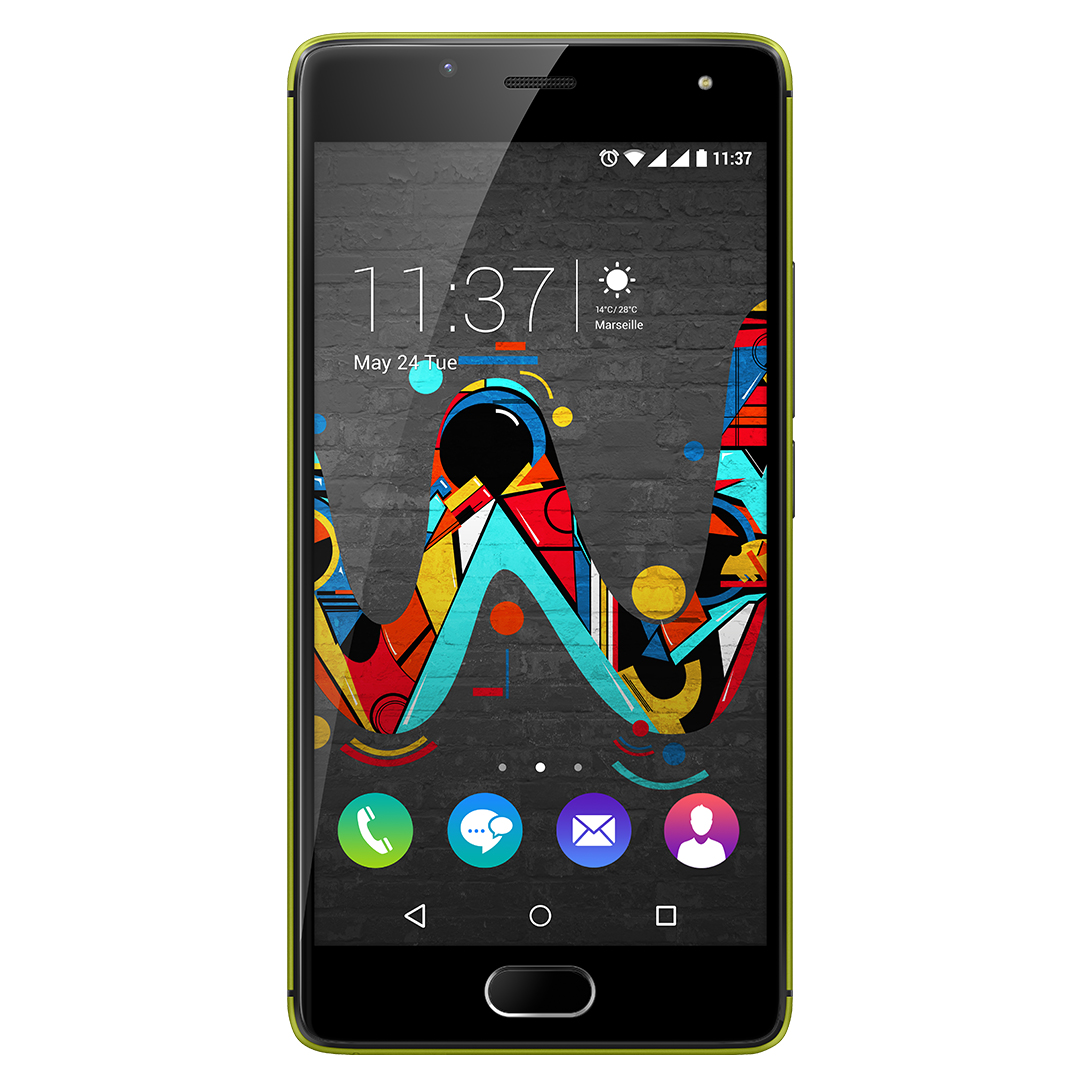
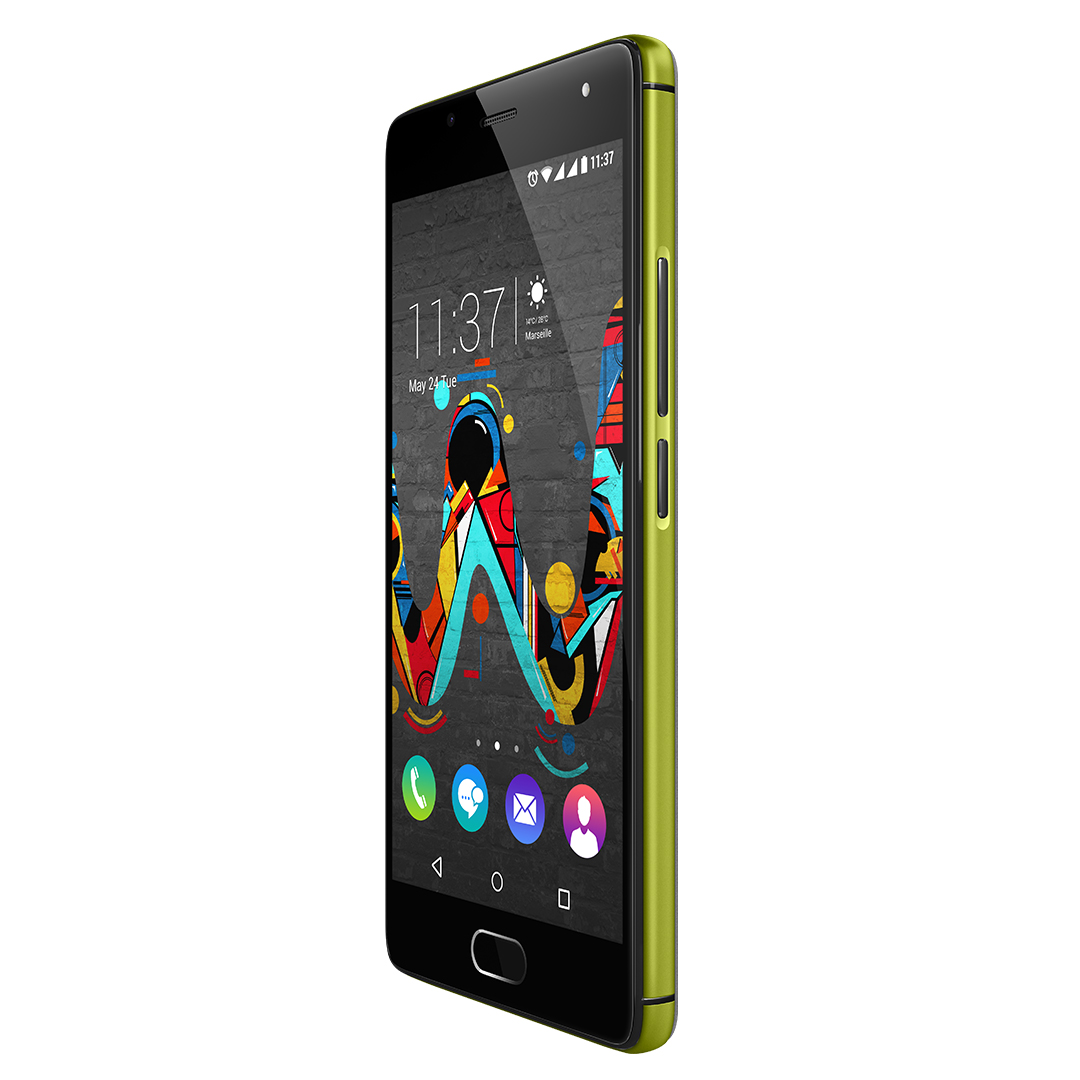
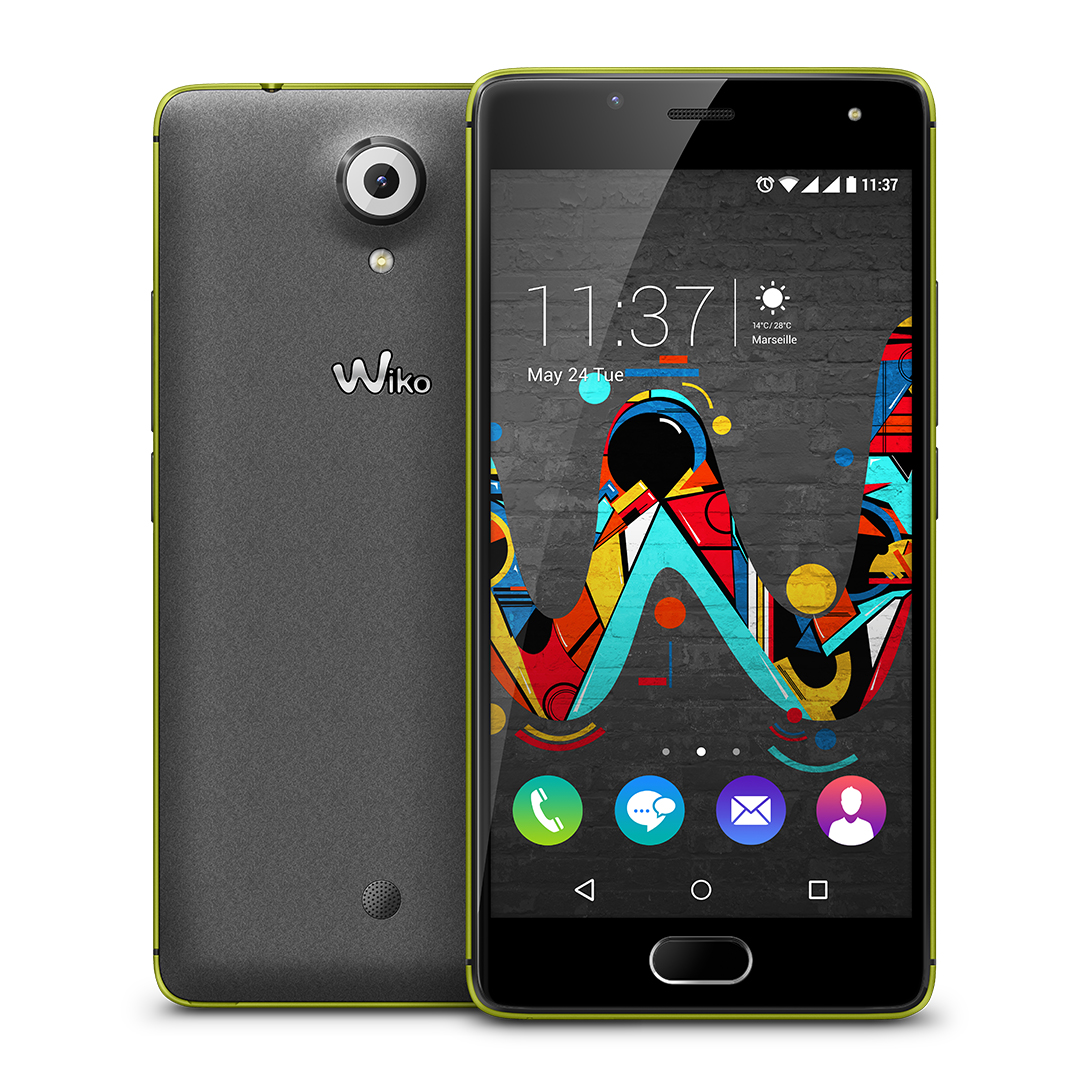
Wiko U Feel 智能手机简短评测
| SD Card Reader | |
| maximum SDCardreader Maximum Transfer Rate | |
| average SDCardreader Average Transfer Rate |
| Networking | |
| iperf Server (receive) TCP 1 m | |
| Honor 5C | |
| Wiko U Feel | |
| iperf Client (transmit) TCP 1 m | |
| Honor 5C | |
| Wiko U Feel | |


Screen Flickering / PWM (Pulse-Width Modulation)
| Screen flickering / PWM not detected |  | ||
In comparison: 52 % of all tested devices do not use PWM to dim the display. If PWM was detected, an average of 7757 (minimum: 5 - maximum: 343500) Hz was measured. | |||
| |||||||||||||||||||||||||
Brightness Distribution: 83 %
Center on Battery: 500 cd/m²
Contrast: 2273:1 (Black: 0.22 cd/m²)
ΔE ColorChecker Calman: 6.3 | ∀{0.5-29.43 Ø4.71}
ΔE Greyscale Calman: 5.2 | ∀{0.09-98 Ø4.96}
Gamma: 2.17
CCT: 7536 K
| Wiko U Feel IPS, 1280x720, 5" | Honor 5C IPS, 1920x1080, 5.2" | Samsung Galaxy J5 2016 AMOLED, 1280x720, 5.2" | HTC Desire 530 IPS, 1280x720, 5" | LG X Screen IPS, 1280x720, 5" | ZTE Blade V7 IPS, 1920x1080, 5.2" | |
|---|---|---|---|---|---|---|
| Screen | -22% | 8% | -10% | -24% | -42% | |
| Brightness middle (cd/m²) | 500 | 515 3% | 289 -42% | 375 -25% | 392 -22% | 409 -18% |
| Brightness (cd/m²) | 485 | 498 3% | 291 -40% | 376 -22% | 376 -22% | 411 -15% |
| Brightness Distribution (%) | 83 | 93 12% | 96 16% | 91 10% | 90 8% | 96 16% |
| Black Level * (cd/m²) | 0.22 | 0.49 -123% | 0.32 -45% | 0.27 -23% | 0.38 -73% | |
| Contrast (:1) | 2273 | 1051 -54% | 1172 -48% | 1452 -36% | 1076 -53% | |
| Colorchecker dE 2000 * | 6.3 | 6.2 2% | 4.7 25% | 6 5% | 7.5 -19% | 9.4 -49% |
| Colorchecker dE 2000 max. * | 14.4 | 11.4 21% | 7.3 49% | 9.5 34% | 13.1 9% | 17.6 -22% |
| Greyscale dE 2000 * | 5.2 | 7.4 -42% | 3 42% | 4.5 13% | 9.9 -90% | 11.6 -123% |
| Gamma | 2.17 101% | 2.28 96% | 2.03 108% | 2.26 97% | 2.07 106% | 2.25 98% |
| CCT | 7536 86% | 8664 75% | 6291 103% | 6975 93% | 9704 67% | 9597 68% |
* ... smaller is better
Display Response Times
| ↔ Response Time Black to White | ||
|---|---|---|
| 30 ms ... rise ↗ and fall ↘ combined | ↗ 15 ms rise | 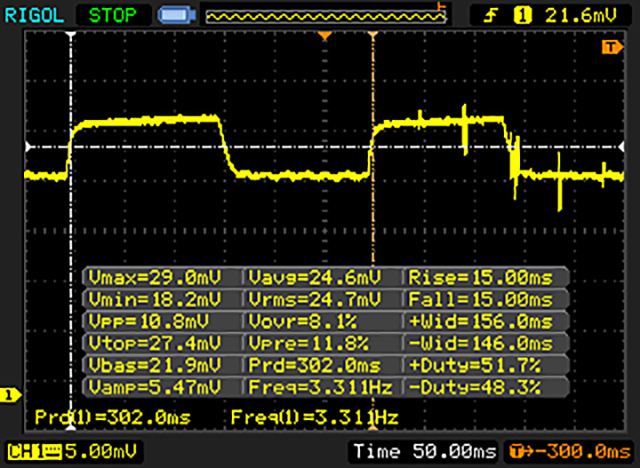 |
| ↘ 15 ms fall | ||
| The screen shows slow response rates in our tests and will be unsatisfactory for gamers. In comparison, all tested devices range from 0.1 (minimum) to 240 (maximum) ms. » 80 % of all devices are better. This means that the measured response time is worse than the average of all tested devices (19.8 ms). | ||
| ↔ Response Time 50% Grey to 80% Grey | ||
| 58 ms ... rise ↗ and fall ↘ combined | ↗ 25 ms rise | 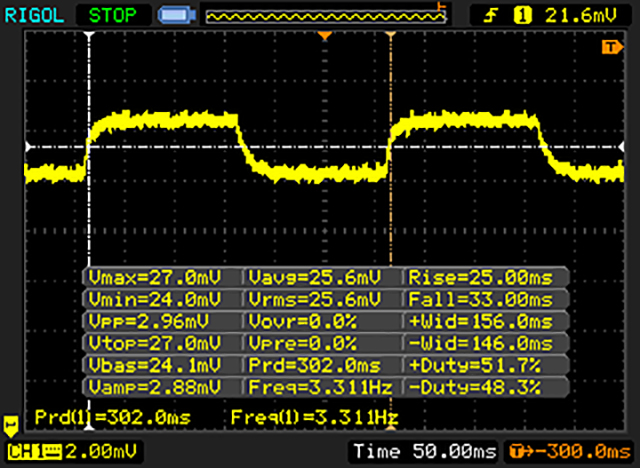 |
| ↘ 33 ms fall | ||
| The screen shows slow response rates in our tests and will be unsatisfactory for gamers. In comparison, all tested devices range from 0.165 (minimum) to 636 (maximum) ms. » 94 % of all devices are better. This means that the measured response time is worse than the average of all tested devices (31 ms). | ||
| AnTuTu v6 - Total Score | |
| Honor 5C | |
| ZTE Blade V7 | |
| Wiko U Feel | |
| Samsung Galaxy J5 2016 | |
| HTC Desire 530 | |
| LG X Screen | |
| Geekbench 3 | |
| 64 Bit Multi-Core Score | |
| Honor 5C | |
| ZTE Blade V7 | |
| LG X Screen | |
| Samsung Galaxy J5 2016 | |
| 64 Bit Single-Core Score | |
| Honor 5C | |
| ZTE Blade V7 | |
| Samsung Galaxy J5 2016 | |
| LG X Screen | |
| 32 Bit Multi-Core Score | |
| Wiko U Feel | |
| HTC Desire 530 | |
| 32 Bit Single-Core Score | |
| Wiko U Feel | |
| HTC Desire 530 | |
| 3DMark | |
| 1280x720 offscreen Ice Storm Unlimited Score | |
| Honor 5C | |
| ZTE Blade V7 | |
| Wiko U Feel | |
| Samsung Galaxy J5 2016 | |
| LG X Screen | |
| HTC Desire 530 | |
| 1280x720 offscreen Ice Storm Unlimited Graphics Score | |
| Honor 5C | |
| ZTE Blade V7 | |
| Wiko U Feel | |
| HTC Desire 530 | |
| Samsung Galaxy J5 2016 | |
| LG X Screen | |
| 1280x720 offscreen Ice Storm Unlimited Physics | |
| Honor 5C | |
| ZTE Blade V7 | |
| Wiko U Feel | |
| LG X Screen | |
| Samsung Galaxy J5 2016 | |
| HTC Desire 530 | |
| 2560x1440 Sling Shot OpenGL ES 3.0 | |
| Honor 5C | |
| ZTE Blade V7 | |
| Wiko U Feel | |
| Samsung Galaxy J5 2016 | |
| LG X Screen | |
| 2560x1440 Sling Shot OpenGL ES 3.0 Graphics | |
| Honor 5C | |
| ZTE Blade V7 | |
| Wiko U Feel | |
| Samsung Galaxy J5 2016 | |
| LG X Screen | |
| 2560x1440 Sling Shot OpenGL ES 3.0 Physics | |
| Honor 5C | |
| ZTE Blade V7 | |
| Wiko U Feel | |
| LG X Screen | |
| Samsung Galaxy J5 2016 | |
| GFXBench (DX / GLBenchmark) 2.7 | |
| T-Rex Onscreen | |
| Honor 5C | |
| Wiko U Feel | |
| ZTE Blade V7 | |
| Samsung Galaxy J5 2016 | |
| LG X Screen | |
| HTC Desire 530 | |
| 1920x1080 T-Rex Offscreen | |
| Honor 5C | |
| ZTE Blade V7 | |
| Wiko U Feel | |
| Samsung Galaxy J5 2016 | |
| LG X Screen | |
| HTC Desire 530 | |
| GFXBench 3.0 | |
| on screen Manhattan Onscreen OGL | |
| Honor 5C | |
| Wiko U Feel | |
| ZTE Blade V7 | |
| HTC Desire 530 | |
| LG X Screen | |
| Samsung Galaxy J5 2016 | |
| 1920x1080 1080p Manhattan Offscreen | |
| Honor 5C | |
| ZTE Blade V7 | |
| Wiko U Feel | |
| Samsung Galaxy J5 2016 | |
| LG X Screen | |
| HTC Desire 530 | |
| GFXBench 3.1 | |
| on screen Manhattan ES 3.1 Onscreen | |
| Honor 5C | |
| Wiko U Feel | |
| ZTE Blade V7 | |
| Samsung Galaxy J5 2016 | |
| 1920x1080 Manhattan ES 3.1 Offscreen | |
| Honor 5C | |
| ZTE Blade V7 | |
| Wiko U Feel | |
| Samsung Galaxy J5 2016 | |
| PCMark for Android - Work performance score | |
| Honor 5C | |
| Samsung Galaxy J5 2016 | |
| LG X Screen | |
| ZTE Blade V7 | |
| Wiko U Feel | |
| HTC Desire 530 | |
| Octane V2 - Total Score | |
| Honor 5C | |
| Samsung Galaxy J5 2016 | |
| Wiko U Feel | |
| ZTE Blade V7 | |
| LG X Screen | |
| HTC Desire 530 | |
| Mozilla Kraken 1.1 - Total | |
| HTC Desire 530 | |
| ZTE Blade V7 | |
| Wiko U Feel | |
| Samsung Galaxy J5 2016 | |
| LG X Screen | |
| Honor 5C | |
| JetStream 1.1 - 1.1 Total | |
| Honor 5C | |
| ZTE Blade V7 | |
| Wiko U Feel | |
| Samsung Galaxy J5 2016 | |
| LG X Screen | |
| HTC Desire 530 | |
| AndroBench 3-5 | |
| Sequential Read 256KB | |
| Honor 5C | |
| Wiko U Feel | |
| ZTE Blade V7 | |
| Samsung Galaxy J5 2016 | |
| LG X Screen | |
| HTC Desire 530 | |
| Sequential Write 256KB | |
| Honor 5C | |
| Samsung Galaxy J5 2016 | |
| LG X Screen | |
| HTC Desire 530 | |
| Wiko U Feel | |
| ZTE Blade V7 | |
| Random Read 4KB | |
| Honor 5C | |
| ZTE Blade V7 | |
| Wiko U Feel | |
| Samsung Galaxy J5 2016 | |
| HTC Desire 530 | |
| LG X Screen | |
| Random Write 4KB | |
| Honor 5C | |
| Samsung Galaxy J5 2016 | |
| HTC Desire 530 | |
| Wiko U Feel | |
| LG X Screen | |
| ZTE Blade V7 | |
* ... smaller is better
(-) The maximum temperature on the upper side is 45.4 °C / 114 F, compared to the average of 35.3 °C / 96 F, ranging from 21.9 to 247 °C for the class Smartphone.
(-) The bottom heats up to a maximum of 47.4 °C / 117 F, compared to the average of 34 °C / 93 F
(±) In idle usage, the average temperature for the upper side is 34.9 °C / 95 F, compared to the device average of 33 °C / 91 F.
Wiko U Feel audio analysis
(+) | speakers can play relatively loud (85.4 dB)
Bass 100 - 315 Hz
(-) | nearly no bass - on average 39.4% lower than median
(±) | linearity of bass is average (7.1% delta to prev. frequency)
Mids 400 - 2000 Hz
(±) | reduced mids - on average 7.2% lower than median
(±) | linearity of mids is average (8% delta to prev. frequency)
Highs 2 - 16 kHz
(+) | balanced highs - only 2.2% away from median
(+) | highs are linear (3% delta to prev. frequency)
Overall 100 - 16.000 Hz
(±) | linearity of overall sound is average (25.9% difference to median)
Compared to same class
» 66% of all tested devices in this class were better, 6% similar, 28% worse
» The best had a delta of 11%, average was 34%, worst was 134%
Compared to all devices tested
» 80% of all tested devices were better, 4% similar, 16% worse
» The best had a delta of 4%, average was 23%, worst was 134%
Honor 5C audio analysis
(+) | speakers can play relatively loud (87.9 dB)
Bass 100 - 315 Hz
(-) | nearly no bass - on average 30.9% lower than median
(±) | linearity of bass is average (8.1% delta to prev. frequency)
Mids 400 - 2000 Hz
(±) | higher mids - on average 7.1% higher than median
(±) | linearity of mids is average (8.8% delta to prev. frequency)
Highs 2 - 16 kHz
(±) | higher highs - on average 12.1% higher than median
(+) | highs are linear (2.9% delta to prev. frequency)
Overall 100 - 16.000 Hz
(-) | overall sound is not linear (31.7% difference to median)
Compared to same class
» 82% of all tested devices in this class were better, 2% similar, 16% worse
» The best had a delta of 11%, average was 34%, worst was 134%
Compared to all devices tested
» 91% of all tested devices were better, 2% similar, 8% worse
» The best had a delta of 4%, average was 23%, worst was 134%
| Off / Standby | |
| Idle | |
| Load |
|
Key:
min: | |
| Wiko U Feel 2500 mAh | Honor 5C 3000 mAh | Samsung Galaxy J5 2016 3100 mAh | HTC Desire 530 2200 mAh | ZTE Blade V7 2540 mAh | |
|---|---|---|---|---|---|
| Power Consumption | 2% | 33% | -35% | 28% | |
| Idle Minimum * (Watt) | 0.82 | 0.89 -9% | 0.61 26% | 1.58 -93% | 0.73 11% |
| Idle Average * (Watt) | 1.61 | 2.07 -29% | 1.41 12% | 2.59 -61% | 0.92 43% |
| Idle Maximum * (Watt) | 1.8 | 2.15 -19% | 1.51 16% | 2.66 -48% | 0.93 48% |
| Load Average * (Watt) | 5.99 | 3.46 42% | 2.56 57% | 5.22 13% | 4.47 25% |
| Load Maximum * (Watt) | 6.7 | 5.18 23% | 3.1 54% | 5.67 15% | 5.96 11% |
* ... smaller is better
| Wiko U Feel 2500 mAh | Honor 5C 3000 mAh | Samsung Galaxy J5 2016 3100 mAh | HTC Desire 530 2200 mAh | LG X Screen 2300 mAh | ZTE Blade V7 2540 mAh | |
|---|---|---|---|---|---|---|
| Battery runtime | ||||||
| WiFi v1.3 (h) | 9.2 | 9.7 5% | 10.7 16% | 7.1 -23% | 9.2 0% | 8.7 -5% |
Pros
Cons
整体上来说,Wiko U Feel在评测中给我们留下了好印象。我们无法在核心功能例如外壳,性能,主流智能手机的功能中找到任何明显的缺点。因此,它在竞争激烈的200欧元(约合223美金)的价位上是一个非常好的选择。
在实际使用中这台手机是十分让人享受的。Android 6.0的运行十分流畅,厂商没有对系统做出不必要的修改而且将指纹识别很好的集成进了系统中。指纹识别能够被用来解锁特定的APP或文件,或者通过传统的方式解锁(PIN,密码)。
来自法国厂商Wiko的U Feel在200欧元(约合223美金)的价位上的确是一个很好的选择,至少在你无需出色的相机的时候。尽管有着高分辨率,但成像质量依旧无法让人满意。
U Feel的缺点肯定包括有限的无线连接能力(无ac或5GHz WLAN,无NFC)以及特别糟糕的相机。尽管有着高分辨率(1300W像素),但成像质量依旧无法令我们满意。荣耀 5C有着稍好的整体配置包括更强的性能和更好的相机但它自身也存在一些问题。如果能够容忍上述缺点,那么就没有什么理由阻止购买Wiko U Feel了。
注:本文是基于完整评测的缩减版本,阅读完整的英文评测,请点击这里。
Wiko U Feel
- 09/03/2016 v5.1 (old)
Andreas Osthoff
Price comparison
