宏碁 TravelMate P648-G2 (i7, 256 GB) 笔记本电脑简短评测
| SD Card Reader | |
| average JPG Copy Test (av. of 3 runs) | |
| Dell Latitude 14 E5470 | |
| Acer TravelMate P648-G2-M-73T0 | |
| Lenovo ThinkPad T470-20HD002HGE | |
| Toshiba Tecra Z50-C-10P | |
| maximum AS SSD Seq Read Test (1GB) | |
| Dell Latitude 14 E5470 | |
| Lenovo ThinkPad T470-20HD002HGE | |
| Acer TravelMate P648-G2-M-73T0 | |
| Toshiba Tecra Z50-C-10P | |
| Networking | |
| iperf3 transmit AX12 | |
| Lenovo ThinkPad T470-20HD002HGE | |
| HP EliteBook 840 G4-Z2V49ET ABD (jseb) | |
| Acer TravelMate P648-G2-M-73T0 | |
| Dell Latitude 14 E5470 (jseb) | |
| iperf3 receive AX12 | |
| Acer TravelMate P648-G2-M-73T0 | |
| Lenovo ThinkPad T470-20HD002HGE | |
| Dell Latitude 14 E5470 (jseb) | |
| HP EliteBook 840 G4-Z2V49ET ABD (jseb) | |
| |||||||||||||||||||||||||
Brightness Distribution: 85 %
Center on Battery: 275 cd/m²
Contrast: 1100:1 (Black: 0.25 cd/m²)
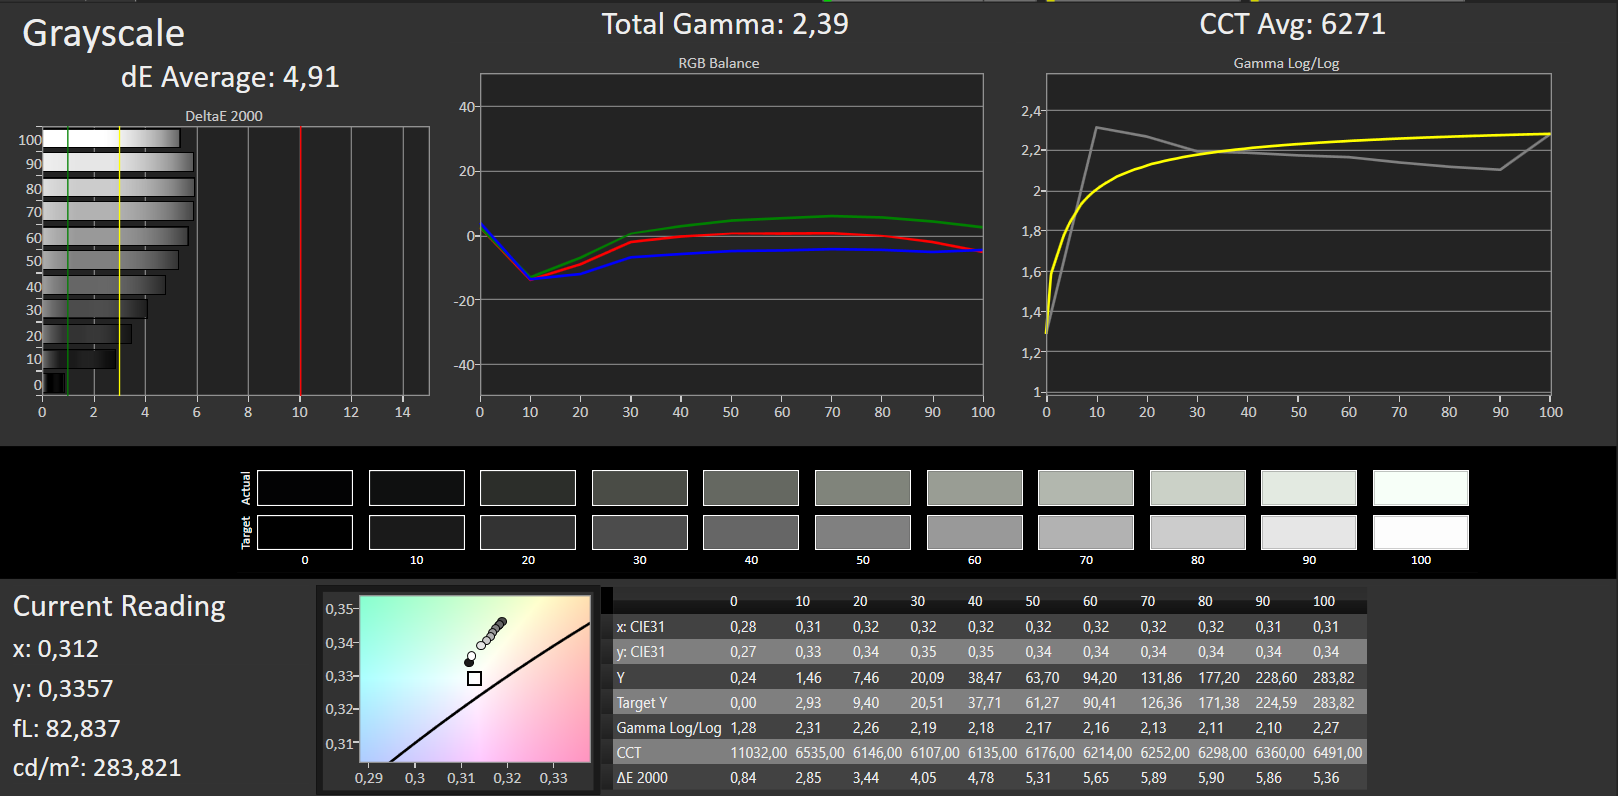
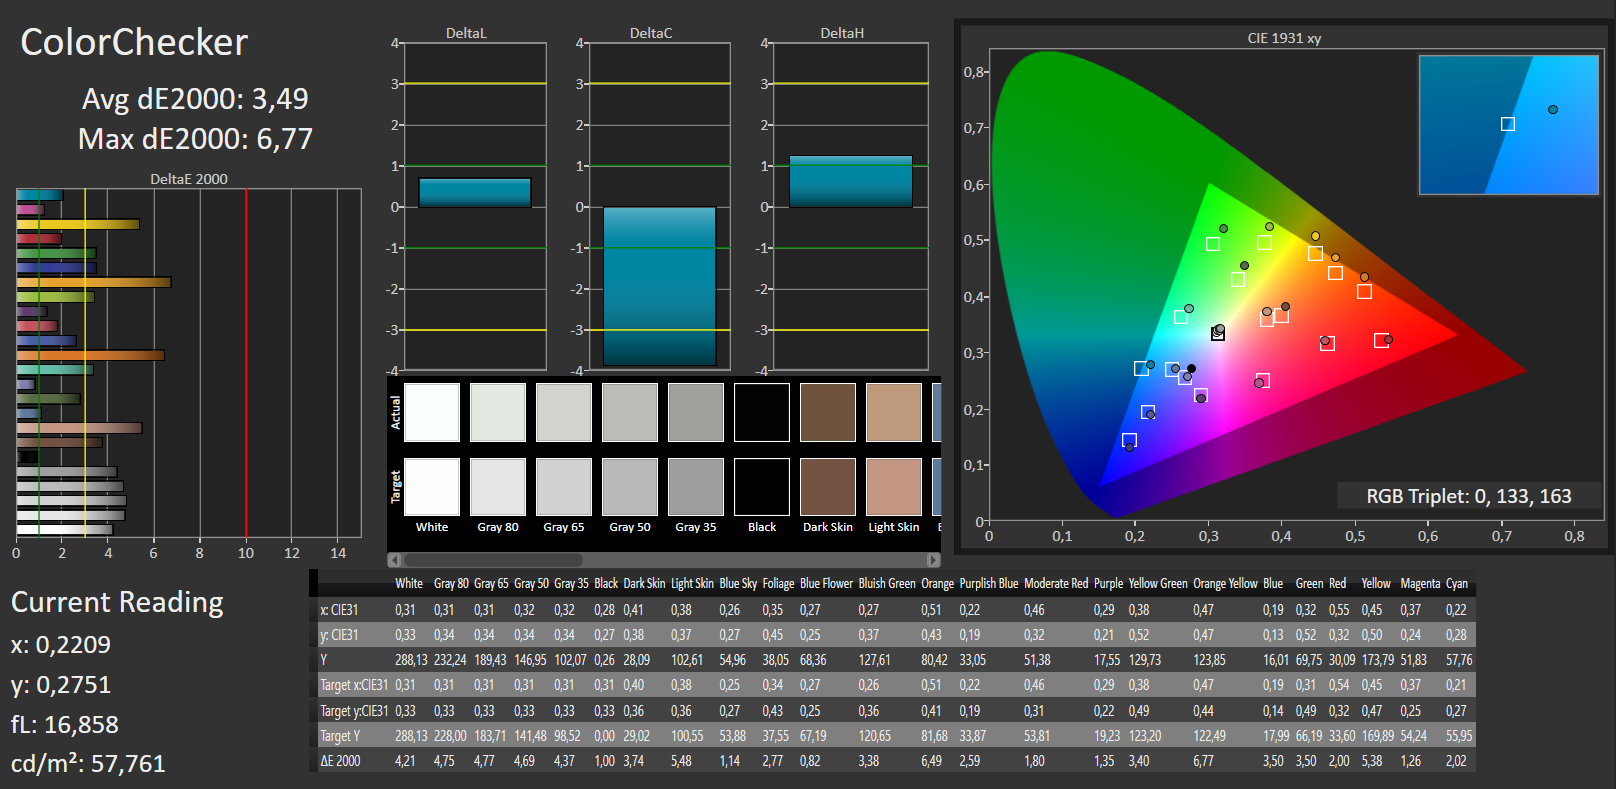
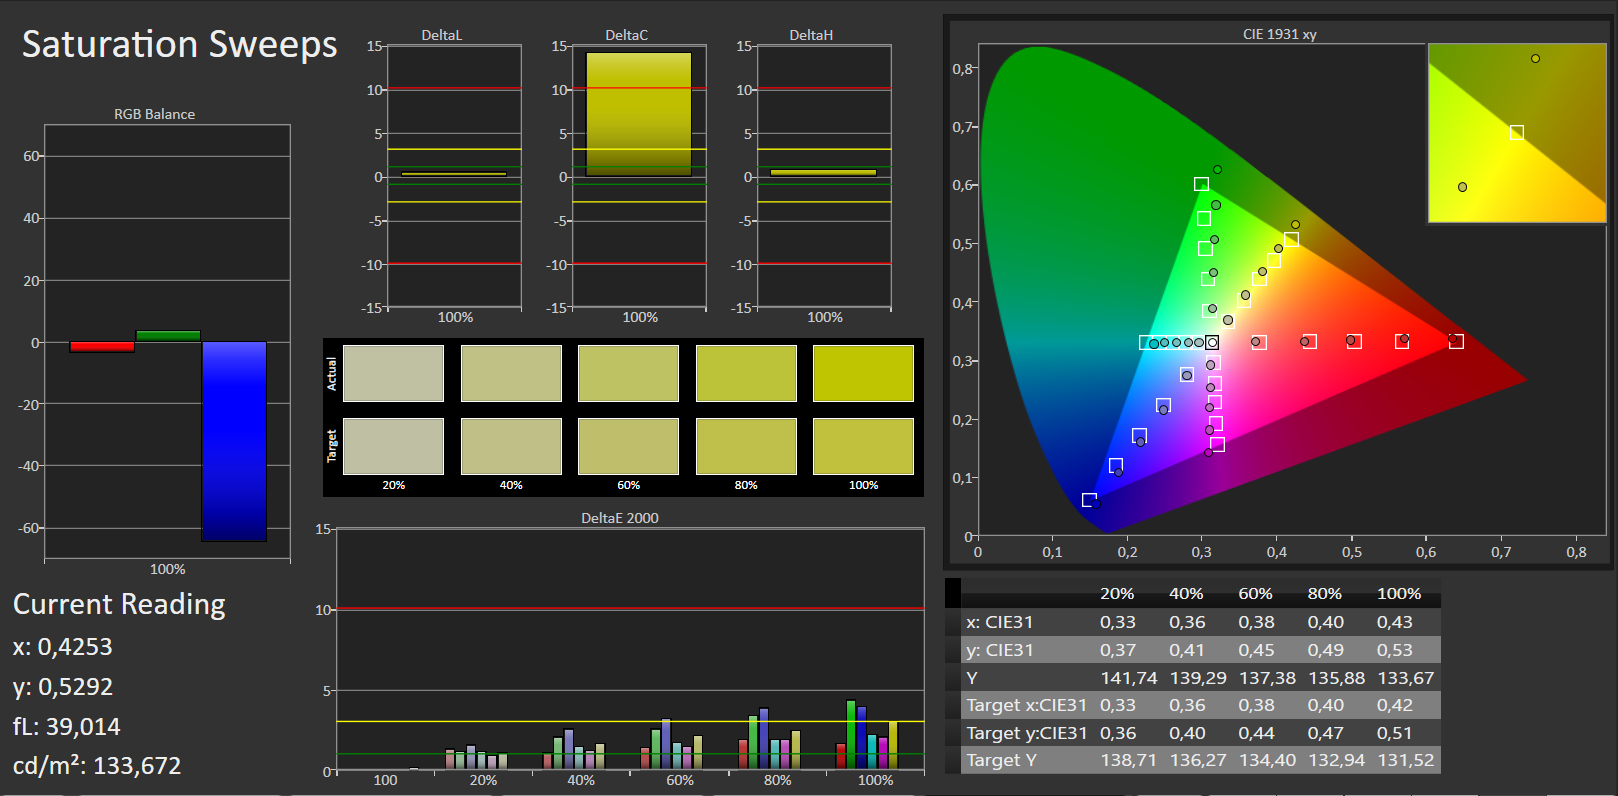
ΔE ColorChecker Calman: 3.49 | ∀{0.5-29.43 Ø4.71}
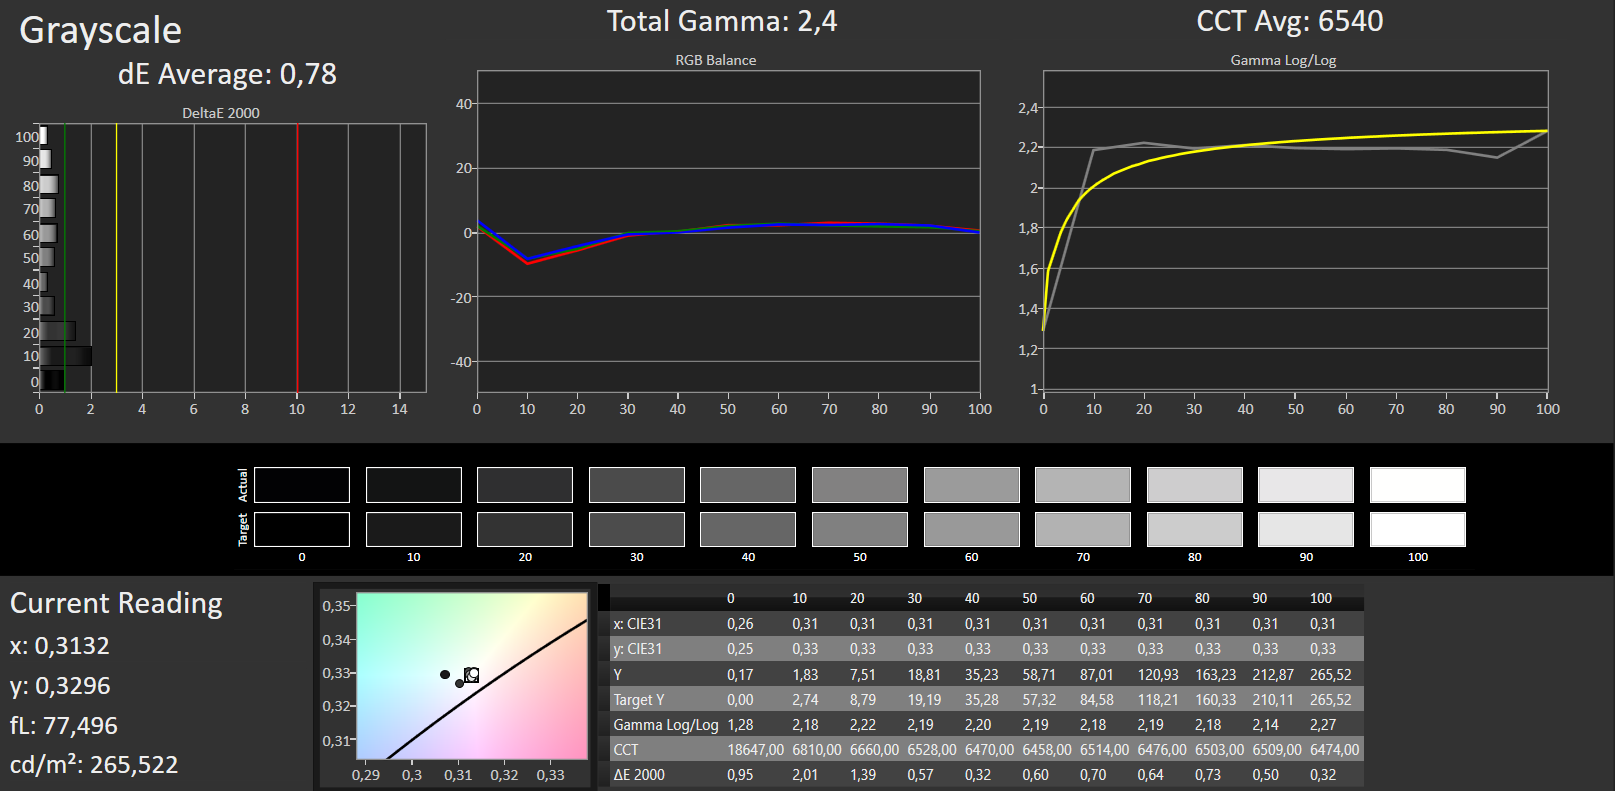
ΔE Greyscale Calman: 4.91 | ∀{0.09-98 Ø4.96}
91% sRGB (Argyll 1.6.3 3D)
59% AdobeRGB 1998 (Argyll 1.6.3 3D)
66.4% AdobeRGB 1998 (Argyll 3D)
90.8% sRGB (Argyll 3D)
67.2% Display P3 (Argyll 3D)
Gamma: 2.39
CCT: 6271 K
| Acer TravelMate P648-G2-M-73T0 1920x1080, 14" | Lenovo ThinkPad X1 Carbon 2017-20HQS03P00 B140HAN03_1, , 1920x1080, 14" | Dell Latitude 14 E5470 LP140WF3, , 1920x1080, 14" | Toshiba Tecra Z50-C-10P LP156WF6-SPP1, , 1920x1080, 15.6" | Dell Latitude 14 Rugged 5414 AU Optronics B140HAN, , 1920x1080, 14" | |
|---|---|---|---|---|---|
| Display | -7% | -6% | -6% | -42% | |
| Display P3 Coverage (%) | 67.2 | 61.4 -9% | 64.8 -4% | 65.4 -3% | 37.23 -45% |
| sRGB Coverage (%) | 90.8 | 85.9 -5% | 84.8 -7% | 84.6 -7% | 55.2 -39% |
| AdobeRGB 1998 Coverage (%) | 66.4 | 62.4 -6% | 62 -7% | 61.8 -7% | 38.48 -42% |
| Response Times | -18% | -4% | 22% | -37% | |
| Response Time Grey 50% / Grey 80% * (ms) | 38 ? | 41.6 ? -9% | 39 ? -3% | 20 ? 47% | 49 ? -29% |
| Response Time Black / White * (ms) | 25 ? | 31.6 ? -26% | 26 ? -4% | 26 ? -4% | 36 ? -44% |
| PWM Frequency (Hz) | 50 ? | 198 ? | |||
| Screen | -8% | -14% | -7% | -25% | |
| Brightness middle (cd/m²) | 275 | 311 13% | 323 17% | 288 5% | 1152 319% |
| Brightness (cd/m²) | 253 | 288 14% | 316 25% | 277 9% | 1067 322% |
| Brightness Distribution (%) | 85 | 85 0% | 79 -7% | 83 -2% | 86 1% |
| Black Level * (cd/m²) | 0.25 | 0.24 4% | 0.57 -128% | 0.27 -8% | 1.08 -332% |
| Contrast (:1) | 1100 | 1296 18% | 567 -48% | 1067 -3% | 1067 -3% |
| Colorchecker dE 2000 * | 3.49 | 5.5 -58% | 3.68 -5% | 4.7 -35% | 10.04 -188% |
| Colorchecker dE 2000 max. * | 6.77 | 9 -33% | 8.33 -23% | 11.7 -73% | 19.43 -187% |
| Greyscale dE 2000 * | 4.91 | 6.2 -26% | 2.99 39% | 3.1 37% | 10.47 -113% |
| Gamma | 2.39 92% | 2.02 109% | 2.49 88% | 2.7 81% | 2.42 91% |
| CCT | 6271 104% | 5950 109% | 6572 99% | 6603 98% | 5576 117% |
| Color Space (Percent of AdobeRGB 1998) (%) | 59 | 55.96 -5% | 55 -7% | 61.9 5% | 35 -41% |
| Color Space (Percent of sRGB) (%) | 91 | 85.77 -6% | 85 -7% | 90.3 -1% | 63 -31% |
| Total Average (Program / Settings) | -11% /
-9% | -8% /
-11% | 3% /
-3% | -35% /
-30% |
* ... smaller is better
Display Response Times
| ↔ Response Time Black to White | ||
|---|---|---|
| 25 ms ... rise ↗ and fall ↘ combined | ↗ 14 ms rise | 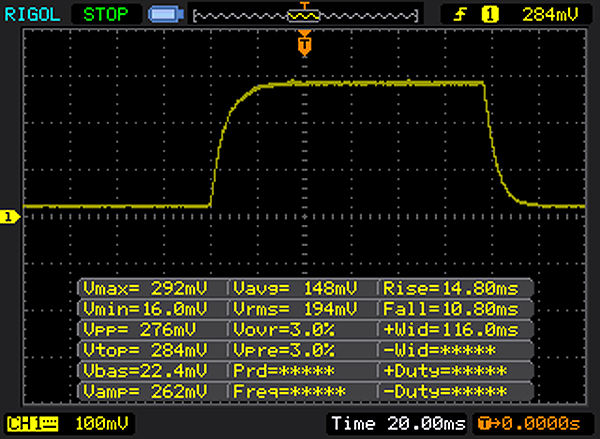 |
| ↘ 11 ms fall | ||
| The screen shows relatively slow response rates in our tests and may be too slow for gamers. In comparison, all tested devices range from 0.1 (minimum) to 240 (maximum) ms. » 59 % of all devices are better. This means that the measured response time is worse than the average of all tested devices (19.8 ms). | ||
| ↔ Response Time 50% Grey to 80% Grey | ||
| 38 ms ... rise ↗ and fall ↘ combined | ↗ 20 ms rise | 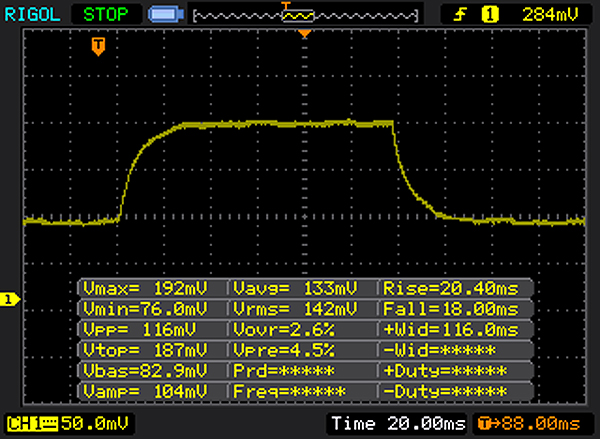 |
| ↘ 18 ms fall | ||
| The screen shows slow response rates in our tests and will be unsatisfactory for gamers. In comparison, all tested devices range from 0.165 (minimum) to 636 (maximum) ms. » 55 % of all devices are better. This means that the measured response time is worse than the average of all tested devices (31 ms). | ||
Screen Flickering / PWM (Pulse-Width Modulation)
| Screen flickering / PWM not detected | ||
In comparison: 52 % of all tested devices do not use PWM to dim the display. If PWM was detected, an average of 7757 (minimum: 5 - maximum: 343500) Hz was measured. | ||
| Cinebench R15 | |
| CPU Single 64Bit | |
| Lenovo ThinkPad X1 Carbon 2017-20HQS03P00 | |
| Acer TravelMate P648-G2-M-73T0 | |
| Dell Latitude 14 E5470 | |
| Acer TravelMate P648-M-757N | |
| Toshiba Tecra Z50-C-10P | |
| CPU Multi 64Bit | |
| Dell Latitude 14 E5470 | |
| Lenovo ThinkPad X1 Carbon 2017-20HQS03P00 | |
| Acer TravelMate P648-G2-M-73T0 | |
| Acer TravelMate P648-M-757N | |
| Toshiba Tecra Z50-C-10P | |
| PCMark 8 | |
| Home Score Accelerated v2 | |
| Lenovo ThinkPad X1 Carbon 2017-20HQS03P00 | |
| Acer TravelMate P648-G2-M-73T0 | |
| Acer TravelMate P648-M-757N | |
| Dell Latitude 14 E5470 | |
| Toshiba Tecra Z50-C-10P | |
| Work Score Accelerated v2 | |
| Lenovo ThinkPad X1 Carbon 2017-20HQS03P00 | |
| Acer TravelMate P648-G2-M-73T0 | |
| Dell Latitude 14 E5470 | |
| Acer TravelMate P648-M-757N | |
| Toshiba Tecra Z50-C-10P | |
| PCMark 8 Home Score Accelerated v2 | 3515 points | |
| PCMark 8 Work Score Accelerated v2 | 4639 points | |
Help | ||
| Acer TravelMate P648-G2-M-73T0 SK Hynix HFS256G39TND-N210A | Lenovo ThinkPad X1 Carbon 2017-20HQS03P00 Samsung PM961 NVMe MZVLW512HMJP | Dell Latitude 14 E5470 Micron SSD 1100 (MTFDDAV256TBN) | Toshiba Tecra Z50-C-10P Toshiba HG6 THNSNJ256G8NU | Acer TravelMate P648-M-757N Lite-On CV1-8B256 | |
|---|---|---|---|---|---|
| CrystalDiskMark 3.0 | 172% | -13% | 8% | -2% | |
| Read Seq (MB/s) | 518 | 1827 253% | 465.4 -10% | 512 -1% | 531 3% |
| Write Seq (MB/s) | 267.2 | 1383 418% | 363.1 36% | 415.8 56% | 358.8 34% |
| Read 512 (MB/s) | 562 | 814 45% | 338.4 -40% | 404.4 -28% | 384.8 -32% |
| Write 512 (MB/s) | 263.5 | 1098 317% | 246.1 -7% | 382.2 45% | 363 38% |
| Read 4k (MB/s) | 32.88 | 61 86% | 25.83 -21% | 24.05 -27% | 31.3 -5% |
| Write 4k (MB/s) | 85.6 | 172.2 101% | 80.3 -6% | 87.6 2% | 80.3 -6% |
| Read 4k QD32 (MB/s) | 351.3 | 601 71% | 246.1 -30% | 239.4 -32% | |
| Write 4k QD32 (MB/s) | 265.2 | 495.6 87% | 197.7 -25% | 225.3 -15% |

| 3DMark 11 - 1280x720 Performance GPU | |
| Lenovo ThinkPad X1 Carbon 2017-20HQS03P00 | |
| Acer TravelMate P648-G2-M-73T0 | |
| Dell Latitude 14 E5470 | |
| Acer TravelMate P648-M-757N | |
| Toshiba Tecra Z50-C-10P | |
| 3DMark | |
| 1280x720 Cloud Gate Standard Graphics | |
| Lenovo ThinkPad X1 Carbon 2017-20HQS03P00 | |
| Acer TravelMate P648-G2-M-73T0 | |
| Acer TravelMate P648-M-757N | |
| Dell Latitude 14 E5470 | |
| Toshiba Tecra Z50-C-10P | |
| 1920x1080 Fire Strike Graphics | |
| Lenovo ThinkPad X1 Carbon 2017-20HQS03P00 | |
| Acer TravelMate P648-G2-M-73T0 | |
| Acer TravelMate P648-M-757N | |
| Dell Latitude 14 E5470 | |
| Toshiba Tecra Z50-C-10P | |
| 3DMark 11 Performance | 1591 points | |
| 3DMark Cloud Gate Standard Score | 6159 points | |
| 3DMark Fire Strike Score | 768 points | |
Help | ||
| low | med. | high | ultra | |
|---|---|---|---|---|
| BioShock Infinite (2013) | 42.91 | 24.62 | 20.22 | 6.43 |
| Thief (2014) | 19 | 12.3 | 10.2 | 4.9 |
| Rise of the Tomb Raider (2016) | 17.09 | 9.939 | 5.216 | 3.675 |
Noise level
| Idle |
| 30.6 / 30.6 / 31 dB(A) |
| Load |
| 34.5 / 32.4 dB(A) |
 | ||
30 dB silent 40 dB(A) audible 50 dB(A) loud |
||
min: | ||
(+) The maximum temperature on the upper side is 39.1 °C / 102 F, compared to the average of 34.3 °C / 94 F, ranging from 21.2 to 62.5 °C for the class Office.
(+) The bottom heats up to a maximum of 35 °C / 95 F, compared to the average of 36.8 °C / 98 F
(+) In idle usage, the average temperature for the upper side is 26 °C / 79 F, compared to the device average of 29.5 °C / 85 F.
(+) The palmrests and touchpad are cooler than skin temperature with a maximum of 28.1 °C / 82.6 F and are therefore cool to the touch.
(±) The average temperature of the palmrest area of similar devices was 27.5 °C / 81.5 F (-0.6 °C / -1.1 F).
Acer TravelMate P648-G2-M-73T0 audio analysis
(-) | not very loud speakers (68 dB)
Bass 100 - 315 Hz
(-) | nearly no bass - on average 23.6% lower than median
(±) | linearity of bass is average (10.7% delta to prev. frequency)
Mids 400 - 2000 Hz
(+) | balanced mids - only 3.6% away from median
(±) | linearity of mids is average (9.3% delta to prev. frequency)
Highs 2 - 16 kHz
(+) | balanced highs - only 4.5% away from median
(±) | linearity of highs is average (7.8% delta to prev. frequency)
Overall 100 - 16.000 Hz
(±) | linearity of overall sound is average (26% difference to median)
Compared to same class
» 79% of all tested devices in this class were better, 7% similar, 14% worse
» The best had a delta of 7%, average was 21%, worst was 53%
Compared to all devices tested
» 80% of all tested devices were better, 4% similar, 16% worse
» The best had a delta of 4%, average was 23%, worst was 134%
Apple MacBook 12 (Early 2016) 1.1 GHz audio analysis
(+) | speakers can play relatively loud (83.6 dB)
Bass 100 - 315 Hz
(±) | reduced bass - on average 11.3% lower than median
(±) | linearity of bass is average (14.2% delta to prev. frequency)
Mids 400 - 2000 Hz
(+) | balanced mids - only 2.4% away from median
(+) | mids are linear (5.5% delta to prev. frequency)
Highs 2 - 16 kHz
(+) | balanced highs - only 2% away from median
(+) | highs are linear (4.5% delta to prev. frequency)
Overall 100 - 16.000 Hz
(+) | overall sound is linear (10.2% difference to median)
Compared to same class
» 7% of all tested devices in this class were better, 2% similar, 90% worse
» The best had a delta of 5%, average was 18%, worst was 53%
Compared to all devices tested
» 5% of all tested devices were better, 1% similar, 94% worse
» The best had a delta of 4%, average was 23%, worst was 134%
| Off / Standby | |
| Idle | |
| Load |
|
Key:
min: | |
| Acer TravelMate P648-G2-M-73T0 i7-7500U, HD Graphics 620, SK Hynix HFS256G39TND-N210A, IPS, 1920x1080, 14" | Lenovo ThinkPad X1 Carbon 2017-20HQS03P00 i7-7500U, HD Graphics 620, Samsung PM961 NVMe MZVLW512HMJP, IPS, 1920x1080, 14" | Dell Latitude 14 E5470 6440HQ, HD Graphics 530, Micron SSD 1100 (MTFDDAV256TBN), AH-IPS, WLED, 1920x1080, 14" | Toshiba Tecra Z50-C-10P 6200U, HD Graphics 520, Toshiba HG6 THNSNJ256G8NU, IPS-Panel, 1920x1080, 15.6" | Acer TravelMate P648-M-757N 6500U, HD Graphics 520, Lite-On CV1-8B256, IPS, 1920x1080, 14" | |
|---|---|---|---|---|---|
| Power Consumption | -3% | -9% | 4% | -5% | |
| Idle Minimum * (Watt) | 4.8 | 3.84 20% | 4.1 15% | 4.7 2% | 5.3 -10% |
| Idle Average * (Watt) | 7.9 | 6.3 20% | 8.1 -3% | 8 -1% | 9.3 -18% |
| Idle Maximum * (Watt) | 10.7 | 8.6 20% | 11.4 -7% | 9.8 8% | 11.5 -7% |
| Load Average * (Watt) | 35 | 41.9 -20% | 33.5 4% | 29.7 15% | 30.8 12% |
| Load Maximum * (Watt) | 31.6 | 48.7 -54% | 49 -55% | 32.6 -3% | 32 -1% |
* ... smaller is better
| Acer TravelMate P648-G2-M-73T0 i7-7500U, HD Graphics 620, 54 Wh | Lenovo ThinkPad X1 Carbon 2017-20HQS03P00 i7-7500U, HD Graphics 620, 57 Wh | Dell Latitude 14 E5470 6440HQ, HD Graphics 530, 62 Wh | Toshiba Tecra Z50-C-10P 6200U, HD Graphics 520, 44 Wh | Acer TravelMate P648-M-757N 6500U, HD Graphics 520, 54 Wh | |
|---|---|---|---|---|---|
| Battery runtime | -5% | -26% | -47% | -8% | |
| Reader / Idle (h) | 18.1 | 20.9 15% | 15.2 -16% | 18.1 0% | |
| WiFi v1.3 (h) | 11.2 | 8.3 -26% | 7.2 -36% | 5.9 -47% | 9.1 -19% |
| Load (h) | 1.9 | 1.8 -5% | 1.4 -26% | 1.8 -5% | |
| H.264 (h) | 11.9 | 6.9 | 9.1 |
Pros
Cons
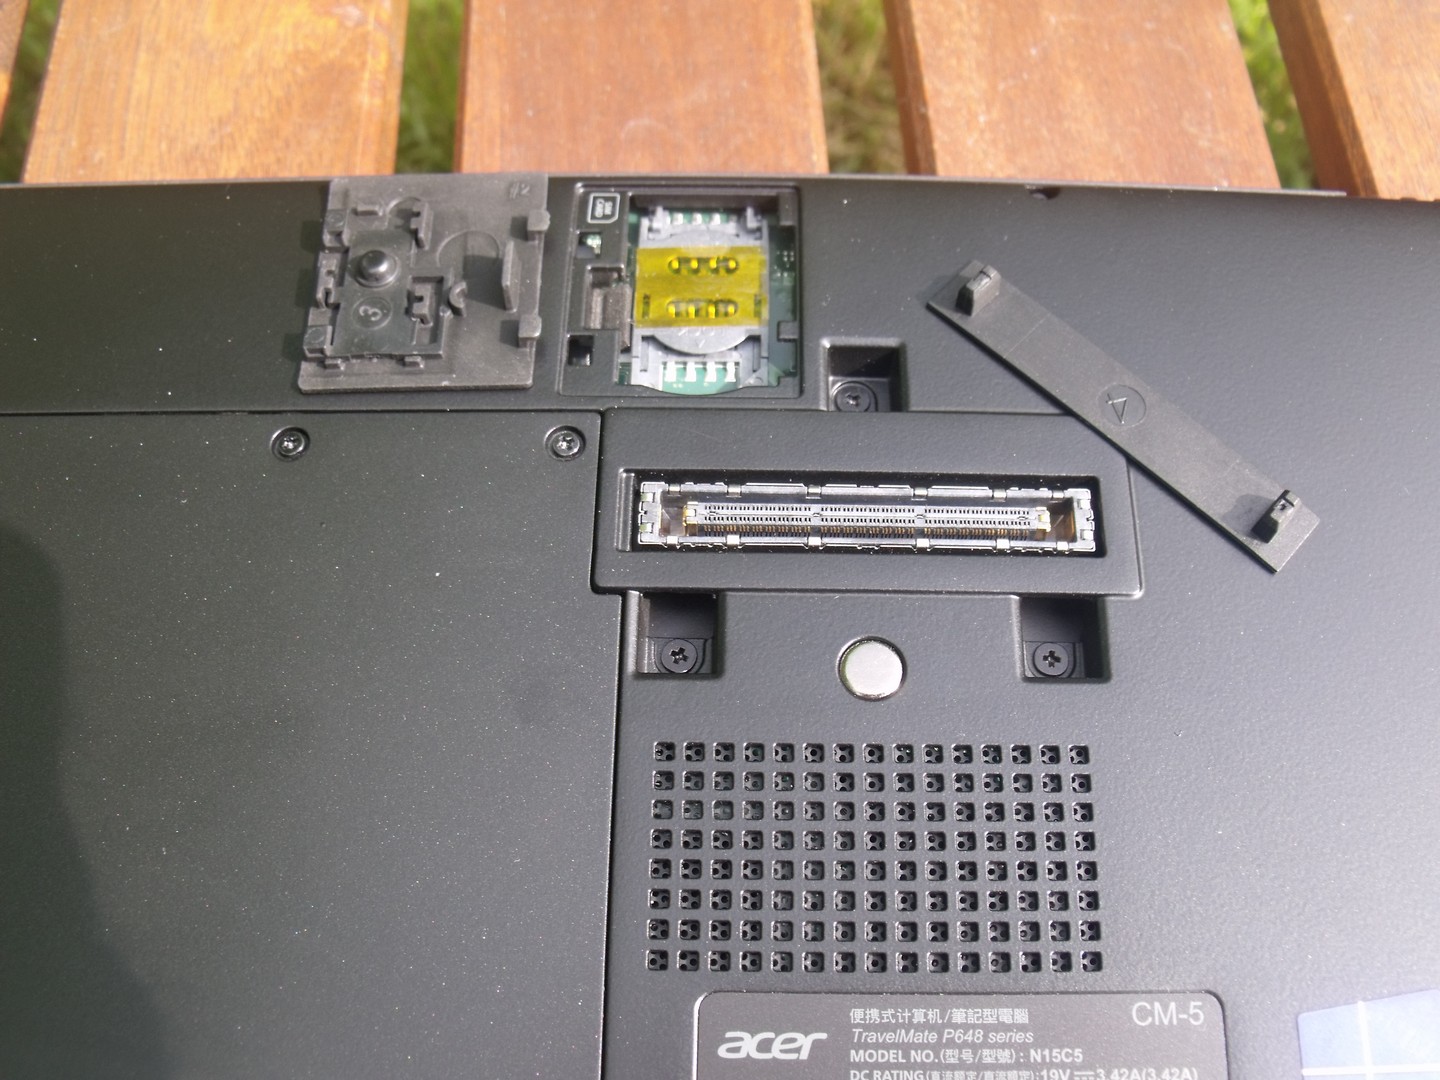
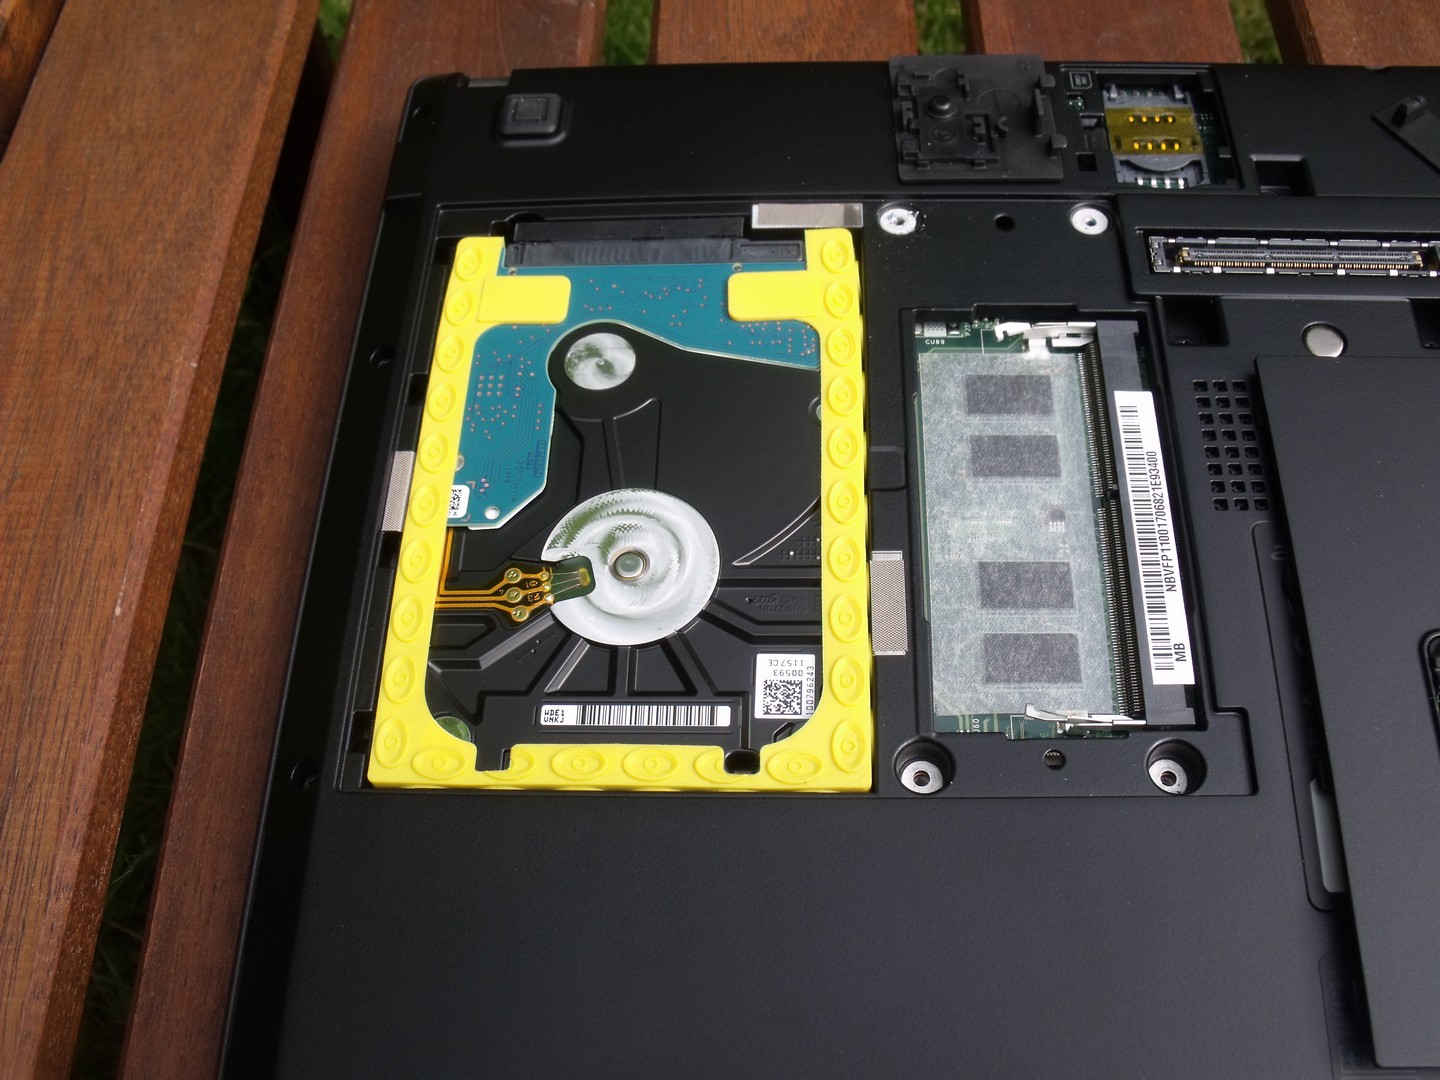
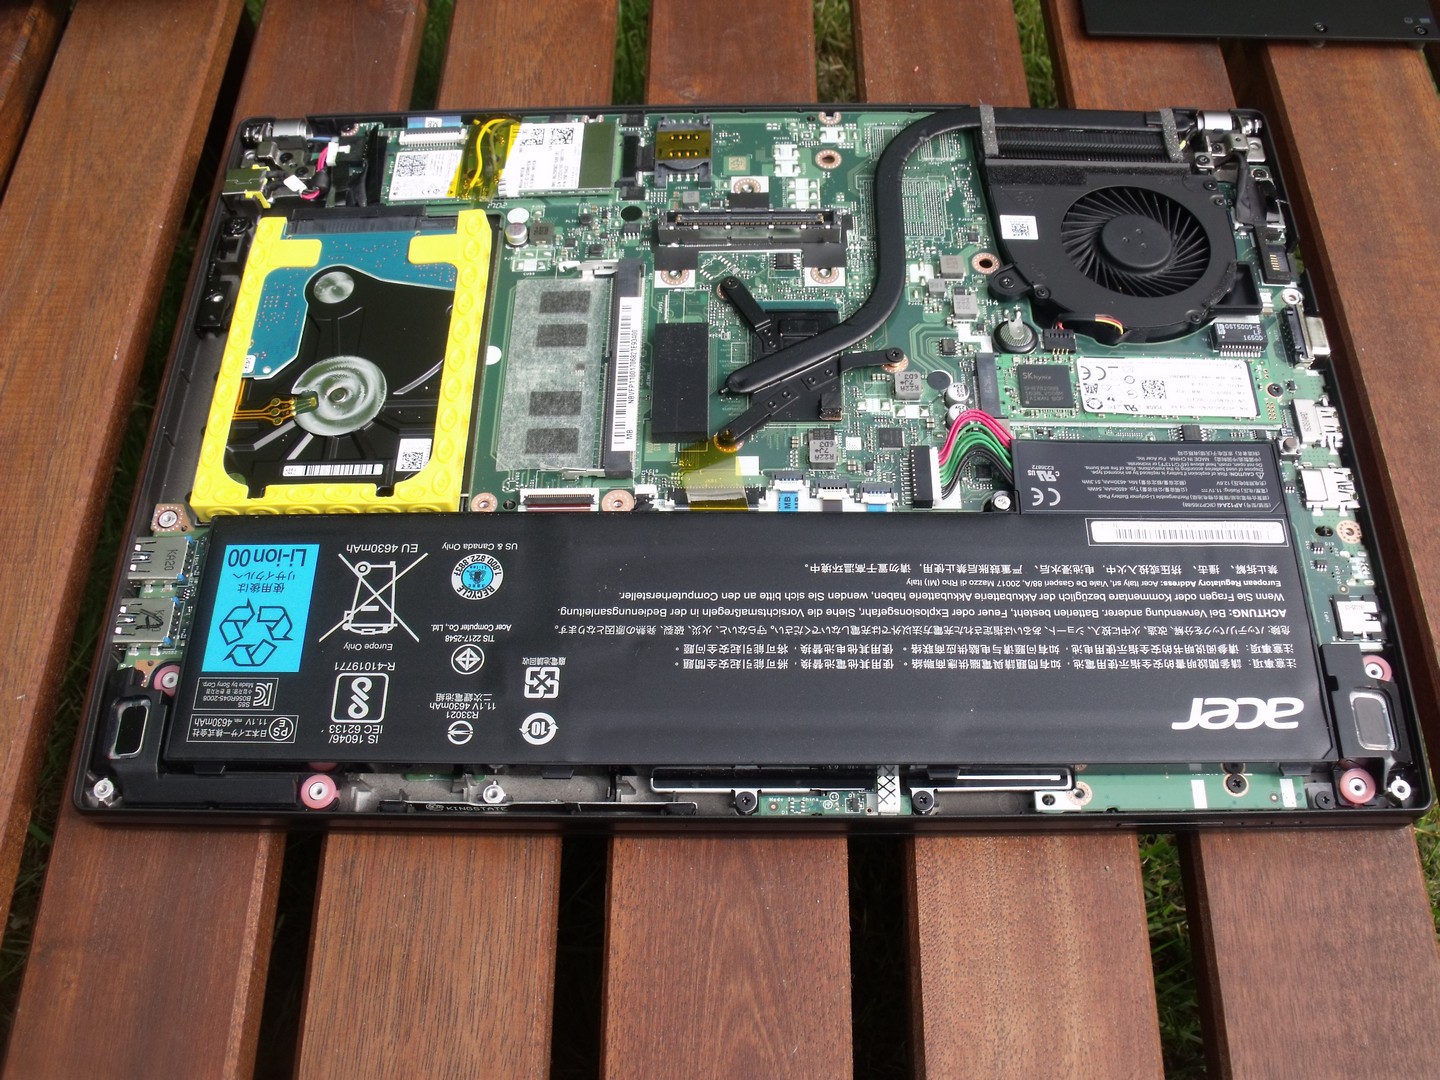
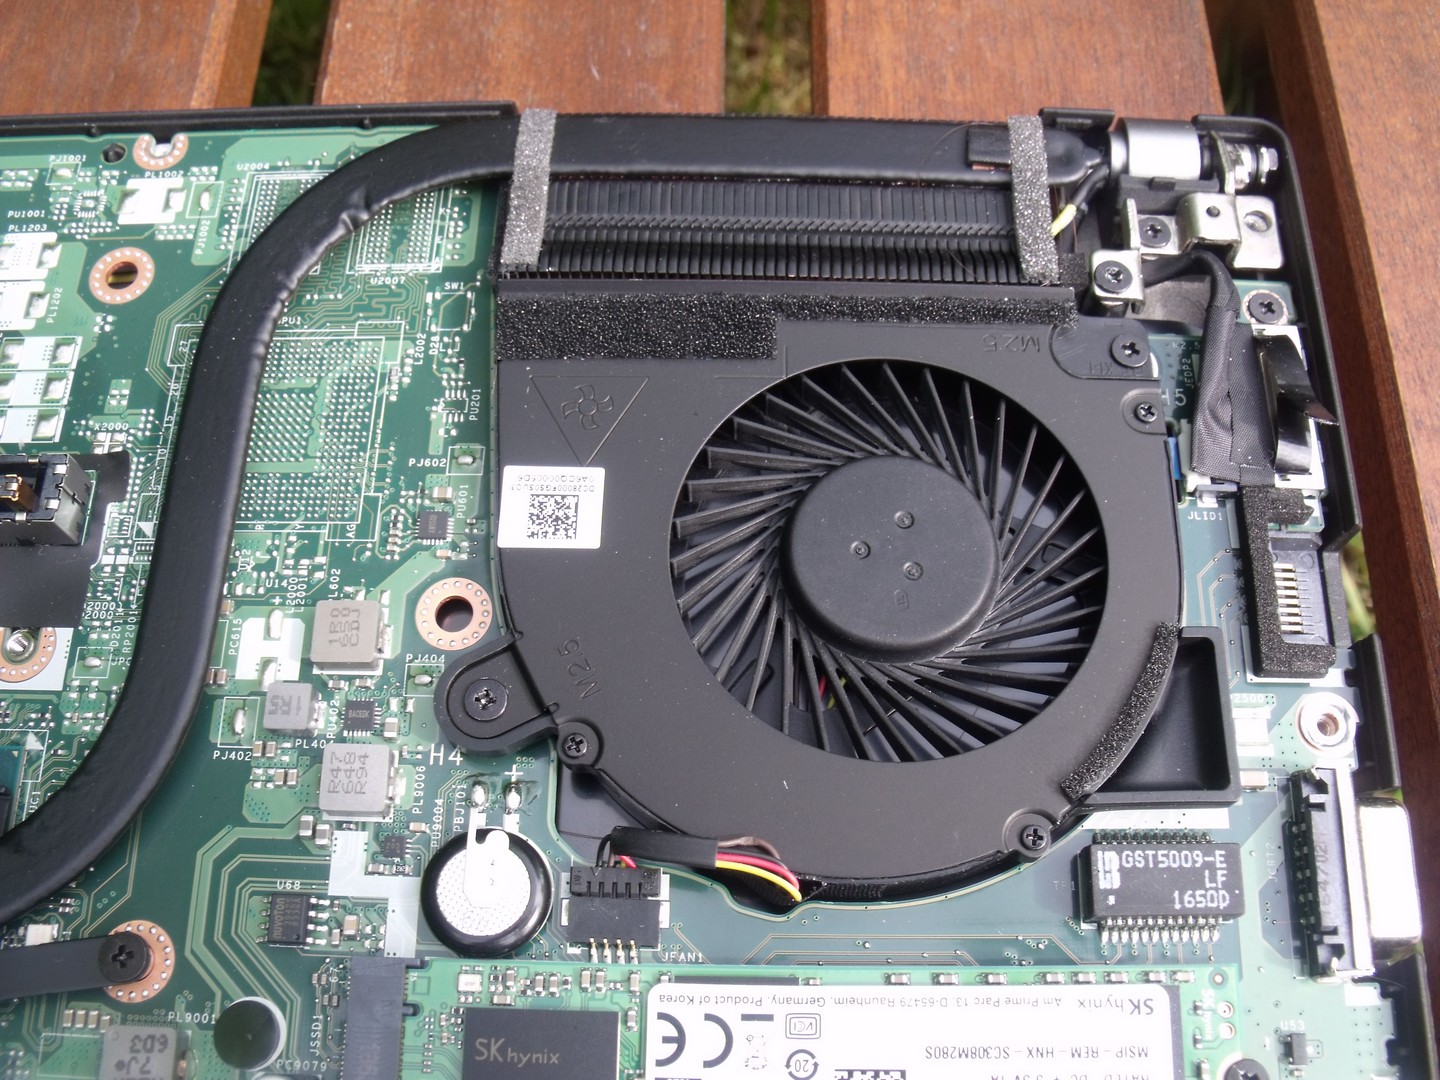
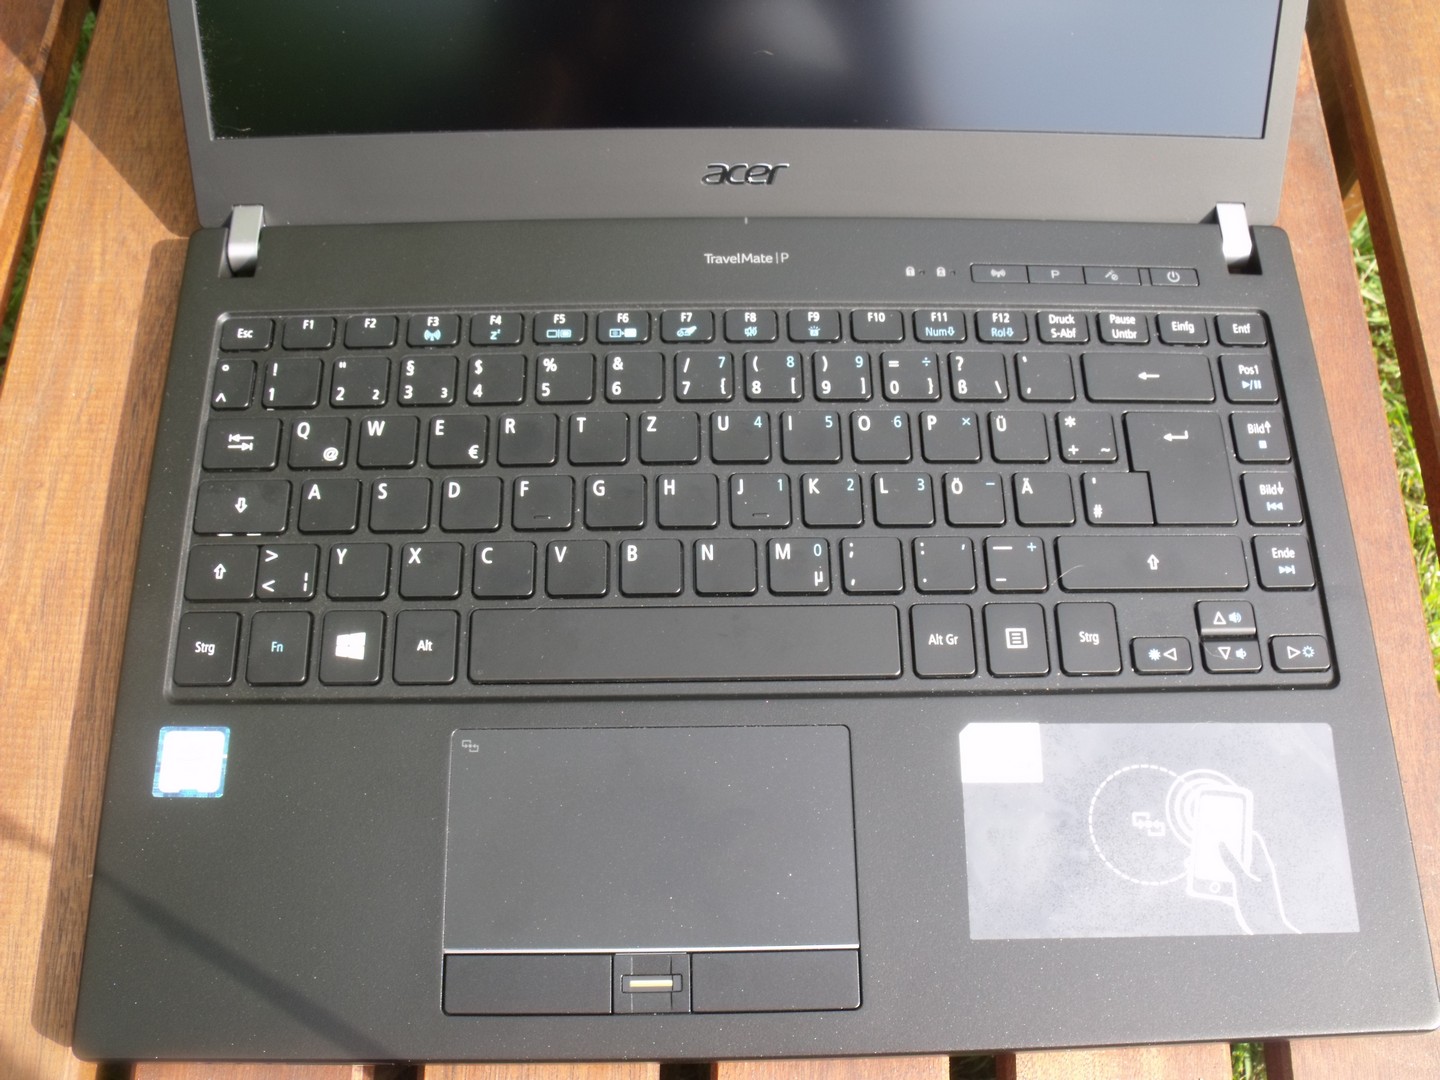
TravelMate P648 G2 M 7619是一台轻盈坚固的笔记本电脑。你一天内的一切工作任务将会由更新后的Kaby Lake处理器,更快的固态硬盘,更大容量的机械硬盘提供支持。它的屏幕也足够明亮,可以适合光线较亮环境中使用的需要。宏碁还提供了对应的扩展坞帮助提供更多的借口。它的键盘反馈稍弱,而宏碁也需要改进它时快时慢的风扇控制设计。
宏碁又一次更新了它的TravelMate P6系列。不过除了最新Kaby Lake处理器和更大机械硬盘外,它的变化并不大。
TravelMate P648 G2 M 7619会十分适合正在寻找除联想,戴尔和惠普之外的产品的用户考虑。我们的测试机售价约1500欧元(约1700美元)。
注:本文是基于完整评测的缩减版本,阅读完整的英文评测,请点击这里。
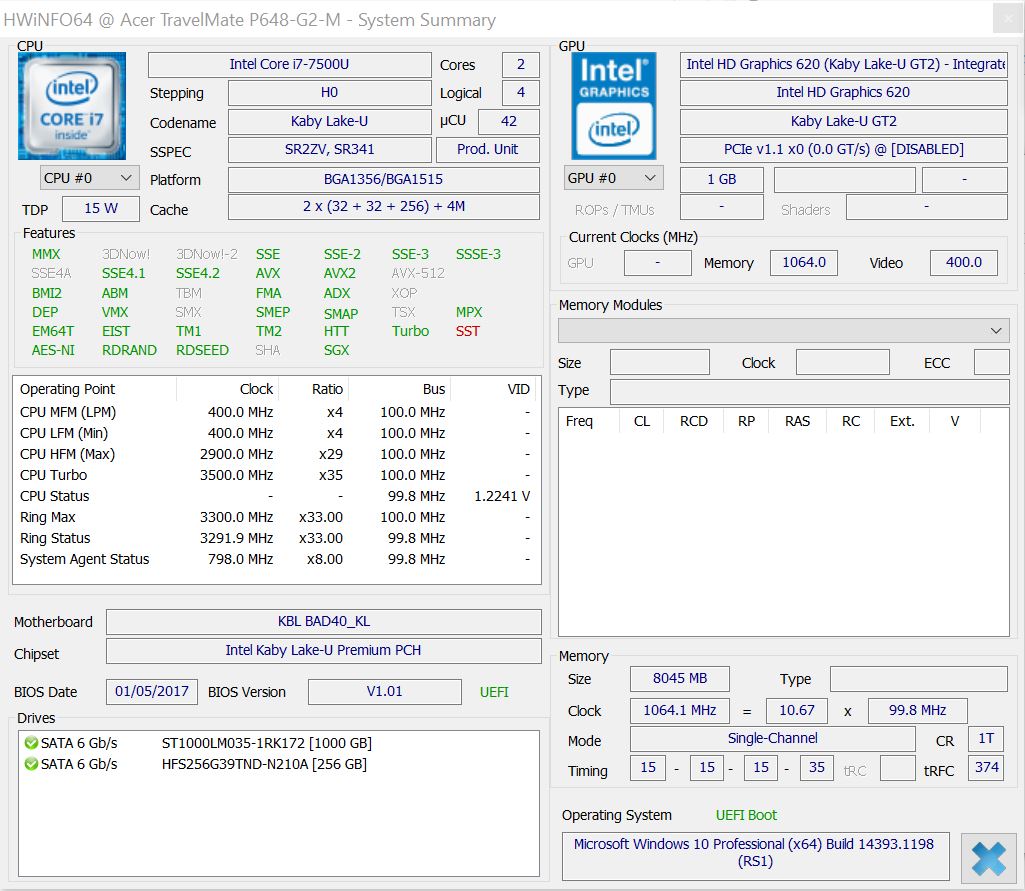
Acer TravelMate P648-G2-M-73T0
- 06/06/2017 v6 (old)
Mike Wobker