联想ThinkPad T14s笔记本电脑评测:有了AMD的商务本更好
Rating | Date | Model | Weight | Height | Size | Resolution | Price |
|---|---|---|---|---|---|---|---|
| 90.5 % v7 (old) | 10 / 2020 | Lenovo ThinkPad T14s-20UJS00K00 R7 PRO 4750U, Vega 7 | 1.3 kg | 16.1 mm | 14.00" | 1920x1080 | |
| 88.8 % v7 (old) | 01 / 2021 | Lenovo ThinkPad T14s-20T00044GE i5-10210U, UHD Graphics 620 | 1.3 kg | 16.1 mm | 14.00" | 1920x1080 | |
| 88.4 % v7 (old) | 12 / 2019 | Lenovo ThinkPad T495s-20QKS01E00 R7 PRO 3700U, Vega 10 | 1.3 kg | 16.1 mm | 14.00" | 1920x1080 | |
| 88.9 % v7 (old) | 08 / 2020 | Dell Latitude 7410 i7-10610U, UHD Graphics 620 | 1.4 kg | 19.3 mm | 14.00" | 3840x2160 | |
| 90.2 % v7 (old) | 09 / 2020 | Lenovo ThinkPad X1 Carbon 2020-20UAS04T00 i7-10510U, UHD Graphics 620 | 1.1 kg | 14.9 mm | 14.00" | 1920x1080 |

| SD Card Reader | |
| average JPG Copy Test (av. of 3 runs) | |
| Dell Latitude 7410 (Toshiba Exceria Pro M501 64 GB UHS-II) | |
| Lenovo ThinkPad T495s-20QKS01E00 (Toshiba Exceria Pro M501 64 GB UHS-II) | |
| Lenovo ThinkPad T14s-20UJS00K00 (Toshiba Exceria Pro M501 64 GB UHS-II) | |
| Average of class Office (19.8 - 198.5, n=22, last 2 years) | |
| Lenovo ThinkPad T14s-20T00044GE (Toshiba Exceria Pro M501 64 GB UHS-II) | |
| maximum AS SSD Seq Read Test (1GB) | |
| Dell Latitude 7410 (Toshiba Exceria Pro M501 64 GB UHS-II) | |
| Lenovo ThinkPad T495s-20QKS01E00 (Toshiba Exceria Pro M501 64 GB UHS-II) | |
| Lenovo ThinkPad T14s-20UJS00K00 (Toshiba Exceria Pro M501 64 GB UHS-II) | |
| Average of class Office (27.4 - 249, n=21, last 2 years) | |
| Lenovo ThinkPad T14s-20T00044GE (Toshiba Exceria Pro M501 64 GB UHS-II) | |


| |||||||||||||||||||||||||
Brightness Distribution: 88 %
Center on Battery: 403 cd/m²
Contrast: 1188:1 (Black: 0.34 cd/m²)
ΔE ColorChecker Calman: 1.4 | ∀{0.5-29.43 Ø4.72}
calibrated: 0.8
ΔE Greyscale Calman: 1.6 | ∀{0.09-98 Ø4.97}
97.9% sRGB (Argyll 1.6.3 3D)
63% AdobeRGB 1998 (Argyll 1.6.3 3D)
69% AdobeRGB 1998 (Argyll 3D)
97.9% sRGB (Argyll 3D)
66.8% Display P3 (Argyll 3D)
Gamma: 2.13
CCT: 6480 K
| Lenovo ThinkPad T14s-20UJS00K00 N140HCG-GQ2, IPS , 1920x1080, 14" | Lenovo ThinkPad T14s-20T00044GE B140HAN05.7, LTPS AHVA-IPS LED, 1920x1080, 14" | Lenovo ThinkPad T495s-20QKS01E00 B140HAN05.7, IPS, 1920x1080, 14" | Dell Latitude 7410 AU Optronics B140ZAN, IPS, 3840x2160, 14" | Lenovo ThinkPad X1 Carbon 2020-20UAS04T00 BOE NE140FHM-N61, IPS, 1920x1080, 14" | |
|---|---|---|---|---|---|
| Display | -1% | -1% | 4% | -2% | |
| Display P3 Coverage (%) | 66.8 | 66.6 0% | 67 0% | 71.8 7% | 68.9 3% |
| sRGB Coverage (%) | 97.9 | 96.8 -1% | 96.8 -1% | 99.3 1% | 91.6 -6% |
| AdobeRGB 1998 Coverage (%) | 69 | 67.6 -2% | 68.3 -1% | 72.4 5% | 67.1 -3% |
| Response Times | -90% | -118% | -34% | -100% | |
| Response Time Grey 50% / Grey 80% * (ms) | 32.4 ? | 63.2 ? -95% | 60.8 ? -88% | 39.2 ? -21% | 64.8 ? -100% |
| Response Time Black / White * (ms) | 15.2 ? | 28 ? -84% | 37.6 ? -147% | 22.4 ? -47% | 30.4 ? -100% |
| PWM Frequency (Hz) | 26040 ? | 2404 ? | |||
| Screen | -21% | -38% | -68% | -77% | |
| Brightness middle (cd/m²) | 404 | 404 0% | 380 -6% | 388.6 -4% | 422 4% |
| Brightness (cd/m²) | 371 | 397 7% | 381 3% | 365 -2% | 395 6% |
| Brightness Distribution (%) | 88 | 92 5% | 87 -1% | 82 -7% | 90 2% |
| Black Level * (cd/m²) | 0.34 | 0.21 38% | 0.22 35% | 0.35 -3% | 0.27 21% |
| Contrast (:1) | 1188 | 1924 62% | 1727 45% | 1110 -7% | 1563 32% |
| Colorchecker dE 2000 * | 1.4 | 3.1 -121% | 4 -186% | 4.04 -189% | 4.7 -236% |
| Colorchecker dE 2000 max. * | 3.2 | 4.7 -47% | 5.7 -78% | 9.2 -187% | 10 -213% |
| Colorchecker dE 2000 calibrated * | 0.8 | 1.3 -63% | 1.2 -50% | 1.25 -56% | 2 -150% |
| Greyscale dE 2000 * | 1.6 | 3.4 -113% | 4.4 -175% | 6.4 -300% | 6.4 -300% |
| Gamma | 2.13 103% | 2.38 92% | 2.54 87% | 2.3 96% | 2.12 104% |
| CCT | 6480 100% | 7070 92% | 6963 93% | 6957 93% | 7106 91% |
| Color Space (Percent of AdobeRGB 1998) (%) | 63 | 61.8 -2% | 62.2 -1% | 66.4 5% | 59.5 -6% |
| Color Space (Percent of sRGB) (%) | 97.9 | 96.6 -1% | 96.6 -1% | 99.4 2% | 91.5 -7% |
| Total Average (Program / Settings) | -37% /
-26% | -52% /
-41% | -33% /
-50% | -60% /
-66% |
* ... smaller is better
Display Response Times
| ↔ Response Time Black to White | ||
|---|---|---|
| 15.2 ms ... rise ↗ and fall ↘ combined | ↗ 6.8 ms rise | 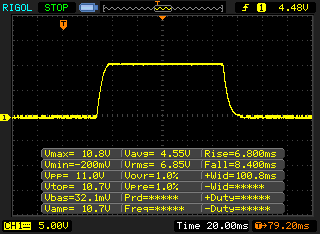 |
| ↘ 8.4 ms fall | ||
| The screen shows good response rates in our tests, but may be too slow for competitive gamers. In comparison, all tested devices range from 0.1 (minimum) to 240 (maximum) ms. » 36 % of all devices are better. This means that the measured response time is better than the average of all tested devices (19.8 ms). | ||
| ↔ Response Time 50% Grey to 80% Grey | ||
| 32.4 ms ... rise ↗ and fall ↘ combined | ↗ 16.4 ms rise | 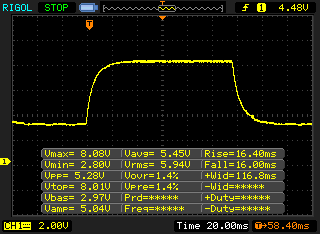 |
| ↘ 16 ms fall | ||
| The screen shows slow response rates in our tests and will be unsatisfactory for gamers. In comparison, all tested devices range from 0.165 (minimum) to 636 (maximum) ms. » 44 % of all devices are better. This means that the measured response time is similar to the average of all tested devices (31 ms). | ||
Screen Flickering / PWM (Pulse-Width Modulation)
| Screen flickering / PWM detected | 26040 Hz | ≤ 50 % brightness setting | 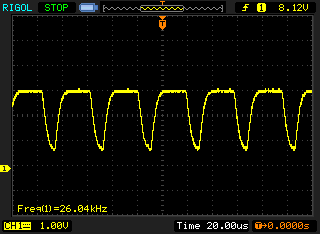 |
The display backlight flickers at 26040 Hz (worst case, e.g., utilizing PWM) Flickering detected at a brightness setting of 50 % and below. There should be no flickering or PWM above this brightness setting. The frequency of 26040 Hz is quite high, so most users sensitive to PWM should not notice any flickering. In comparison: 52 % of all tested devices do not use PWM to dim the display. If PWM was detected, an average of 7781 (minimum: 5 - maximum: 343500) Hz was measured. | |||

Cinebench R15: CPU Single 64Bit | CPU Multi 64Bit
Blender: v2.79 BMW27 CPU
7-Zip 18.03: 7z b 4 -mmt1 | 7z b 4
Geekbench 5.5: Single-Core | Multi-Core
HWBOT x265 Benchmark v2.2: 4k Preset
LibreOffice : 20 Documents To PDF
R Benchmark 2.5: Overall mean
| Cinebench R20 / CPU (Single Core) | |
| Average of class Office (345 - 816, n=73, last 2 years) | |
| Average AMD Ryzen 7 PRO 4750U (461 - 479, n=5) | |
| Lenovo ThinkPad T14s-20UJS00K00 | |
| Lenovo ThinkPad X1 Carbon 2020-20UAS04T00 | |
| Lenovo ThinkPad T14s-20T00044GE | |
| Dell Latitude 7410 | |
| Cinebench R20 / CPU (Multi Core) | |
| Average of class Office (648 - 8840, n=73, last 2 years) | |
| Average AMD Ryzen 7 PRO 4750U (2935 - 3302, n=5) | |
| Lenovo ThinkPad T14s-20UJS00K00 | |
| Lenovo ThinkPad X1 Carbon 2020-20UAS04T00 | |
| Lenovo ThinkPad T14s-20T00044GE | |
| Dell Latitude 7410 | |
| Cinebench R15 / CPU Single 64Bit | |
| Average of class Office (99.5 - 312, n=75, last 2 years) | |
| Lenovo ThinkPad X1 Carbon 2020-20UAS04T00 | |
| Average AMD Ryzen 7 PRO 4750U (180 - 184, n=5) | |
| Lenovo ThinkPad T14s-20UJS00K00 | |
| Dell Latitude 7410 | |
| Lenovo ThinkPad T14s-20T00044GE | |
| Lenovo ThinkPad T495s-20QKS01E00 | |
| Cinebench R15 / CPU Multi 64Bit | |
| Average of class Office (250 - 3380, n=75, last 2 years) | |
| Average AMD Ryzen 7 PRO 4750U (1287 - 1417, n=5) | |
| Lenovo ThinkPad T14s-20UJS00K00 | |
| Lenovo ThinkPad X1 Carbon 2020-20UAS04T00 | |
| Lenovo ThinkPad T495s-20QKS01E00 | |
| Lenovo ThinkPad T14s-20T00044GE | |
| Dell Latitude 7410 | |
| Blender / v2.79 BMW27 CPU | |
| Dell Latitude 7410 | |
| Lenovo ThinkPad T14s-20T00044GE | |
| Lenovo ThinkPad T495s-20QKS01E00 | |
| Lenovo ThinkPad X1 Carbon 2020-20UAS04T00 | |
| Lenovo ThinkPad T14s-20UJS00K00 | |
| Average of class Office (158 - 1940, n=74, last 2 years) | |
| Average AMD Ryzen 7 PRO 4750U (340 - 403, n=5) | |
| 7-Zip 18.03 / 7z b 4 -mmt1 | |
| Average of class Office (3387 - 6469, n=75, last 2 years) | |
| Dell Latitude 7410 | |
| Lenovo ThinkPad X1 Carbon 2020-20UAS04T00 | |
| Lenovo ThinkPad T14s-20UJS00K00 | |
| Average AMD Ryzen 7 PRO 4750U (4413 - 4467, n=5) | |
| Lenovo ThinkPad T14s-20T00044GE | |
| Lenovo ThinkPad T495s-20QKS01E00 | |
| 7-Zip 18.03 / 7z b 4 | |
| Average of class Office (7098 - 76886, n=75, last 2 years) | |
| Average AMD Ryzen 7 PRO 4750U (37081 - 42173, n=5) | |
| Lenovo ThinkPad T14s-20UJS00K00 | |
| Lenovo ThinkPad X1 Carbon 2020-20UAS04T00 | |
| Lenovo ThinkPad T14s-20T00044GE | |
| Dell Latitude 7410 | |
| Lenovo ThinkPad T495s-20QKS01E00 | |
| Geekbench 5.5 / Single-Core | |
| Average of class Office (811 - 2128, n=71, last 2 years) | |
| Dell Latitude 7410 | |
| Lenovo ThinkPad X1 Carbon 2020-20UAS04T00 | |
| Lenovo ThinkPad T14s-20UJS00K00 | |
| Average AMD Ryzen 7 PRO 4750U (1117 - 1157, n=5) | |
| Lenovo ThinkPad T14s-20T00044GE | |
| Geekbench 5.5 / Multi-Core | |
| Average of class Office (1483 - 16999, n=71, last 2 years) | |
| Lenovo ThinkPad T14s-20UJS00K00 | |
| Average AMD Ryzen 7 PRO 4750U (5456 - 6609, n=5) | |
| Lenovo ThinkPad X1 Carbon 2020-20UAS04T00 | |
| Lenovo ThinkPad T14s-20T00044GE | |
| Dell Latitude 7410 | |
| HWBOT x265 Benchmark v2.2 / 4k Preset | |
| Average of class Office (2.21 - 26, n=74, last 2 years) | |
| Lenovo ThinkPad T14s-20UJS00K00 | |
| Average AMD Ryzen 7 PRO 4750U (8.33 - 10.3, n=5) | |
| Lenovo ThinkPad X1 Carbon 2020-20UAS04T00 | |
| Lenovo ThinkPad T14s-20T00044GE | |
| Dell Latitude 7410 | |
| Lenovo ThinkPad T495s-20QKS01E00 | |
| LibreOffice / 20 Documents To PDF | |
| Average AMD Ryzen 7 PRO 4750U (58.4 - 73.4, n=5) | |
| Lenovo ThinkPad T14s-20UJS00K00 | |
| Average of class Office (39.9 - 102.3, n=74, last 2 years) | |
| Dell Latitude 7410 | |
| Lenovo ThinkPad T14s-20T00044GE | |
| Lenovo ThinkPad X1 Carbon 2020-20UAS04T00 | |
| R Benchmark 2.5 / Overall mean | |
| Lenovo ThinkPad T14s-20T00044GE | |
| Lenovo ThinkPad X1 Carbon 2020-20UAS04T00 | |
| Dell Latitude 7410 | |
| Lenovo ThinkPad T14s-20UJS00K00 | |
| Average AMD Ryzen 7 PRO 4750U (0.61 - 0.621, n=5) | |
| Average of class Office (0.4098 - 0.888, n=74, last 2 years) | |
* ... smaller is better
| PCMark 8 Home Score Accelerated v2 | 4640 points | |
| PCMark 8 Creative Score Accelerated v2 | 5813 points | |
| PCMark 8 Work Score Accelerated v2 | 5570 points | |
| PCMark 10 Score | 4890 points | |
Help | ||
| DPC Latencies / LatencyMon - interrupt to process latency (max), Web, Youtube, Prime95 | |
| Lenovo ThinkPad T14s-20T00044GE | |
| Lenovo ThinkPad T14s-20UJS00K00 | |
| Dell Latitude 7410 | |
| Lenovo ThinkPad X1 Carbon 2020-20UAS04T00 | |
* ... smaller is better
| Lenovo ThinkPad T14s-20UJS00K00 WDC PC SN730 SDBPNTY-1T00 | Lenovo ThinkPad T14s-20T00044GE Samsung SSD PM981a MZVLB256HBHQ | Lenovo ThinkPad T495s-20QKS01E00 Samsung PM981a MZVLB1T0HBLR | Dell Latitude 7410 Toshiba XG6 KXG60ZNV512G | Lenovo ThinkPad X1 Carbon 2020-20UAS04T00 Samsung SSD PM981a MZVLB512HBJQ | Average WDC PC SN730 SDBPNTY-1T00 | |
|---|---|---|---|---|---|---|
| CrystalDiskMark 5.2 / 6 | -7% | 1% | 2% | 14% | 10% | |
| Write 4K (MB/s) | 108 | 117.5 9% | 142.3 32% | 133.4 24% | 185 71% | 139.9 ? 30% |
| Read 4K (MB/s) | 39.82 | 40.81 2% | 46.69 17% | 51.3 29% | 50.6 27% | 44.5 ? 12% |
| Write Seq (MB/s) | 2028 | 2031 0% | 1897 -6% | 1543 -24% | 2346 ? 16% | |
| Read Seq (MB/s) | 1826 | 1970 8% | 2202 21% | 1509 -17% | 2102 ? 15% | |
| Write 4K Q32T1 (MB/s) | 570 | 395.5 -31% | 268.3 -53% | 384.9 -32% | 488.8 -14% | 442 ? -22% |
| Read 4K Q32T1 (MB/s) | 401.5 | 361.4 -10% | 359.6 -10% | 318.7 -21% | 579 44% | 460 ? 15% |
| Write Seq Q32T1 (MB/s) | 3091 | 2330 -25% | 3033 -2% | 2866 -7% | 2986 -3% | 3049 ? -1% |
| Read Seq Q32T1 (MB/s) | 2872 | 2530 -12% | 3561 24% | 3122 9% | 3555 24% | 3285 ? 14% |
| Write 4K Q8T8 (MB/s) | 1491 | 1012 ? | ||||
| Read 4K Q8T8 (MB/s) | 1499 | 1300 ? | ||||
| AS SSD | -20% | 8% | -28% | 23% | 2% | |
| Seq Read (MB/s) | 2291 | 2631 15% | 2661 16% | 1837 -20% | 2659 16% | 2606 ? 14% |
| Seq Write (MB/s) | 1343 | 1191 -11% | 2314 72% | 1438 7% | 2551 90% | 1935 ? 44% |
| 4K Read (MB/s) | 42.56 | 44.76 5% | 45.52 7% | 48.1 13% | 56.4 33% | 42.9 ? 1% |
| 4K Write (MB/s) | 132.2 | 124.7 -6% | 105.3 -20% | 132.1 0% | 158 20% | 129.1 ? -2% |
| 4K-64 Read (MB/s) | 850 | 756 -11% | 1806 112% | 660 -22% | 1317 55% | 1361 ? 60% |
| 4K-64 Write (MB/s) | 2262 | 1300 -43% | 1650 -27% | 1163 -49% | 1786 -21% | 1920 ? -15% |
| Access Time Read * (ms) | 0.05 | 0.089 -78% | 0.04 20% | 0.059 -18% | 0.047 6% | 0.0689 ? -38% |
| Access Time Write * (ms) | 0.028 | 0.03 -7% | 0.041 -46% | 0.096 -243% | 0.024 14% | 0.06215 ? -122% |
| Score Read (Points) | 1121 | 1064 -5% | 2118 89% | 891 -21% | 1640 46% | 1664 ? 48% |
| Score Write (Points) | 2529 | 1544 -39% | 1986 -21% | 1439 -43% | 2199 -13% | 2242 ? -11% |
| Score Total (Points) | 4185 | 3090 -26% | 5169 24% | 2780 -34% | 4682 12% | 4726 ? 13% |
| Copy ISO MB/s (MB/s) | 2546 | 1813 -29% | 1131 -56% | 2089 -18% | 2041 ? -20% | |
| Copy Program MB/s (MB/s) | 428.6 | 524 22% | 267.1 -38% | 548 28% | 552 ? 29% | |
| Copy Game MB/s (MB/s) | 943 | 350.5 -63% | 691 -27% | 1226 30% | 1183 ? 25% | |
| Total Average (Program / Settings) | -14% /
-15% | 5% /
6% | -13% /
-17% | 19% /
19% | 6% /
5% |
* ... smaller is better

Continuous Performance Read: DiskSpd Read Loop, Queue Depth 8
| 3DMark 11 - 1280x720 Performance GPU | |
| Average of class Office (2551 - 18313, n=69, last 2 years) | |
| Lenovo ThinkPad T14s-20UJS00K00 | |
| Average AMD Radeon RX Vega 7 (3353 - 6249, n=62) | |
| Dell XPS 13 9300 Core i7-1065G7 | |
| Lenovo ThinkPad E14 Gen2-20T7S00W00 | |
| Lenovo ThinkPad T495s-20QKS01E00 | |
| Lenovo ThinkPad X1 Carbon 2020-20UAS04T00 | |
| Dell Latitude 7410 | |
| Lenovo ThinkPad T14s-20T00044GE | |
| 3DMark Vantage P Result | 17399 points | |
| 3DMark 11 Performance | 5705 points | |
| 3DMark Fire Strike Score | 3267 points | |
Help | ||
| low | med. | high | ultra | |
|---|---|---|---|---|
| The Witcher 3 (2015) | 64.9 | 20.7 | ||
| Dota 2 Reborn (2015) | 100 | 82.7 | 52.5 | 48.9 |
| Rise of the Tomb Raider (2016) | 68.2 | 21.8 | ||
| X-Plane 11.11 (2018) | 42.4 | 34.1 | 29.8 | |
| Far Cry 5 (2018) | 37 | 18 | 17 | |
| F1 2020 (2020) | 81 | 40 | 30 | 21 |
Noise level
| Idle |
| 29.2 / 29.2 / 29.6 dB(A) |
| Load |
| 30.2 / 32.3 dB(A) |
 | ||
30 dB silent 40 dB(A) audible 50 dB(A) loud |
||
min: | ||
| Lenovo ThinkPad T14s-20UJS00K00 Vega 7, R7 PRO 4750U, WDC PC SN730 SDBPNTY-1T00 | Lenovo ThinkPad T14s-20T00044GE UHD Graphics 620, i5-10210U, Samsung SSD PM981a MZVLB256HBHQ | Lenovo ThinkPad T495s-20QKS01E00 Vega 10, R7 PRO 3700U, Samsung PM981a MZVLB1T0HBLR | Dell Latitude 7410 UHD Graphics 620, i7-10610U, Toshiba XG6 KXG60ZNV512G | Lenovo ThinkPad X1 Carbon 2020-20UAS04T00 UHD Graphics 620, i7-10510U, Samsung SSD PM981a MZVLB512HBJQ | |
|---|---|---|---|---|---|
| Noise | 2% | -1% | -1% | -2% | |
| off / environment * (dB) | 29.2 | 29.3 -0% | 28.9 1% | 28.1 4% | 29.5 -1% |
| Idle Minimum * (dB) | 29.2 | 29.3 -0% | 28.9 1% | 28.1 4% | 29.5 -1% |
| Idle Average * (dB) | 29.2 | 29.3 -0% | 28.9 1% | 28.1 4% | 29.5 -1% |
| Idle Maximum * (dB) | 29.6 | 29.3 1% | 28.9 2% | 28.1 5% | 29.5 -0% |
| Load Average * (dB) | 30.2 | 30 1% | 31.5 -4% | 30 1% | 31.6 -5% |
| Witcher 3 ultra * (dB) | 32.3 | ||||
| Load Maximum * (dB) | 32.3 | 30 7% | 33.8 -5% | 39.3 -22% | 33.9 -5% |
* ... smaller is better
(±) The maximum temperature on the upper side is 44.7 °C / 112 F, compared to the average of 34.3 °C / 94 F, ranging from 21.2 to 62.5 °C for the class Office.
(±) The bottom heats up to a maximum of 44.6 °C / 112 F, compared to the average of 36.8 °C / 98 F
(+) In idle usage, the average temperature for the upper side is 24.5 °C / 76 F, compared to the device average of 29.5 °C / 85 F.
(+) The palmrests and touchpad are cooler than skin temperature with a maximum of 31.3 °C / 88.3 F and are therefore cool to the touch.
(-) The average temperature of the palmrest area of similar devices was 27.5 °C / 81.5 F (-3.8 °C / -6.8 F).
| Off / Standby | |
| Idle | |
| Load |
|
Key:
min: | |
| Lenovo ThinkPad T14s-20UJS00K00 R7 PRO 4750U, Vega 7, WDC PC SN730 SDBPNTY-1T00, IPS , 1920x1080, 14" | Lenovo ThinkPad T14s-20T00044GE i5-10210U, UHD Graphics 620, Samsung SSD PM981a MZVLB256HBHQ, LTPS AHVA-IPS LED, 1920x1080, 14" | Lenovo ThinkPad T495s-20QKS01E00 R7 PRO 3700U, Vega 10, Samsung PM981a MZVLB1T0HBLR, IPS, 1920x1080, 14" | Dell Latitude 7410 i7-10610U, UHD Graphics 620, Toshiba XG6 KXG60ZNV512G, IPS, 3840x2160, 14" | Lenovo ThinkPad X1 Carbon 2020-20UAS04T00 i7-10510U, UHD Graphics 620, Samsung SSD PM981a MZVLB512HBJQ, IPS, 1920x1080, 14" | Average AMD Radeon RX Vega 7 | Average of class Office | |
|---|---|---|---|---|---|---|---|
| Power Consumption | 20% | 4% | 3% | 5% | 3% | -2% | |
| Idle Minimum * (Watt) | 5.7 | 2.6 54% | 4.7 18% | 3.7 35% | 2.96 48% | 4.79 ? 16% | 4.41 ? 23% |
| Idle Average * (Watt) | 8.9 | 5.5 38% | 7.28 18% | 6.2 30% | 5.9 34% | 7.72 ? 13% | 7.37 ? 17% |
| Idle Maximum * (Watt) | 11 | 7.5 32% | 9.48 14% | 7 36% | 9.1 17% | 9.12 ? 17% | 8.58 ? 22% |
| Load Average * (Watt) | 38.2 | 28.2 26% | 35.3 8% | 43.2 -13% | 42.1 -10% | 38.4 ? -1% | 43 ? -13% |
| Load Maximum * (Watt) | 40.2 | 59.6 -48% | 55.5 -38% | 68.6 -71% | 65.1 -62% | 51.7 ? -29% | 64.6 ? -61% |
* ... smaller is better
| Lenovo ThinkPad T14s-20UJS00K00 R7 PRO 4750U, Vega 7, 57 Wh | Lenovo ThinkPad T14s-20T00044GE i5-10210U, UHD Graphics 620, 57 Wh | Lenovo ThinkPad T495s-20QKS01E00 R7 PRO 3700U, Vega 10, 57 Wh | Dell Latitude 7410 i7-10610U, UHD Graphics 620, 68 Wh | Lenovo ThinkPad X1 Carbon 2020-20UAS04T00 i7-10510U, UHD Graphics 620, 51 Wh | Average of class Office | |
|---|---|---|---|---|---|---|
| Battery runtime | 7% | 3% | 23% | -9% | 8% | |
| H.264 (h) | 13.2 | 14.7 11% | 12.5 -5% | 12.8 -3% | 15 ? 14% | |
| WiFi v1.3 (h) | 10.2 | 13.2 29% | 11.3 11% | 11 8% | 10.1 -1% | 12.9 ? 26% |
| Load (h) | 2.1 | 1.7 -19% | 2.9 38% | 1.6 -24% | 1.794 ? -15% | |
| Reader / Idle (h) | 31.3 | 23.7 ? |
Pros
Cons
总结——AMD真的有很多优点:
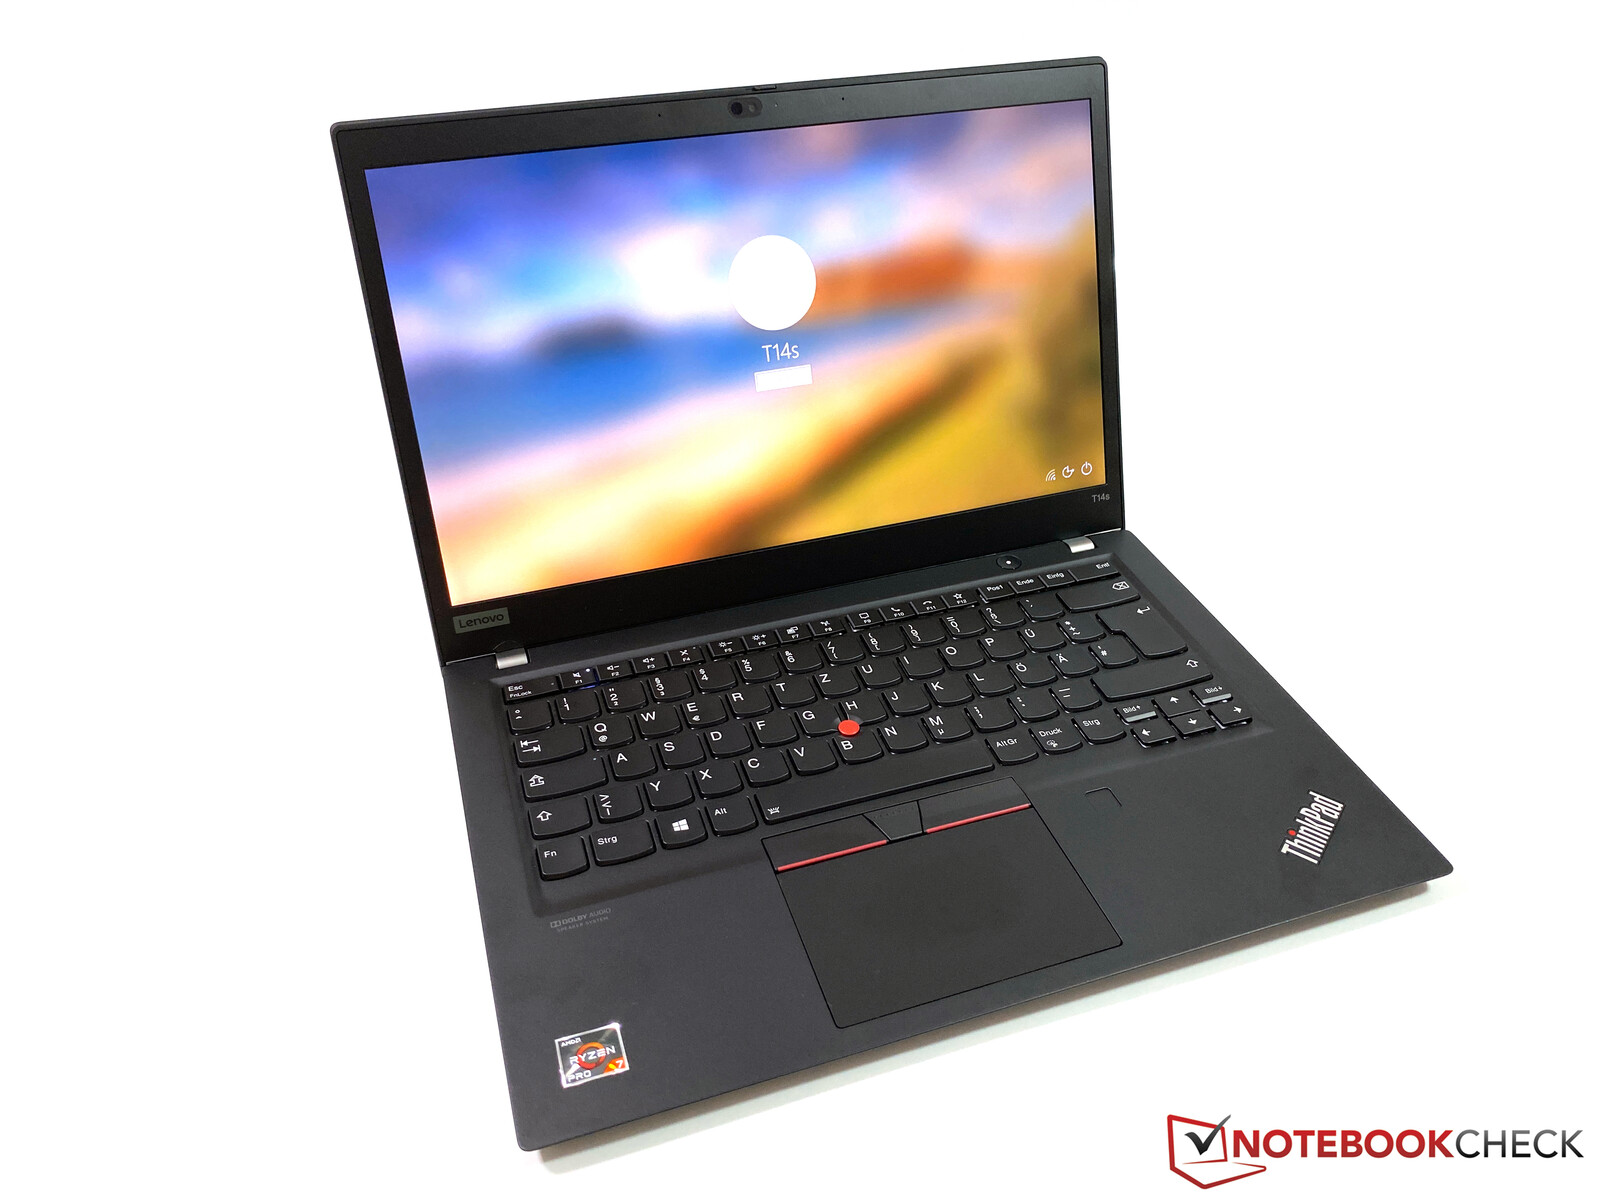
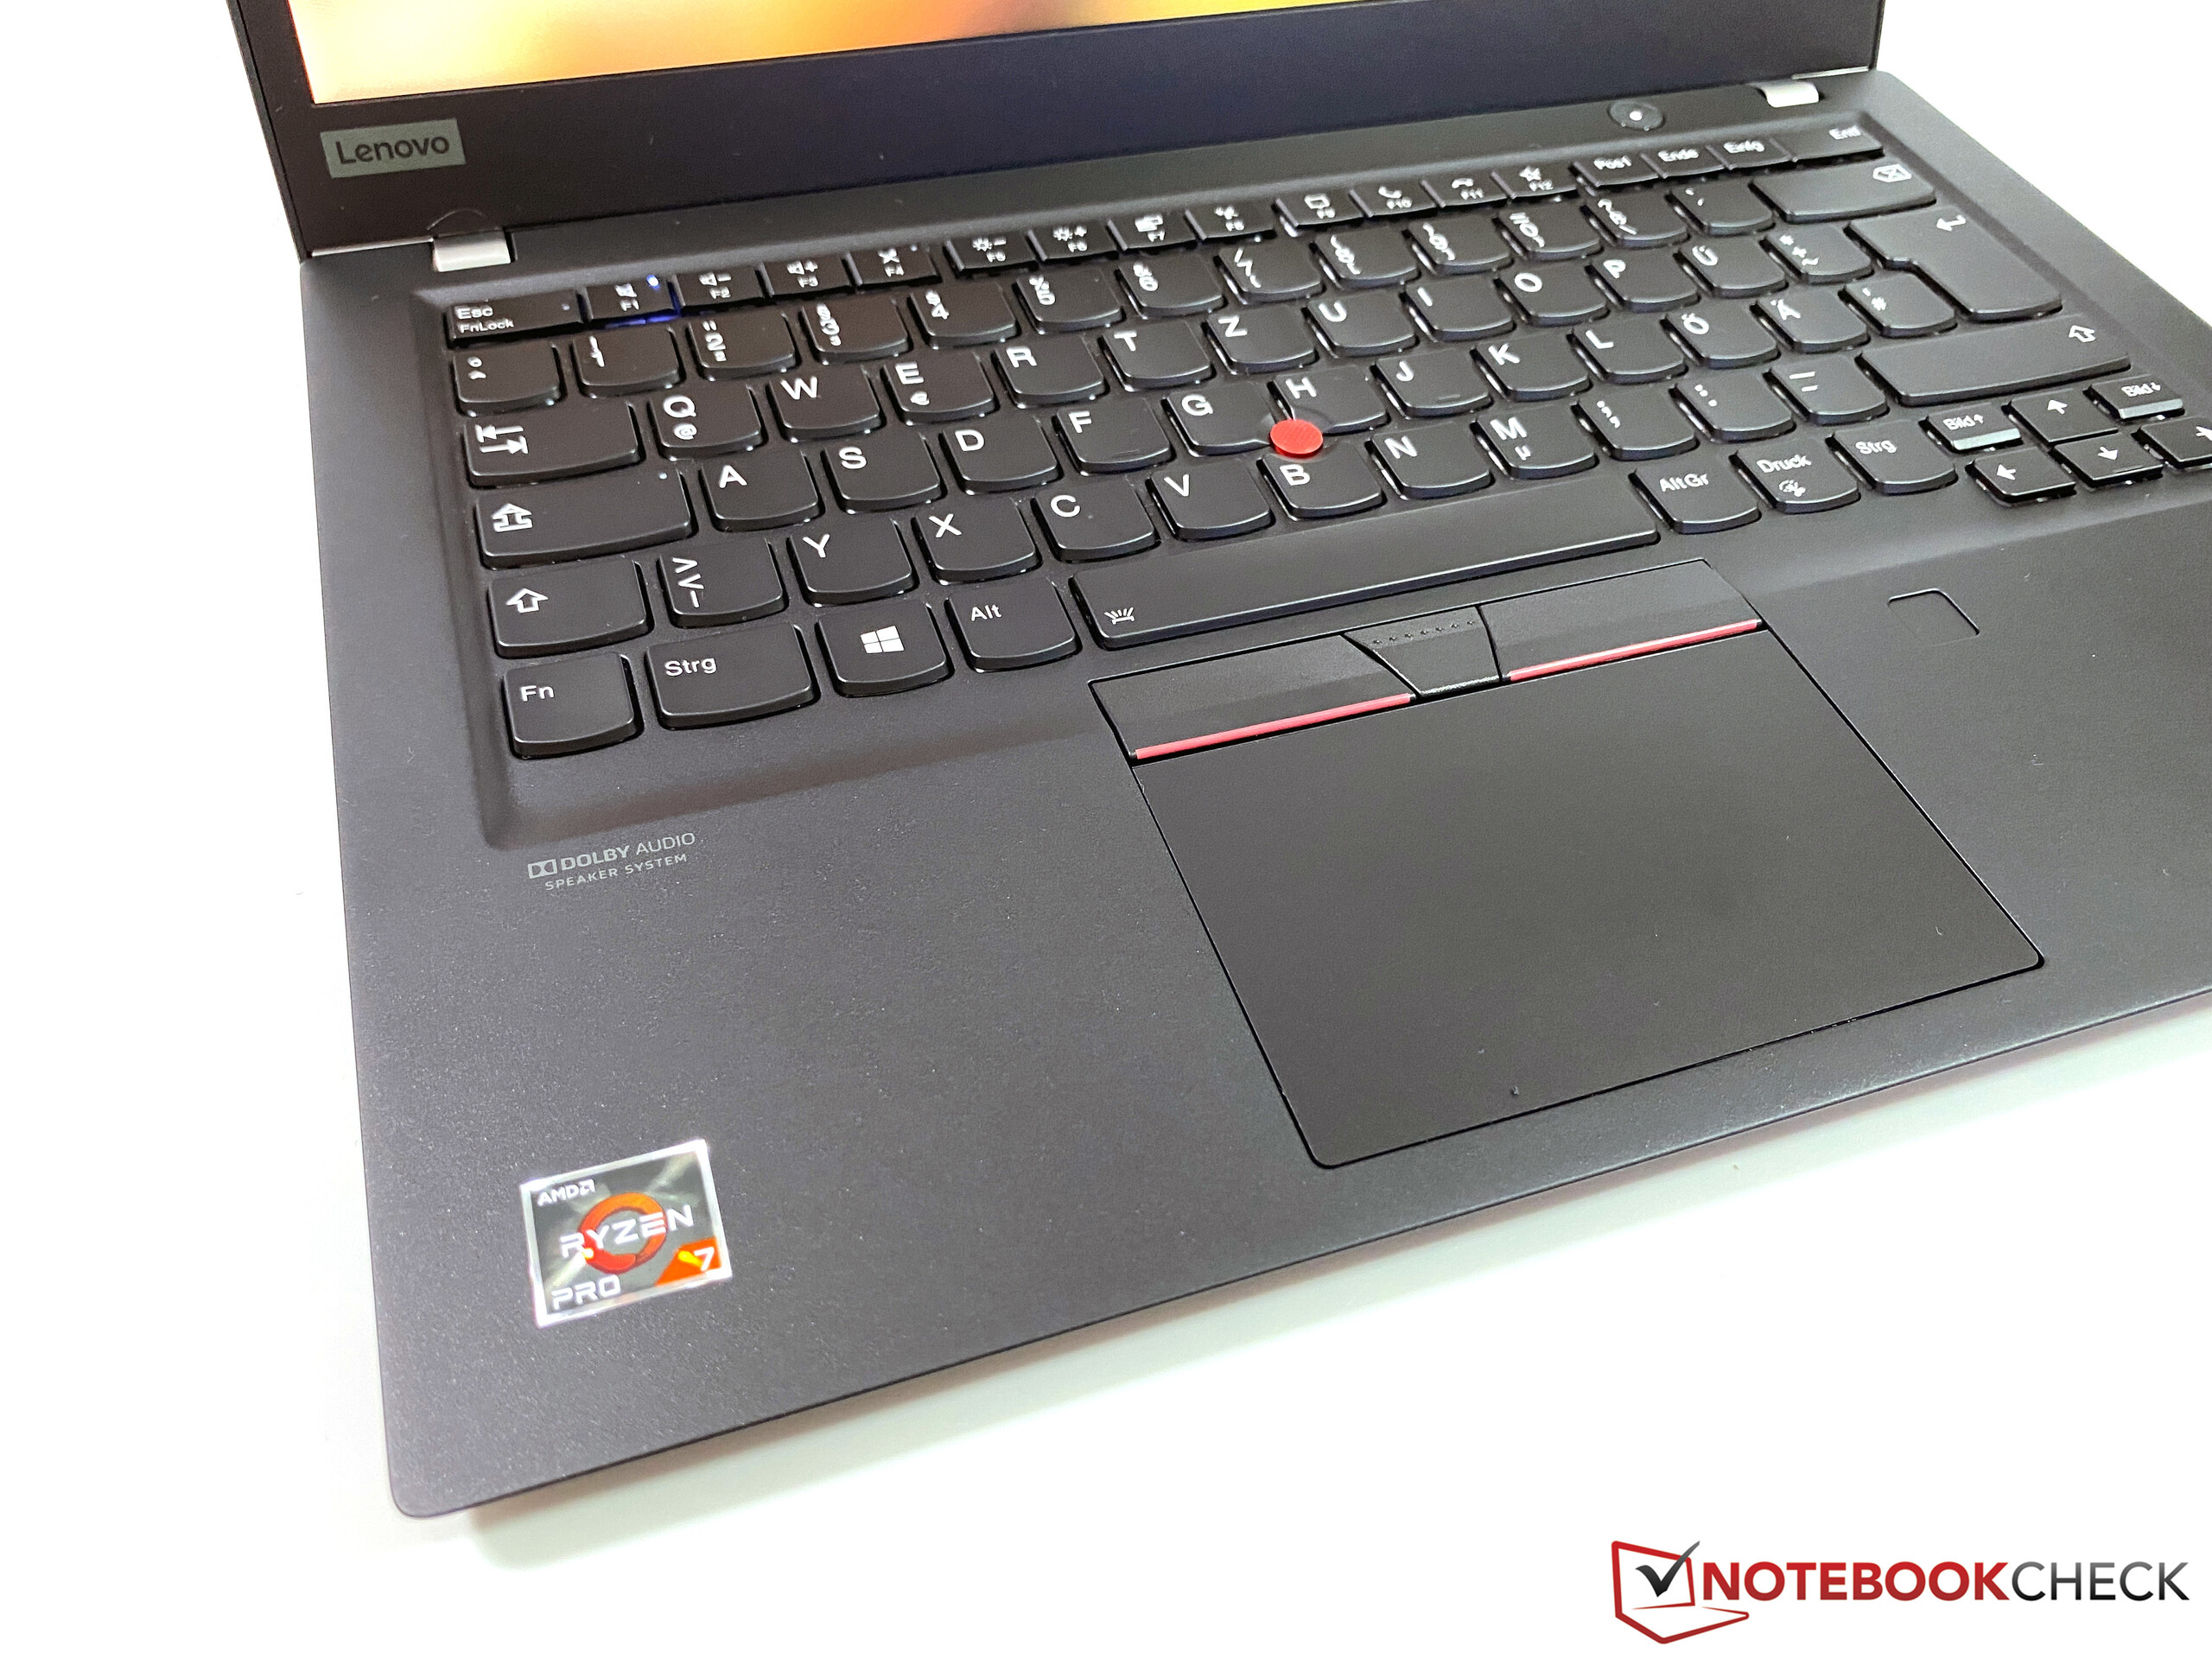
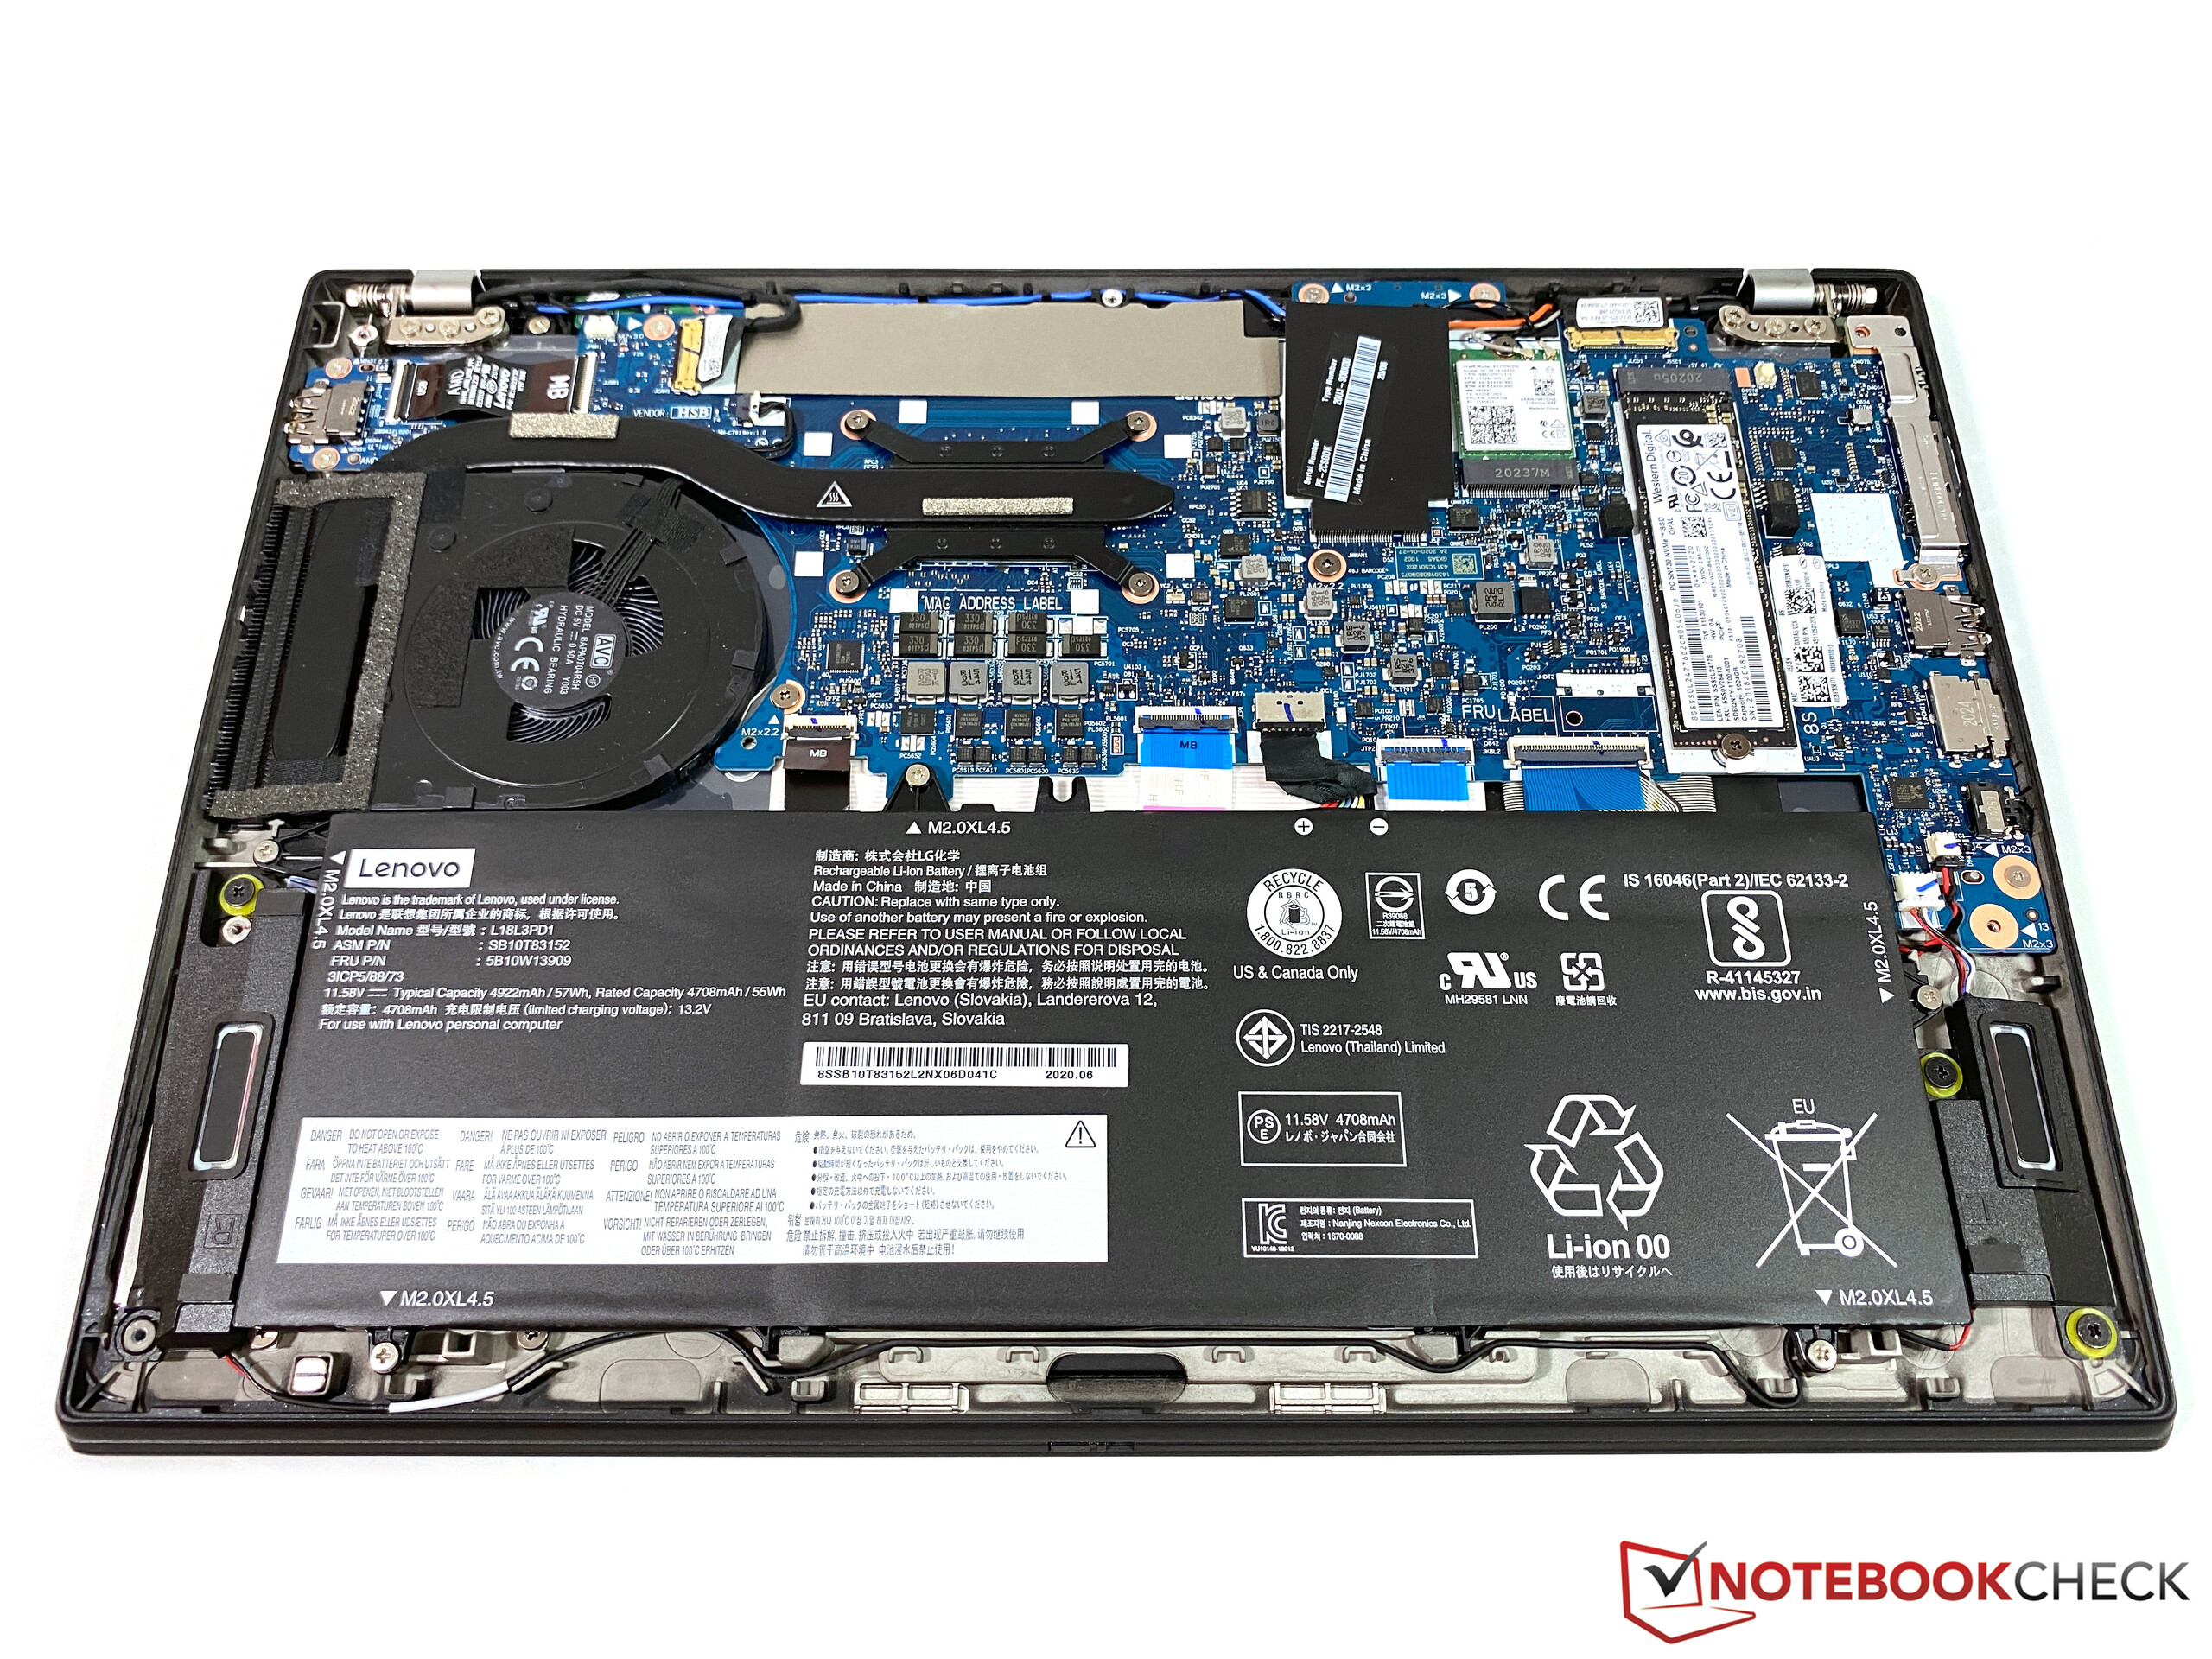
联想的ThinkPad T14现在带有AMD和Intel处理器,因此比较这些设备非常有趣。机身和非常好的输入设备在两台机器上都相同,还有我们很喜欢的LowPower 1080p屏幕也一样。但是,我们不得不再次提到,联想使用四种不同的显示器供应商,但您不知道会得到哪一家。另一方面,4K屏幕仅限于Intel型号。
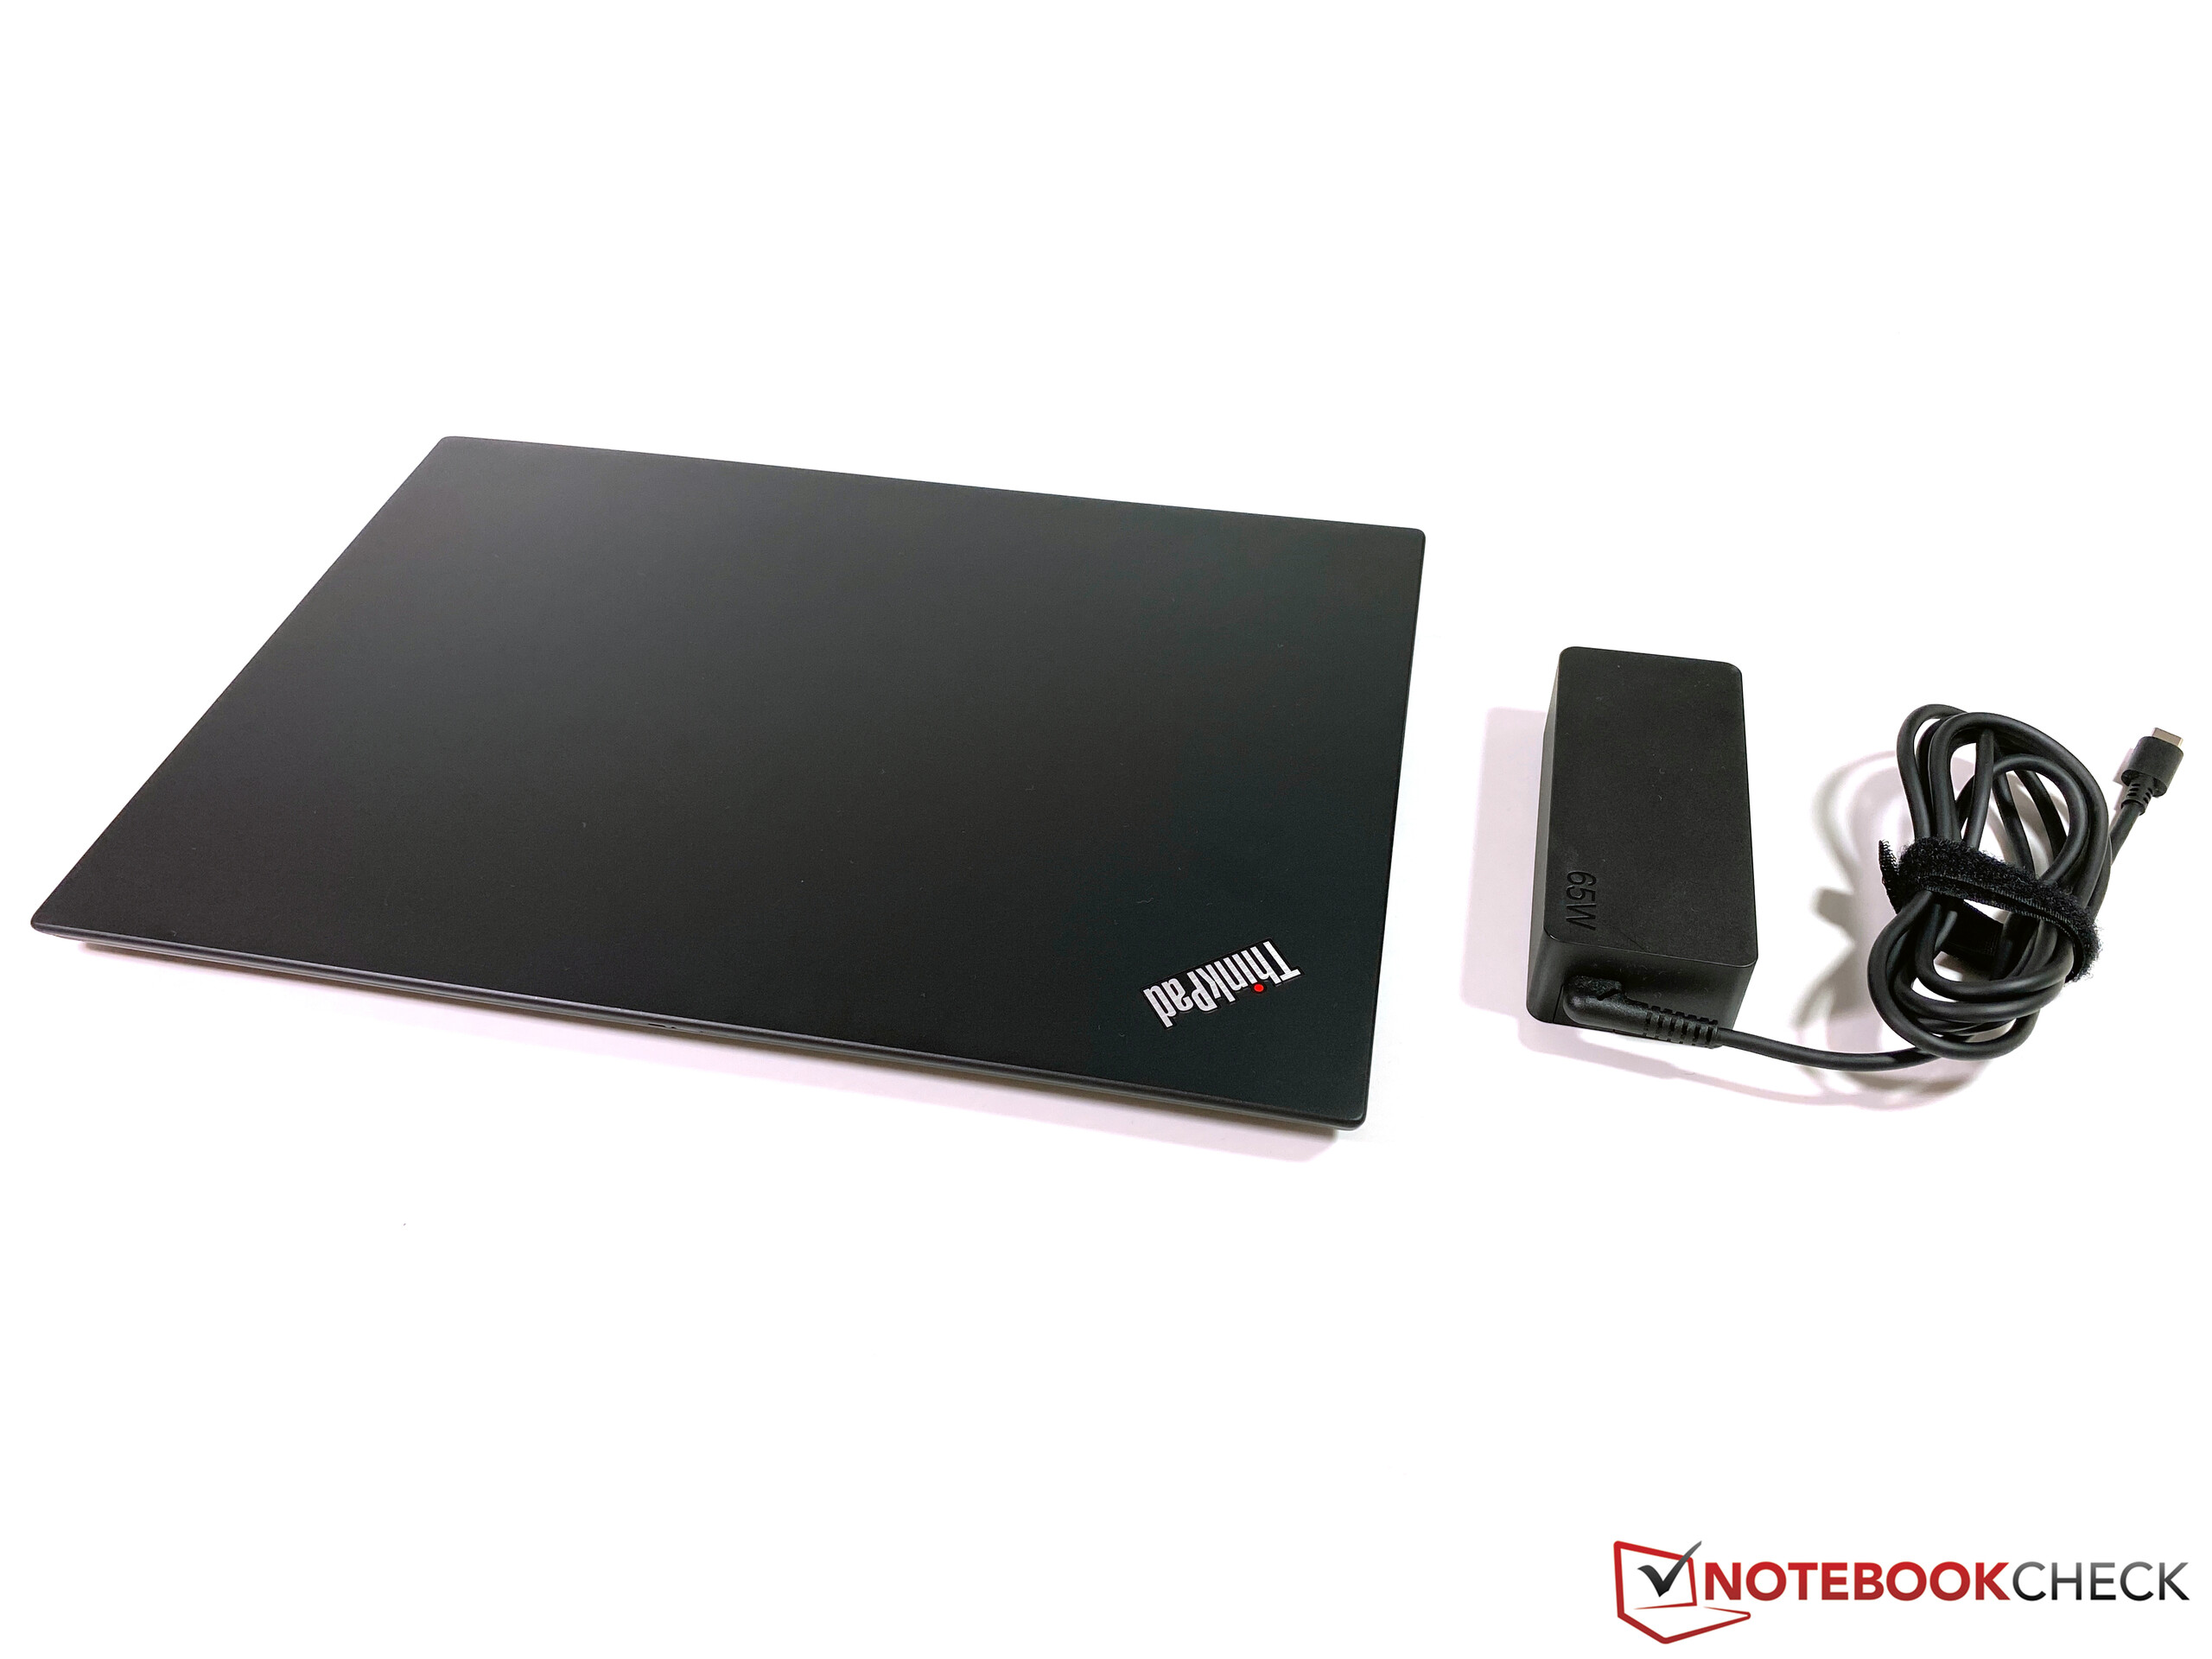
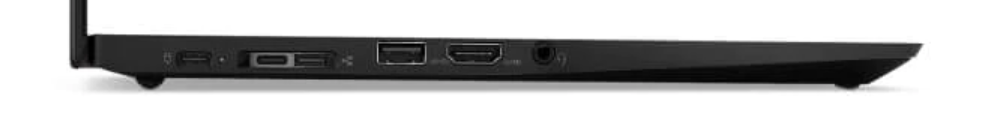
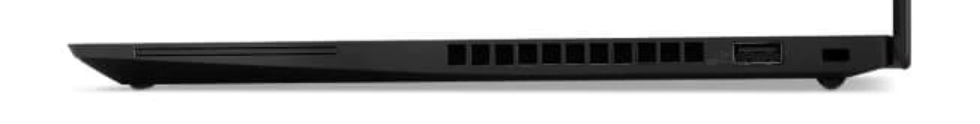
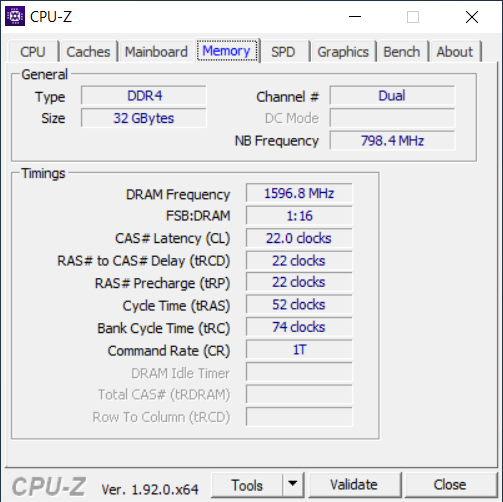
端口方面也有所不同,因为AMD SKU缺少Thunderbolt3。但是,这仅在要使用外部图形卡时才重要。 AMD模型在诸如HDMI 2.0,蓝牙5.1和更快的RAM等功能方面具有一些优势。
最大的区别在于性能。由于对vPro的支持,商用笔记本电脑仍在使用Intel的Comet-Lake-U芯片,因此CPU和集成GPU都无法抗衡AMD的新型移动CPU。您可以获得几乎两倍的CPU性能,甚至在ThinkPad上甚至可以进行一些游戏。
更高的性能和更便宜的价格:配备AMD处理器的ThinkPad T14拥有更好的整体印象。特别是教育优惠版本配备精良,具有很高的性价比。
与Intel型号相比,还有两个缺点:风扇在负载下声音更大,并且空闲功耗也更高。也许AMD T14仍需要一些优化,这可以通过即将推出的BIOS更新来实现。尽管如此,续航时间还是很不错的。然后就是价格,这就是AMD绝对有优势的地方。最便宜的畅销型号的价格相差150欧元(〜178美元),当您想购买Core i7 SKU时,差距会更大。我们使用Ryzen 7 Pro,32 GB RAM和1 TB PCIe-SSD评估的教育模型提供了出色的性价比,价格为1,399欧元(约合1,657美元)。
如果您不需要Thunderbolt 3,并且可以接受10个小时的电池运行时间,那么使用基于AMD的ThinkPad T14会更好。得益于略微更好的键盘和更高的性能,我们也更喜欢T14s AMD,而不是当前的ThinkPad X1 Carbon.
Lenovo ThinkPad T14s-20UJS00K00
- 08/11/2020 v7 (old)
Andreas Osthoff
Price comparison

