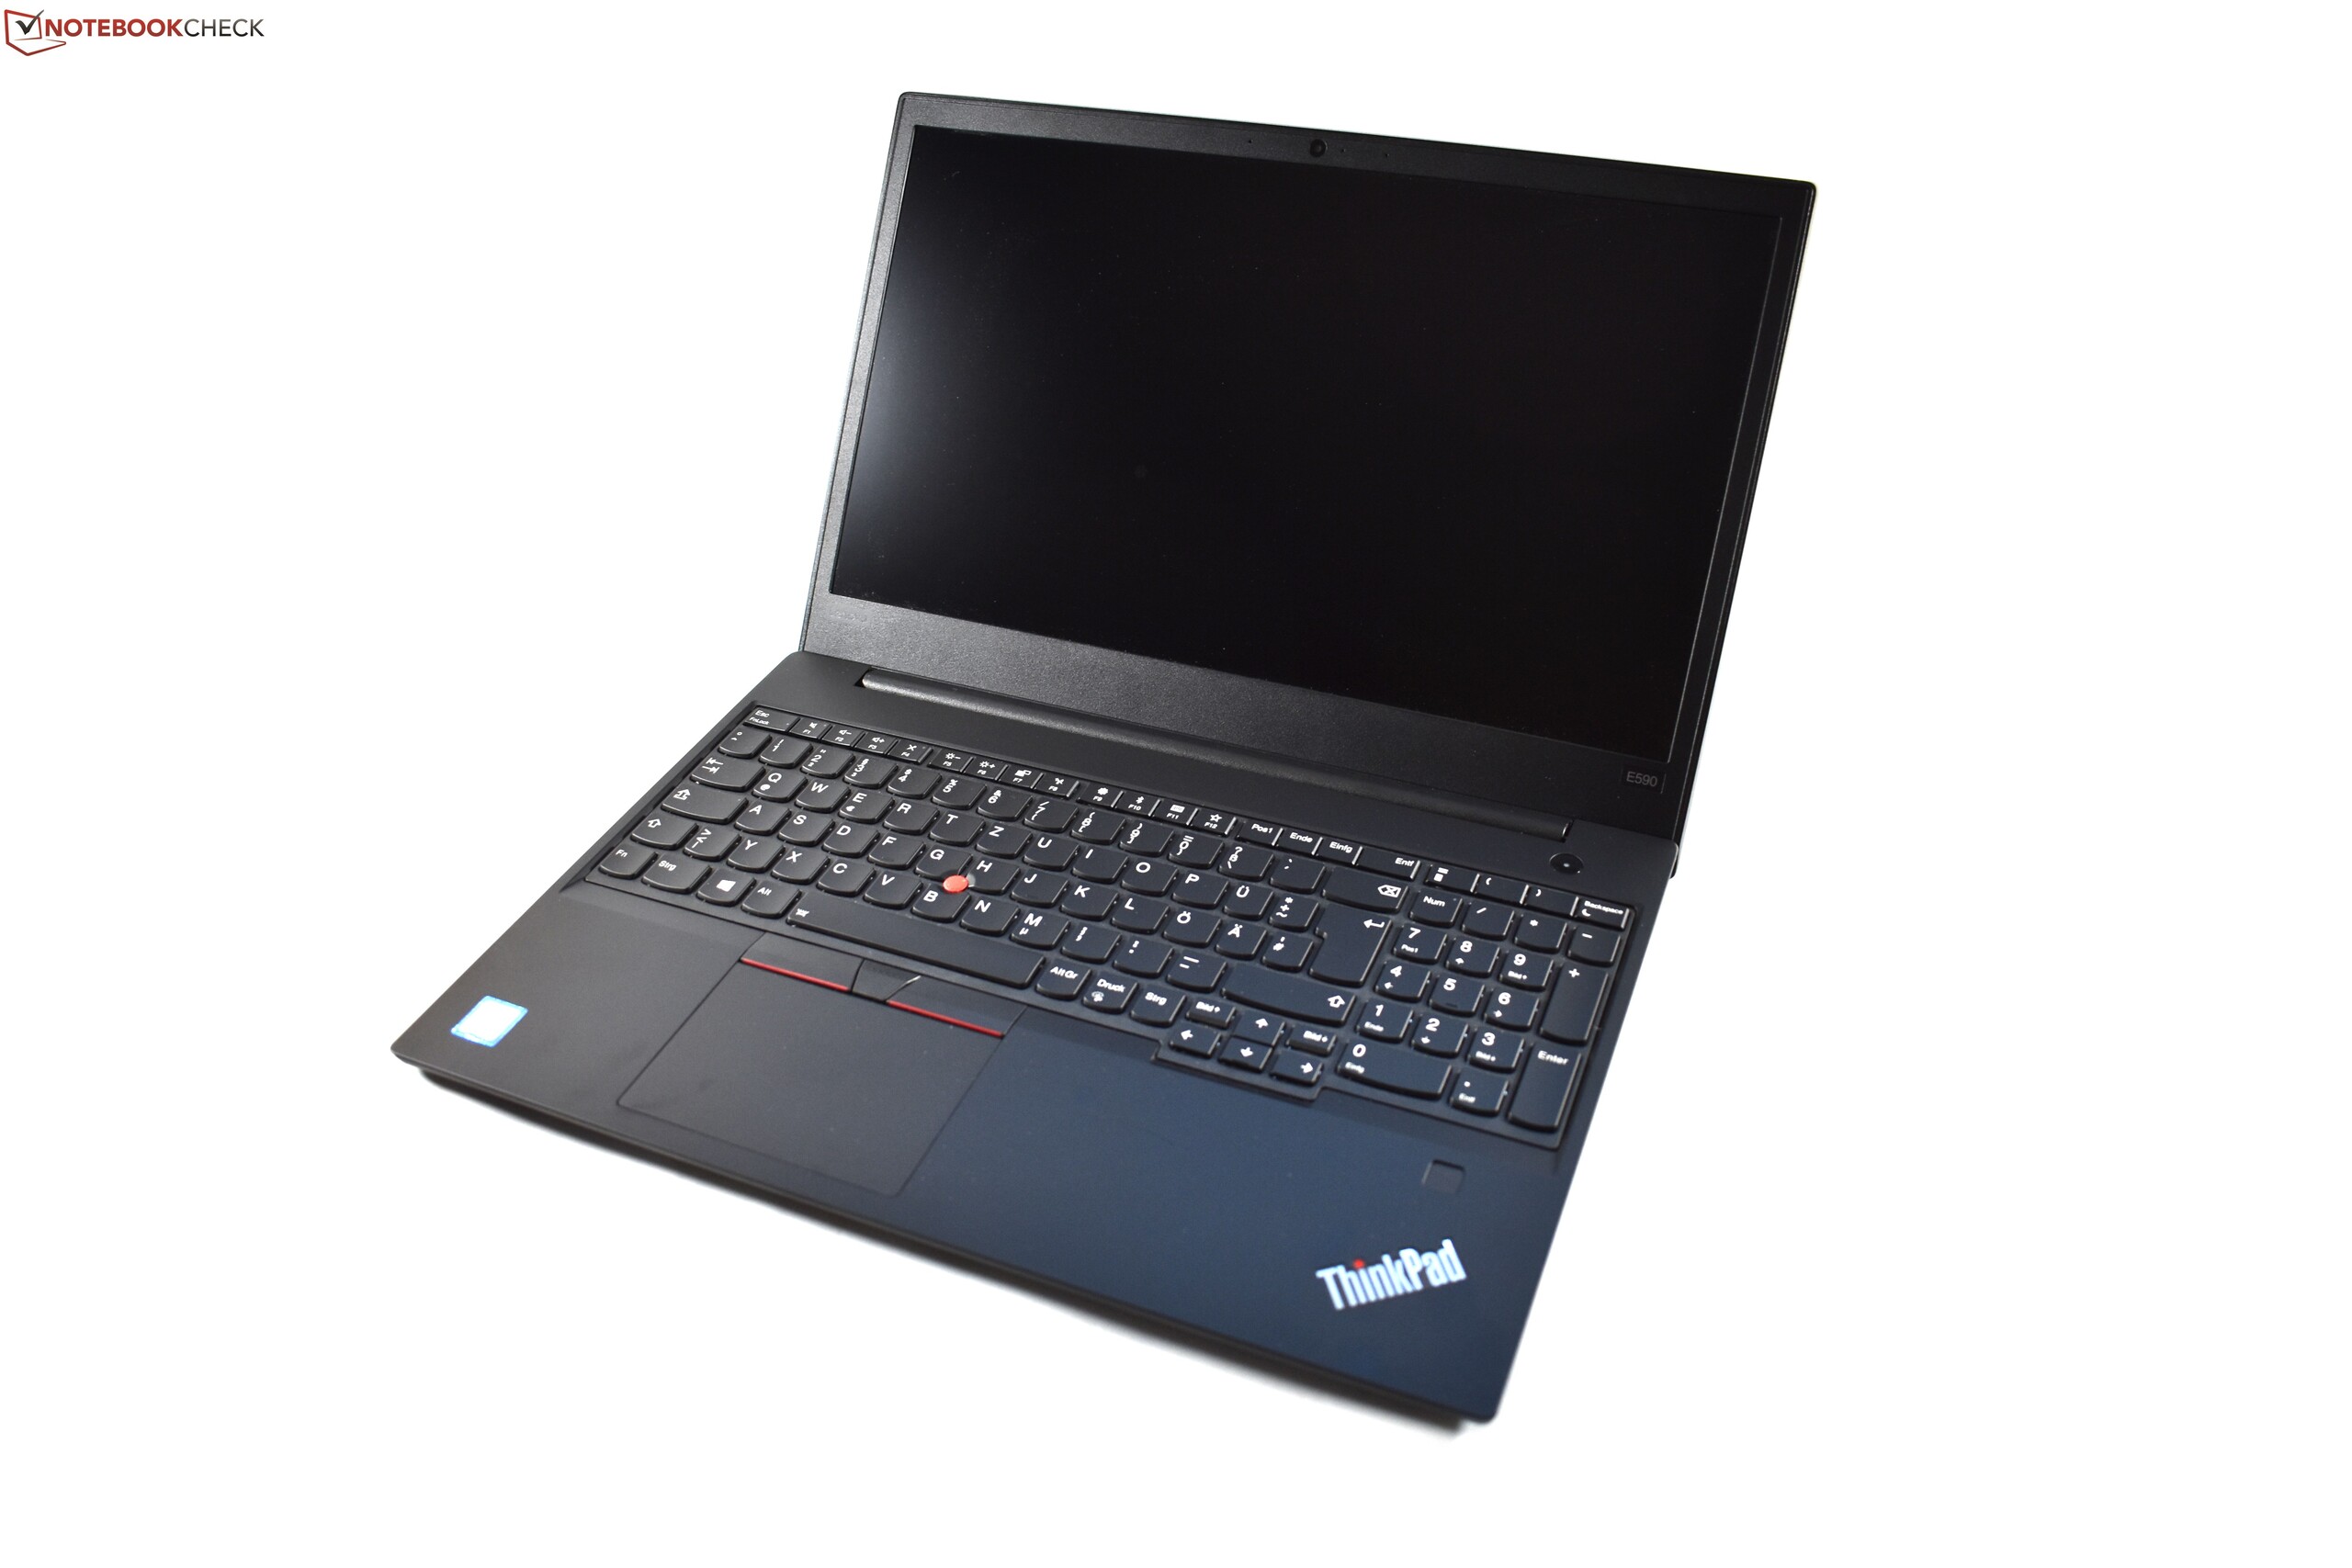
联想ThinkPad E590(i7-8565U, UHD 620, FHD)笔记本电脑评测
| SD Card Reader | |
| average JPG Copy Test (av. of 3 runs) | |
| Lenovo ThinkPad E590-20NC0003GE (Toshiba Exceria Pro M501 64 GB UHS-II) | |
| HP ProBook 450 G6-5TJ93EA (Toshiba Exceria Pro SDXC 64 GB UHS-II) | |
| Average of class Office (19.8 - 198.5, n=22, last 2 years) | |
| Acer TravelMate P2510-G2-MG-50WE (Toshiba Exceria Pro SDXC 64 GB UHS-II) | |
| Toshiba Tecra A50-E-110 (Toshiba Exceria Pro SDXC 64 GB UHS-II) | |
| maximum AS SSD Seq Read Test (1GB) | |
| Lenovo ThinkPad E590-20NC0003GE (Toshiba Exceria Pro M501 64 GB UHS-II) | |
| HP ProBook 450 G6-5TJ93EA (Toshiba Exceria Pro SDXC 64 GB UHS-II) | |
| Average of class Office (27.4 - 249, n=21, last 2 years) | |
| Toshiba Tecra A50-E-110 (Toshiba Exceria Pro SDXC 64 GB UHS-II) | |
| Acer TravelMate P2510-G2-MG-50WE (Toshiba Exceria Pro SDXC 64 GB UHS-II) | |
| Networking | |
| iperf3 transmit AX12 | |
| Lenovo ThinkPad E590-20NC0003GE | |
| HP ProBook 450 G6-5TJ93EA | |
| Acer TravelMate P2510-G2-MG-50WE | |
| Toshiba Tecra A50-E-110 | |
| iperf3 receive AX12 | |
| HP ProBook 450 G6-5TJ93EA | |
| Lenovo ThinkPad E590-20NC0003GE | |
| Acer TravelMate P2510-G2-MG-50WE | |
| Toshiba Tecra A50-E-110 | |
| |||||||||||||||||||||||||
Brightness Distribution: 90 %
Center on Battery: 251 cd/m²
Contrast: 1270:1 (Black: 0.2 cd/m²)
ΔE ColorChecker Calman: 5.6 | ∀{0.5-29.43 Ø4.71}
calibrated: 4.9
ΔE Greyscale Calman: 3.1 | ∀{0.09-98 Ø4.96}
57.1% sRGB (Argyll 1.6.3 3D)
36.3% AdobeRGB 1998 (Argyll 1.6.3 3D)
39.47% AdobeRGB 1998 (Argyll 3D)
57.5% sRGB (Argyll 3D)
38.21% Display P3 (Argyll 3D)
Gamma: 2.22
CCT: 6450 K
| Lenovo ThinkPad E590-20NC0003GE LP156WFC-SPDB, , 1920x1080, 15.6" | HP ProBook 450 G6-5TJ93EA Chi Mei CMN15FE, , 1920x1080, 15.6" | Acer TravelMate P2510-G2-MG-50WE Chi Mei CMN15D3, , 1920x1080, 15.6" | Toshiba Tecra A50-E-110 TOS508F, , 1920x1080, 15.6" | Lenovo ThinkPad E580-20KSCTO1WW BOE NV156FHM-N49, , 1920x1080, 15.6" | |
|---|---|---|---|---|---|
| Display | 12% | 11% | 59% | 3% | |
| Display P3 Coverage (%) | 38.21 | 42.83 12% | 42.27 11% | 65 70% | 39.83 4% |
| sRGB Coverage (%) | 57.5 | 64.2 12% | 63.5 10% | 85.9 49% | 58.5 2% |
| AdobeRGB 1998 Coverage (%) | 39.47 | 44.29 12% | 43.69 11% | 62.8 59% | 41.15 4% |
| Response Times | 13% | -8% | -10% | -29% | |
| Response Time Grey 50% / Grey 80% * (ms) | 40 ? | 34.4 ? 14% | 40 ? -0% | 44 ? -10% | 48.4 ? -21% |
| Response Time Black / White * (ms) | 27.6 ? | 24.4 ? 12% | 32 ? -16% | 30 ? -9% | 37.6 ? -36% |
| PWM Frequency (Hz) | 26040 ? | 25000 ? | 20000 ? | 22030 ? | |
| Screen | 2% | 18% | 3% | -7% | |
| Brightness middle (cd/m²) | 254 | 242 -5% | 259 2% | 290 14% | 292 15% |
| Brightness (cd/m²) | 251 | 226 -10% | 230 -8% | 249 -1% | 272 8% |
| Brightness Distribution (%) | 90 | 88 -2% | 82 -9% | 78 -13% | 84 -7% |
| Black Level * (cd/m²) | 0.2 | 0.21 -5% | 0.19 5% | 0.38 -90% | 0.3 -50% |
| Contrast (:1) | 1270 | 1152 -9% | 1363 7% | 763 -40% | 973 -23% |
| Colorchecker dE 2000 * | 5.6 | 4.7 16% | 3.13 44% | 4.35 22% | 5.8 -4% |
| Colorchecker dE 2000 max. * | 15.4 | 18.5 -20% | 7.81 49% | 11.06 28% | 22.4 -45% |
| Colorchecker dE 2000 calibrated * | 4.9 | 4 18% | 3.09 37% | ||
| Greyscale dE 2000 * | 3.1 | 2.7 13% | 1.42 54% | 3.01 3% | 2.3 26% |
| Gamma | 2.22 99% | 2.26 97% | 2.36 93% | 2.44 90% | 2.12 104% |
| CCT | 6450 101% | 6442 101% | 6391 102% | 7198 90% | 6223 104% |
| Color Space (Percent of AdobeRGB 1998) (%) | 36.3 | 40.8 12% | 40 10% | 56 54% | 37.6 4% |
| Color Space (Percent of sRGB) (%) | 57.1 | 64 12% | 63 10% | 86 51% | 58 2% |
| Total Average (Program / Settings) | 9% /
5% | 7% /
14% | 17% /
12% | -11% /
-8% |
* ... smaller is better
Display Response Times
| ↔ Response Time Black to White | ||
|---|---|---|
| 27.6 ms ... rise ↗ and fall ↘ combined | ↗ 16.8 ms rise | 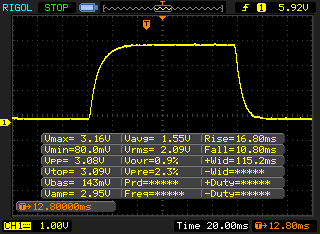 |
| ↘ 10.8 ms fall | ||
| The screen shows relatively slow response rates in our tests and may be too slow for gamers. In comparison, all tested devices range from 0.1 (minimum) to 240 (maximum) ms. » 70 % of all devices are better. This means that the measured response time is worse than the average of all tested devices (19.8 ms). | ||
| ↔ Response Time 50% Grey to 80% Grey | ||
| 40 ms ... rise ↗ and fall ↘ combined | ↗ 21.2 ms rise | 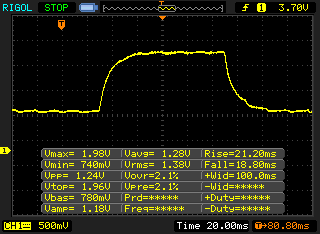 |
| ↘ 18.8 ms fall | ||
| The screen shows slow response rates in our tests and will be unsatisfactory for gamers. In comparison, all tested devices range from 0.165 (minimum) to 636 (maximum) ms. » 61 % of all devices are better. This means that the measured response time is worse than the average of all tested devices (30.9 ms). | ||
Screen Flickering / PWM (Pulse-Width Modulation)
| Screen flickering / PWM not detected | 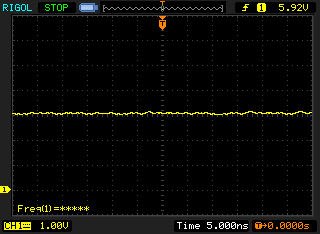 | ||
In comparison: 52 % of all tested devices do not use PWM to dim the display. If PWM was detected, an average of 7744 (minimum: 5 - maximum: 343500) Hz was measured. | |||
| Cinebench R15 | |
| CPU Single 64Bit | |
| Average of class Office (99.5 - 316, n=77, last 2 years) | |
| Lenovo ThinkPad E590-20NC0003GE | |
| Average Intel Core i7-8565U (138.3 - 193, n=51) | |
| Lenovo ThinkPad E580-20KS001RGE | |
| Lenovo ThinkPad E580-20KSCTO1WW | |
| Acer TravelMate P2510-G2-MG-50WE | |
| Toshiba Tecra A50-E-110 | |
| HP ProBook 450 G6-5TJ93EA | |
| CPU Multi 64Bit | |
| Average of class Office (250 - 3380, n=77, last 2 years) | |
| Average Intel Core i7-8565U (452 - 815, n=52) | |
| Lenovo ThinkPad E580-20KSCTO1WW | |
| HP ProBook 450 G6-5TJ93EA | |
| Lenovo ThinkPad E590-20NC0003GE | |
| Acer TravelMate P2510-G2-MG-50WE | |
| Lenovo ThinkPad E580-20KS001RGE | |
| Toshiba Tecra A50-E-110 | |
| PCMark 8 | |
| Home Score Accelerated v2 | |
| Average of class Office (n=1last 2 years) | |
| Lenovo ThinkPad E580-20KS001RGE | |
| Lenovo ThinkPad E580-20KSCTO1WW | |
| Average Intel Core i7-8565U, Intel UHD Graphics 620 (2577 - 4179, n=20) | |
| Acer TravelMate P2510-G2-MG-50WE | |
| HP ProBook 450 G6-5TJ93EA | |
| Toshiba Tecra A50-E-110 | |
| Lenovo ThinkPad E590-20NC0003GE | |
| Work Score Accelerated v2 | |
| Average of class Office (n=1last 2 years) | |
| Lenovo ThinkPad E580-20KS001RGE | |
| HP ProBook 450 G6-5TJ93EA | |
| Lenovo ThinkPad E580-20KSCTO1WW | |
| Acer TravelMate P2510-G2-MG-50WE | |
| Average Intel Core i7-8565U, Intel UHD Graphics 620 (3596 - 5189, n=19) | |
| Lenovo ThinkPad E590-20NC0003GE | |
| PCMark 8 Home Score Accelerated v2 | 2577 points | |
| PCMark 8 Work Score Accelerated v2 | 3596 points | |
| PCMark 10 Score | 2486 points | |
Help | ||
| Lenovo ThinkPad E590-20NC0003GE Toshiba KBG30ZMT512G | HP ProBook 450 G6-5TJ93EA Samsung SSD PM981 MZVLB512HAJQ | Acer TravelMate P2510-G2-MG-50WE SK Hynix HFS256G39TND-N210A | Toshiba Tecra A50-E-110 Samsung SSD PM871b MZNLN256HAJQ | Lenovo ThinkPad E580-20KSCTO1WW Toshiba KBG30ZMT128G | Average Toshiba KBG30ZMT512G | |
|---|---|---|---|---|---|---|
| CrystalDiskMark 5.2 / 6 | 160% | 1% | 12% | -7% | 42% | |
| Write Seq (MB/s) | 624 | 1669 167% | 257.1 -59% | 505 -19% | 131.1 -79% | 624 ? 0% |
| Read Seq (MB/s) | 835 | 2224 166% | 476.3 -43% | 528 -37% | 910 9% | 838 ? 0% |
| Write 4K Q32T1 (MB/s) | 87.4 | 410.4 370% | 202.6 132% | 204.9 134% | 122.1 40% | 163.4 ? 87% |
| Read 4K Q32T1 (MB/s) | 135.9 | 338.1 149% | 282 108% | 226.6 67% | 199.3 47% | 366 ? 169% |
| Write Seq Q32T1 (MB/s) | 784 | 1979 152% | 265.6 -66% | 533 -32% | 133 -83% | 763 ? -3% |
| Read Seq Q32T1 (MB/s) | 1623 | 3368 108% | 559 -66% | 551 -66% | 935 -42% | 1606 ? -1% |
| Write 4K (MB/s) | 53.4 | 126.1 136% | 71.8 34% | 80.1 50% | 81.8 53% | 81.5 ? 53% |
| Read 4K (MB/s) | 33.03 | 43.92 33% | 21.23 -36% | 32.05 -3% | 33.33 1% | 42.6 ? 29% |

| 3DMark 11 - 1280x720 Performance GPU | |
| Average of class Office (2551 - 18313, n=72, last 2 years) | |
| Lenovo ThinkPad E580-20KS001RGE | |
| HP ProBook 450 G6-5TJ93EA | |
| Acer TravelMate P2510-G2-MG-50WE | |
| Lenovo ThinkPad E590-20NC0003GE | |
| Average Intel UHD Graphics 620 (1144 - 3432, n=244) | |
| Toshiba Tecra A50-E-110 | |
| Lenovo ThinkPad E580-20KSCTO1WW | |
| 3DMark | |
| 1280x720 Cloud Gate Standard Graphics | |
| Average of class Office (11640 - 118515, n=38, last 2 years) | |
| Lenovo ThinkPad E580-20KS001RGE | |
| HP ProBook 450 G6-5TJ93EA | |
| Acer TravelMate P2510-G2-MG-50WE | |
| Lenovo ThinkPad E590-20NC0003GE | |
| Average Intel UHD Graphics 620 (6205 - 16400, n=225) | |
| Lenovo ThinkPad E580-20KSCTO1WW | |
| 1920x1080 Fire Strike Graphics | |
| Average of class Office (736 - 21871, n=75, last 2 years) | |
| Lenovo ThinkPad E580-20KS001RGE | |
| HP ProBook 450 G6-5TJ93EA | |
| Acer TravelMate P2510-G2-MG-50WE | |
| Lenovo ThinkPad E590-20NC0003GE | |
| Average Intel UHD Graphics 620 (557 - 2608, n=213) | |
| Lenovo ThinkPad E580-20KSCTO1WW | |
| 2560x1440 Time Spy Graphics | |
| Average of class Office (493 - 6679, n=70, last 2 years) | |
| Average Intel UHD Graphics 620 (299 - 797, n=88) | |
| Lenovo ThinkPad E580-20KSCTO1WW | |
| 3DMark 11 Performance | 1989 points | |
| 3DMark Cloud Gate Standard Score | 6847 points | |
| 3DMark Fire Strike Score | 1068 points | |
Help | ||
| low | med. | high | ultra | |
|---|---|---|---|---|
| BioShock Infinite (2013) | 62.5 | 32.4 | 26.3 | 8.4 |
| The Witcher 3 (2015) | 16.6 | |||
| Rise of the Tomb Raider (2016) | 21.5 |
Noise level
| Idle |
| 29.3 / 29.3 / 29.3 dB(A) |
| Load |
| 30.6 / 30.6 dB(A) |
 | ||
30 dB silent 40 dB(A) audible 50 dB(A) loud |
||
min: | ||
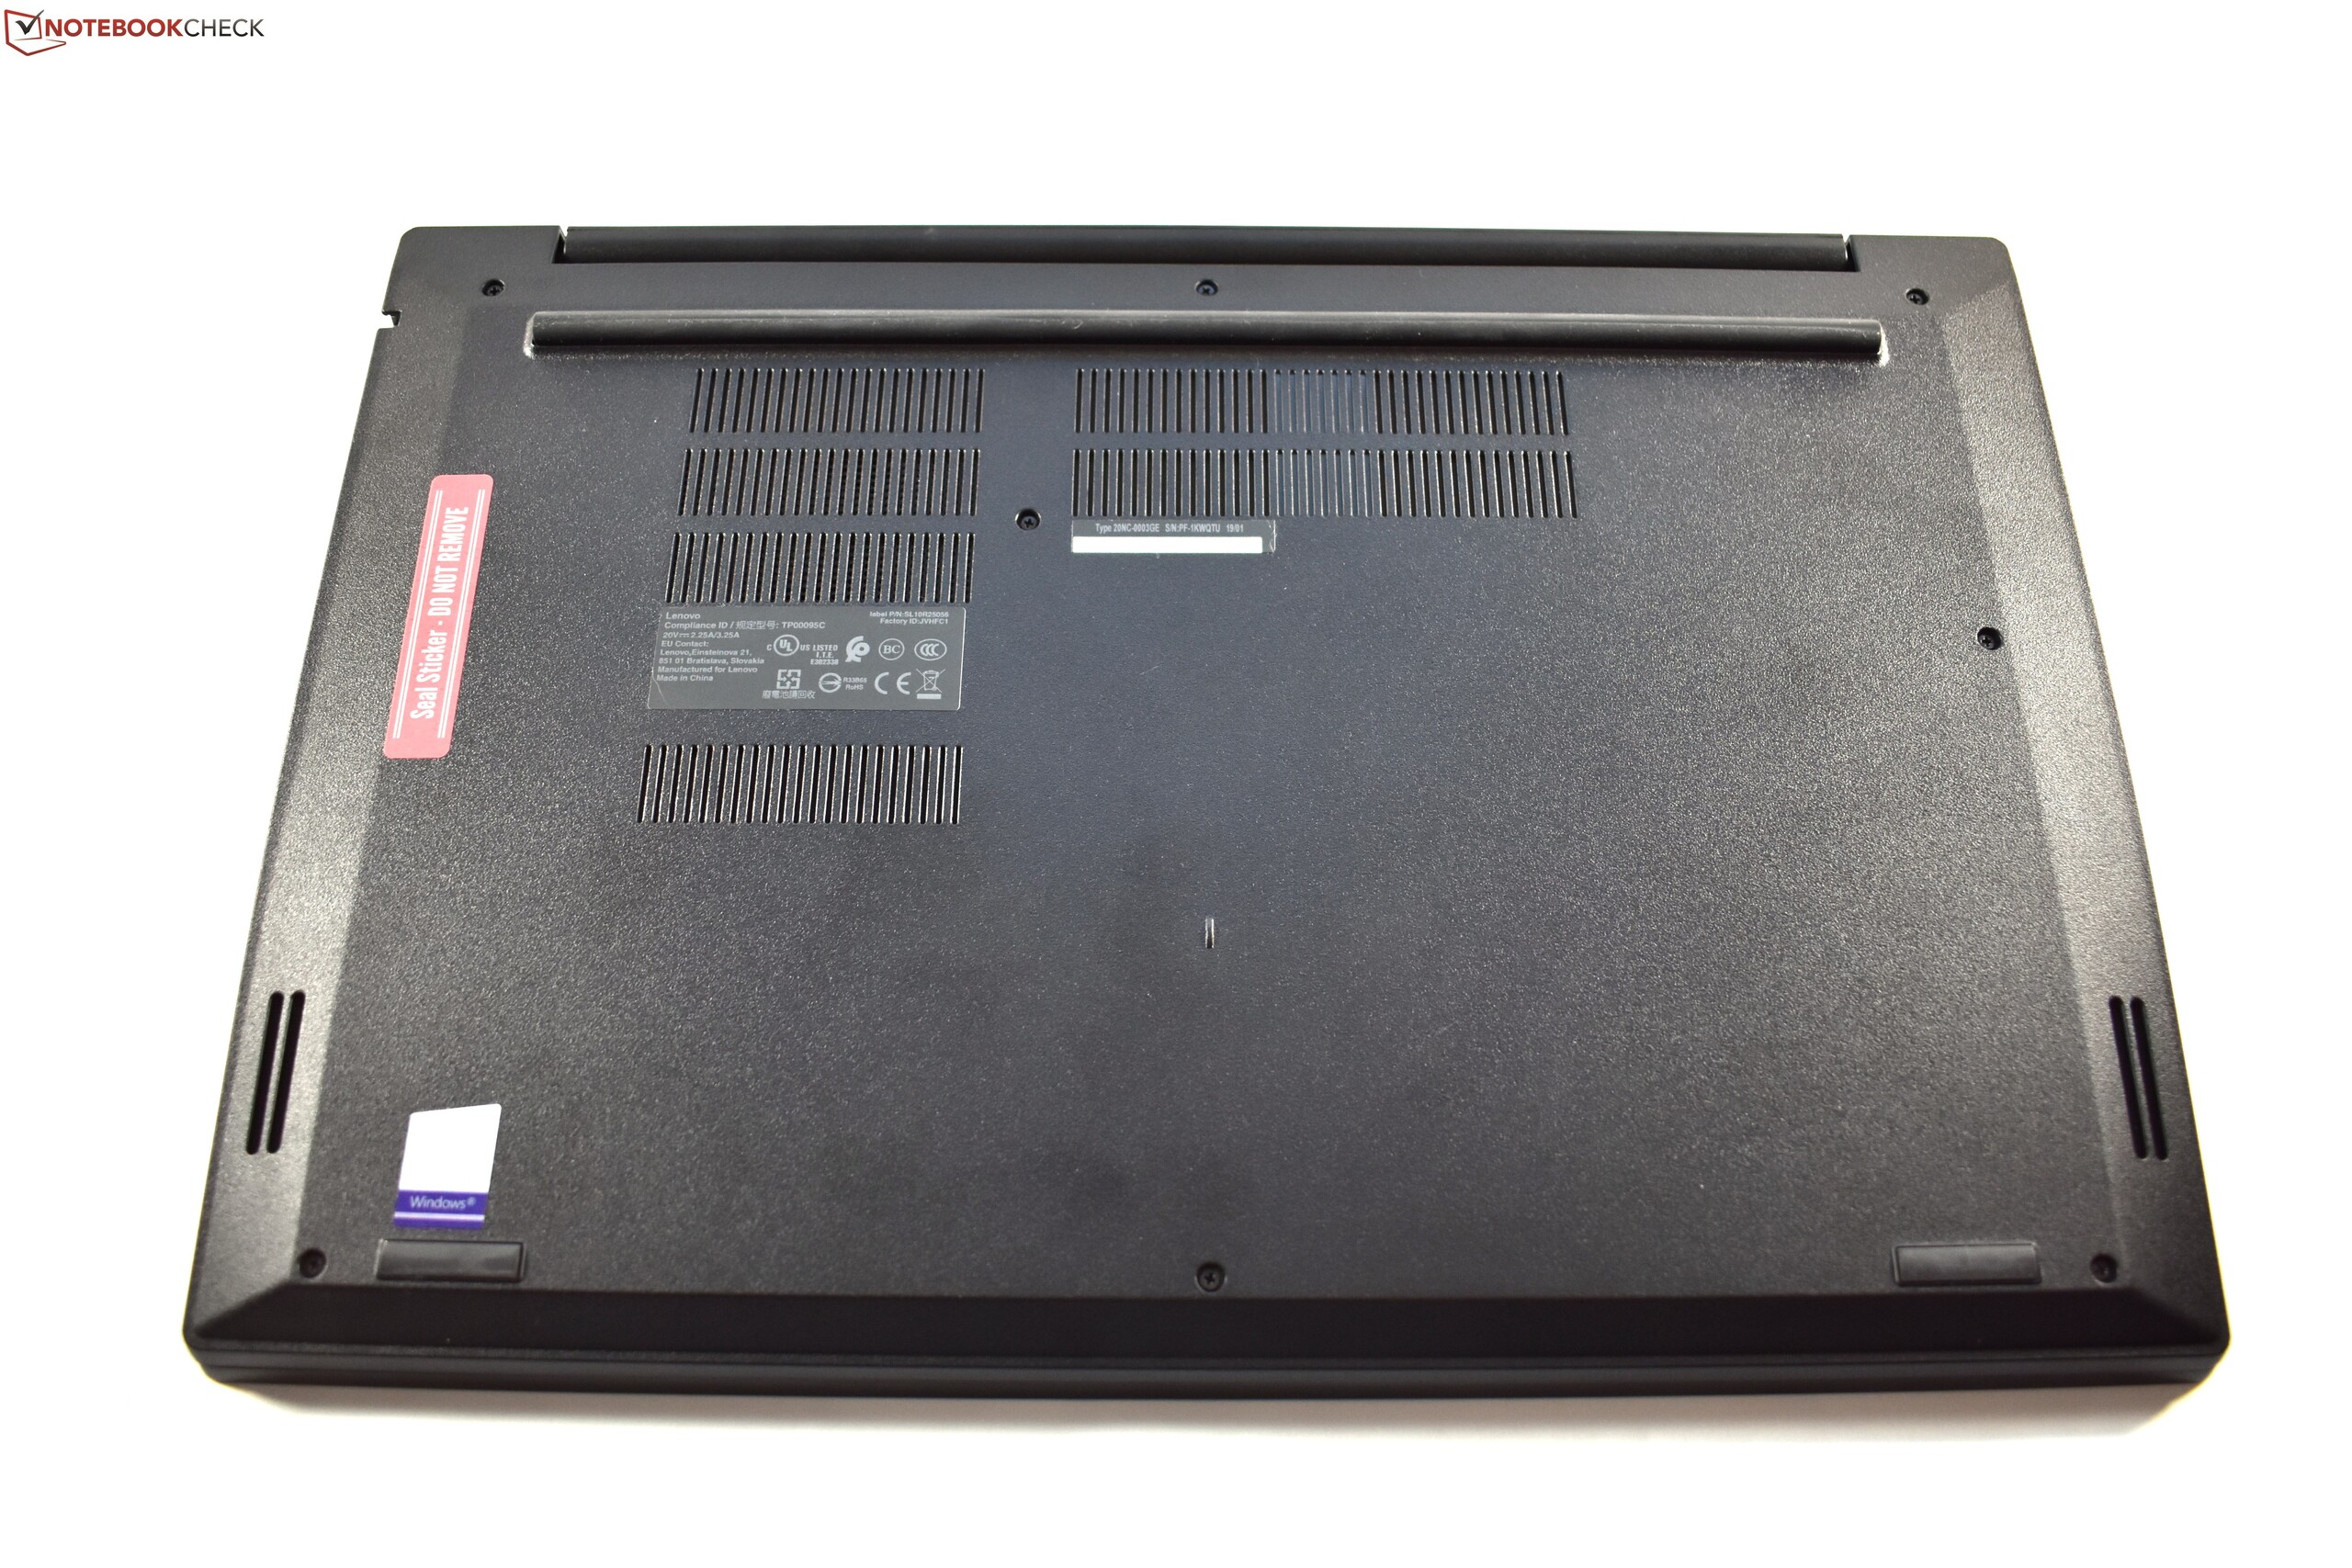
(±) The maximum temperature on the upper side is 43.8 °C / 111 F, compared to the average of 34.3 °C / 94 F, ranging from 21.2 to 62.5 °C for the class Office.
(±) The bottom heats up to a maximum of 43.9 °C / 111 F, compared to the average of 36.8 °C / 98 F
(+) In idle usage, the average temperature for the upper side is 24.1 °C / 75 F, compared to the device average of 29.5 °C / 85 F.
(+) The palmrests and touchpad are cooler than skin temperature with a maximum of 23.5 °C / 74.3 F and are therefore cool to the touch.
(+) The average temperature of the palmrest area of similar devices was 27.6 °C / 81.7 F (+4.1 °C / 7.4 F).
Lenovo ThinkPad E590-20NC0003GE audio analysis
(-) | not very loud speakers (70 dB)
Bass 100 - 315 Hz
(-) | nearly no bass - on average 19.7% lower than median
(±) | linearity of bass is average (13.6% delta to prev. frequency)
Mids 400 - 2000 Hz
(+) | balanced mids - only 4.1% away from median
(+) | mids are linear (6.3% delta to prev. frequency)
Highs 2 - 16 kHz
(+) | balanced highs - only 3.5% away from median
(±) | linearity of highs is average (14.5% delta to prev. frequency)
Overall 100 - 16.000 Hz
(±) | linearity of overall sound is average (24.7% difference to median)
Compared to same class
» 73% of all tested devices in this class were better, 7% similar, 20% worse
» The best had a delta of 7%, average was 21%, worst was 53%
Compared to all devices tested
» 75% of all tested devices were better, 5% similar, 19% worse
» The best had a delta of 4%, average was 23%, worst was 134%
HP ProBook 450 G6-5TJ93EA audio analysis
(±) | speaker loudness is average but good (74.4 dB)
Bass 100 - 315 Hz
(-) | nearly no bass - on average 21.8% lower than median
(±) | linearity of bass is average (10.6% delta to prev. frequency)
Mids 400 - 2000 Hz
(±) | higher mids - on average 5.6% higher than median
(±) | linearity of mids is average (7.7% delta to prev. frequency)
Highs 2 - 16 kHz
(±) | higher highs - on average 5.1% higher than median
(+) | highs are linear (4.6% delta to prev. frequency)
Overall 100 - 16.000 Hz
(±) | linearity of overall sound is average (27.1% difference to median)
Compared to same class
» 84% of all tested devices in this class were better, 5% similar, 11% worse
» The best had a delta of 7%, average was 21%, worst was 53%
Compared to all devices tested
» 83% of all tested devices were better, 4% similar, 14% worse
» The best had a delta of 4%, average was 23%, worst was 134%
| Off / Standby | |
| Idle | |
| Load |
|
Key:
min: | |
| Lenovo ThinkPad E590-20NC0003GE i7-8565U, UHD Graphics 620, Toshiba KBG30ZMT512G, IPS LED, 1920x1080, 15.6" | Lenovo ThinkPad E580-20KSCTO1WW i5-8250U, UHD Graphics 620, Toshiba KBG30ZMT128G, IPS LED, 1920x1080, 15.6" | HP ProBook 450 G6-5TJ93EA i7-8565U, GeForce MX130, Samsung SSD PM981 MZVLB512HAJQ, IPS, 1920x1080, 15.6" | Acer TravelMate P2510-G2-MG-50WE i5-8250U, GeForce MX130, SK Hynix HFS256G39TND-N210A, IPS, 1920x1080, 15.6" | Toshiba Tecra A50-E-110 i5-8250U, UHD Graphics 620, Samsung SSD PM871b MZNLN256HAJQ, IPS, 1920x1080, 15.6" | Average Intel UHD Graphics 620 | Average of class Office | |
|---|---|---|---|---|---|---|---|
| Power Consumption | 9% | -21% | -12% | 5% | 0% | -17% | |
| Idle Minimum * (Watt) | 3.72 | 3.4 9% | 3.12 16% | 3.3 11% | 3.8 -2% | 3.81 ? -2% | 4.25 ? -14% |
| Idle Average * (Watt) | 7.8 | 6.7 14% | 6.3 19% | 5.6 28% | 7.7 1% | 6.94 ? 11% | 7.3 ? 6% |
| Idle Maximum * (Watt) | 10.32 | 7.7 25% | 9.78 5% | 7.8 24% | 9.3 10% | 8.75 ? 15% | 8.57 ? 17% |
| Load Average * (Watt) | 30.24 | 31.1 -3% | 57.6 -90% | 54 -79% | 31 -3% | 35 ? -16% | 43.8 ? -45% |
| Load Maximum * (Watt) | 44 | 42.9 2% | 67.3 -53% | 63 -43% | 34.6 21% | 47.5 ? -8% | 64.5 ? -47% |
| Witcher 3 ultra * (Watt) | 42 |
* ... smaller is better
| Lenovo ThinkPad E590-20NC0003GE i7-8565U, UHD Graphics 620, 45 Wh | Lenovo ThinkPad E580-20KSCTO1WW i5-8250U, UHD Graphics 620, 45 Wh | HP ProBook 450 G6-5TJ93EA i7-8565U, GeForce MX130, 45 Wh | Acer TravelMate P2510-G2-MG-50WE i5-8250U, GeForce MX130, 48 Wh | Toshiba Tecra A50-E-110 i5-8250U, UHD Graphics 620, 45 Wh | Average of class Office | |
|---|---|---|---|---|---|---|
| Battery runtime | -9% | 12% | 15% | -23% | 53% | |
| Reader / Idle (h) | 18.3 | 14.4 -21% | 14.6 -20% | 22.2 ? 21% | ||
| H.264 (h) | 8.4 | 7.3 -13% | 7.7 -8% | 8.6 2% | 15.4 ? 83% | |
| WiFi v1.3 (h) | 6.4 | 7 9% | 9.7 52% | 8.4 31% | 4.9 -23% | 13.2 ? 106% |
| Load (h) | 1.8 | 1.6 -11% | 2.2 22% | 2 11% | 1.808 ? 0% |
Pros
Cons
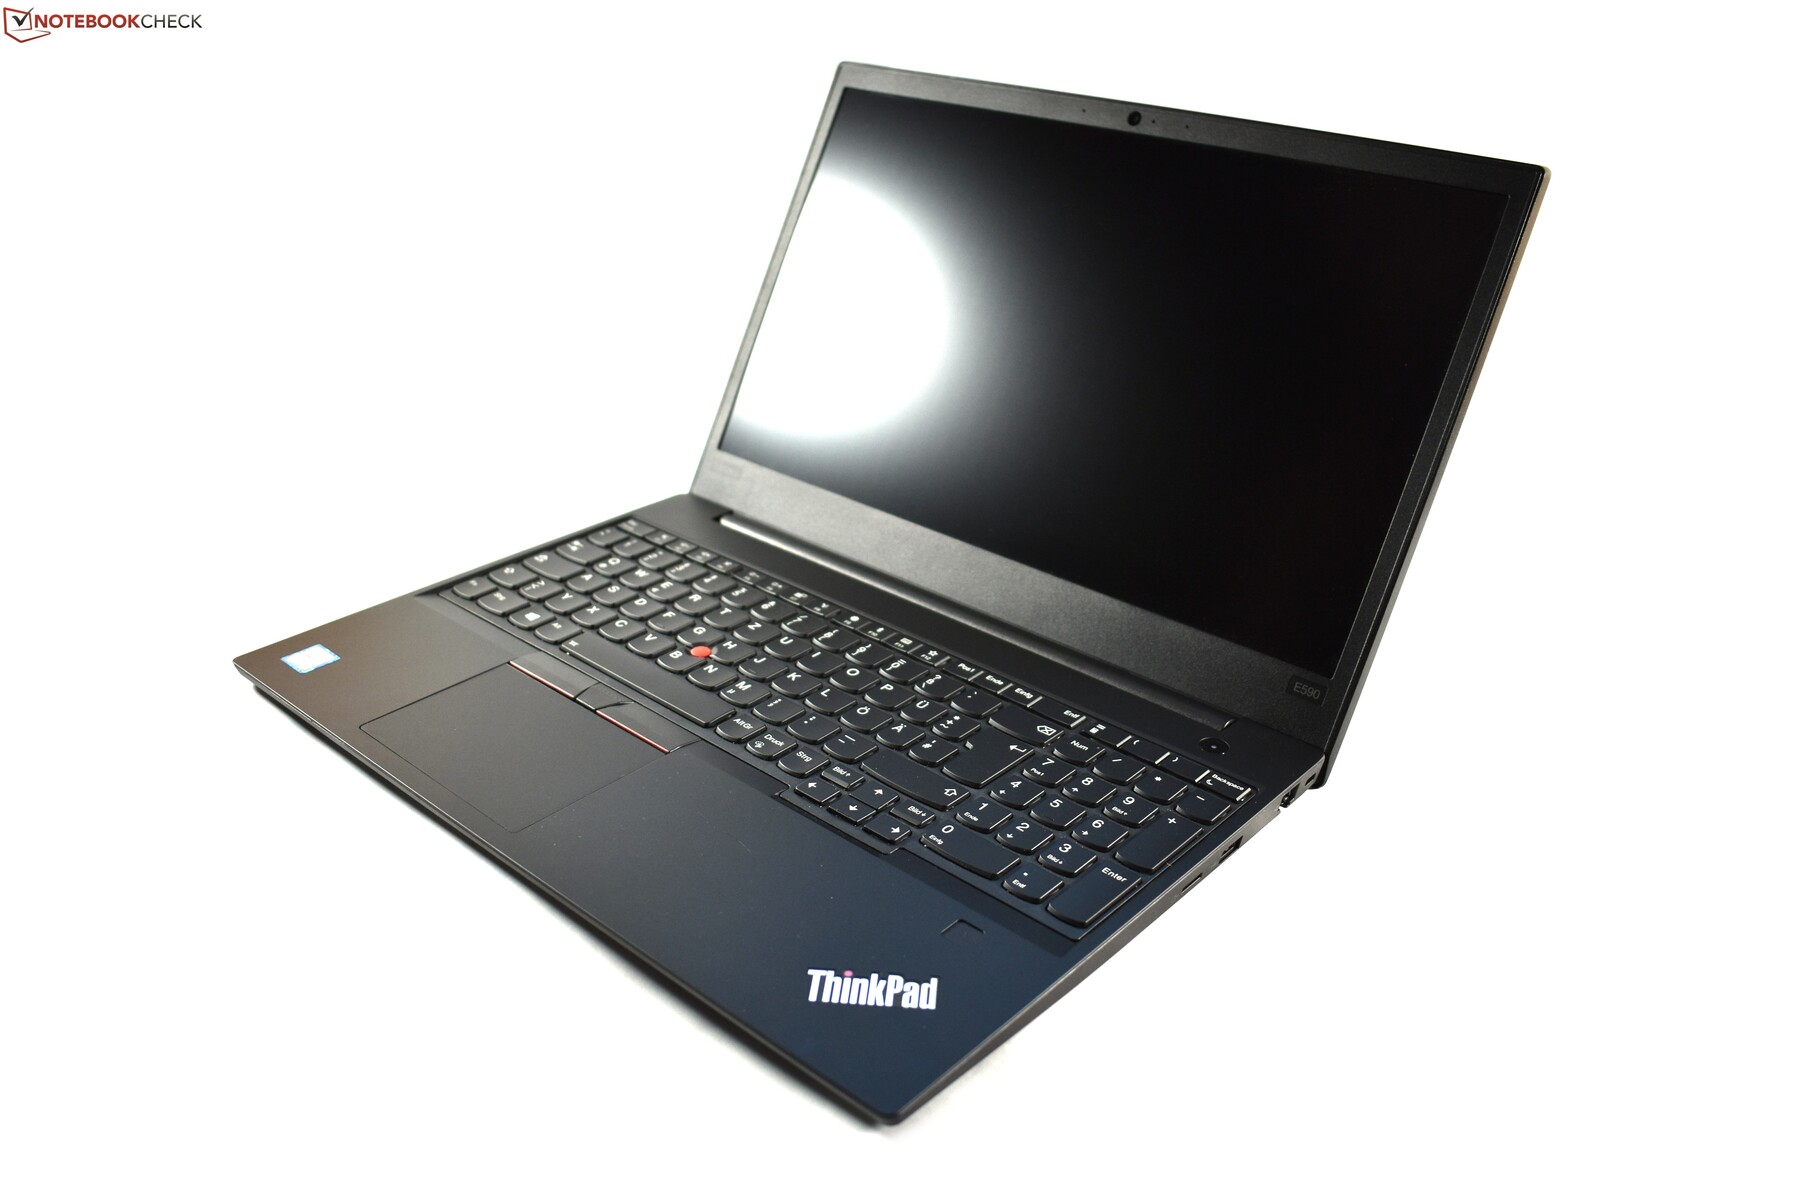
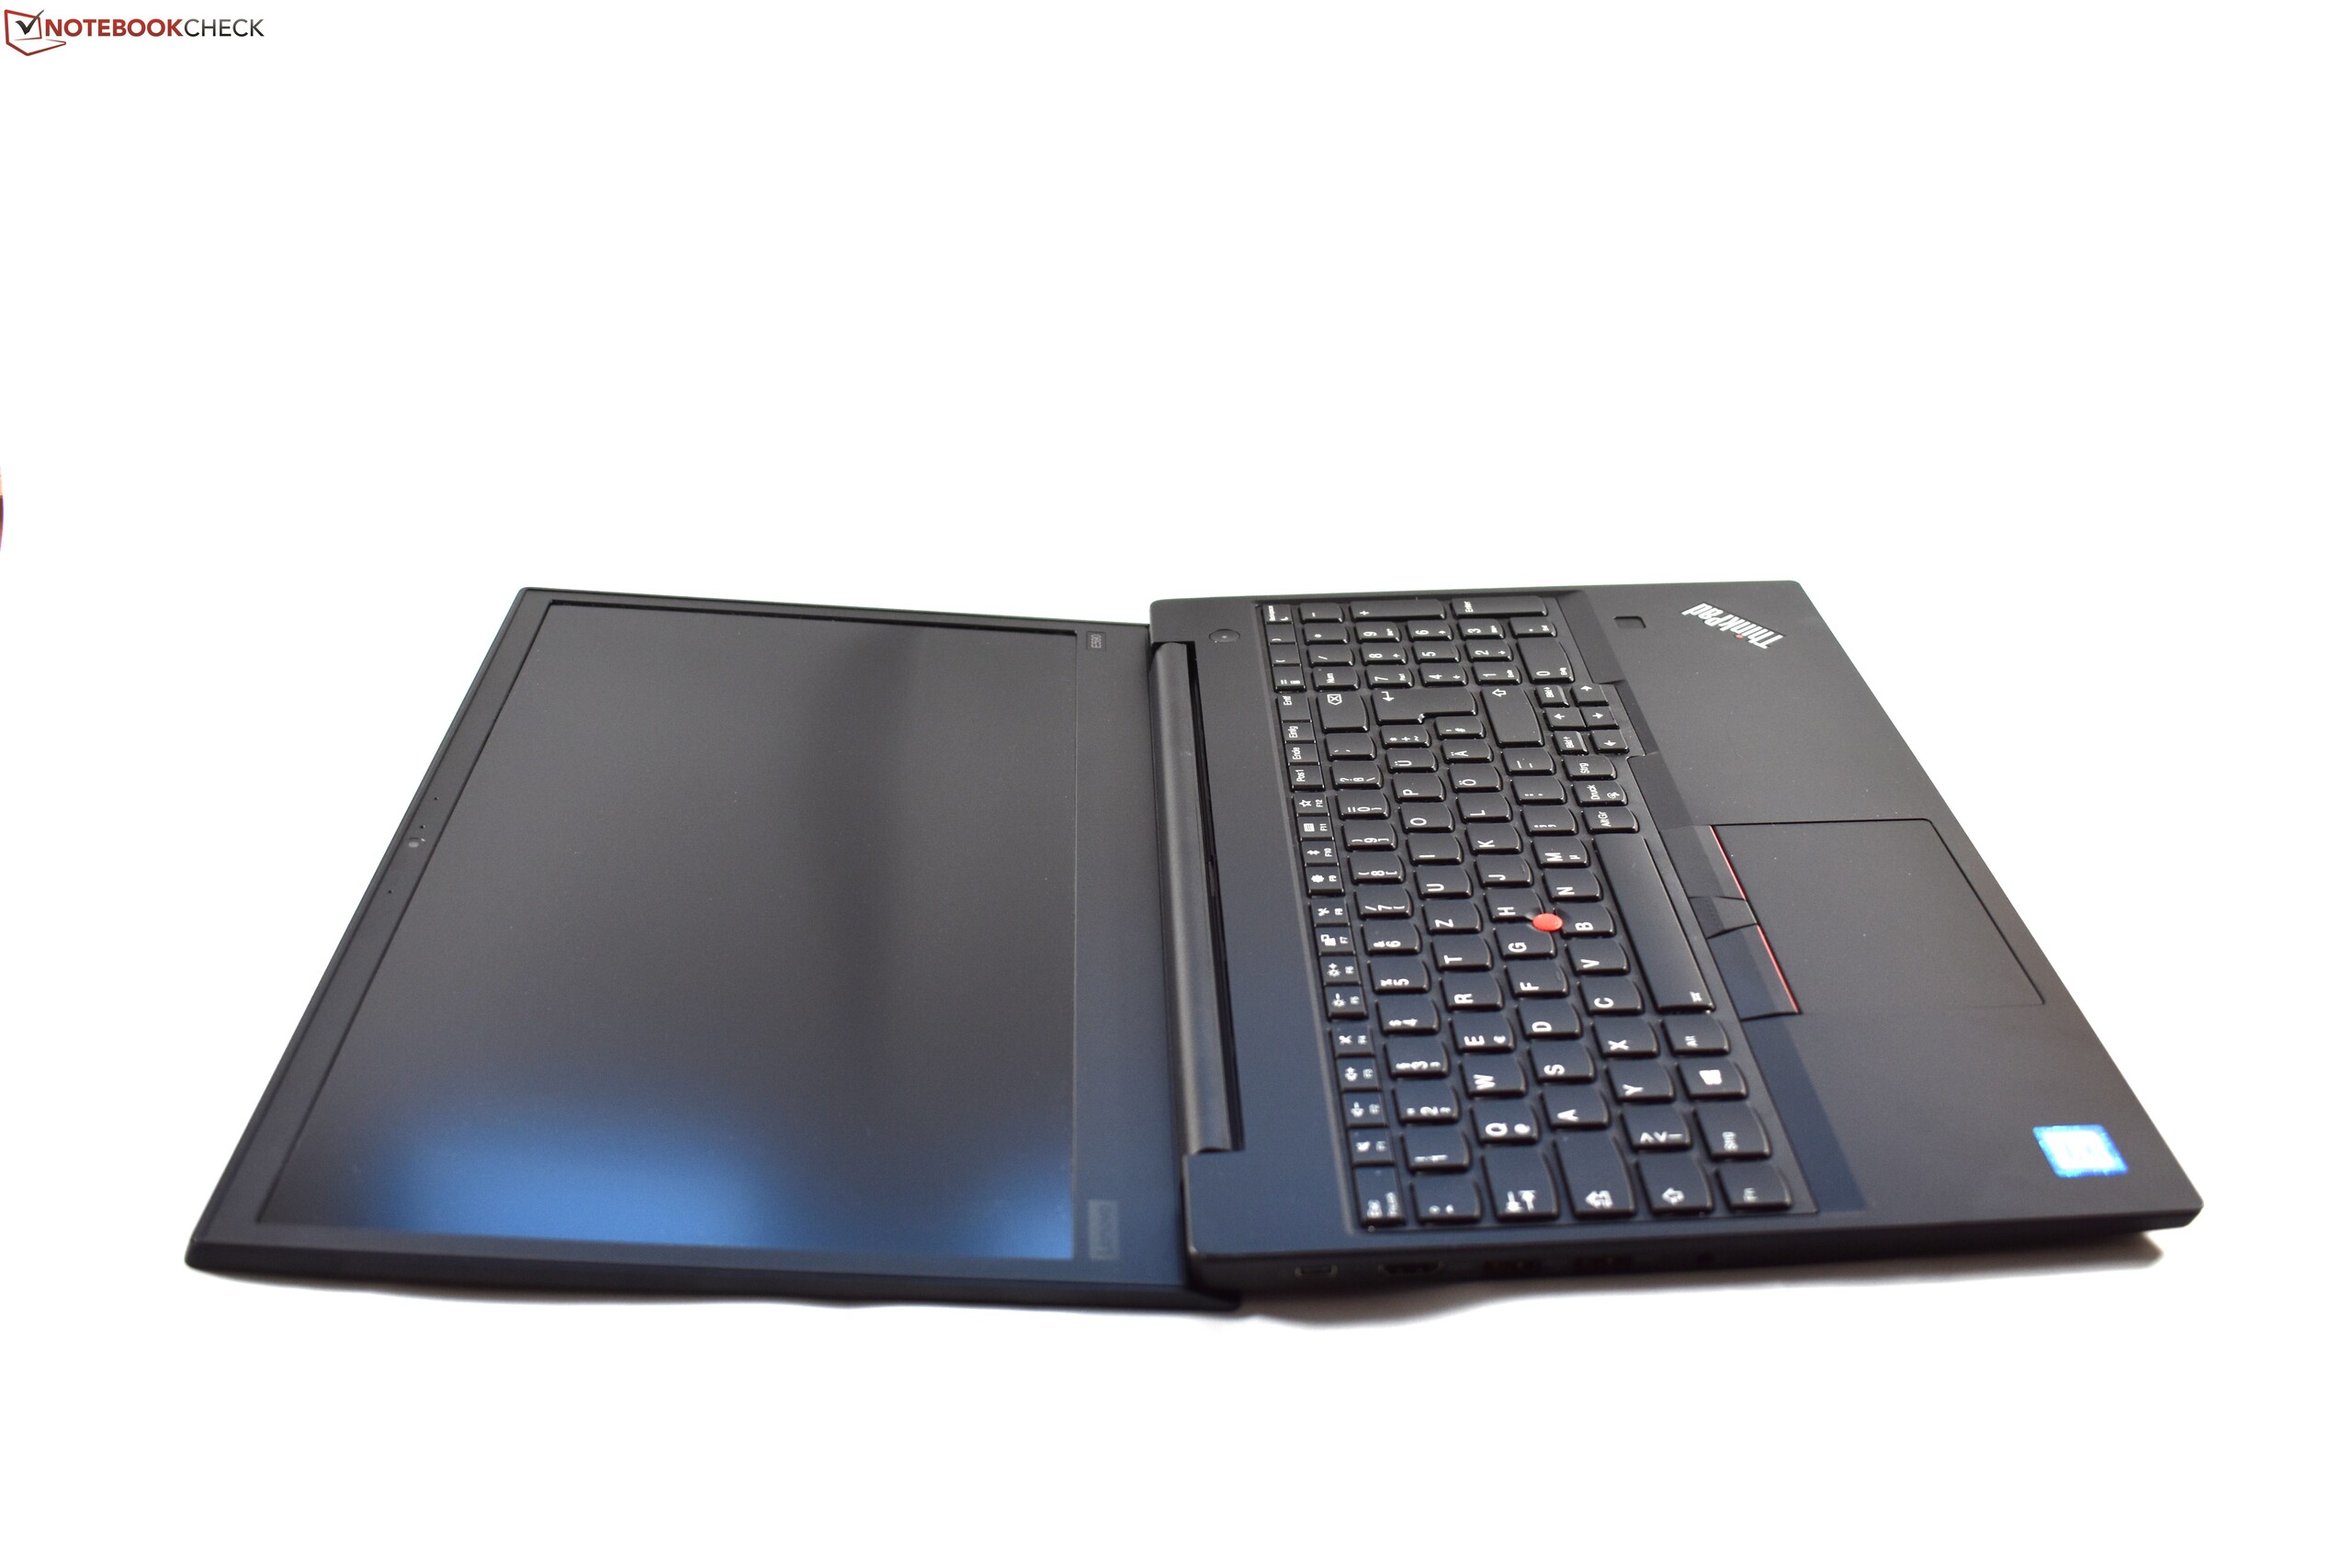
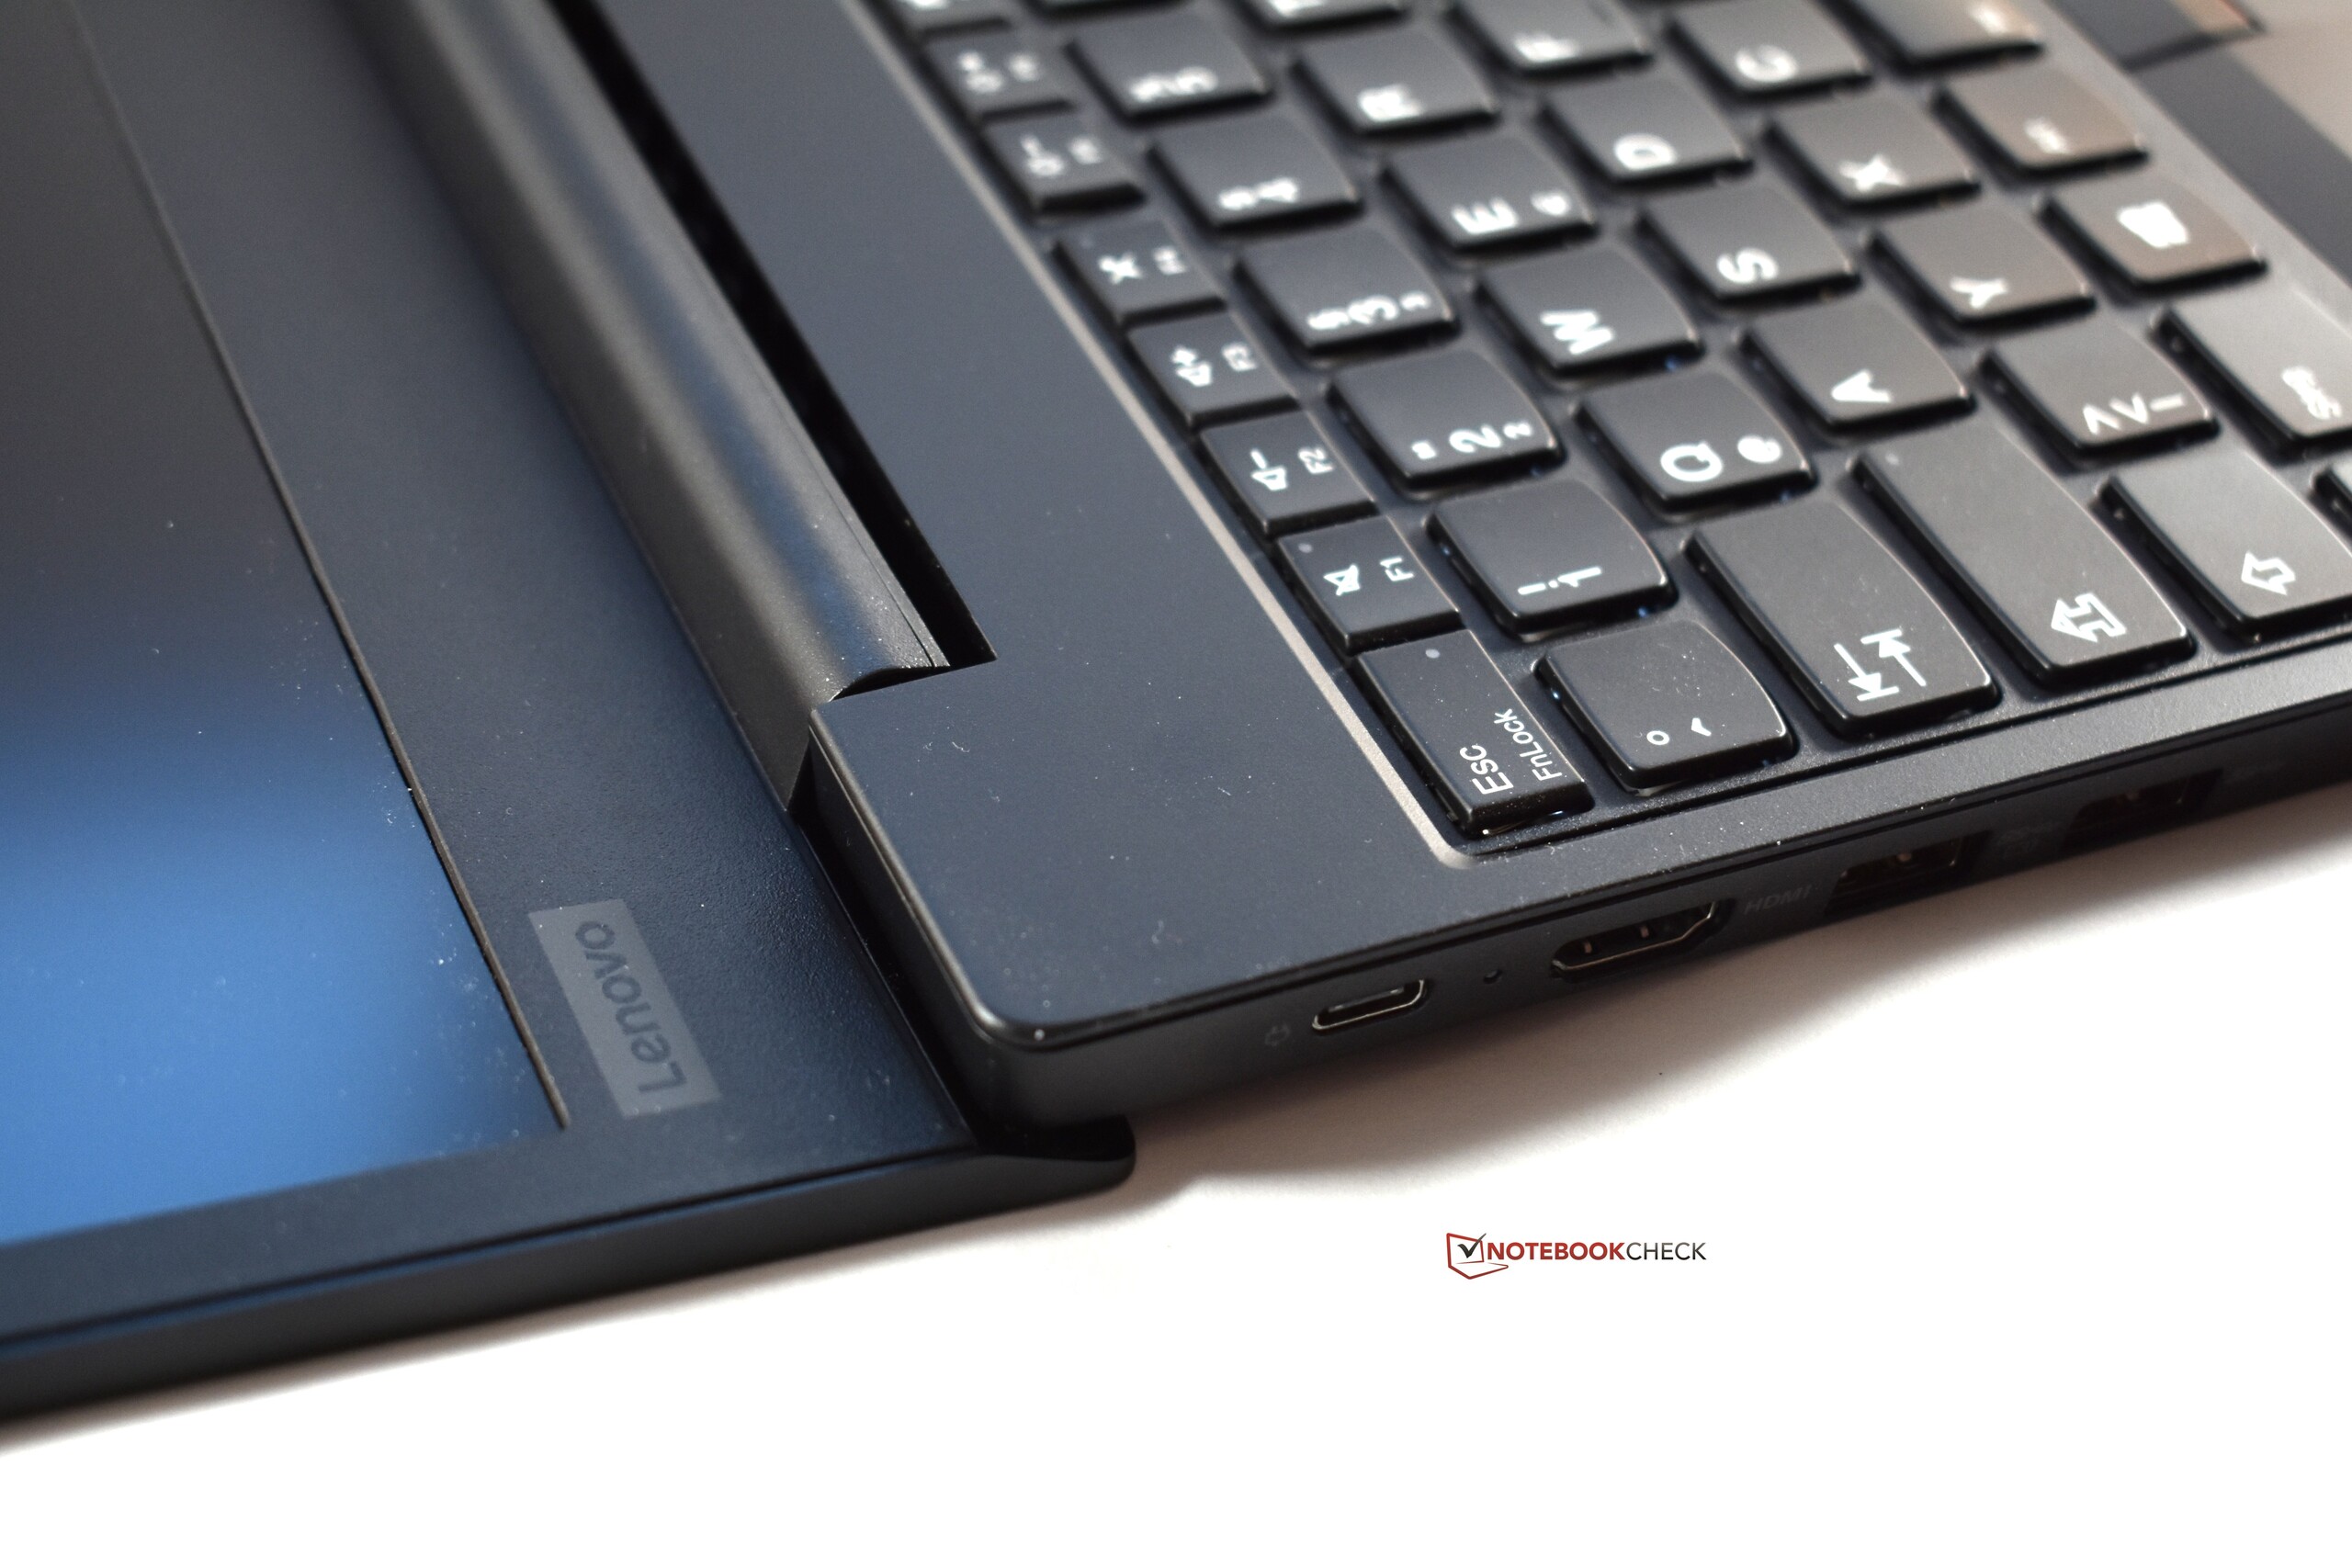
联想ThinkPad E590是更实惠的联想商务笔记本电脑之一。与ThinkPad E580相比,联想没有改变很多东西,就像它的前身一样,ThinkPad E590仍然是一款坚固的办公笔记本电脑。这台笔记本电脑的优点包括非常好的键盘以及经典的的ThinkPad小红点,出色的可扩展性和极其安静的冷却系统,即使在负载下也是如此。 E590在负载下也能保持低温,与前代产品相比,CPU性能有所提升。对于这个售价的笔记本电脑来说,机身做工精良,质量上乘。
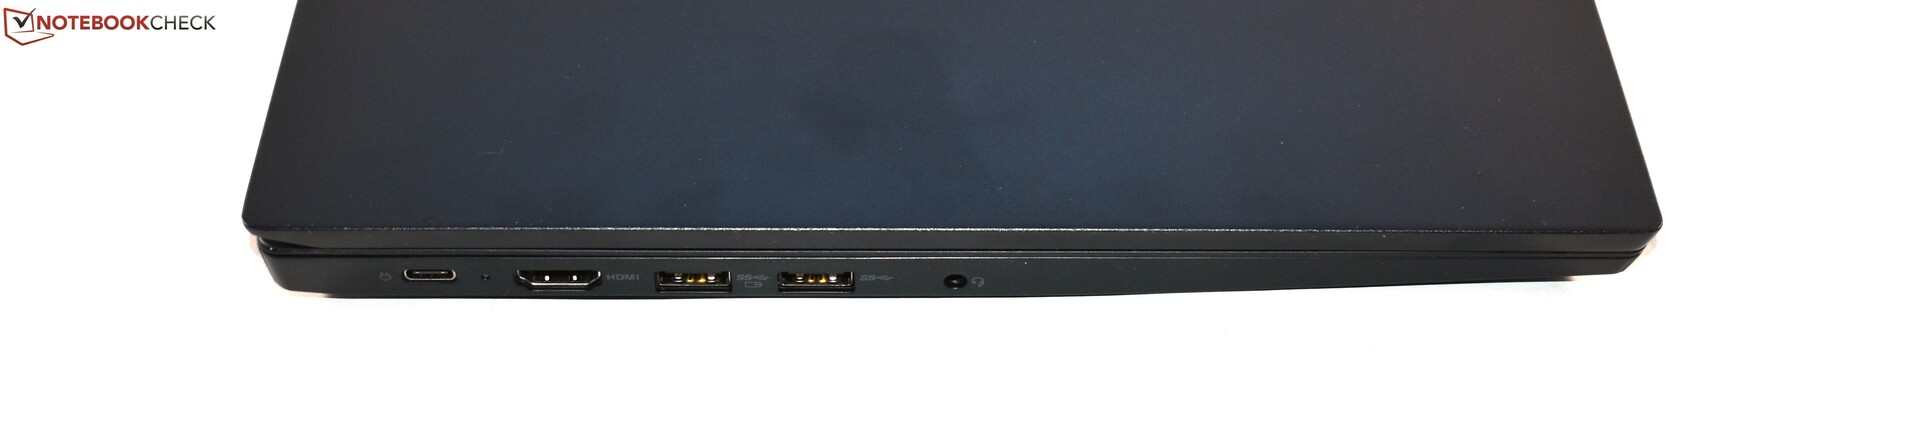
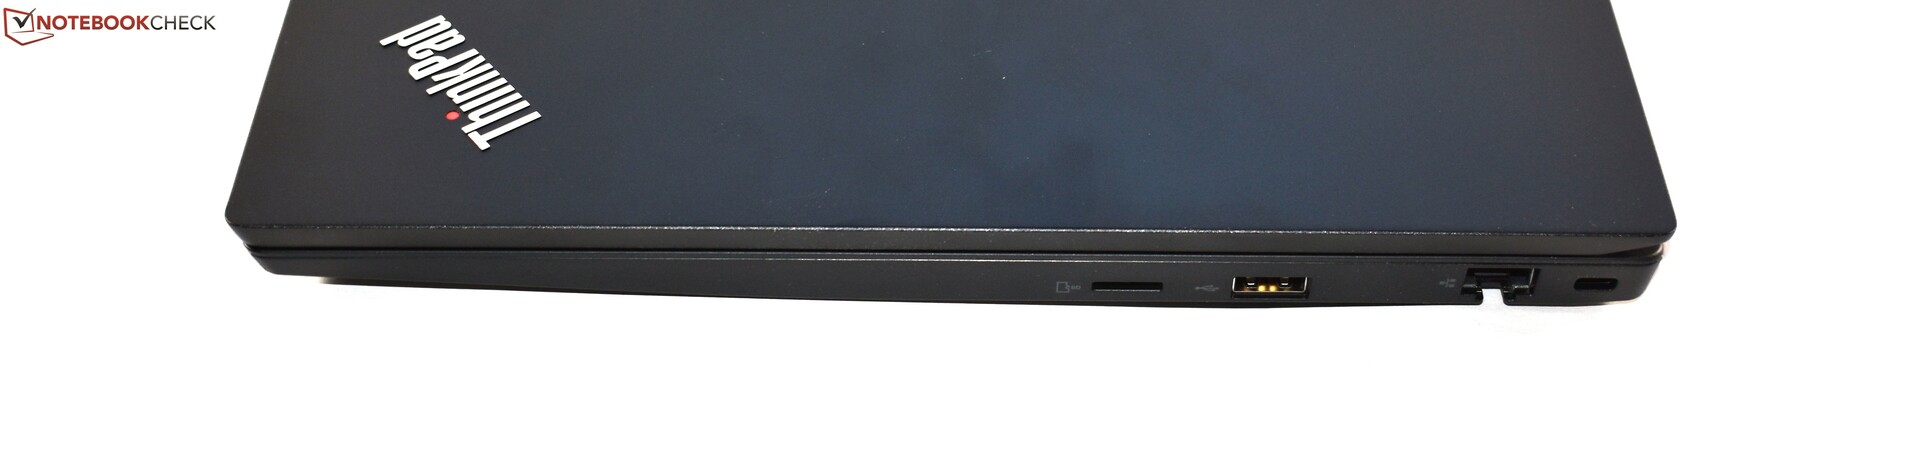
令人惊讶的是,E590不仅与E580分享了许多优点,也与E580拥有共同的缺点。例如,尽管机身较大,E590仍然只有一个microSD卡插槽。续航时间一般,屏幕色域覆盖率不佳且漏光严重。我们评测单元的另一个问题是SSD速度极慢,甚至影响了日常使用。此外,我们认为12个月的保修期相当短,USB 2.0也不应该存在——USB 3.0才是2019年的标准配置。
E590是台售价低于1,000欧元(约合7600元)的坚固商务本。
总的来说,ThinkPad E590 iGPU型号被推荐作为一款价格相对较低的办公室商务笔记本电脑 ——虽然其尺寸和重量以及不良的电池寿命使得E590更适合家庭办公,而不是更多的移动使用。此外,买家应该关注SSD,因为我们不推荐在我们的评测设备中使用的东芝SSD。不幸的是,硬盘配置还需要“抽奖”。
Lenovo ThinkPad E590-20NC0003GE
- 09/26/2019 v7 (old)
Benjamin Herzig
Price comparison

