联想ThinkBook 13s笔记本电脑评测:一台没有小红点的商务本

| Networking | |
| iperf3 transmit AX12 | |
| Lenovo ThinkPad X390-20Q1S02M00 | |
| Lenovo ThinkBook 13s-20R90071GE | |
| Lenovo ThinkPad L390-20NR0013GE | |
| HP ProBook 430 G6-5TJ89EA | |
| Lenovo Yoga S730-13IWL | |
| iperf3 receive AX12 | |
| Lenovo ThinkPad L390-20NR0013GE | |
| HP ProBook 430 G6-5TJ89EA | |
| Lenovo ThinkBook 13s-20R90071GE | |
| Lenovo ThinkPad X390-20Q1S02M00 | |
| Lenovo Yoga S730-13IWL | |
| |||||||||||||||||||||||||
Brightness Distribution: 92 %
Center on Battery: 317 cd/m²
Contrast: 1139:1 (Black: 0.28 cd/m²)
ΔE ColorChecker Calman: 2.4 | ∀{0.5-29.43 Ø4.72}
calibrated: 0.6
ΔE Greyscale Calman: 3.8 | ∀{0.09-98 Ø4.97}
99.1% sRGB (Argyll 1.6.3 3D)
63.5% AdobeRGB 1998 (Argyll 1.6.3 3D)
69.2% AdobeRGB 1998 (Argyll 3D)
99.1% sRGB (Argyll 3D)
67% Display P3 (Argyll 3D)
Gamma: 2.16
CCT: 7335 K
| Lenovo ThinkBook 13s-20R90071GE N133HCE-EN2, , 1920x1080, 13.3" | Lenovo ThinkPad L390-20NR0013GE LP133WF2-SPL8, , 1920x1080, 13.3" | Lenovo ThinkPad X390-20Q1S02M00 LP133WF7-SPB1, , 1920x1080, 13.3" | HP ProBook 430 G6-5TJ89EA CMN1375, , 1920x1080, 13.3" | Lenovo Yoga S730-13IWL B133HAN05.1, , 1920x1080, 13.3" | |
|---|---|---|---|---|---|
| Display | -40% | -3% | -37% | -1% | |
| Display P3 Coverage (%) | 67 | 40.42 -40% | 65.3 -3% | 41.87 -38% | 66.3 -1% |
| sRGB Coverage (%) | 99.1 | 60.4 -39% | 95.9 -3% | 62.6 -37% | 98.2 -1% |
| AdobeRGB 1998 Coverage (%) | 69.2 | 41.8 -40% | 66.6 -4% | 43.3 -37% | 67.8 -2% |
| Response Times | -5% | -31% | -4% | -20% | |
| Response Time Grey 50% / Grey 80% * (ms) | 40.4 ? | 42.8 ? -6% | 57.6 ? -43% | 40.8 ? -1% | 53 ? -31% |
| Response Time Black / White * (ms) | 28.8 ? | 30 ? -4% | 34 ? -18% | 30.4 ? -6% | 31 ? -8% |
| PWM Frequency (Hz) | 25000 ? | 30490 ? | 26040 ? | ||
| Screen | -124% | 0% | -89% | 4% | |
| Brightness middle (cd/m²) | 319 | 298 -7% | 356 12% | 255 -20% | 343 8% |
| Brightness (cd/m²) | 309 | 278 -10% | 336 9% | 238 -23% | 323 5% |
| Brightness Distribution (%) | 92 | 81 -12% | 88 -4% | 88 -4% | 85 -8% |
| Black Level * (cd/m²) | 0.28 | 0.33 -18% | 0.16 43% | 0.18 36% | 0.33 -18% |
| Contrast (:1) | 1139 | 903 -21% | 2225 95% | 1417 24% | 1039 -9% |
| Colorchecker dE 2000 * | 2.4 | 6.5 -171% | 3.6 -50% | 5.4 -125% | 2.38 1% |
| Colorchecker dE 2000 max. * | 6.3 | 23.9 -279% | 5.5 13% | 19.5 -210% | 3.55 44% |
| Colorchecker dE 2000 calibrated * | 0.6 | 4.9 -717% | 1.1 -83% | 4.1 -583% | |
| Greyscale dE 2000 * | 3.8 | 5.6 -47% | 4.7 -24% | 3.8 -0% | 3.01 21% |
| Gamma | 2.16 102% | 2.08 106% | 2.48 89% | 2.41 91% | 2.44 90% |
| CCT | 7335 89% | 6669 97% | 6374 102% | 7100 92% | 7198 90% |
| Color Space (Percent of AdobeRGB 1998) (%) | 63.5 | 38.4 -40% | 61.3 -3% | 39.4 -38% | 62 -2% |
| Color Space (Percent of sRGB) (%) | 99.1 | 60.1 -39% | 95.7 -3% | 62.5 -37% | 98 -1% |
| Total Average (Program / Settings) | -56% /
-93% | -11% /
-4% | -43% /
-69% | -6% /
-0% |
* ... smaller is better
Display Response Times
| ↔ Response Time Black to White | ||
|---|---|---|
| 28.8 ms ... rise ↗ and fall ↘ combined | ↗ 15.6 ms rise | 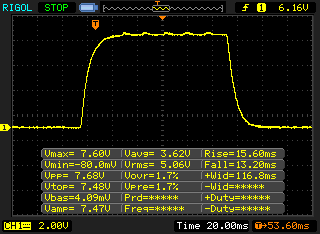 |
| ↘ 13.2 ms fall | ||
| The screen shows relatively slow response rates in our tests and may be too slow for gamers. In comparison, all tested devices range from 0.1 (minimum) to 240 (maximum) ms. » 76 % of all devices are better. This means that the measured response time is worse than the average of all tested devices (19.8 ms). | ||
| ↔ Response Time 50% Grey to 80% Grey | ||
| 40.4 ms ... rise ↗ and fall ↘ combined | ↗ 22 ms rise | 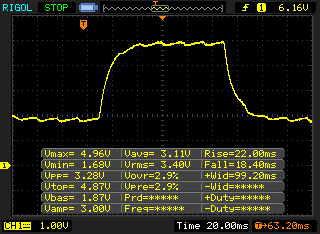 |
| ↘ 18.4 ms fall | ||
| The screen shows slow response rates in our tests and will be unsatisfactory for gamers. In comparison, all tested devices range from 0.165 (minimum) to 636 (maximum) ms. » 64 % of all devices are better. This means that the measured response time is worse than the average of all tested devices (31 ms). | ||
Screen Flickering / PWM (Pulse-Width Modulation)
| Screen flickering / PWM detected | 25000 Hz | ≤ 20 % brightness setting | 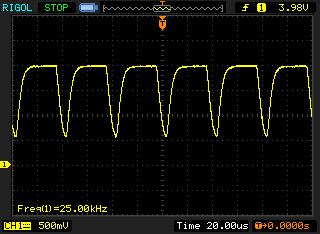 |
The display backlight flickers at 25000 Hz (worst case, e.g., utilizing PWM) Flickering detected at a brightness setting of 20 % and below. There should be no flickering or PWM above this brightness setting. The frequency of 25000 Hz is quite high, so most users sensitive to PWM should not notice any flickering. In comparison: 52 % of all tested devices do not use PWM to dim the display. If PWM was detected, an average of 7769 (minimum: 5 - maximum: 343500) Hz was measured. | |||
| Cinebench R15 | |
| CPU Single 64Bit | |
| Average of class Subnotebook (72.4 - 322, n=57, last 2 years) | |
| Lenovo Yoga S730-13IWL | |
| Lenovo ThinkBook 13s-20R90071GE | |
| Lenovo ThinkPad X390-20Q1S02M00 | |
| Lenovo ThinkPad L390-20NR0013GE | |
| Average Intel Core i5-8265U (111 - 164, n=35) | |
| HP ProBook 430 G6-5TJ89EA | |
| CPU Multi 64Bit | |
| Average of class Subnotebook (327 - 3345, n=57, last 2 years) | |
| Lenovo ThinkPad X390-20Q1S02M00 | |
| Lenovo ThinkBook 13s-20R90071GE | |
| Lenovo Yoga S730-13IWL | |
| Lenovo ThinkPad L390-20NR0013GE | |
| HP ProBook 430 G6-5TJ89EA | |
| Average Intel Core i5-8265U (457 - 750, n=38) | |
| PCMark 8 | |
| Home Score Accelerated v2 | |
| Lenovo ThinkPad X390-20Q1S02M00 | |
| Lenovo ThinkBook 13s-20R90071GE | |
| Average Intel Core i5-8265U, Intel UHD Graphics 620 (2747 - 4244, n=24) | |
| Lenovo ThinkPad L390-20NR0013GE | |
| HP ProBook 430 G6-5TJ89EA | |
| Lenovo Yoga S730-13IWL | |
| Average of class Subnotebook (1739 - 1828, n=2, last 2 years) | |
| Work Score Accelerated v2 | |
| Lenovo ThinkPad X390-20Q1S02M00 | |
| HP ProBook 430 G6-5TJ89EA | |
| Lenovo ThinkBook 13s-20R90071GE | |
| Lenovo ThinkPad L390-20NR0013GE | |
| Lenovo Yoga S730-13IWL | |
| Average Intel Core i5-8265U, Intel UHD Graphics 620 (3132 - 4927, n=23) | |
| Average of class Subnotebook (1609 - 1656, n=2, last 2 years) | |
| PCMark 8 Home Score Accelerated v2 | 3467 points | |
| PCMark 8 Work Score Accelerated v2 | 4841 points | |
| PCMark 10 Score | 3630 points | |
Help | ||
| Lenovo ThinkBook 13s-20R90071GE SK hynix BC501 HFM512GDHTNG-8310A | Lenovo ThinkPad L390-20NR0013GE Samsung SSD PM981 MZVLB256HAHQ | Lenovo ThinkPad X390-20Q1S02M00 Intel SSD Pro 7600p SSDPEKKF512G8L | HP ProBook 430 G6-5TJ89EA WDC PC SN520 SDAPNUW-256G | Lenovo Yoga S730-13IWL Samsung SSD PM981 MZVLB1T0HALR | Average SK hynix BC501 HFM512GDHTNG-8310A | |
|---|---|---|---|---|---|---|
| CrystalDiskMark 5.2 / 6 | 52% | 68% | 20% | 62% | 9% | |
| Write 4K (MB/s) | 89.3 | 99.6 12% | 120.7 35% | 101.8 14% | 139.6 56% | 110 ? 23% |
| Read 4K (MB/s) | 37.4 | 37.22 0% | 58.5 56% | 41.35 11% | 36.97 -1% | 40.6 ? 9% |
| Write Seq (MB/s) | 608 | 1432 136% | 1491 145% | 929 53% | 1490 145% | 677 ? 11% |
| Read Seq (MB/s) | 1019 | 2072 103% | 2760 171% | 1388 36% | 1321 30% | 1104 ? 8% |
| Write 4K Q32T1 (MB/s) | 487.9 | 439.7 -10% | 237.5 -51% | 453.5 -7% | 302.4 -38% | 438 ? -10% |
| Read 4K Q32T1 (MB/s) | 284.8 | 264.8 -7% | 336.1 18% | 286.2 0% | 375.4 32% | 338 ? 19% |
| Write Seq Q32T1 (MB/s) | 872 | 1549 78% | 1512 73% | 1302 49% | 2391 174% | 860 ? -1% |
| Read Seq Q32T1 (MB/s) | 1635 | 3318 103% | 3154 93% | 1751 7% | 3272 100% | 1786 ? 9% |

| 3DMark 11 - 1280x720 Performance GPU | |
| Average of class Subnotebook (995 - 18489, n=55, last 2 years) | |
| Lenovo ThinkPad X390-20Q1S02M00 | |
| Lenovo Yoga S730-13IWL | |
| Lenovo ThinkBook 13s-20R90071GE | |
| Average Intel UHD Graphics 620 (1144 - 3432, n=244) | |
| Lenovo ThinkPad L390-20NR0013GE | |
| HP ProBook 430 G6-5TJ89EA | |
| 3DMark | |
| 1280x720 Cloud Gate Standard Graphics | |
| Average of class Subnotebook (5577 - 61591, n=28, last 2 years) | |
| Lenovo ThinkPad X390-20Q1S02M00 | |
| Average Intel UHD Graphics 620 (6205 - 16400, n=225) | |
| Lenovo ThinkBook 13s-20R90071GE | |
| HP ProBook 430 G6-5TJ89EA | |
| Lenovo Yoga S730-13IWL | |
| Lenovo ThinkPad L390-20NR0013GE | |
| 1920x1080 Fire Strike Graphics | |
| Average of class Subnotebook (832 - 16347, n=56, last 2 years) | |
| Lenovo ThinkPad X390-20Q1S02M00 | |
| Lenovo Yoga S730-13IWL | |
| Average Intel UHD Graphics 620 (557 - 2608, n=213) | |
| Lenovo ThinkBook 13s-20R90071GE | |
| HP ProBook 430 G6-5TJ89EA | |
| Lenovo ThinkPad L390-20NR0013GE | |
| 2560x1440 Time Spy Graphics | |
| Average of class Subnotebook (804 - 6288, n=55, last 2 years) | |
| Average Intel UHD Graphics 620 (299 - 797, n=88) | |
| Lenovo Yoga S730-13IWL | |
| 3DMark 11 Performance | 1937 points | |
| 3DMark Cloud Gate Standard Score | 8233 points | |
| 3DMark Fire Strike Score | 1018 points | |
Help | ||
| low | med. | high | ultra | |
|---|---|---|---|---|
| BioShock Infinite (2013) | 59.1 | 30.9 | 25.2 | 8 |
| The Witcher 3 (2015) | 15.9 | |||
| Dota 2 Reborn (2015) | 72 | 42.9 | 19.2 | 16.9 |
| Rise of the Tomb Raider (2016) | 23.1 | |||
| X-Plane 11.11 (2018) | 25.4 | 17.6 |
Noise level
| Idle |
| 28.8 / 28.8 / 29.7 dB(A) |
| Load |
| 30.7 / 38.3 dB(A) |
 | ||
30 dB silent 40 dB(A) audible 50 dB(A) loud |
||
min: | ||
(±) The maximum temperature on the upper side is 40.3 °C / 105 F, compared to the average of 35.9 °C / 97 F, ranging from 21.4 to 59 °C for the class Subnotebook.
(±) The bottom heats up to a maximum of 44.6 °C / 112 F, compared to the average of 39.2 °C / 103 F
(+) In idle usage, the average temperature for the upper side is 23.4 °C / 74 F, compared to the device average of 30.8 °C / 87 F.
(+) The palmrests and touchpad are cooler than skin temperature with a maximum of 30.2 °C / 86.4 F and are therefore cool to the touch.
(±) The average temperature of the palmrest area of similar devices was 28.2 °C / 82.8 F (-2 °C / -3.6 F).
Lenovo ThinkBook 13s-20R90071GE audio analysis
(-) | not very loud speakers (70.7 dB)
Bass 100 - 315 Hz
(-) | nearly no bass - on average 15.9% lower than median
(±) | linearity of bass is average (14.8% delta to prev. frequency)
Mids 400 - 2000 Hz
(+) | balanced mids - only 4.5% away from median
(±) | linearity of mids is average (7.1% delta to prev. frequency)
Highs 2 - 16 kHz
(+) | balanced highs - only 2.7% away from median
(±) | linearity of highs is average (11.2% delta to prev. frequency)
Overall 100 - 16.000 Hz
(±) | linearity of overall sound is average (21.3% difference to median)
Compared to same class
» 72% of all tested devices in this class were better, 5% similar, 23% worse
» The best had a delta of 5%, average was 18%, worst was 53%
Compared to all devices tested
» 59% of all tested devices were better, 7% similar, 33% worse
» The best had a delta of 4%, average was 24%, worst was 134%
Lenovo ThinkPad X390-20Q1S02M00 audio analysis
(±) | speaker loudness is average but good (72.6 dB)
Bass 100 - 315 Hz
(-) | nearly no bass - on average 20.8% lower than median
(±) | linearity of bass is average (13.6% delta to prev. frequency)
Mids 400 - 2000 Hz
(+) | balanced mids - only 2.3% away from median
(+) | mids are linear (5.5% delta to prev. frequency)
Highs 2 - 16 kHz
(+) | balanced highs - only 2.4% away from median
(+) | highs are linear (6.1% delta to prev. frequency)
Overall 100 - 16.000 Hz
(±) | linearity of overall sound is average (20.5% difference to median)
Compared to same class
» 66% of all tested devices in this class were better, 7% similar, 27% worse
» The best had a delta of 5%, average was 18%, worst was 53%
Compared to all devices tested
» 54% of all tested devices were better, 8% similar, 38% worse
» The best had a delta of 4%, average was 24%, worst was 134%
| Off / Standby | |
| Idle | |
| Load |
|
Key:
min: | |
| Lenovo ThinkBook 13s-20R90071GE i5-8265U, UHD Graphics 620, SK hynix BC501 HFM512GDHTNG-8310A, a-Si IPS LED, 1920x1080, 13.3" | Lenovo ThinkPad L390-20NR0013GE i5-8265U, UHD Graphics 620, Samsung SSD PM981 MZVLB256HAHQ, IPS LED, 1920x1080, 13.3" | Lenovo ThinkPad X390-20Q1S02M00 i5-8265U, UHD Graphics 620, Intel SSD Pro 7600p SSDPEKKF512G8L, IPS LED, 1920x1080, 13.3" | HP ProBook 430 G6-5TJ89EA i5-8265U, UHD Graphics 620, WDC PC SN520 SDAPNUW-256G, IPS LED, 1920x1080, 13.3" | Lenovo Yoga S730-13IWL i7-8565U, UHD Graphics 620, Samsung SSD PM981 MZVLB1T0HALR, IPS LED, 1920x1080, 13.3" | Average Intel UHD Graphics 620 | Average of class Subnotebook | |
|---|---|---|---|---|---|---|---|
| Power Consumption | -18% | -20% | -7% | -16% | -15% | -24% | |
| Idle Minimum * (Watt) | 3.1 | 3.8 -23% | 3.4 -10% | 3.5 -13% | 3 3% | 3.81 ? -23% | 3.86 ? -25% |
| Idle Average * (Watt) | 5.87 | 6.8 -16% | 5.6 5% | 5.76 2% | 5.6 5% | 6.94 ? -18% | 6.61 ? -13% |
| Idle Maximum * (Watt) | 6.6 | 9.8 -48% | 8.7 -32% | 8.3 -26% | 11 -67% | 8.75 ? -33% | 8 ? -21% |
| Load Average * (Watt) | 35.3 | 32.4 8% | 43.6 -24% | 34.8 1% | 38 -8% | 35 ? 1% | 42.2 ? -20% |
| Load Maximum * (Watt) | 46.5 | 52 -12% | 65 -40% | 45.7 2% | 53 -14% | 47.5 ? -2% | 64.5 ? -39% |
* ... smaller is better
| Lenovo ThinkBook 13s-20R90071GE i5-8265U, UHD Graphics 620, 45 Wh | Lenovo ThinkPad L390-20NR0013GE i5-8265U, UHD Graphics 620, 45 Wh | Lenovo ThinkPad X390-20Q1S02M00 i5-8265U, UHD Graphics 620, 48 Wh | HP ProBook 430 G6-5TJ89EA i5-8265U, UHD Graphics 620, 45 Wh | Lenovo Yoga S730-13IWL i7-8565U, UHD Graphics 620, 42 Wh | Average of class Subnotebook | |
|---|---|---|---|---|---|---|
| Battery runtime | -12% | 8% | 20% | -7% | 46% | |
| H.264 (h) | 10.8 | 9.4 -13% | 12.7 18% | 9.1 -16% | 8.9 -18% | 15.4 ? 43% |
| WiFi v1.3 (h) | 9.1 | 7 -23% | 8.3 -9% | 9.5 4% | 6.9 -24% | 14 ? 54% |
| Load (h) | 1.4 | 1.4 0% | 1.6 14% | 2.4 71% | 1.7 21% | 1.969 ? 41% |
| Reader / Idle (h) | 16.2 | 16.2 | 15.9 | 28.6 ? |
Pros
Cons
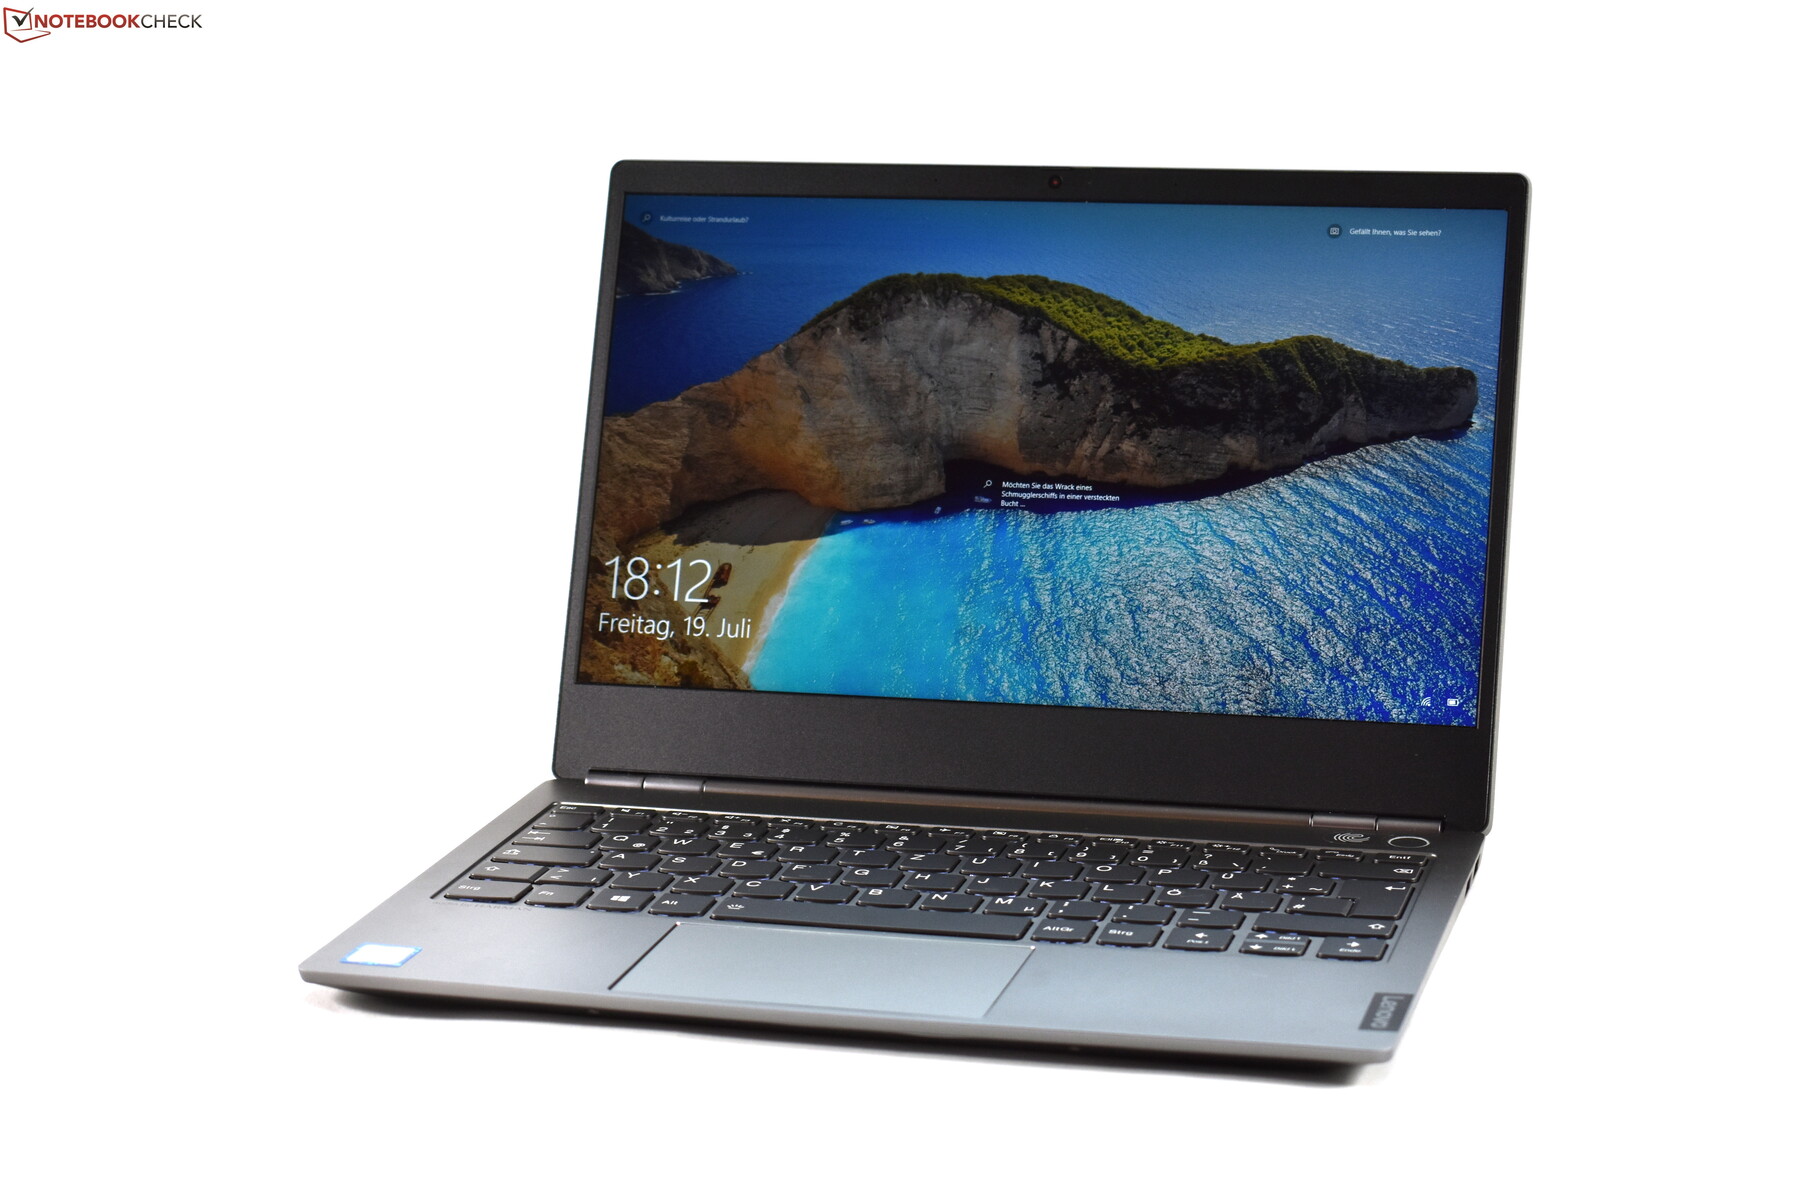
ThinkBook系列不会取代已建立的ThinkPad产品线,在测试ThinkBook 13s之后,这一点更加明显。相反,ThinkBook系列是对Lenovo笔记本电脑产品的补充,应该会吸引那些被ThinkPad拒之门外的人。特别是,喜欢MacBook Pro设计的人可能比对传统的ThinkPad感兴趣的人更多。
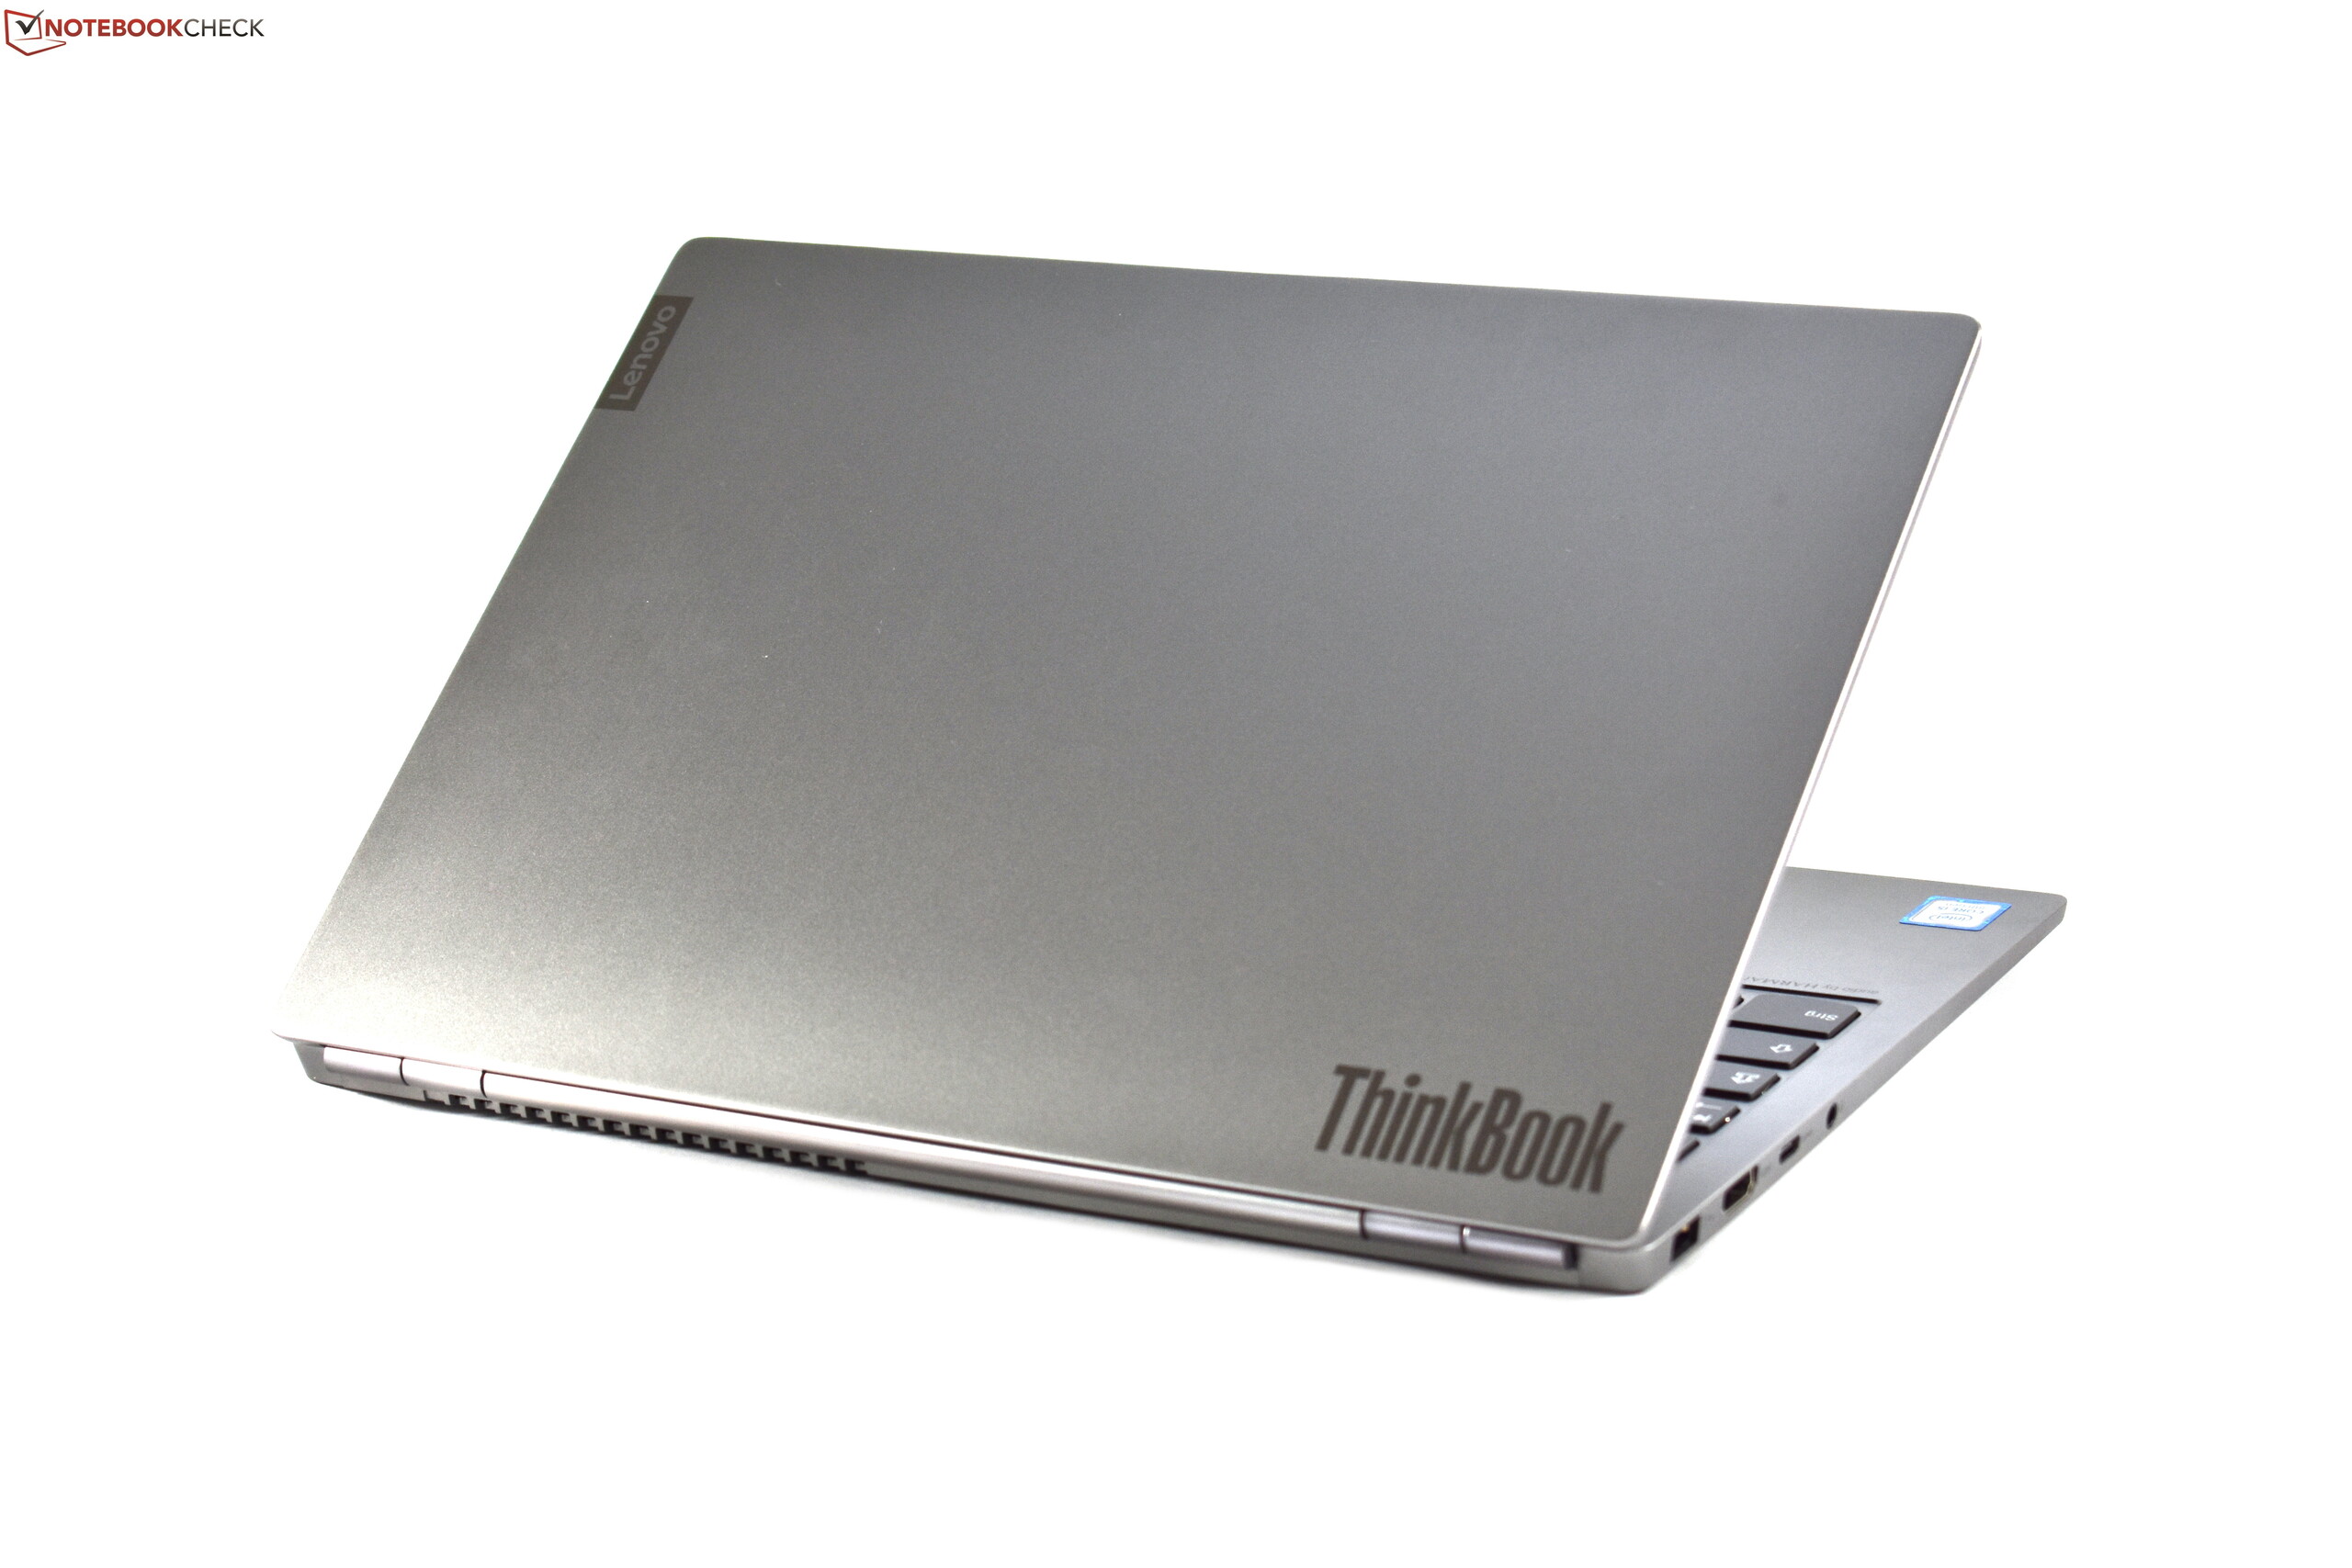
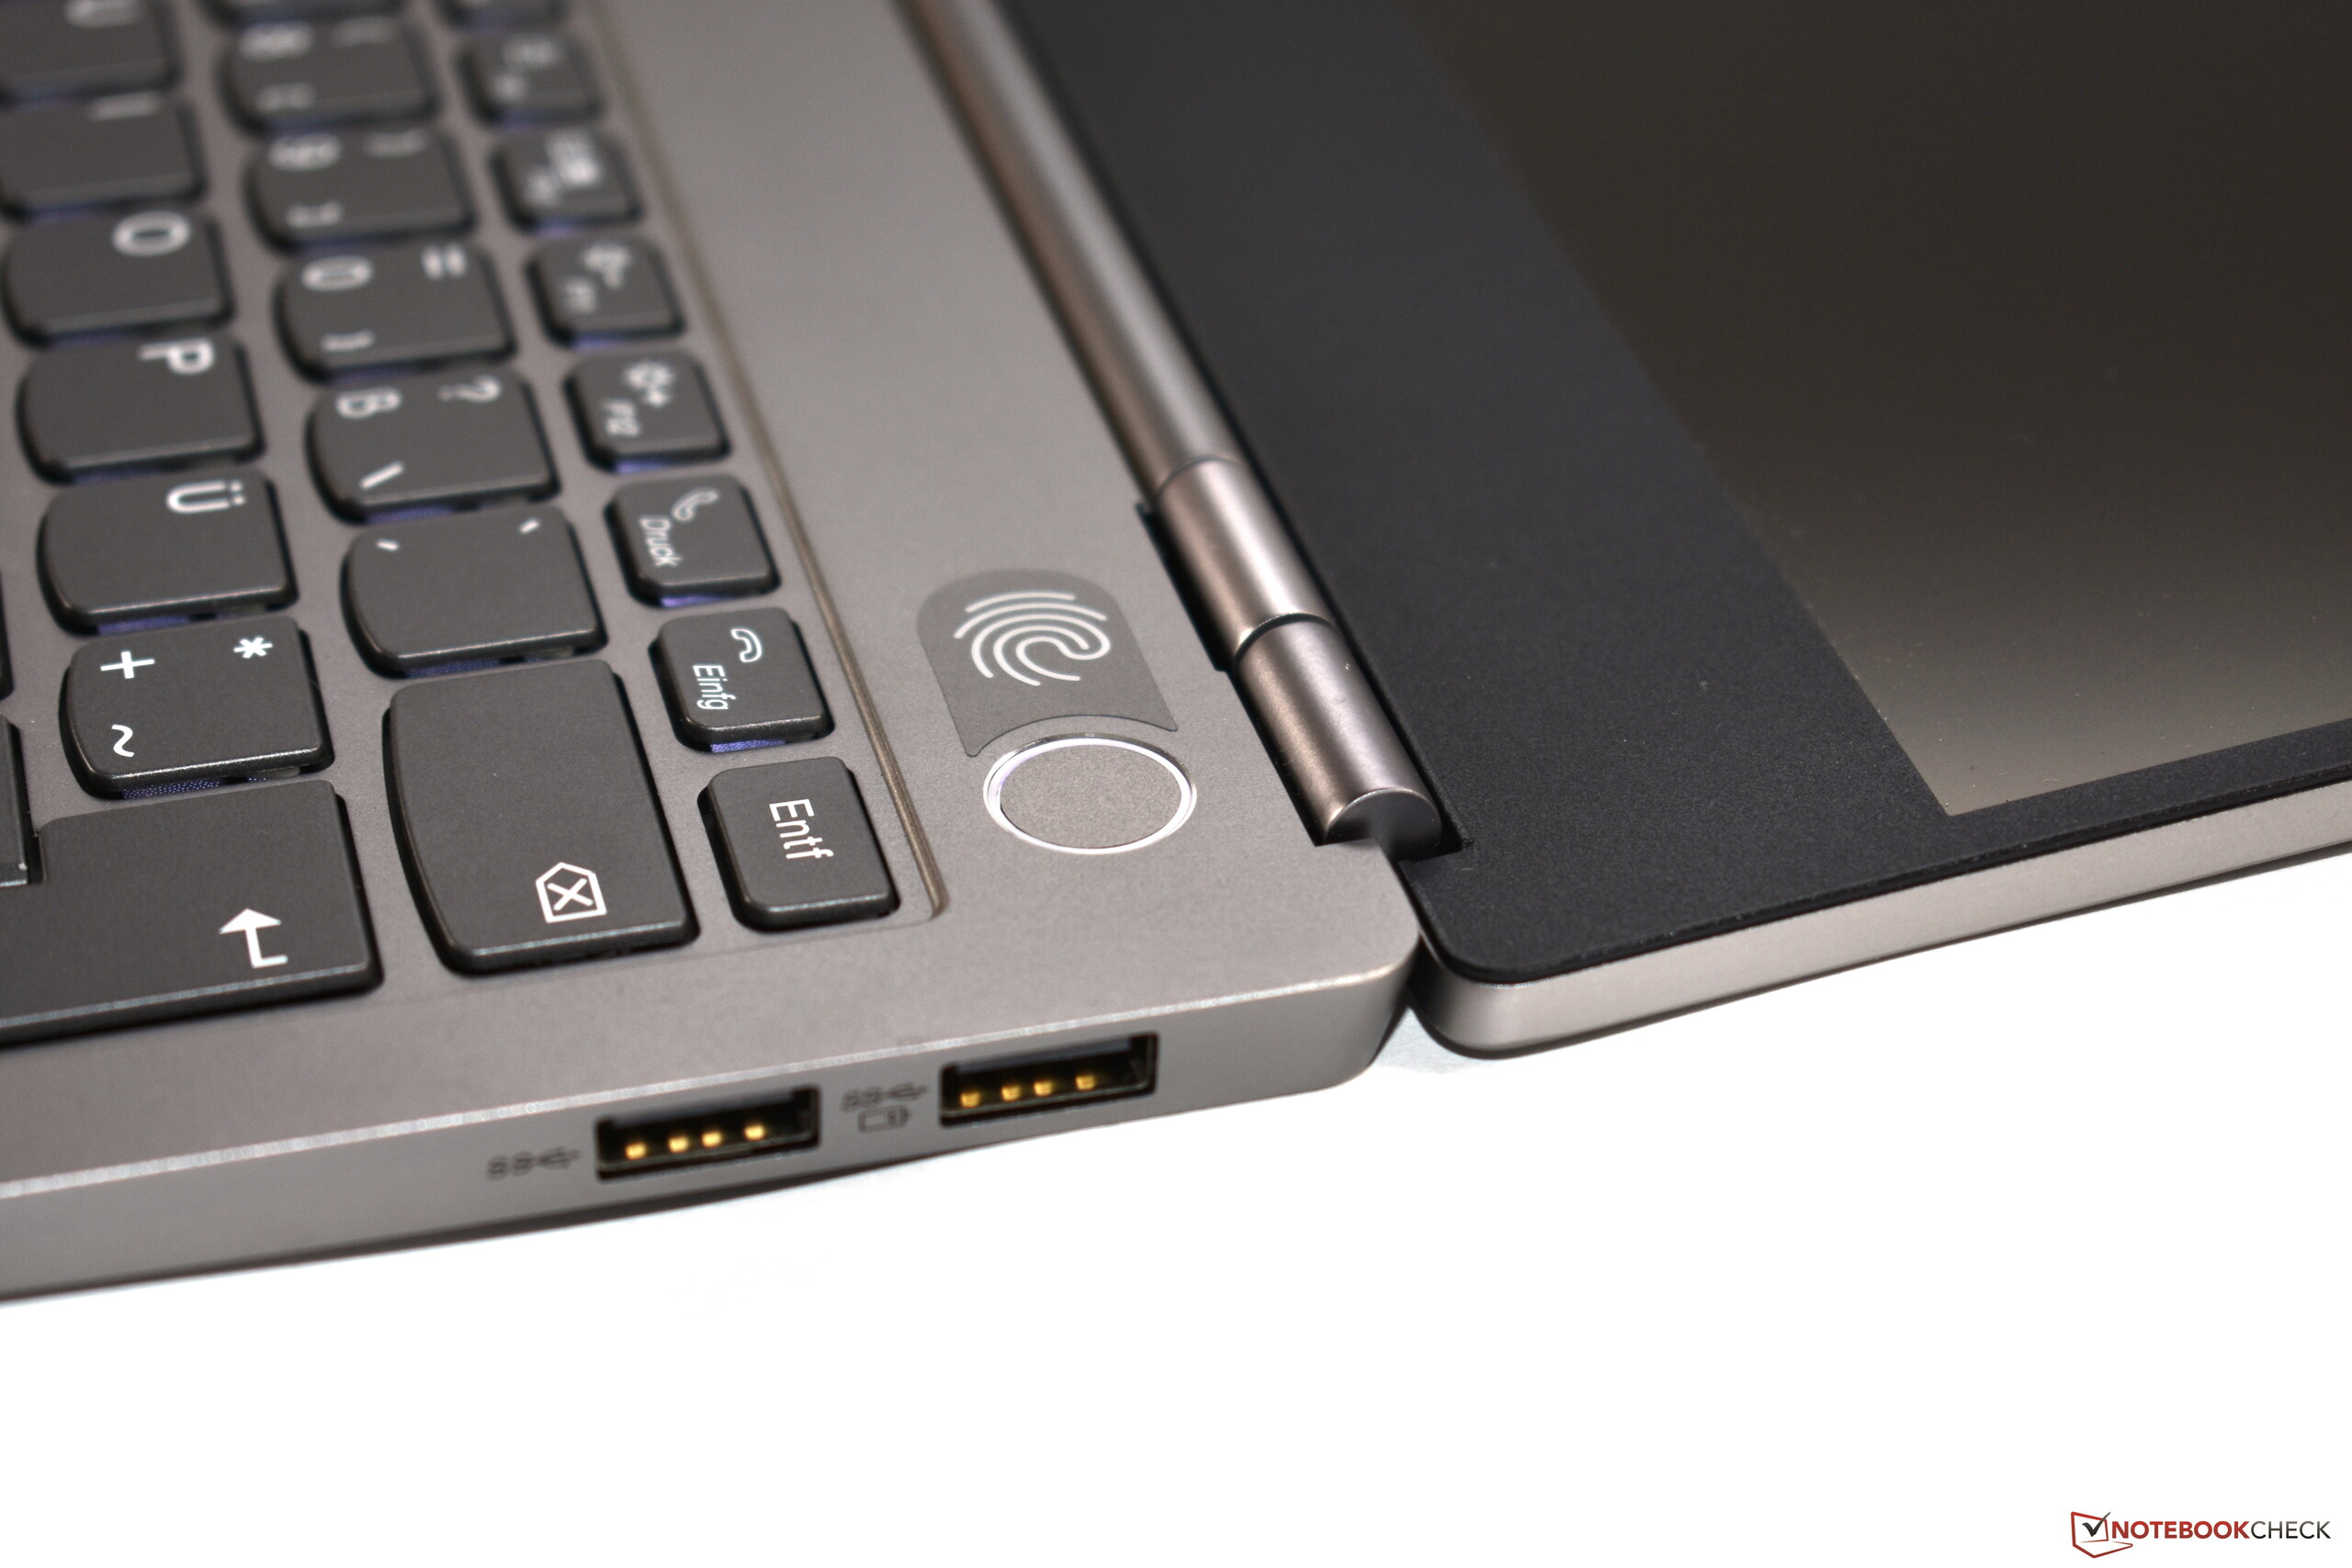
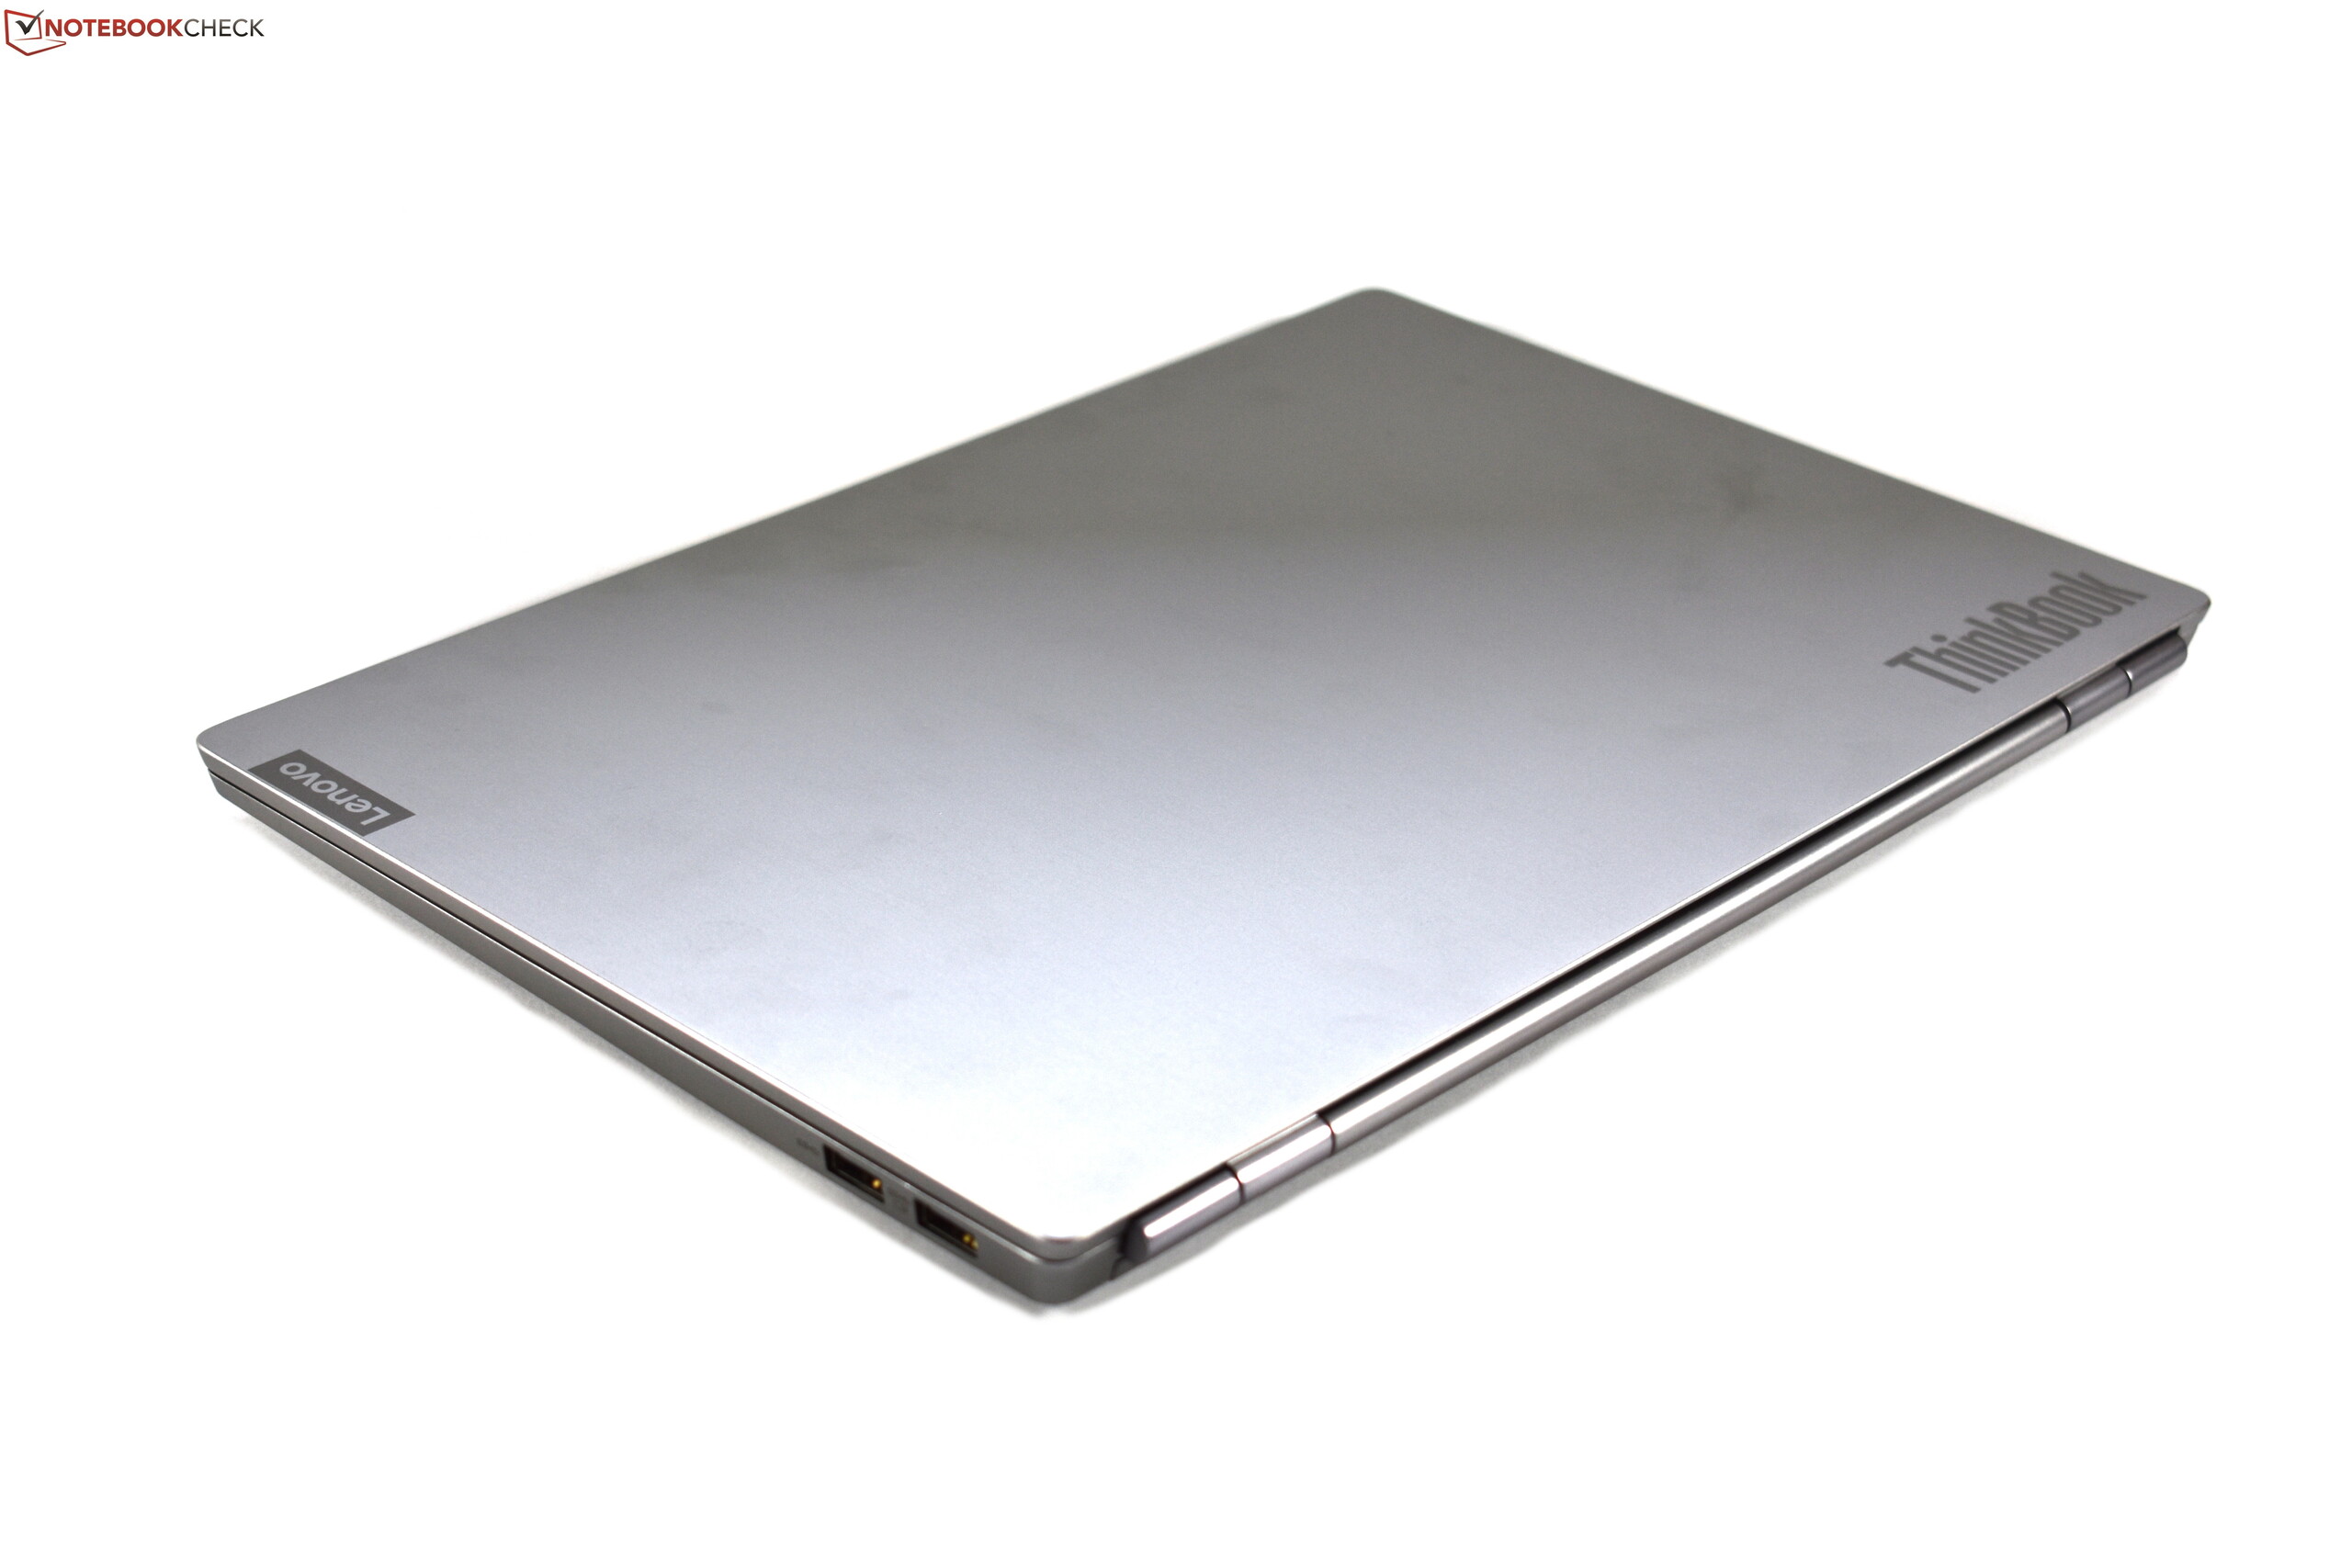
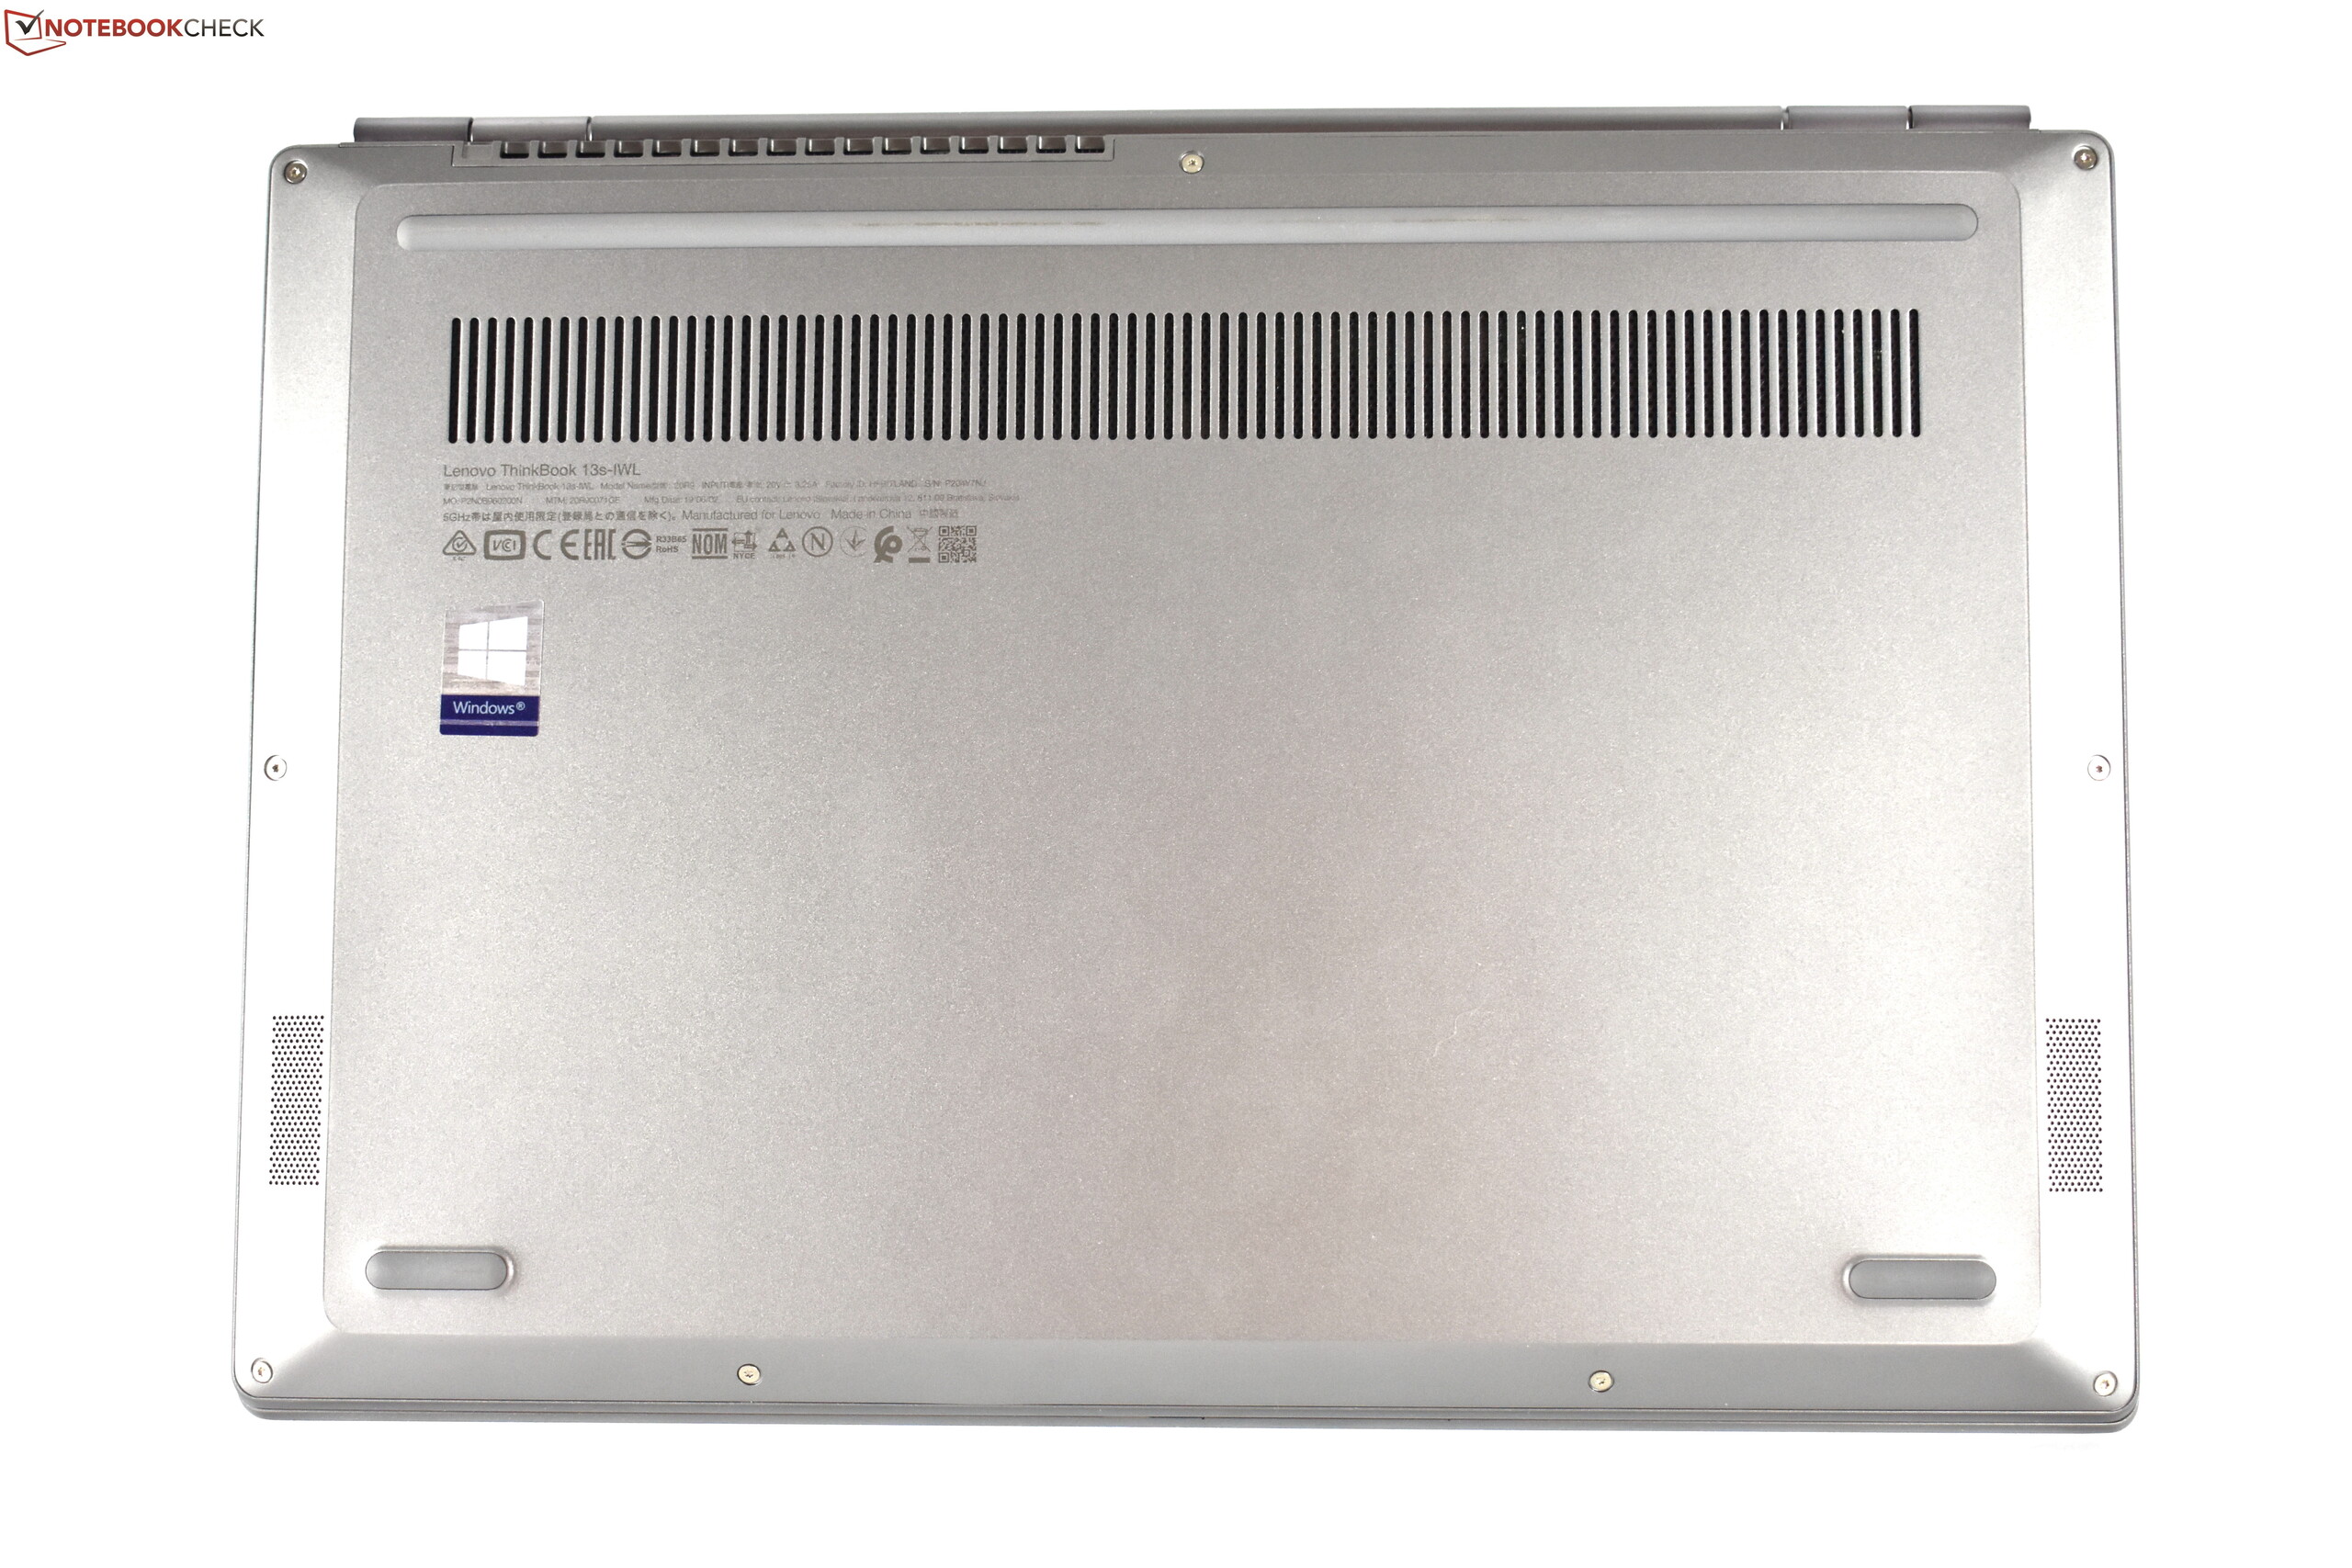
ThinkBook 13s和其ThinkPad同类产品之间最明显的区别之一是外壳设计。银灰色铝制底盘虽然看起来不像现代的ThinkPad,但质感十足,同时又小巧轻便。从目前来说,我们尚不确定从长远来看,ThinkBook是否会像ThinkPad一样坚固耐用,但是类似的紧凑轻巧的ThinkPad却比ThinkBook 13s高级得多。不过,我们喜欢Lenovo在后者的屏幕上所做的事情,其磨砂面板比ThinkPad L390明亮,同时也具有更好的色彩空间覆盖范围。 HDR支持也很不错。我们的评测单元的续航时间和低外壳温度也值得称赞,并且在需要时可以升级RAM。
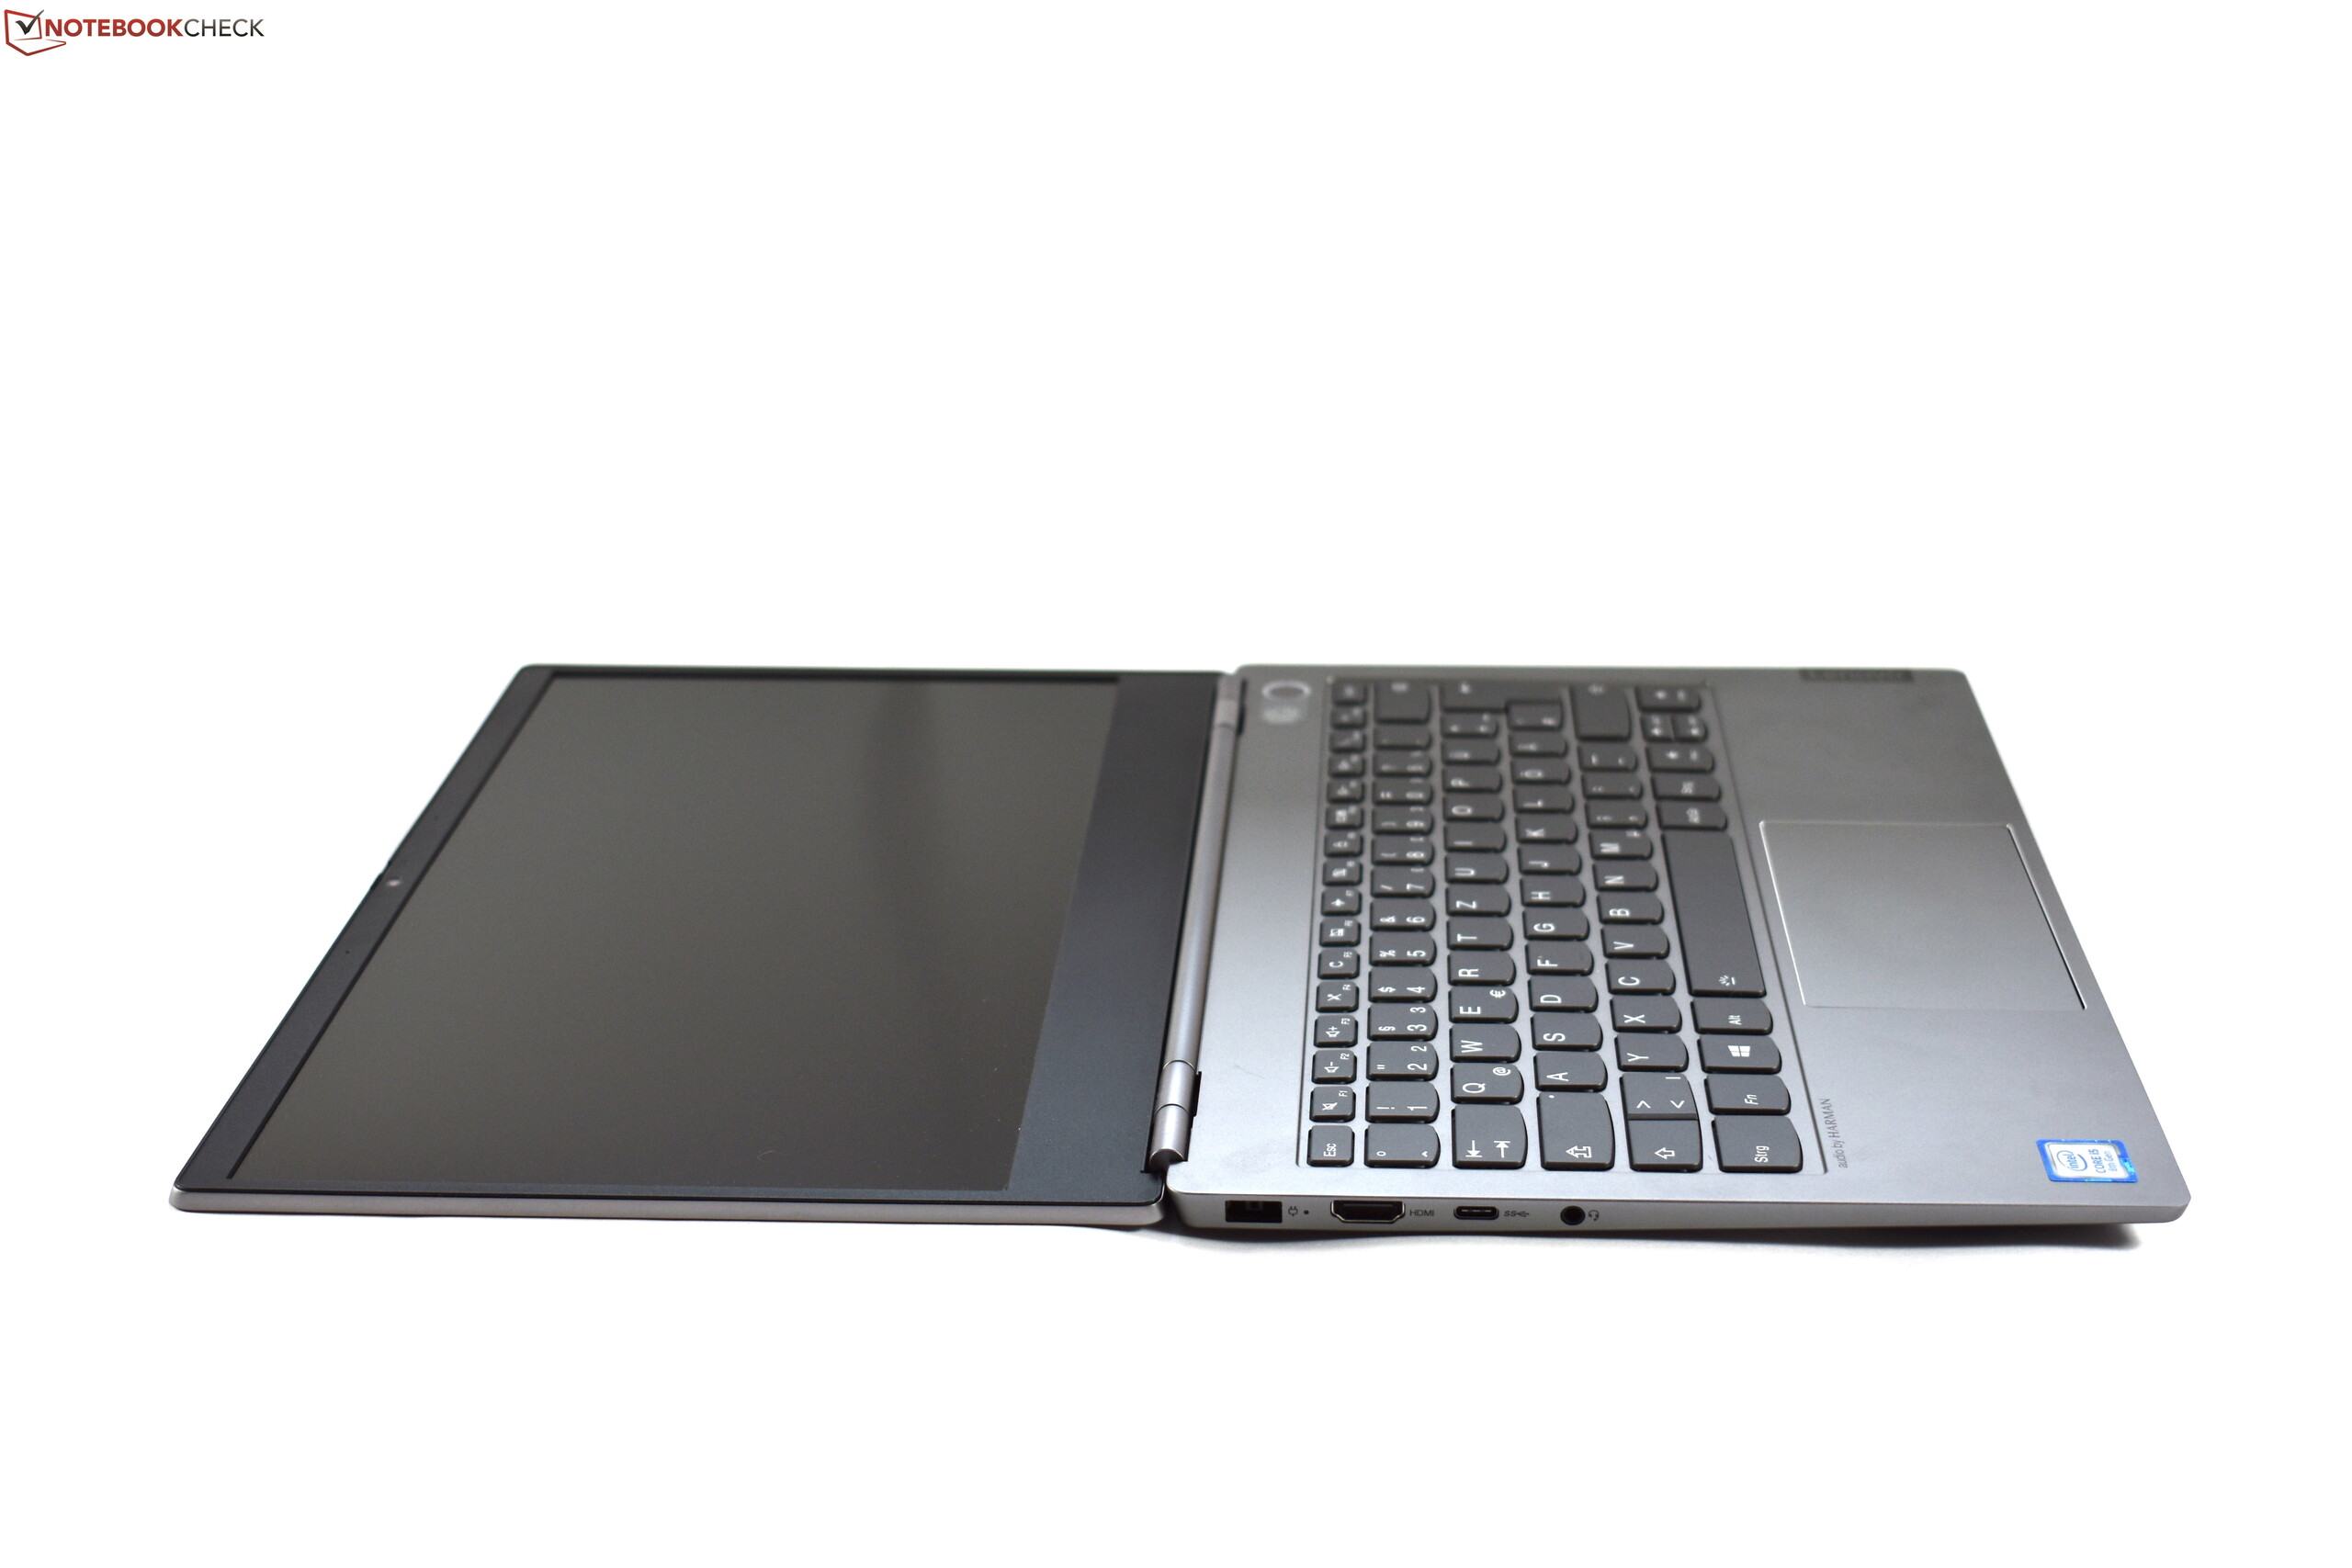
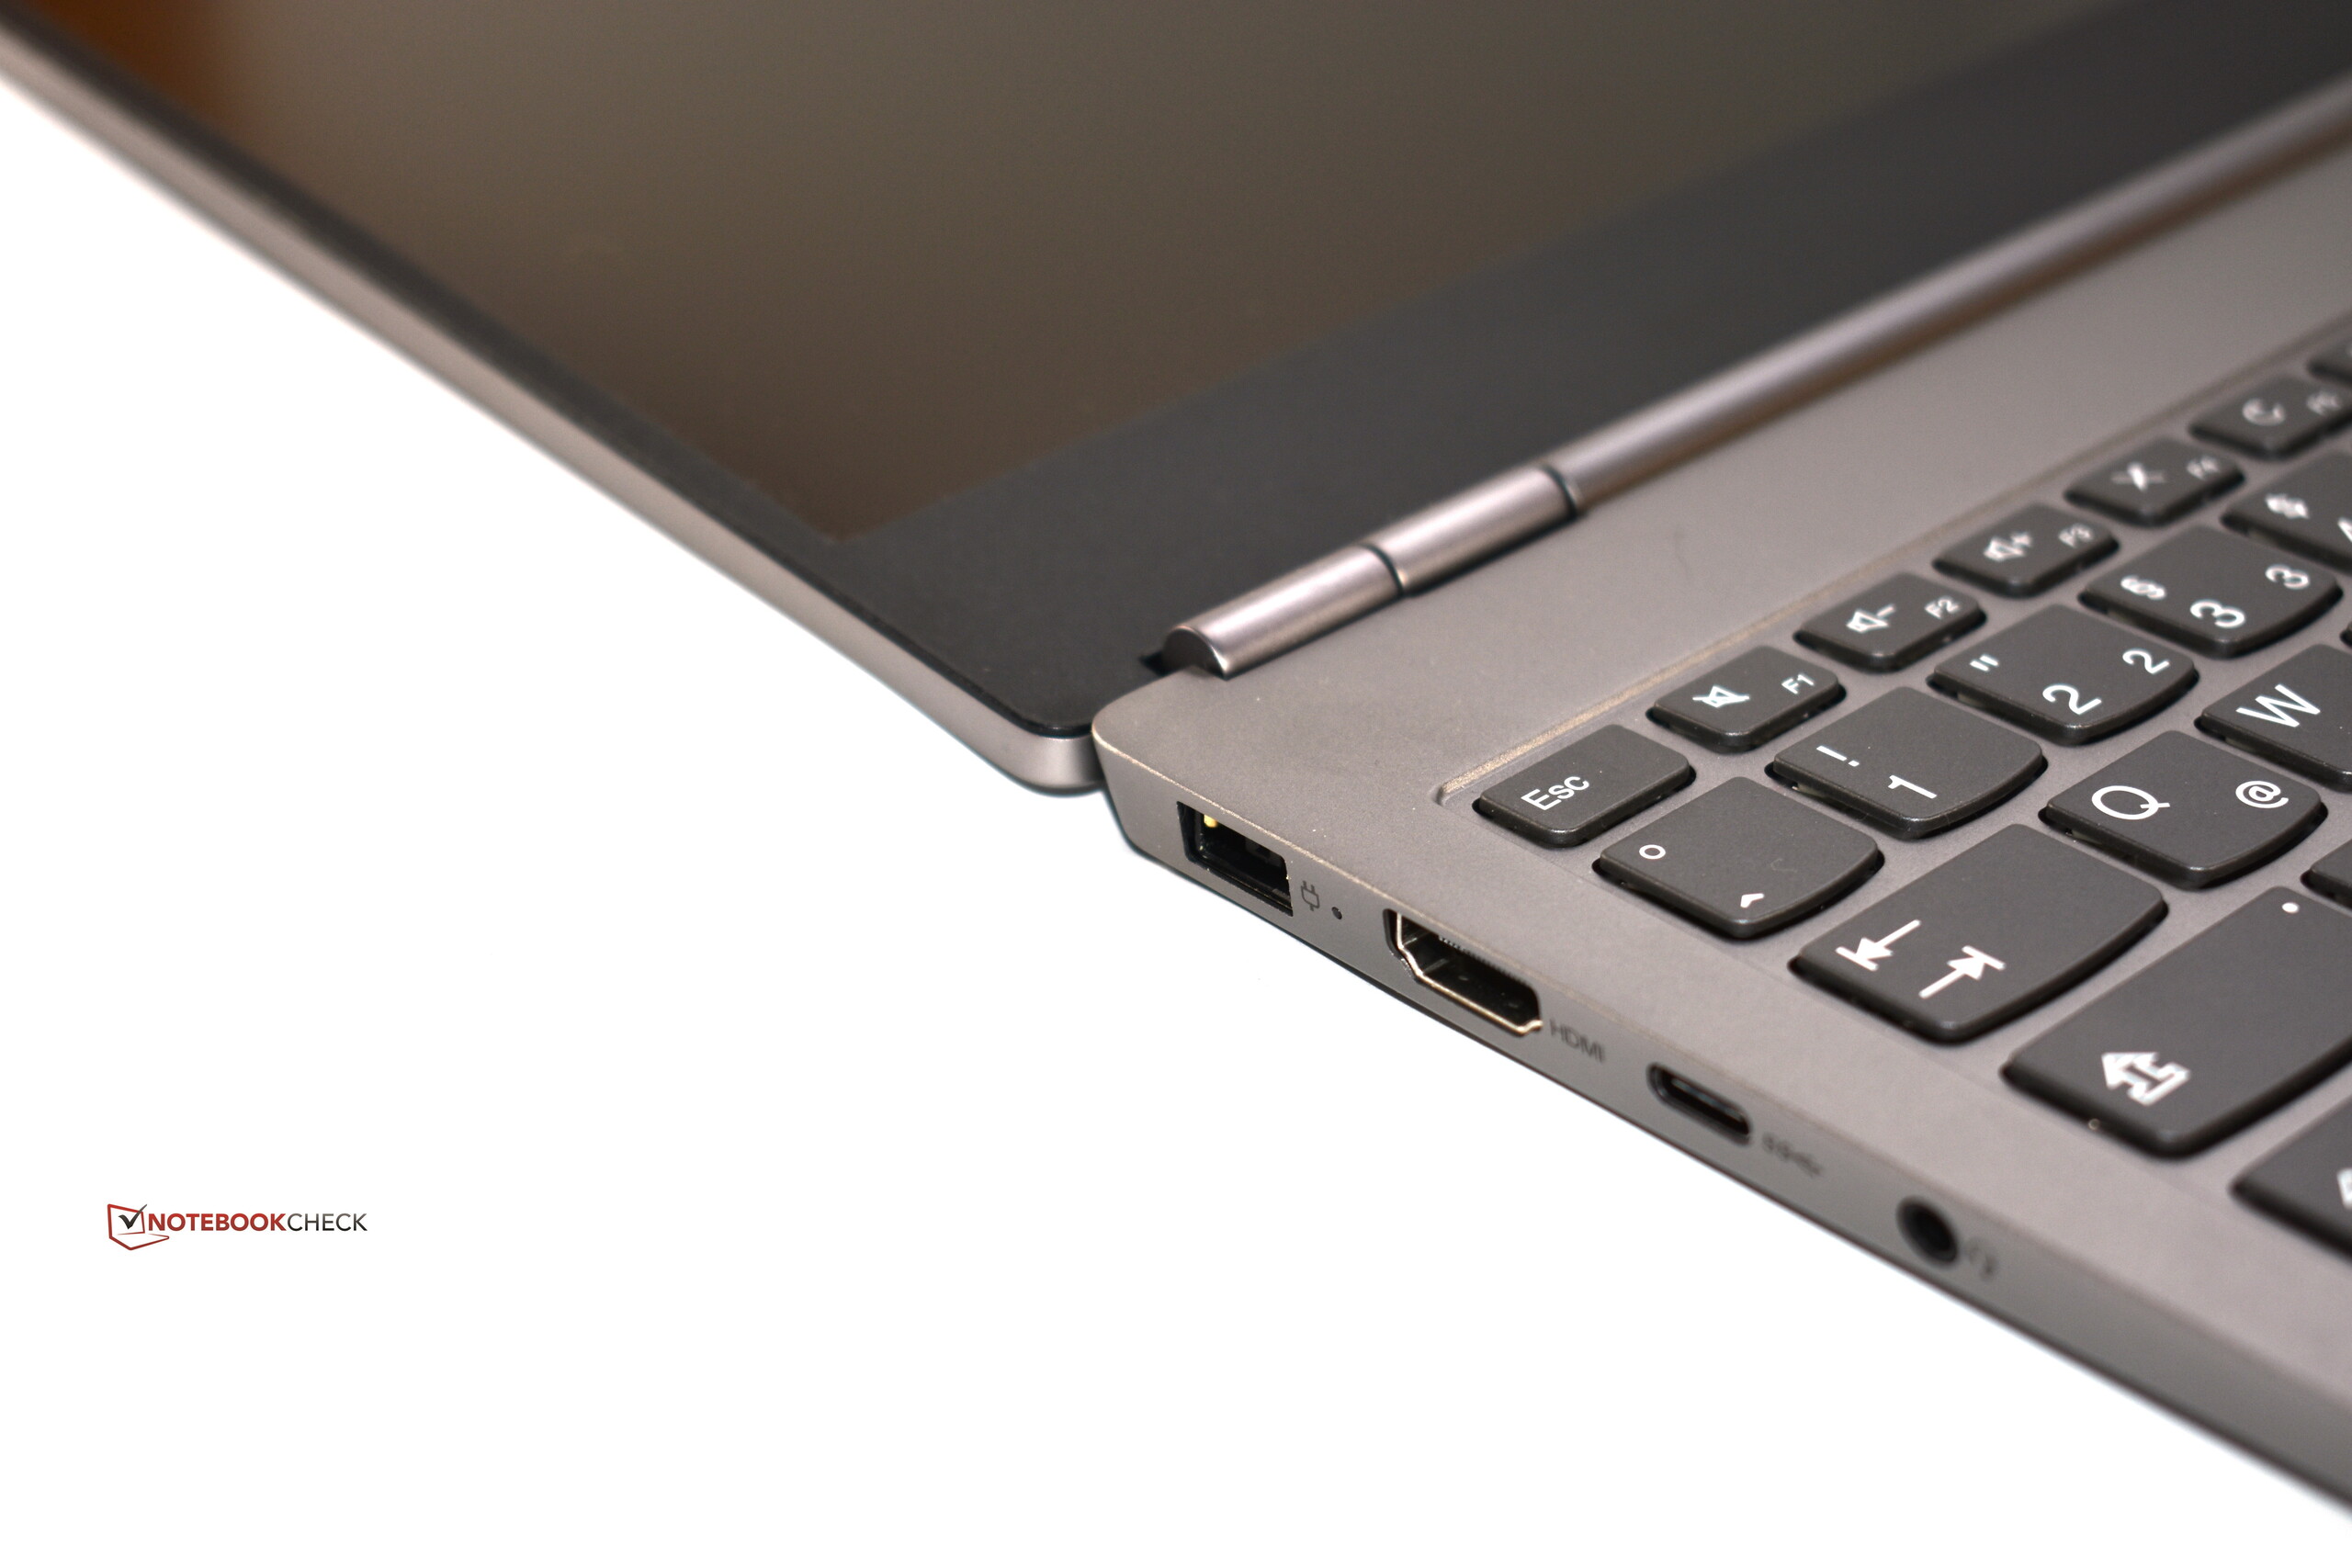
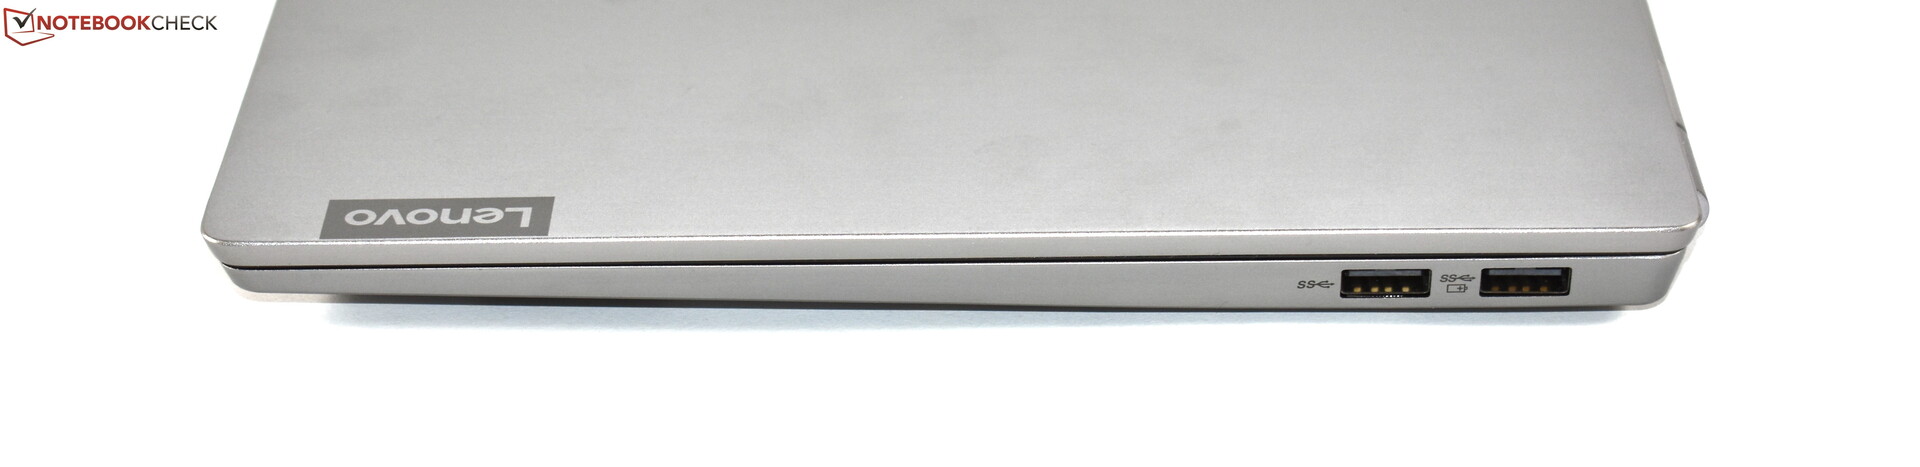
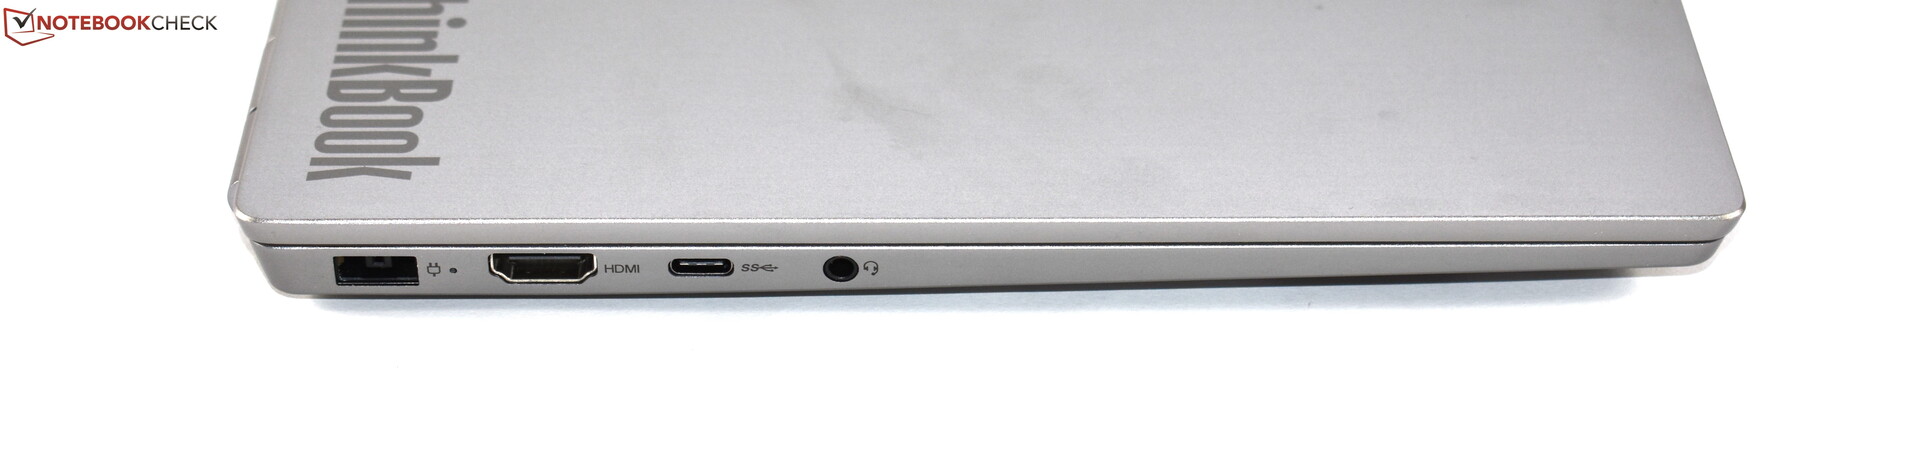
ThinkBook 13s最大的问题是它的接口。具体来说,我们指的是它的安全性和通信功能以及端口的选择,这使ThinkBook 13s无法与这三个类别中的任何一个在现实世界中的商务笔记本电脑竞争。尽管我们并不期望联想为它配备Thunderbolt 3端口,但我们无法理解为什么公司决定不支持Type-C充电。相反,我们必须始终使用专有的超薄电源连接器,这带来了不便。一年保修也是ThinkBook 13s一个缺点,巨大的屏幕下巴也是如此。
IdeaPad高级版:ThinkBook 13s结合了ThinkPad的一些功能,例如磨砂显示屏和ThinkPad与IdeaPad硬件。对于买家来说,ThinkBook 13s可能是一个有吸引力的产品,但它不是ThinkPad的替代品。
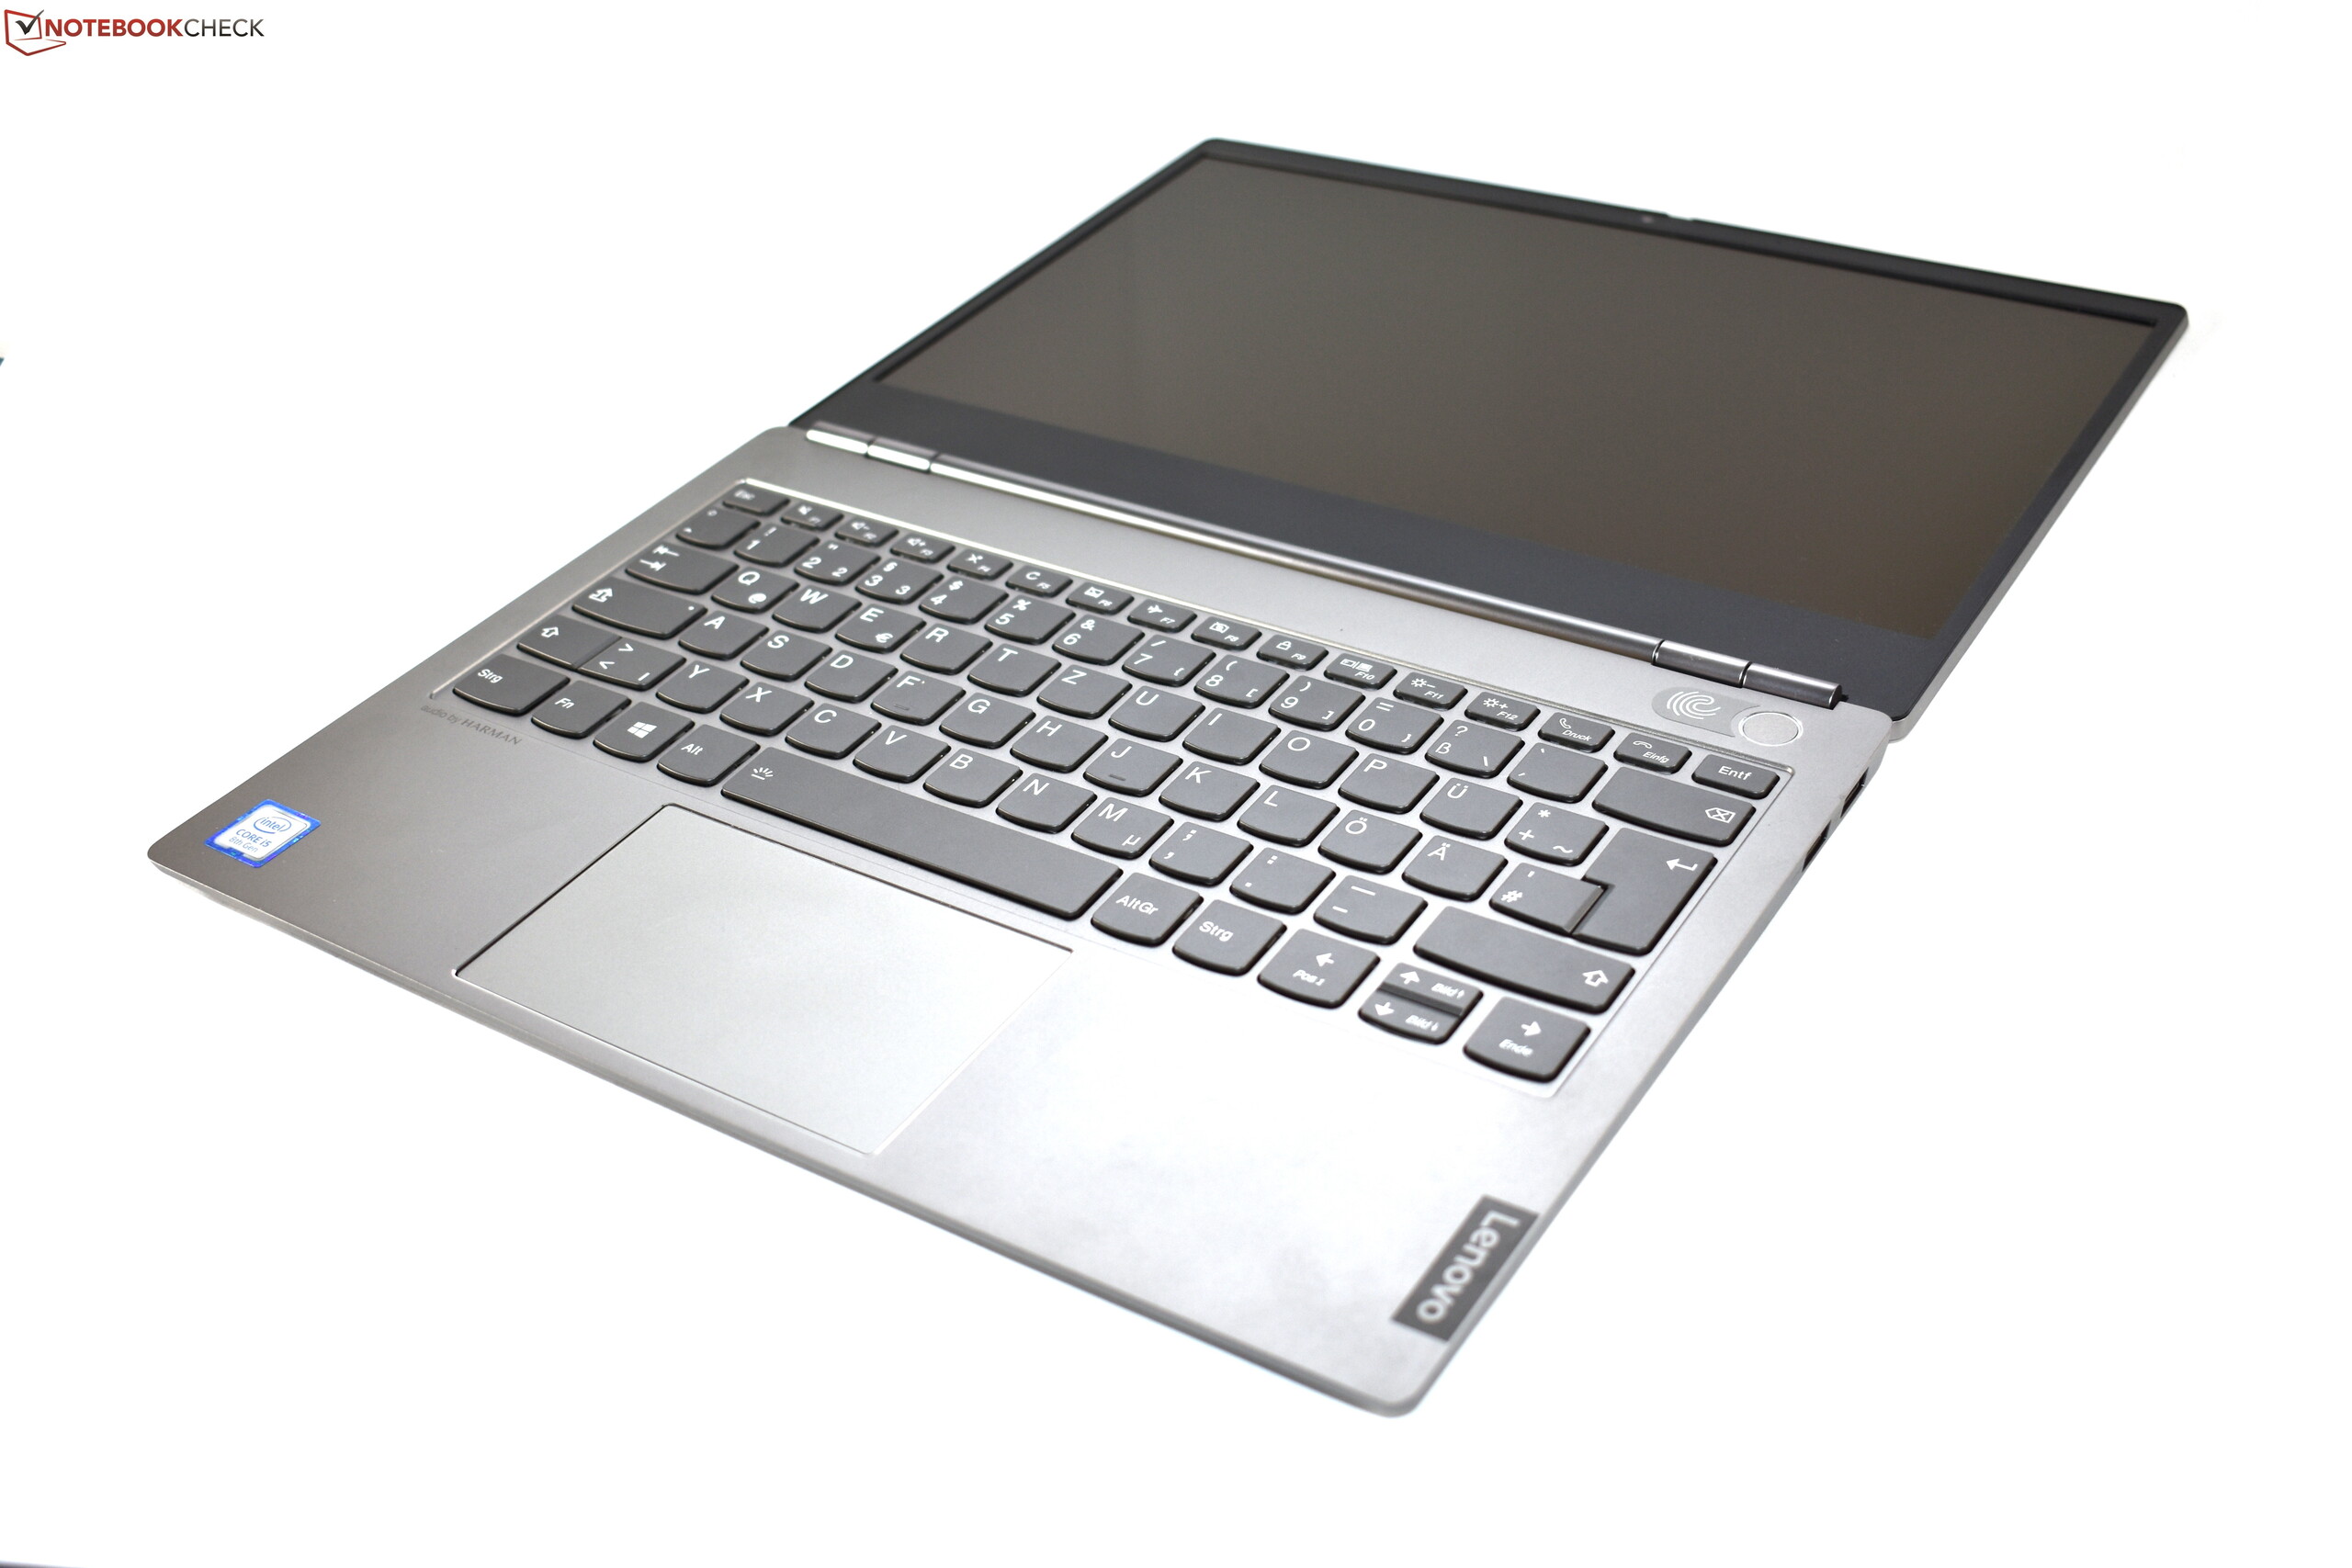
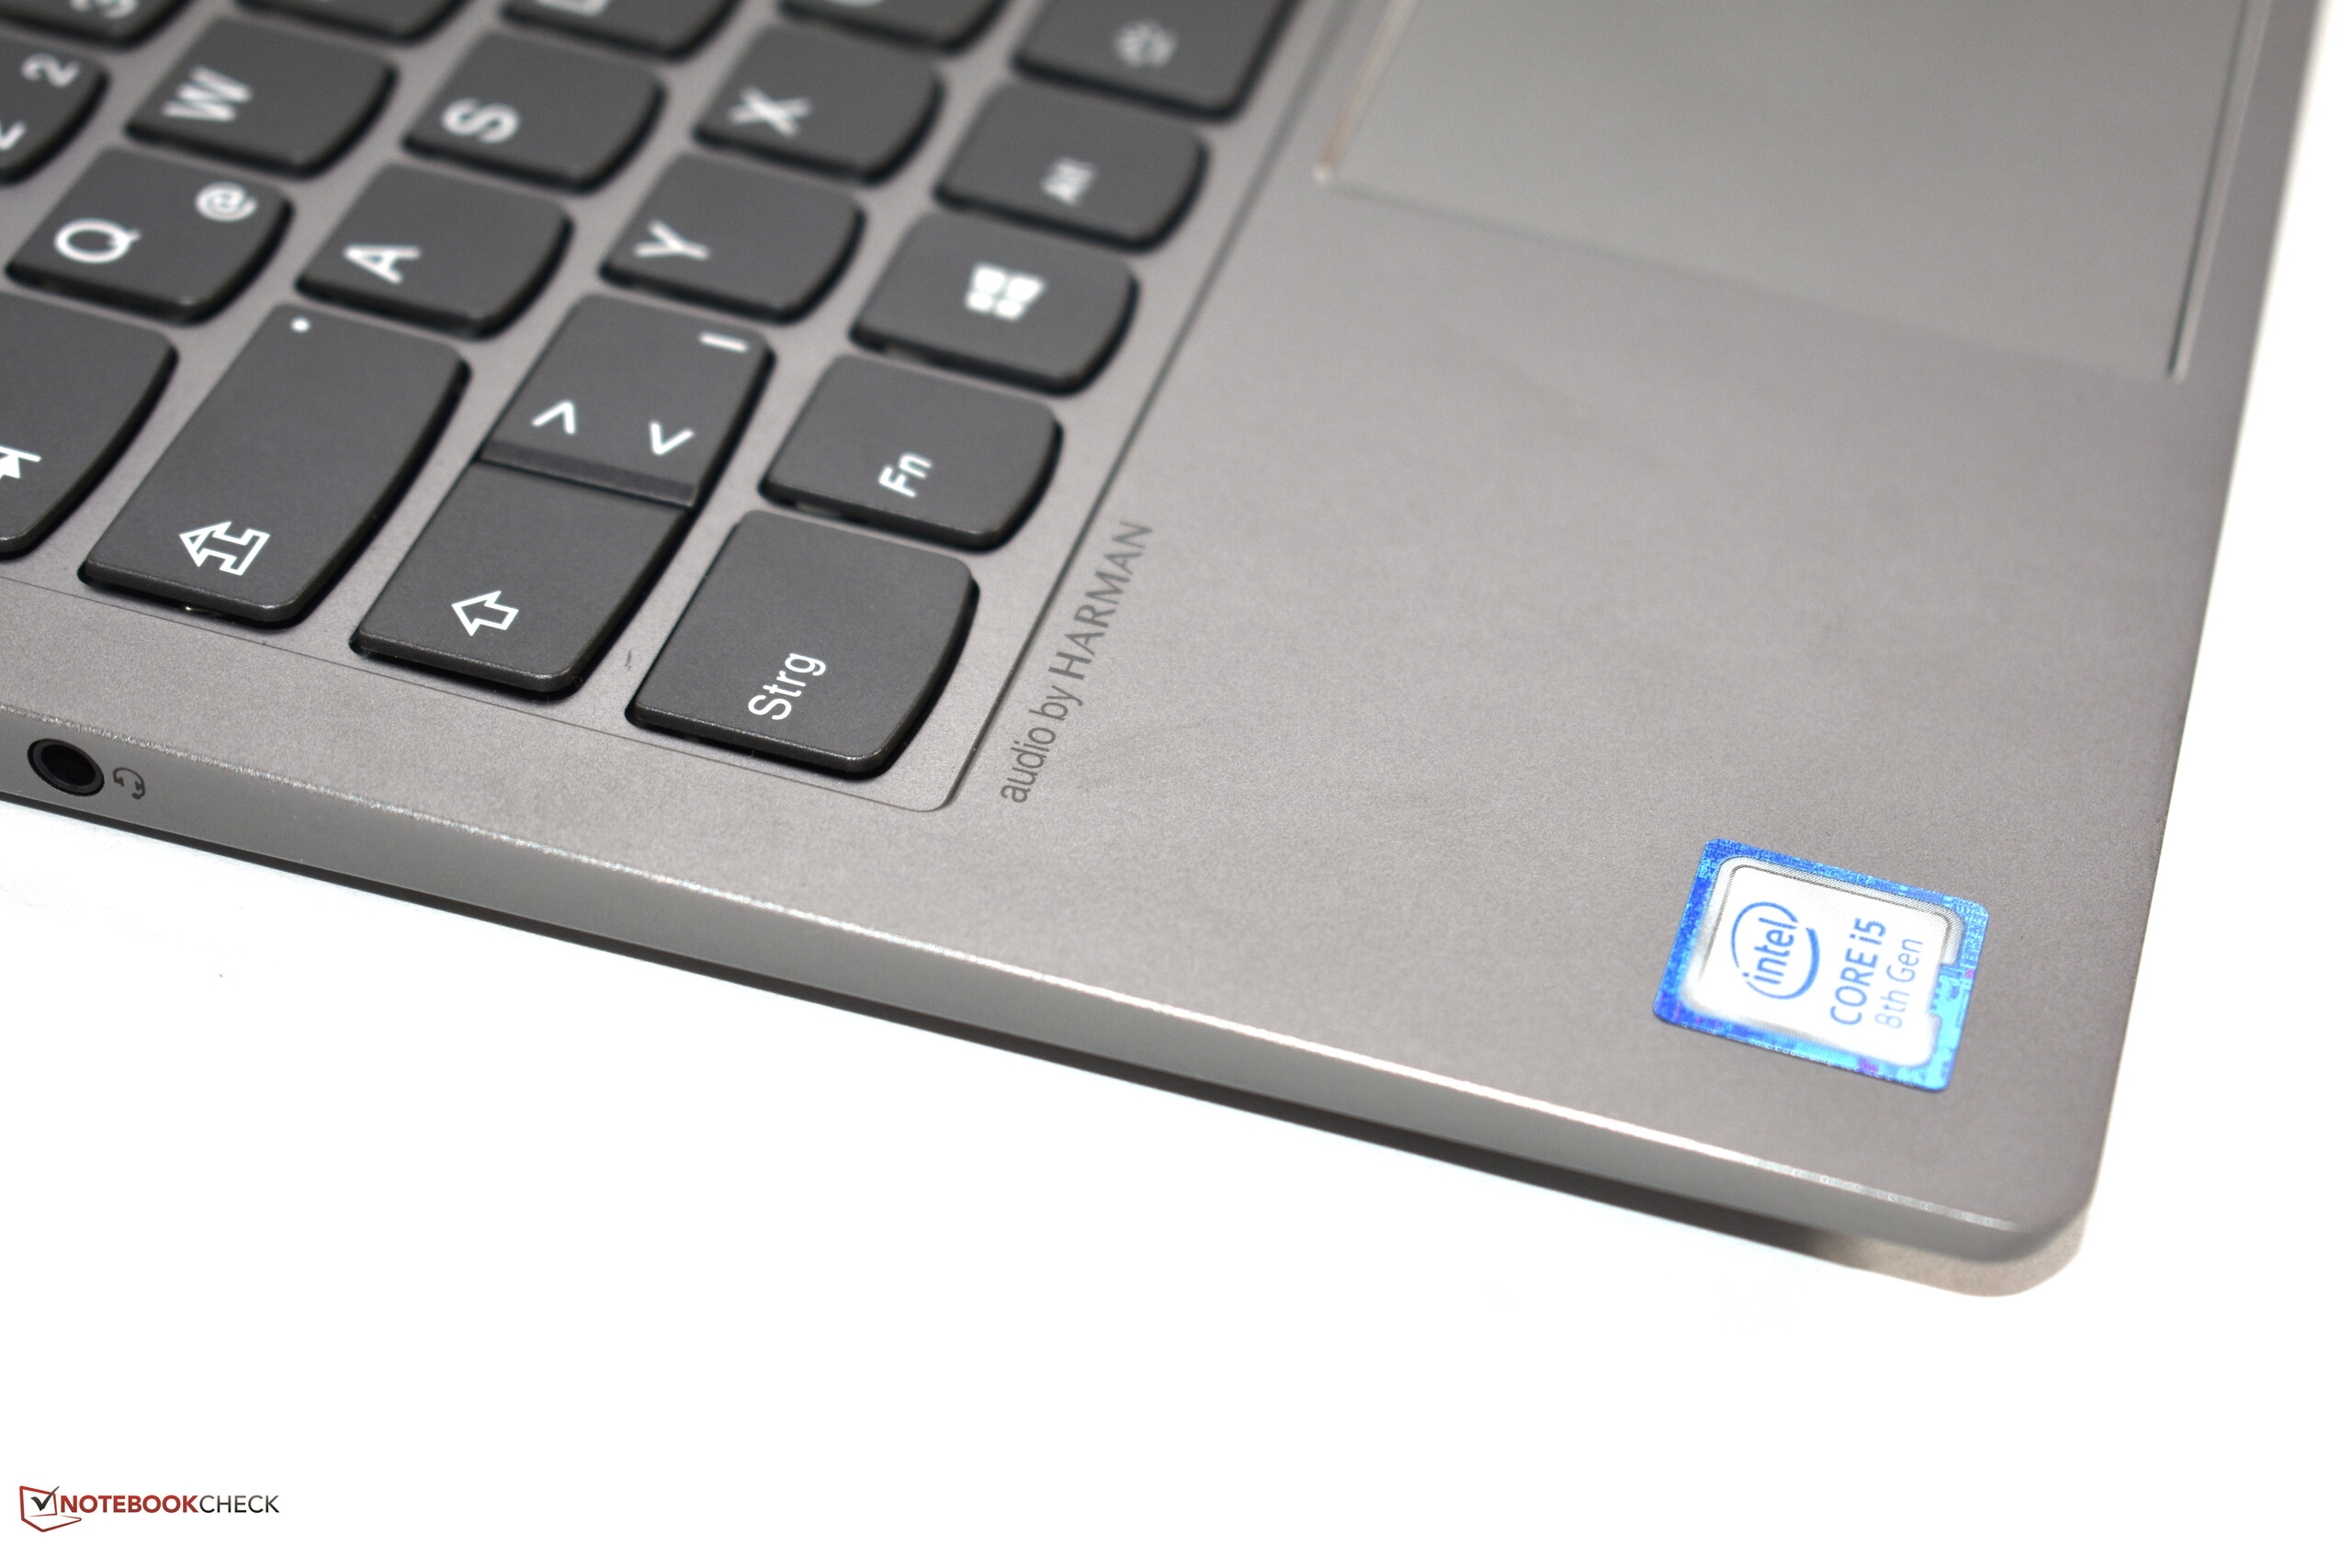
总体而言,联想ThinkBook 13s是一台不错的笔记本电脑,但更像IdeaPad而不是ThinkPad。它的键盘和触控板就是证明,ThinkBook不仅缺少TrackPoint,而且缺乏我们对ThinkPad笔记本电脑所期望的高质量打字体验。简而言之,对于普通公众或学生而言,ThinkBook 13s可能是成熟品牌的有趣替代品,但如果您需要商用笔记本电脑,则不是一个合适的选择。话虽如此,如果您愿意放弃它所缺少的ThinkPad功能,那么还有比ThinkBook 13s更好的13.3英寸笔记本电脑。
Lenovo ThinkBook 13s-20R90071GE
- 09/26/2019 v7 (old)
Benjamin Herzig
Price comparison

