联想ThinkPad L390(i5-8265U, FHD)笔记本电脑评测
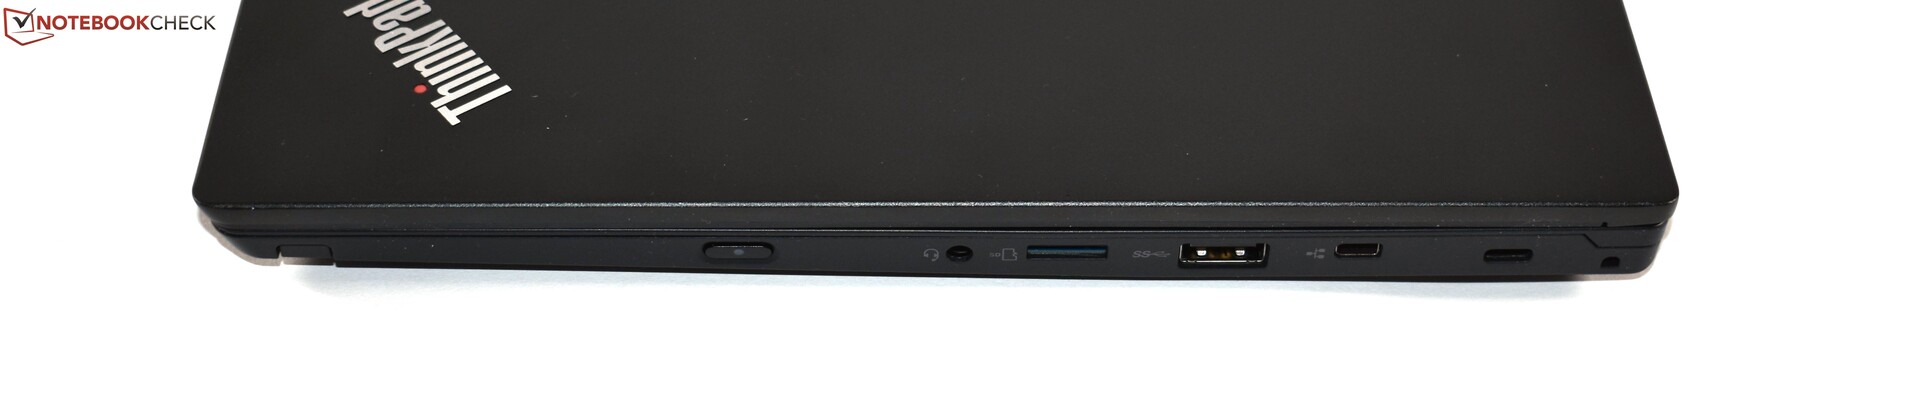
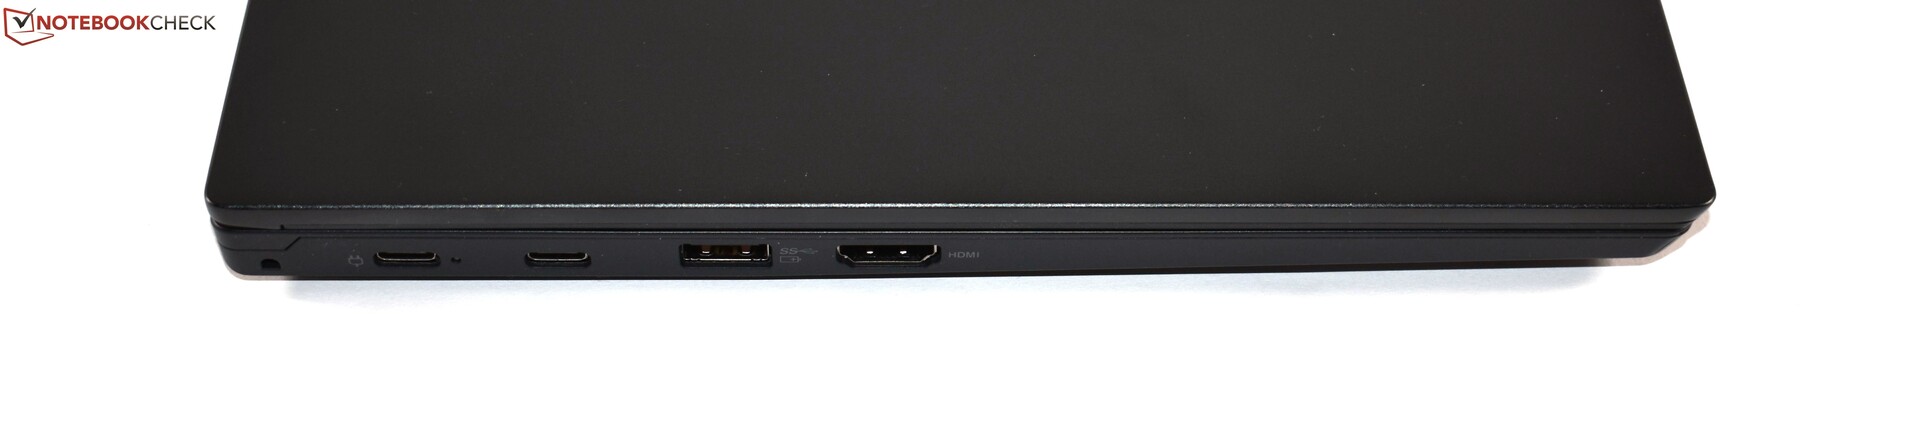
Connectivity
| SD Card Reader | |
| average JPG Copy Test (av. of 3 runs) | |
| Dell XPS 13 9380 2019 (Toshiba Exceria Pro SDXC 64 GB UHS-II) | |
| Dell Latitude 7390 (Toshiba Exceria Pro M501 UHS-II) | |
| HP ProBook 430 G5-3KX72ES (Toshiba Exceria Pro SDXC 64 GB UHS-II) | |
| Lenovo ThinkPad L390-20NR0013GE (Toshiba Exceria Pro M501 UHS-II) | |
| Lenovo ThinkPad L380-20M5000WGE (Toshiba Exceria Pro M501 microSDXC 64GB) | |
| Average of class Office (22.4 - 198.5, n=21, last 2 years) | |
| maximum AS SSD Seq Read Test (1GB) | |
| Dell Latitude 7390 (Toshiba Exceria Pro M501 UHS-II) | |
| Dell XPS 13 9380 2019 (Toshiba Exceria Pro SDXC 64 GB UHS-II) | |
| HP ProBook 430 G5-3KX72ES (Toshiba Exceria Pro SDXC 64 GB UHS-II) | |
| Lenovo ThinkPad L390-20NR0013GE (Toshiba Exceria Pro M501 UHS-II) | |
| Lenovo ThinkPad L380-20M5000WGE (Toshiba Exceria Pro M501 microSDXC 64GB) | |
| Average of class Office (27.4 - 249, n=20, last 2 years) | |
| Networking | |
| iperf3 transmit AX12 | |
| Lenovo ThinkPad L380-20M5000WGE | |
| Lenovo ThinkPad L390-20NR0013GE | |
| HP ProBook 430 G5-3KX72ES | |
| Dell XPS 13 9380 2019 | |
| HP EliteBook 830 G5-3JX74EA | |
| iperf3 receive AX12 | |
| Lenovo ThinkPad L390-20NR0013GE | |
| HP ProBook 430 G5-3KX72ES | |
| HP EliteBook 830 G5-3JX74EA | |
| Lenovo ThinkPad L380-20M5000WGE | |
| Dell XPS 13 9380 2019 | |
| |||||||||||||||||||||||||
Brightness Distribution: 81 %
Center on Battery: 300 cd/m²
Contrast: 903:1 (Black: 0.33 cd/m²)
ΔE ColorChecker Calman: 6.5 | ∀{0.5-29.43 Ø4.73}
calibrated: 4.9
ΔE Greyscale Calman: 5.6 | ∀{0.09-98 Ø4.97}
60.1% sRGB (Argyll 1.6.3 3D)
38.4% AdobeRGB 1998 (Argyll 1.6.3 3D)
41.8% AdobeRGB 1998 (Argyll 3D)
60.4% sRGB (Argyll 3D)
40.42% Display P3 (Argyll 3D)
Gamma: 2.08
CCT: 6669 K
| Lenovo ThinkPad L390-20NR0013GE LP133WF2-SPL8, , 1920x1080, 13.3" | HP ProBook 430 G5-3KX72ES LGD052D, , 1920x1080, 13.3" | HP EliteBook 830 G5-3JX74EA IVO M133NVF3-R0, , 1920x1080, 13.3" | Dell Latitude 7390 LGD059B, , 1920x1080, 13.3" | Lenovo ThinkPad L380-20M5000WGE Lenovo LEN4094, , 1920x1080, 13.3" | Dell XPS 13 9370 FHD i5 SHP1484, , 1920x1080, 13.3" | |
|---|---|---|---|---|---|---|
| Display | -0% | 54% | 62% | 0% | 66% | |
| Display P3 Coverage (%) | 40.42 | 40.23 0% | 64.2 59% | 67.8 68% | 40.34 0% | 68.9 70% |
| sRGB Coverage (%) | 60.4 | 60.3 0% | 89.2 48% | 95.1 57% | 60.7 0% | 96.6 60% |
| AdobeRGB 1998 Coverage (%) | 41.8 | 41.59 -1% | 65.2 56% | 67.8 62% | 41.69 0% | 69.6 67% |
| Response Times | 6% | 17% | 7% | 5% | -49% | |
| Response Time Grey 50% / Grey 80% * (ms) | 42.8 ? | 41.6 ? 3% | 36 ? 16% | 36.8 ? 14% | 44 ? -3% | 62.4 ? -46% |
| Response Time Black / White * (ms) | 30 ? | 27.2 ? 9% | 24.8 ? 17% | 30.4 ? -1% | 26 ? 13% | 45.6 ? -52% |
| PWM Frequency (Hz) | 30490 ? | 20490 ? | 1020 ? | 1008 ? | ||
| Screen | 5% | 35% | 34% | 2% | 46% | |
| Brightness middle (cd/m²) | 298 | 262 -12% | 316 6% | 303.8 2% | 271 -9% | 428 44% |
| Brightness (cd/m²) | 278 | 253 -9% | 326 17% | 289 4% | 253 -9% | 405 46% |
| Brightness Distribution (%) | 81 | 82 1% | 85 5% | 86 6% | 89 10% | 87 7% |
| Black Level * (cd/m²) | 0.33 | 0.28 15% | 0.19 42% | 0.31 6% | 0.17 48% | 0.26 21% |
| Contrast (:1) | 903 | 936 4% | 1663 84% | 980 9% | 1594 77% | 1646 82% |
| Colorchecker dE 2000 * | 6.5 | 5.7 12% | 4.5 31% | 2.9 55% | 14.89 -129% | 3.8 42% |
| Colorchecker dE 2000 max. * | 23.9 | 22.4 6% | 12.1 49% | 5.79 76% | 31.08 -30% | 7.2 70% |
| Colorchecker dE 2000 calibrated * | 4.9 | 4.8 2% | 2.9 41% | 1.72 65% | 4.43 10% | |
| Greyscale dE 2000 * | 5.6 | 3.6 36% | 5 11% | 3.7 34% | 2.51 55% | 4.4 21% |
| Gamma | 2.08 106% | 2.15 102% | 2.22 99% | 2.118 104% | 2.14 103% | 2.21 100% |
| CCT | 6669 97% | 7096 92% | 6018 108% | 6323 103% | 6455 101% | 7067 92% |
| Color Space (Percent of AdobeRGB 1998) (%) | 38.4 | 38.3 0% | 57.9 51% | 63 64% | 38 -1% | 62.8 64% |
| Color Space (Percent of sRGB) (%) | 60.1 | 60.1 0% | 87.3 45% | 95 58% | 60 0% | 96.4 60% |
| Total Average (Program / Settings) | 4% /
4% | 35% /
36% | 34% /
36% | 2% /
2% | 21% /
37% |
* ... smaller is better
Display Response Times
| ↔ Response Time Black to White | ||
|---|---|---|
| 30 ms ... rise ↗ and fall ↘ combined | ↗ 15.2 ms rise | 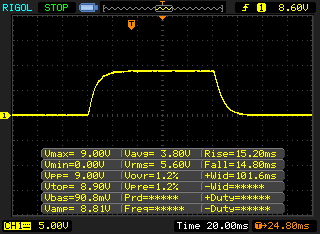 |
| ↘ 14.8 ms fall | ||
| The screen shows slow response rates in our tests and will be unsatisfactory for gamers. In comparison, all tested devices range from 0.1 (minimum) to 240 (maximum) ms. » 80 % of all devices are better. This means that the measured response time is worse than the average of all tested devices (19.9 ms). | ||
| ↔ Response Time 50% Grey to 80% Grey | ||
| 42.8 ms ... rise ↗ and fall ↘ combined | ↗ 22.8 ms rise | 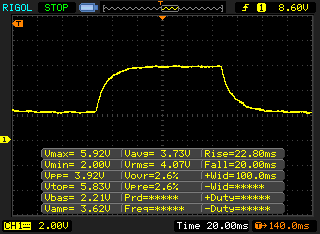 |
| ↘ 20 ms fall | ||
| The screen shows slow response rates in our tests and will be unsatisfactory for gamers. In comparison, all tested devices range from 0.165 (minimum) to 636 (maximum) ms. » 70 % of all devices are better. This means that the measured response time is worse than the average of all tested devices (31.1 ms). | ||
Screen Flickering / PWM (Pulse-Width Modulation)
| Screen flickering / PWM detected | 30490 Hz | ≤ 99 % brightness setting | 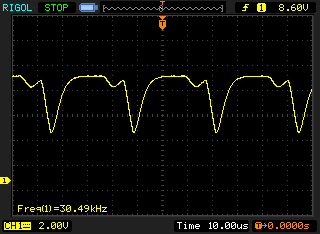 |
The display backlight flickers at 30490 Hz (worst case, e.g., utilizing PWM) Flickering detected at a brightness setting of 99 % and below. There should be no flickering or PWM above this brightness setting. The frequency of 30490 Hz is quite high, so most users sensitive to PWM should not notice any flickering. In comparison: 52 % of all tested devices do not use PWM to dim the display. If PWM was detected, an average of 7794 (minimum: 5 - maximum: 343500) Hz was measured. | |||
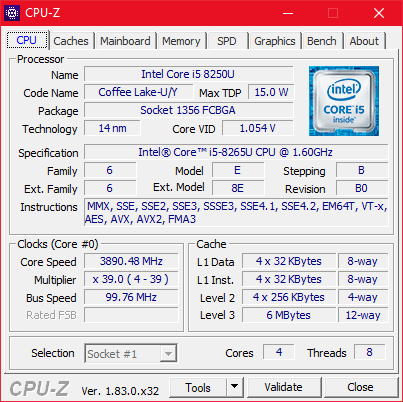
| Cinebench R15 | |
| CPU Single 64Bit | |
| Average of class Office (99.5 - 312, n=74, last 2 years) | |
| Dell Latitude 7390 | |
| HP EliteBook 830 G5-3JX74EA | |
| Lenovo ThinkPad L390-20NR0013GE | |
| Average Intel Core i5-8265U (111 - 164, n=35) | |
| Dell XPS 13 9380 2019 | |
| HP ProBook 430 G5-3KX72ES | |
| Lenovo ThinkPad L380-20M5000WGE | |
| CPU Multi 64Bit | |
| Average of class Office (250 - 3380, n=74, last 2 years) | |
| Dell XPS 13 9380 2019 | |
| Dell Latitude 7390 | |
| Lenovo ThinkPad L390-20NR0013GE | |
| Average Intel Core i5-8265U (457 - 750, n=38) | |
| HP ProBook 430 G5-3KX72ES | |
| HP EliteBook 830 G5-3JX74EA | |
| Lenovo ThinkPad L380-20M5000WGE | |
| PCMark 8 | |
| Home Score Accelerated v2 | |
| Average of class Office (n=1last 2 years) | |
| HP EliteBook 830 G5-3JX74EA | |
| Dell Latitude 7390 | |
| HP ProBook 430 G5-3KX72ES | |
| Lenovo ThinkPad L380-20M5000WGE | |
| Dell XPS 13 9380 2019 | |
| Average Intel Core i5-8265U, Intel UHD Graphics 620 (2747 - 4244, n=24) | |
| Lenovo ThinkPad L390-20NR0013GE | |
| Work Score Accelerated v2 | |
| Average of class Office (n=1last 2 years) | |
| Dell Latitude 7390 | |
| HP EliteBook 830 G5-3JX74EA | |
| Lenovo ThinkPad L390-20NR0013GE | |
| HP ProBook 430 G5-3KX72ES | |
| Average Intel Core i5-8265U, Intel UHD Graphics 620 (3132 - 4927, n=23) | |
| Lenovo ThinkPad L380-20M5000WGE | |
| Dell XPS 13 9380 2019 | |
| PCMark 8 Home Score Accelerated v2 | 3378 points | |
| PCMark 8 Work Score Accelerated v2 | 4737 points | |
| PCMark 10 Score | 3787 points | |
Help | ||
| Lenovo ThinkPad L390-20NR0013GE Samsung SSD PM981 MZVLB256HAHQ | HP ProBook 430 G5-3KX72ES Toshiba XG5 KXG50ZNV512G | HP EliteBook 830 G5-3JX74EA Samsung SSD PM961 1TB M.2 PCIe 3.0 x4 NVMe (MZVLW1T0) | Dell Latitude 7390 Samsung PM961 MZVLW256HEHP | Dell XPS 13 9380 2019 SK hynix PC401 HFS256GD9TNG | Lenovo ThinkPad L380-20M5000WGE Samsung PM961 MZVLW256HEHP | Average Samsung SSD PM981 MZVLB256HAHQ | |
|---|---|---|---|---|---|---|---|
| CrystalDiskMark 5.2 / 6 | -19% | 1% | 11% | -28% | 6% | 54% | |
| Write 4K (MB/s) | 99.6 | 111.3 12% | 108.5 9% | 139.4 40% | 84.6 -15% | 121.3 22% | 116.1 ? 17% |
| Read 4K (MB/s) | 37.22 | 32.46 -13% | 40.53 9% | 43.18 16% | 38.52 3% | 41.89 13% | 189.5 ? 409% |
| Write Seq (MB/s) | 1432 | 526 -63% | 1026 -28% | 1075 -25% | 557 -61% | 878 -39% | 1409 ? -2% |
| Read Seq (MB/s) | 2072 | 1430 -31% | 2080 0% | 1639 -21% | 1393 -33% | 1963 -5% | 1624 ? -22% |
| Write 4K Q32T1 (MB/s) | 439.7 | 516 17% | 451 3% | 662 51% | 339.5 -23% | 543 23% | 360 ? -18% |
| Read 4K Q32T1 (MB/s) | 264.8 | 366.6 38% | 269.7 2% | 413.9 56% | 255.4 -4% | 397.7 50% | 396 ? 50% |
| Write Seq Q32T1 (MB/s) | 1549 | 524 -66% | 1770 14% | 1195 -23% | 558 -64% | 1204 -22% | 1492 ? -4% |
| Read Seq Q32T1 (MB/s) | 3318 | 1783 -46% | 3214 -3% | 3116 -6% | 2541 -23% | 3387 2% | 3313 ? 0% |

| 3DMark 11 - 1280x720 Performance GPU | |
| Average of class Office (2551 - 18313, n=68, last 2 years) | |
| Dell XPS 13 9380 2019 | |
| Average Intel UHD Graphics 620 (1144 - 3432, n=244) | |
| HP EliteBook 830 G5-3JX74EA | |
| Lenovo ThinkPad L390-20NR0013GE | |
| Dell Latitude 7390 | |
| HP ProBook 430 G5-3KX72ES | |
| Lenovo ThinkPad L380-20M5000WGE | |
| 3DMark | |
| 1280x720 Cloud Gate Standard Graphics | |
| Average of class Office (11640 - 118515, n=37, last 2 years) | |
| Dell XPS 13 9380 2019 | |
| HP EliteBook 830 G5-3JX74EA | |
| Average Intel UHD Graphics 620 (6205 - 16400, n=225) | |
| HP ProBook 430 G5-3KX72ES | |
| Dell Latitude 7390 | |
| Lenovo ThinkPad L390-20NR0013GE | |
| Lenovo ThinkPad L380-20M5000WGE | |
| 1920x1080 Fire Strike Graphics | |
| Average of class Office (736 - 21871, n=72, last 2 years) | |
| HP EliteBook 830 G5-3JX74EA | |
| Average Intel UHD Graphics 620 (557 - 2608, n=213) | |
| HP ProBook 430 G5-3KX72ES | |
| Lenovo ThinkPad L390-20NR0013GE | |
| Lenovo ThinkPad L380-20M5000WGE | |
| Dell Latitude 7390 | |
| 3DMark 11 Performance | 1863 points | |
| 3DMark Cloud Gate Standard Score | 7458 points | |
| 3DMark Fire Strike Score | 934 points | |
Help | ||
| low | med. | high | ultra | |
|---|---|---|---|---|
| BioShock Infinite (2013) | 54.7 | 28.33 | 23.19 | |
| The Witcher 3 (2015) | 14.7 | |||
| Rise of the Tomb Raider (2016) | 20.1 |
Noise level
| Idle |
| 29.5 / 29.5 / 29.5 dB(A) |
| Load |
| 30.6 / 31.5 dB(A) |
 | ||
30 dB silent 40 dB(A) audible 50 dB(A) loud |
||
min: | ||
(-) The maximum temperature on the upper side is 47.5 °C / 118 F, compared to the average of 34.3 °C / 94 F, ranging from 21.2 to 62.5 °C for the class Office.
(-) The bottom heats up to a maximum of 51.3 °C / 124 F, compared to the average of 36.8 °C / 98 F
(+) In idle usage, the average temperature for the upper side is 24 °C / 75 F, compared to the device average of 29.5 °C / 85 F.
(+) The palmrests and touchpad are cooler than skin temperature with a maximum of 25.1 °C / 77.2 F and are therefore cool to the touch.
(+) The average temperature of the palmrest area of similar devices was 27.5 °C / 81.5 F (+2.4 °C / 4.3 F).
Lenovo ThinkPad L390-20NR0013GE audio analysis
(±) | speaker loudness is average but good (76.1 dB)
Bass 100 - 315 Hz
(-) | nearly no bass - on average 18.2% lower than median
(±) | linearity of bass is average (11.5% delta to prev. frequency)
Mids 400 - 2000 Hz
(+) | balanced mids - only 2.1% away from median
(+) | mids are linear (6.3% delta to prev. frequency)
Highs 2 - 16 kHz
(±) | higher highs - on average 7.1% higher than median
(+) | highs are linear (4.2% delta to prev. frequency)
Overall 100 - 16.000 Hz
(±) | linearity of overall sound is average (22% difference to median)
Compared to same class
» 57% of all tested devices in this class were better, 8% similar, 35% worse
» The best had a delta of 7%, average was 21%, worst was 53%
Compared to all devices tested
» 63% of all tested devices were better, 6% similar, 30% worse
» The best had a delta of 4%, average was 24%, worst was 134%
HP EliteBook 830 G5-3JX74EA audio analysis
(+) | speakers can play relatively loud (82.7 dB)
Bass 100 - 315 Hz
(-) | nearly no bass - on average 19.9% lower than median
(±) | linearity of bass is average (11.3% delta to prev. frequency)
Mids 400 - 2000 Hz
(+) | balanced mids - only 2.3% away from median
(+) | mids are linear (4.8% delta to prev. frequency)
Highs 2 - 16 kHz
(+) | balanced highs - only 4% away from median
(+) | highs are linear (5.6% delta to prev. frequency)
Overall 100 - 16.000 Hz
(±) | linearity of overall sound is average (17% difference to median)
Compared to same class
» 43% of all tested devices in this class were better, 8% similar, 49% worse
» The best had a delta of 5%, average was 18%, worst was 53%
Compared to all devices tested
» 30% of all tested devices were better, 8% similar, 62% worse
» The best had a delta of 4%, average was 24%, worst was 134%
| Off / Standby | |
| Idle | |
| Load |
|
Key:
min: | |
| Lenovo ThinkPad L390-20NR0013GE i5-8265U, UHD Graphics 620, Samsung SSD PM981 MZVLB256HAHQ, IPS LED, 1920x1080, 13.3" | HP ProBook 430 G5-3KX72ES i5-8250U, UHD Graphics 620, Toshiba XG5 KXG50ZNV512G, IPS LED, 1920x1080, 13.3" | HP EliteBook 830 G5-3JX74EA i5-8550U, UHD Graphics 620, Samsung SSD PM961 1TB M.2 PCIe 3.0 x4 NVMe (MZVLW1T0), IPS LED, 1920x1080, 13.3" | Dell Latitude 7390 i7-8650U, UHD Graphics 620, Samsung PM961 MZVLW256HEHP, IPS, 1920x1080, 13.3" | Dell XPS 13 9380 2019 i5-8265U, UHD Graphics 620, SK hynix PC401 HFS256GD9TNG, IPS, 3840x2160, 13.3" | Lenovo ThinkPad L380-20M5000WGE i5-8250U, UHD Graphics 620, Samsung PM961 MZVLW256HEHP, IPS, 1920x1080, 13.3" | Average Intel UHD Graphics 620 | Average of class Office | |
|---|---|---|---|---|---|---|---|---|
| Power Consumption | -2% | -8% | 9% | -14% | 20% | 2% | -14% | |
| Idle Minimum * (Watt) | 3.8 | 4.5 -18% | 4.5 -18% | 3.3 13% | 4.8 -26% | 2.7 29% | 3.81 ? -0% | 4.44 ? -17% |
| Idle Average * (Watt) | 6.8 | 6.8 -0% | 6.4 6% | 5.9 13% | 8.6 -26% | 5.6 18% | 6.94 ? -2% | 7.38 ? -9% |
| Idle Maximum * (Watt) | 9.8 | 8.8 10% | 9.2 6% | 6.2 37% | 10.4 -6% | 9.2 6% | 8.75 ? 11% | 8.59 ? 12% |
| Load Average * (Watt) | 32.4 | 36.8 -14% | 35.7 -10% | 43.2 -33% | 37.9 -17% | 30 7% | 35 ? -8% | 43 ? -33% |
| Load Maximum * (Watt) | 52 | 46.2 11% | 65.4 -26% | 45.2 13% | 48.5 7% | 30.4 42% | 47.5 ? 9% | 64.5 ? -24% |
* ... smaller is better
| Lenovo ThinkPad L390-20NR0013GE i5-8265U, UHD Graphics 620, 45 Wh | HP ProBook 430 G5-3KX72ES i5-8250U, UHD Graphics 620, 48 Wh | HP EliteBook 830 G5-3JX74EA i5-8550U, UHD Graphics 620, 49 Wh | Dell Latitude 7390 i7-8650U, UHD Graphics 620, 60 Wh | Dell XPS 13 9380 2019 i5-8265U, UHD Graphics 620, 52 Wh | Lenovo ThinkPad L380-20M5000WGE i5-8250U, UHD Graphics 620, 45 Wh | Average of class Office | |
|---|---|---|---|---|---|---|---|
| Battery runtime | 0% | 7% | 59% | 32% | 42% | 55% | |
| Reader / Idle (h) | 16.2 | 12.8 -21% | 17.2 6% | 18.8 16% | 23.7 ? 46% | ||
| H.264 (h) | 9.4 | 8 -15% | 15 ? 60% | ||||
| WiFi v1.3 (h) | 7 | 7 0% | 7.1 1% | 11.1 59% | 8.3 19% | 11.6 66% | 12.9 ? 84% |
| Load (h) | 1.4 | 2.3 64% | 2.4 71% | 2 43% | 1.807 ? 29% |
Pros
Cons

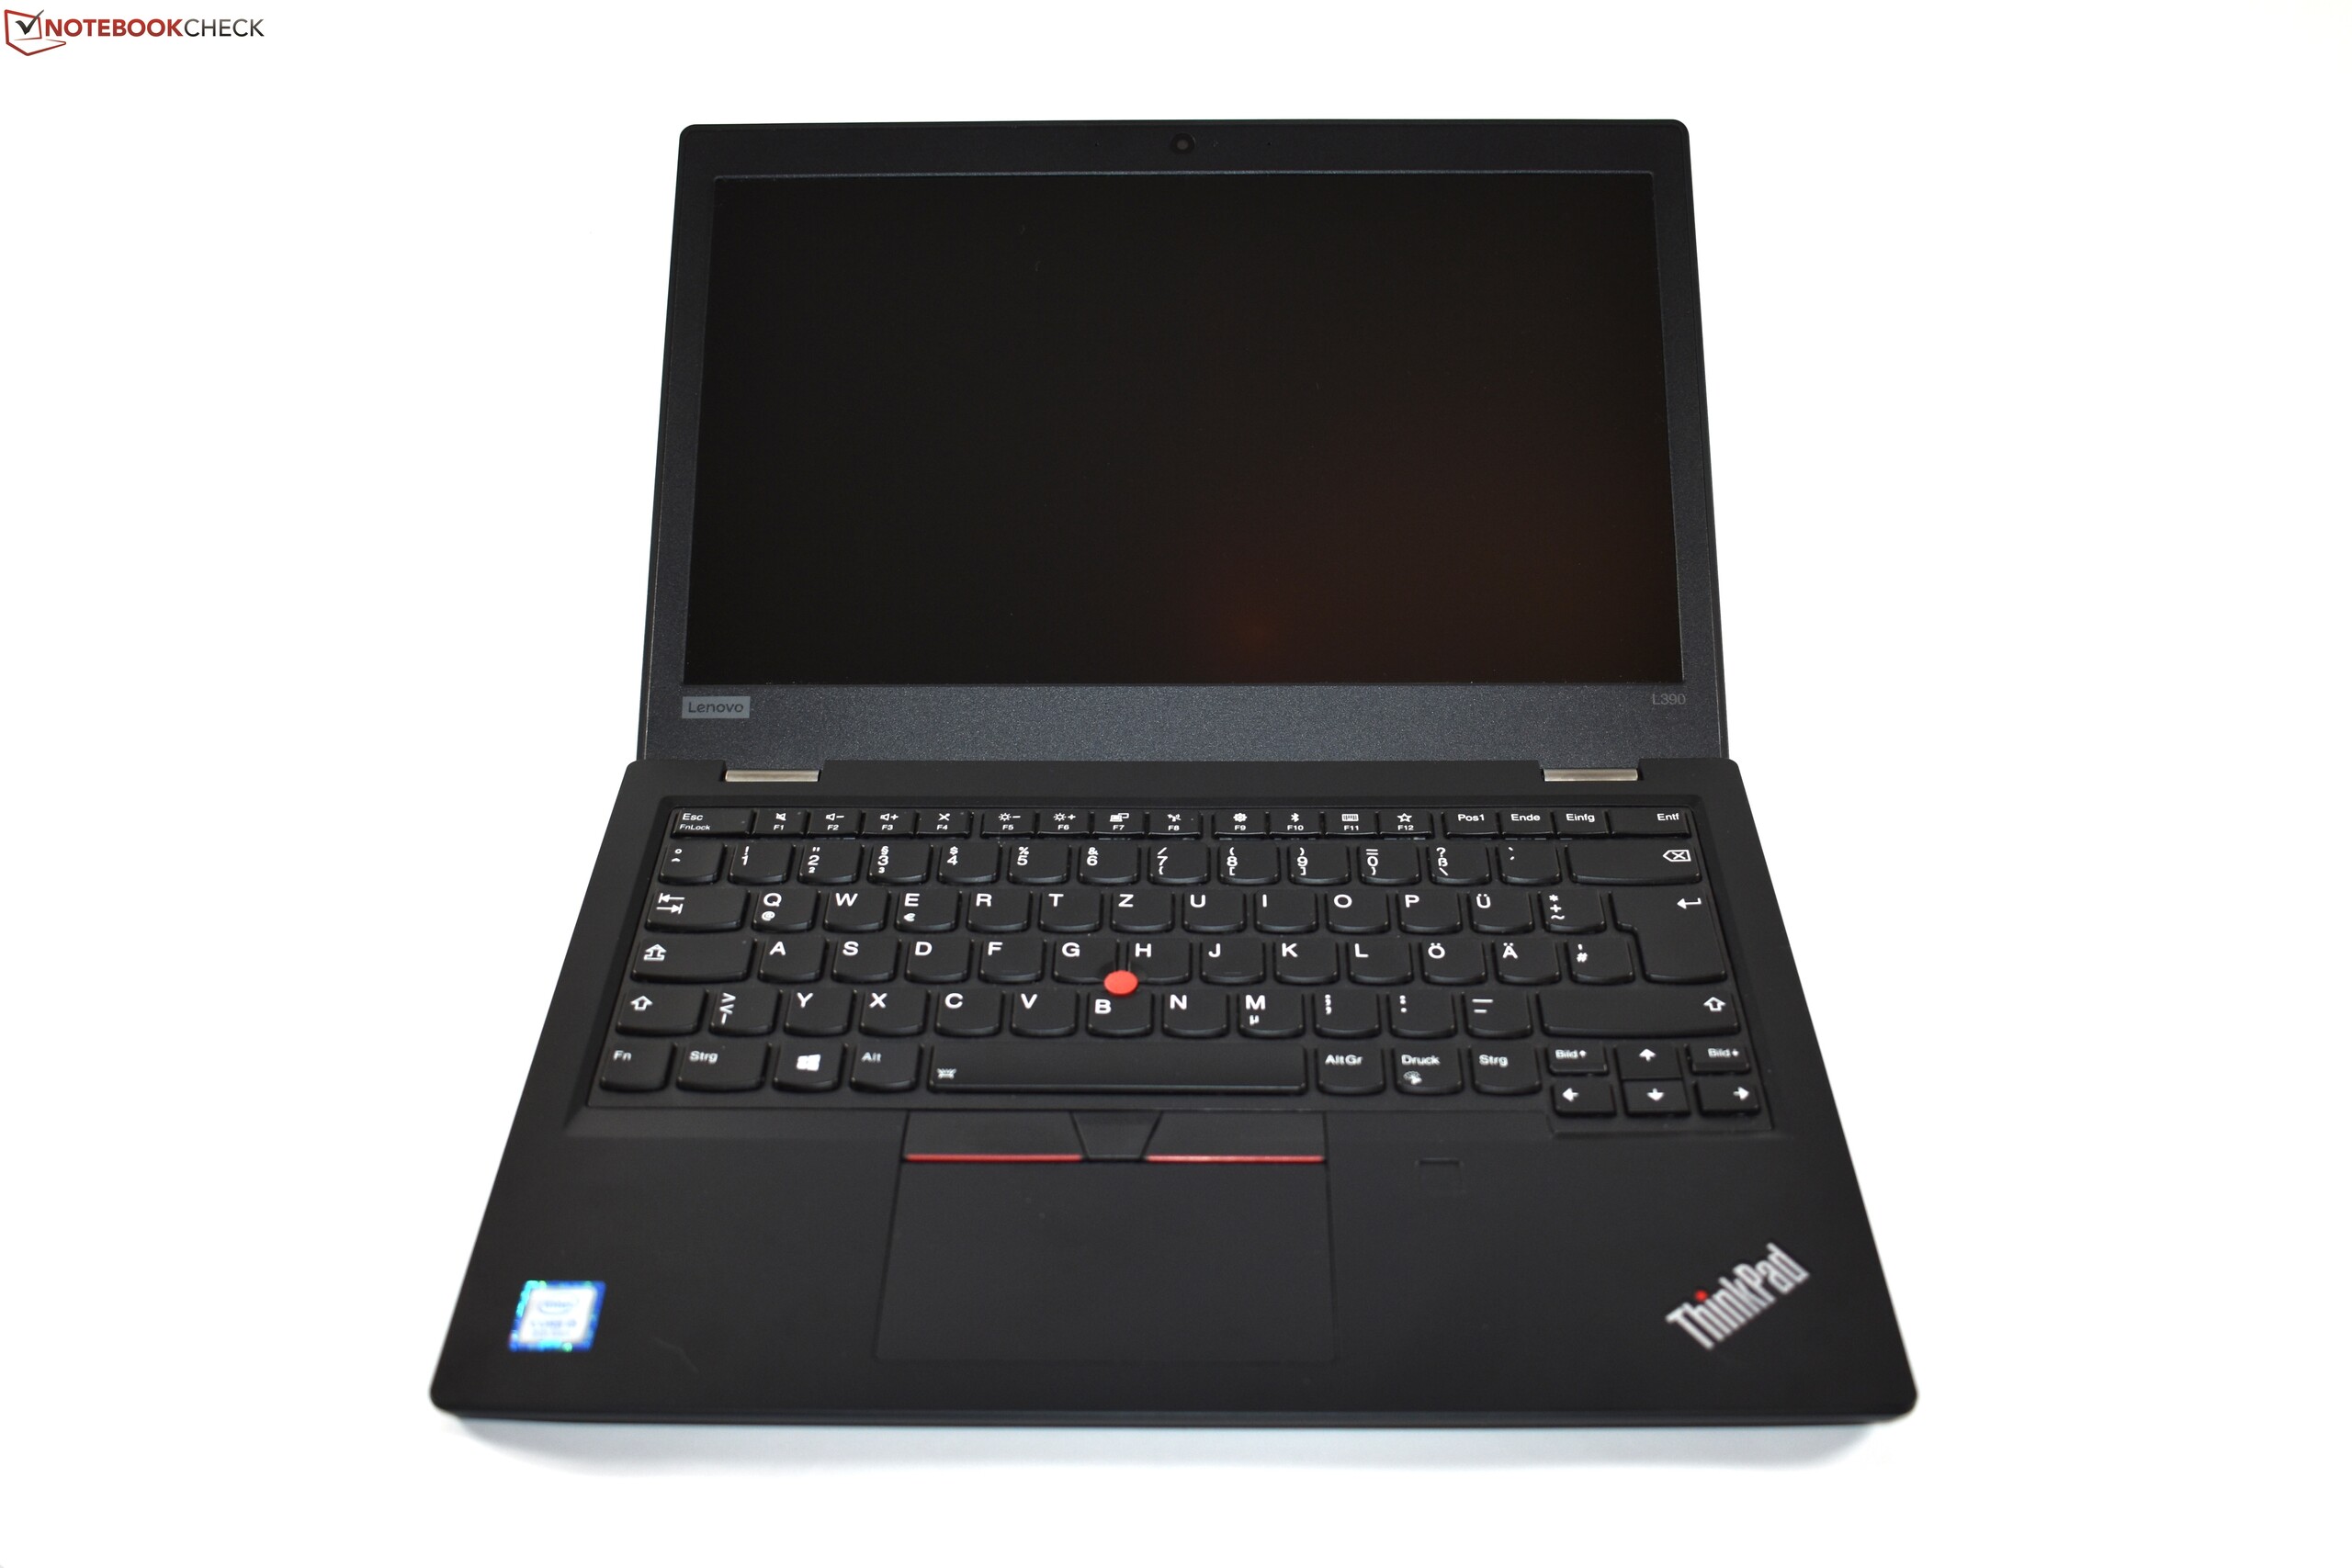
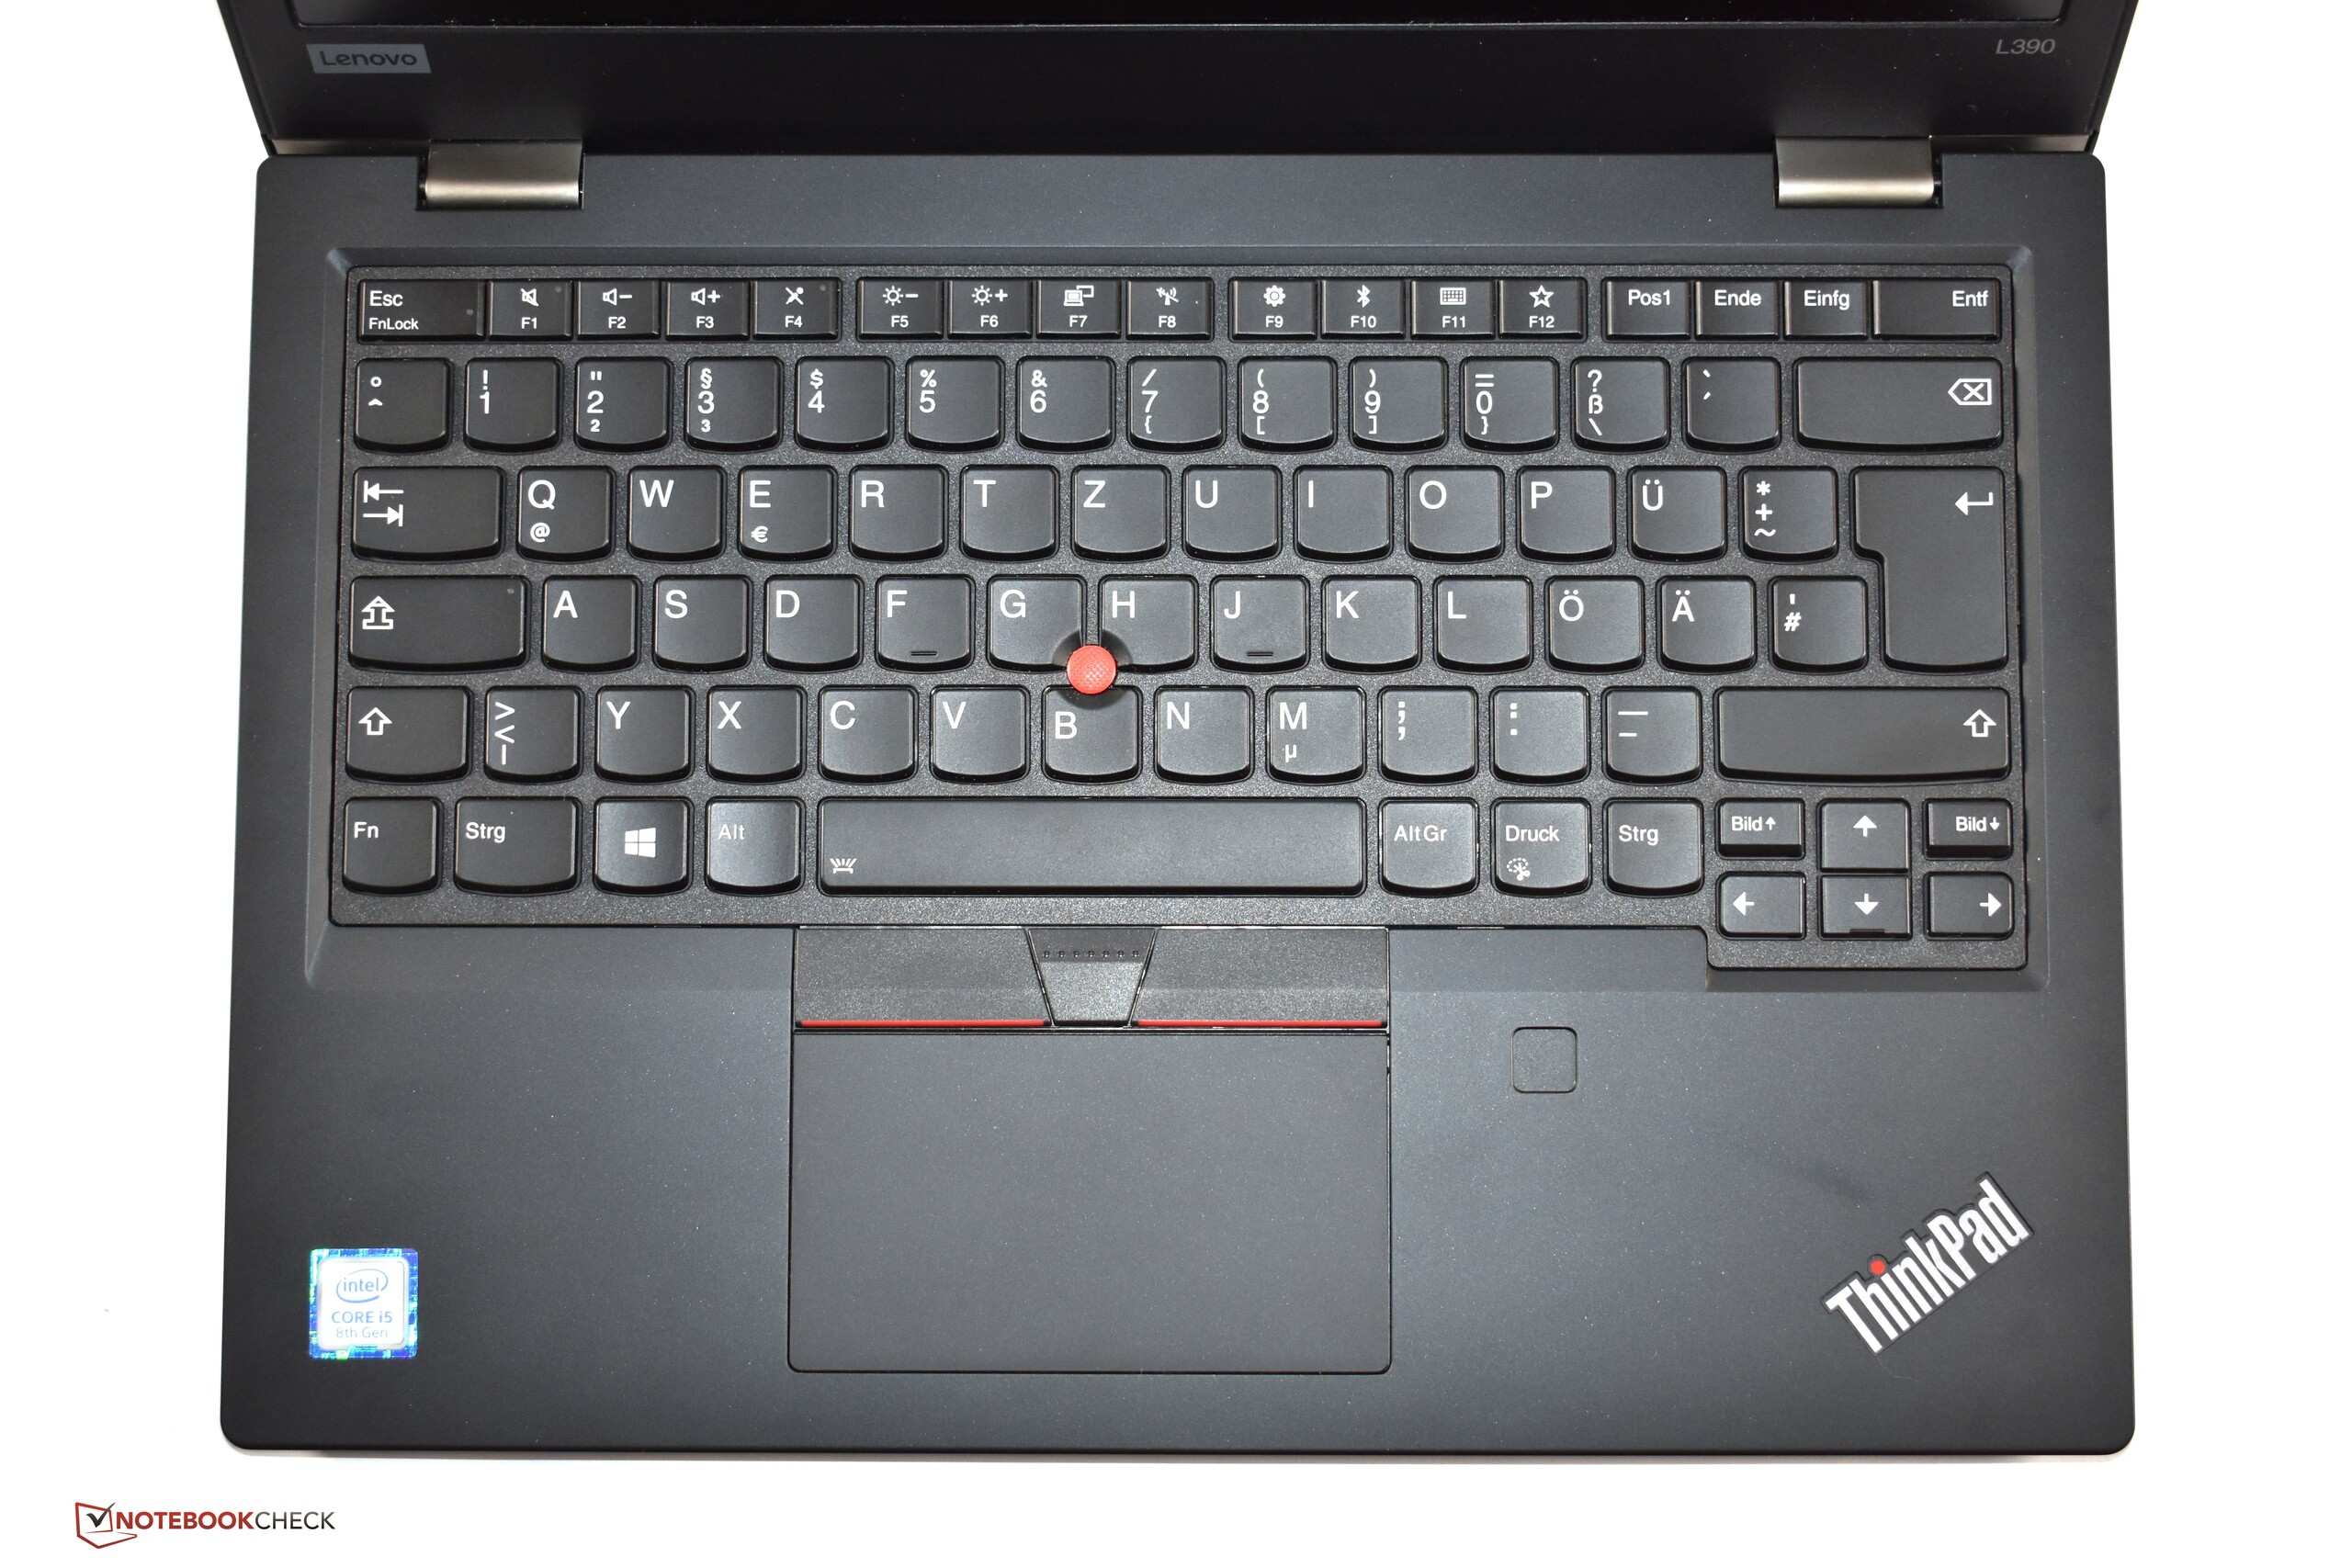
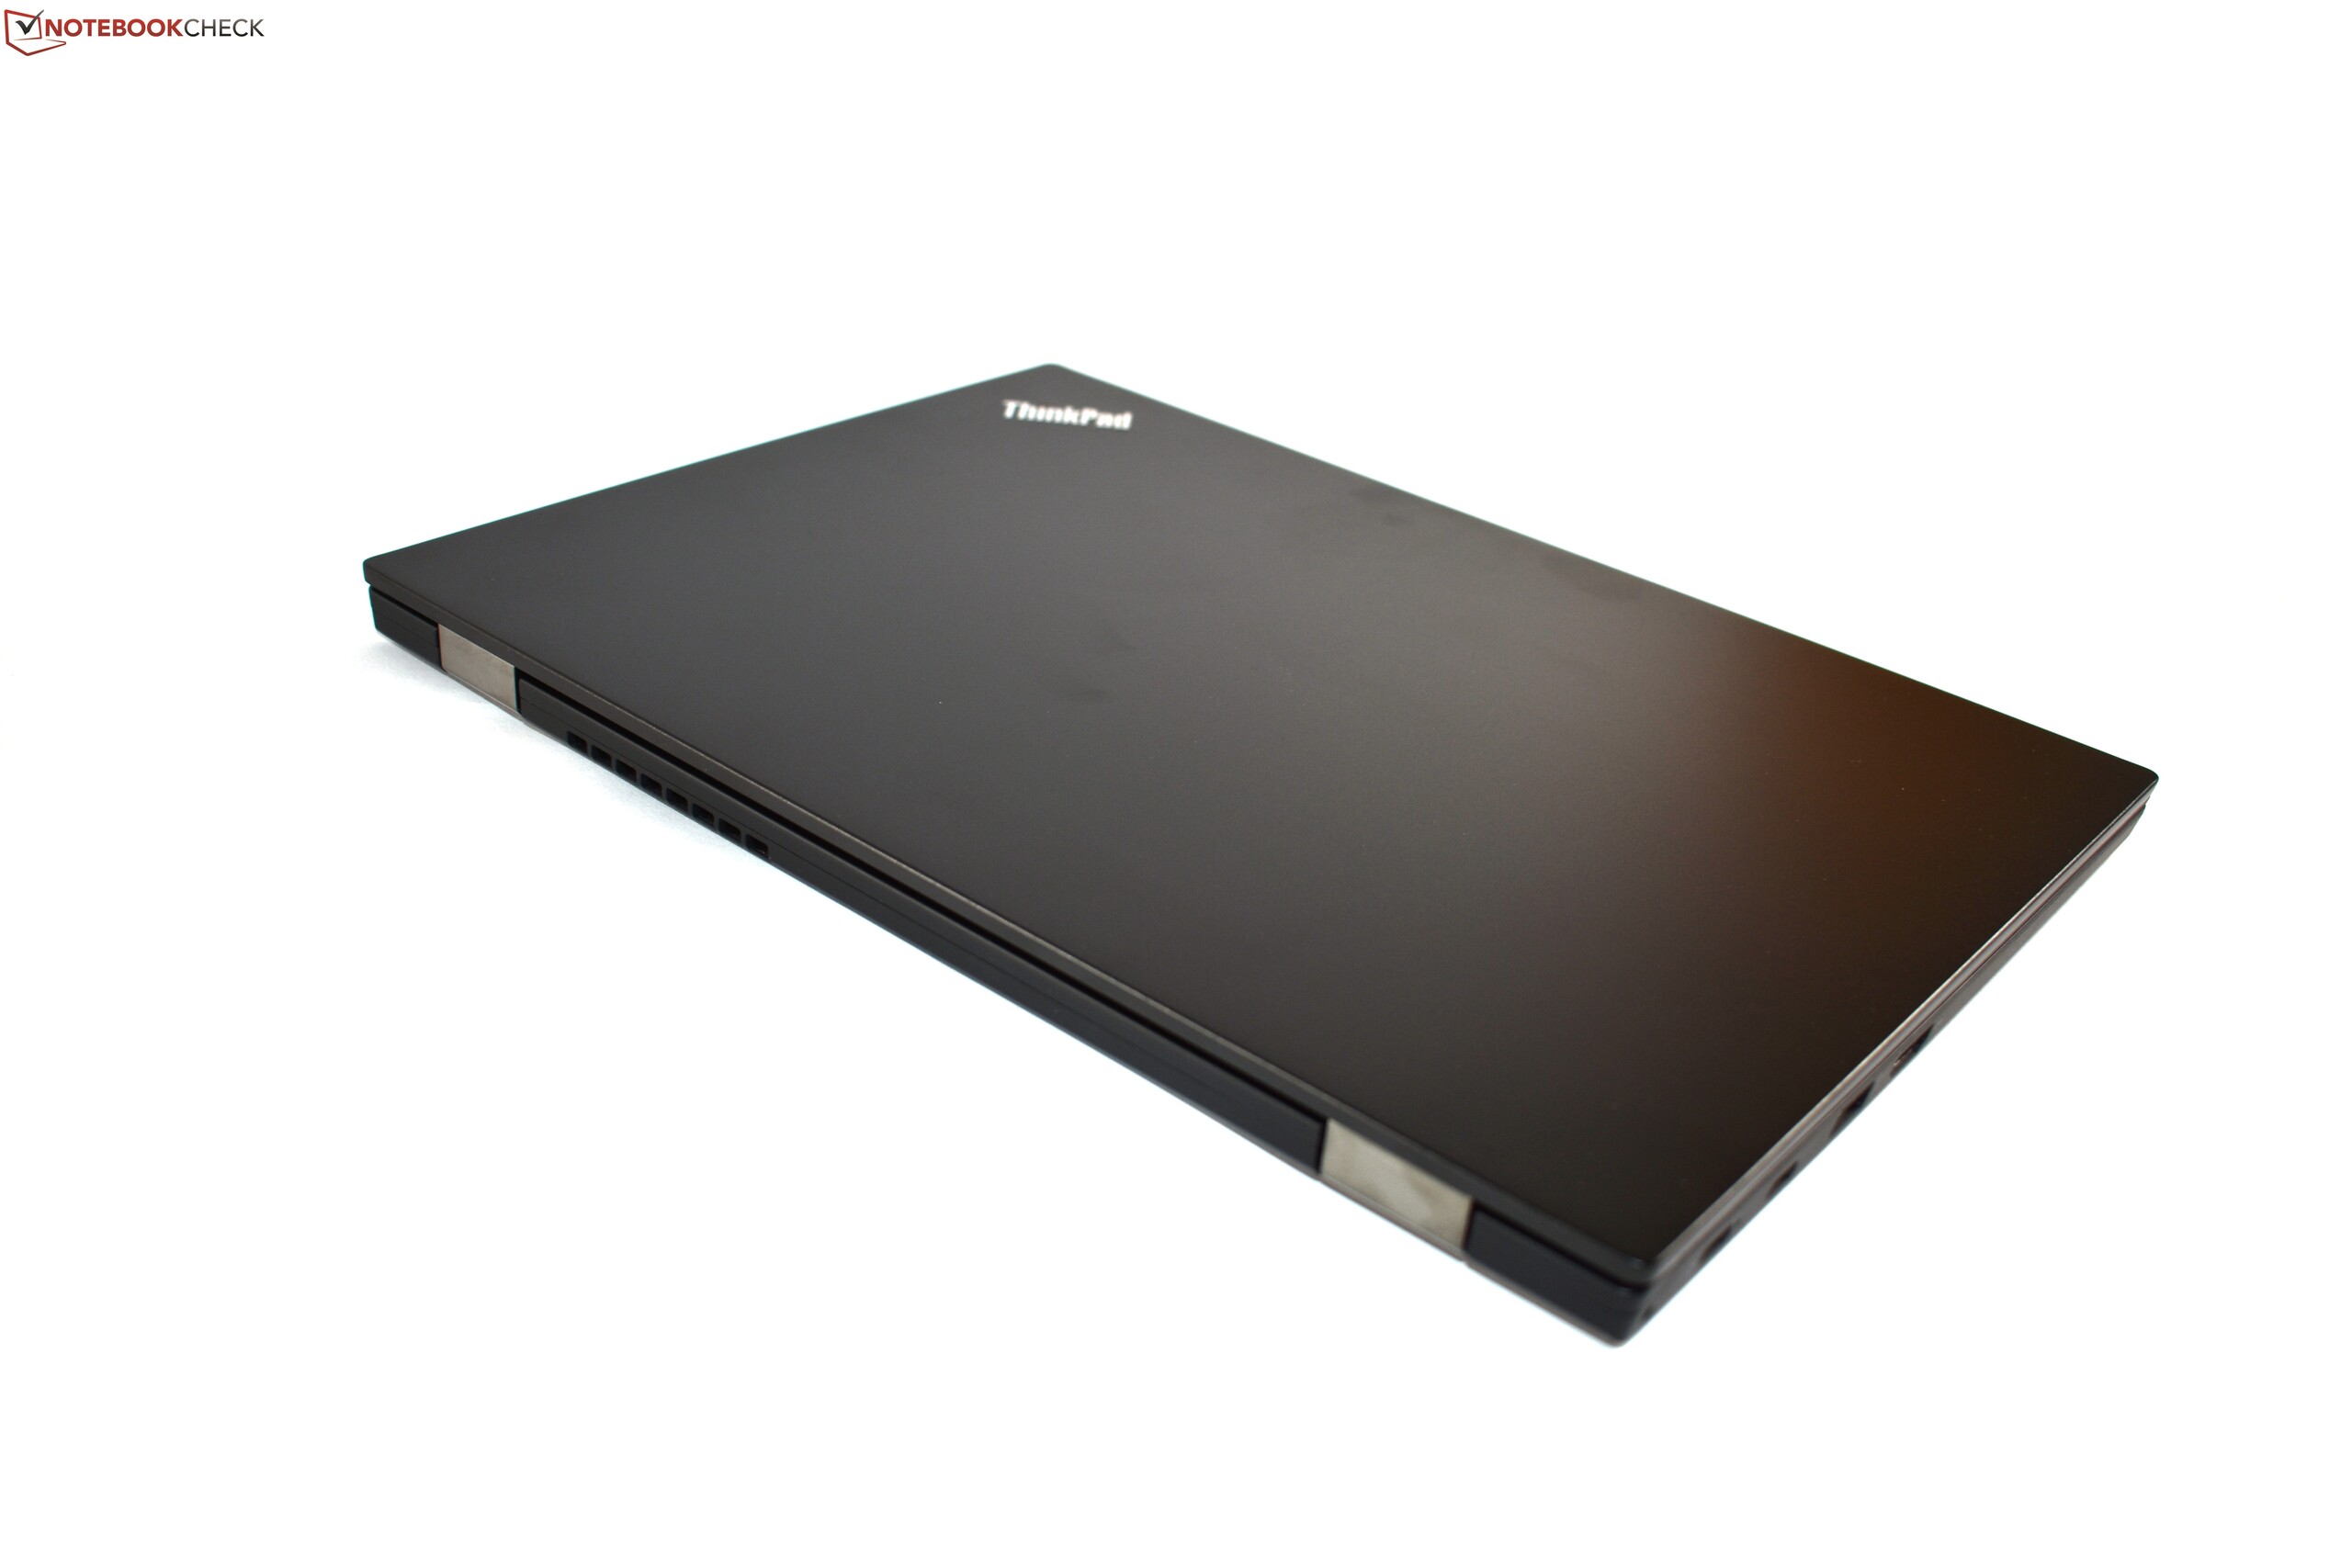
联想ThinkPad L390只是以前的ThinkPad L380的简单更新。虽然内部有所变化,但外观保持完全不变。
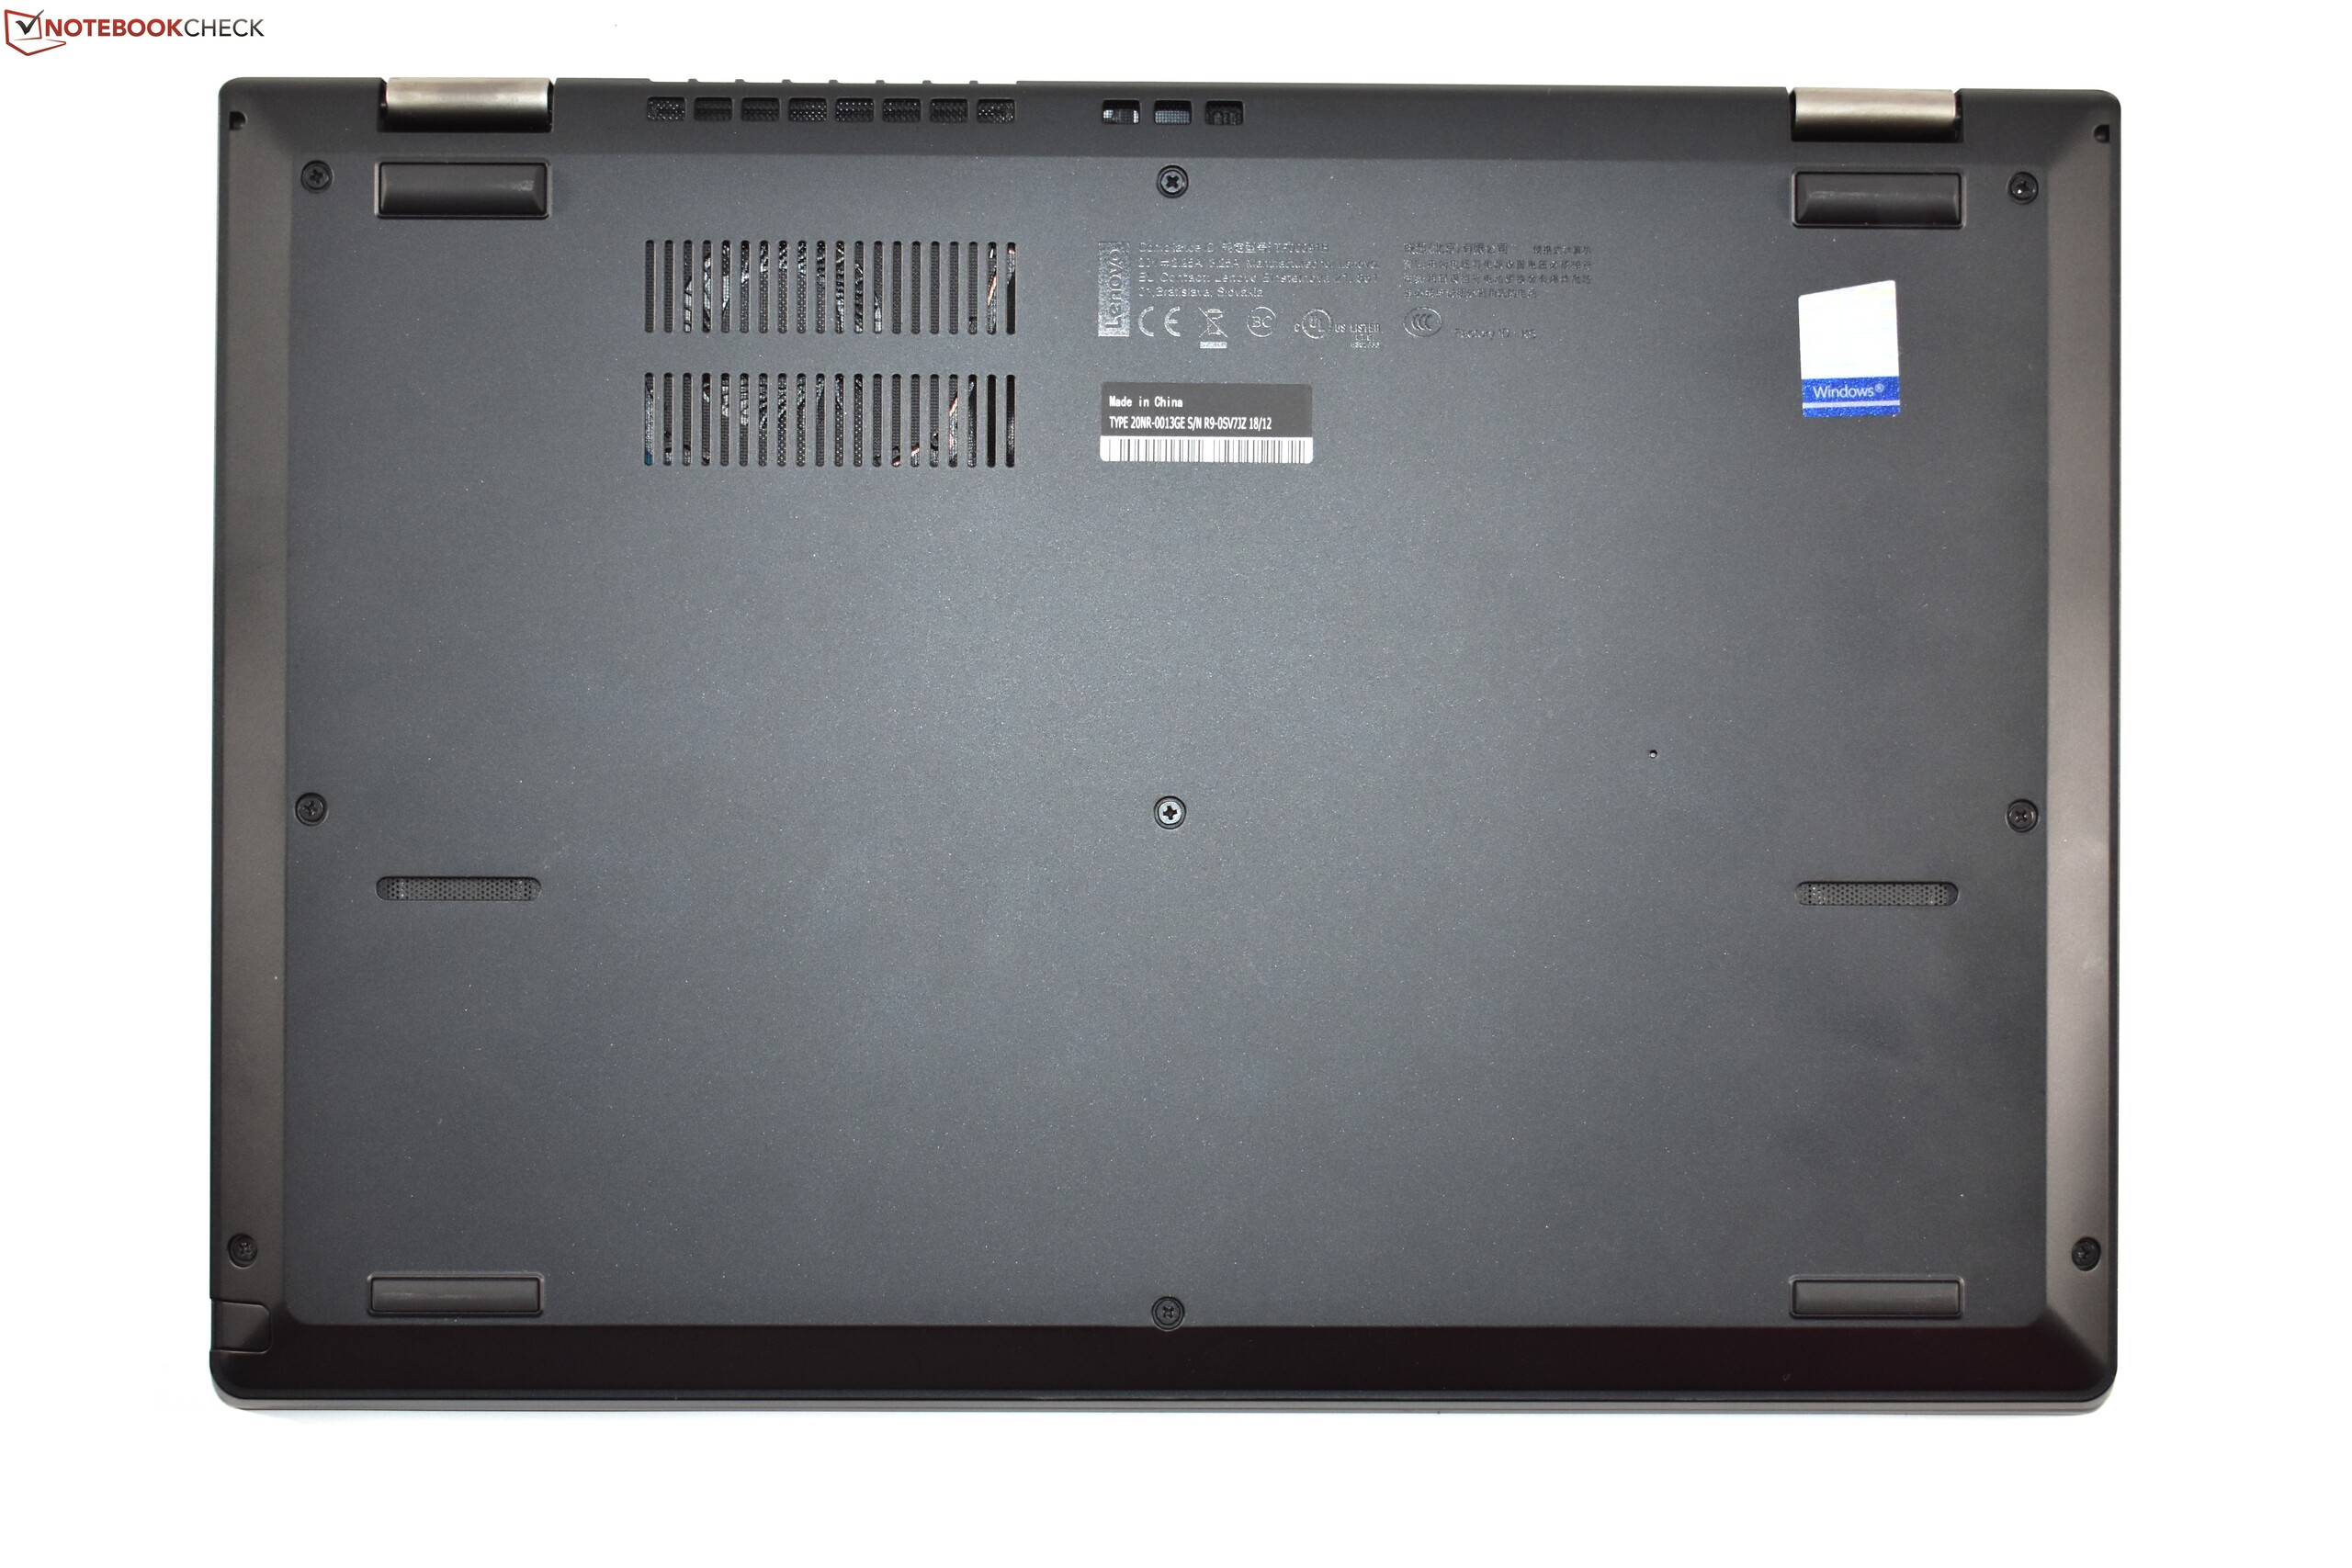
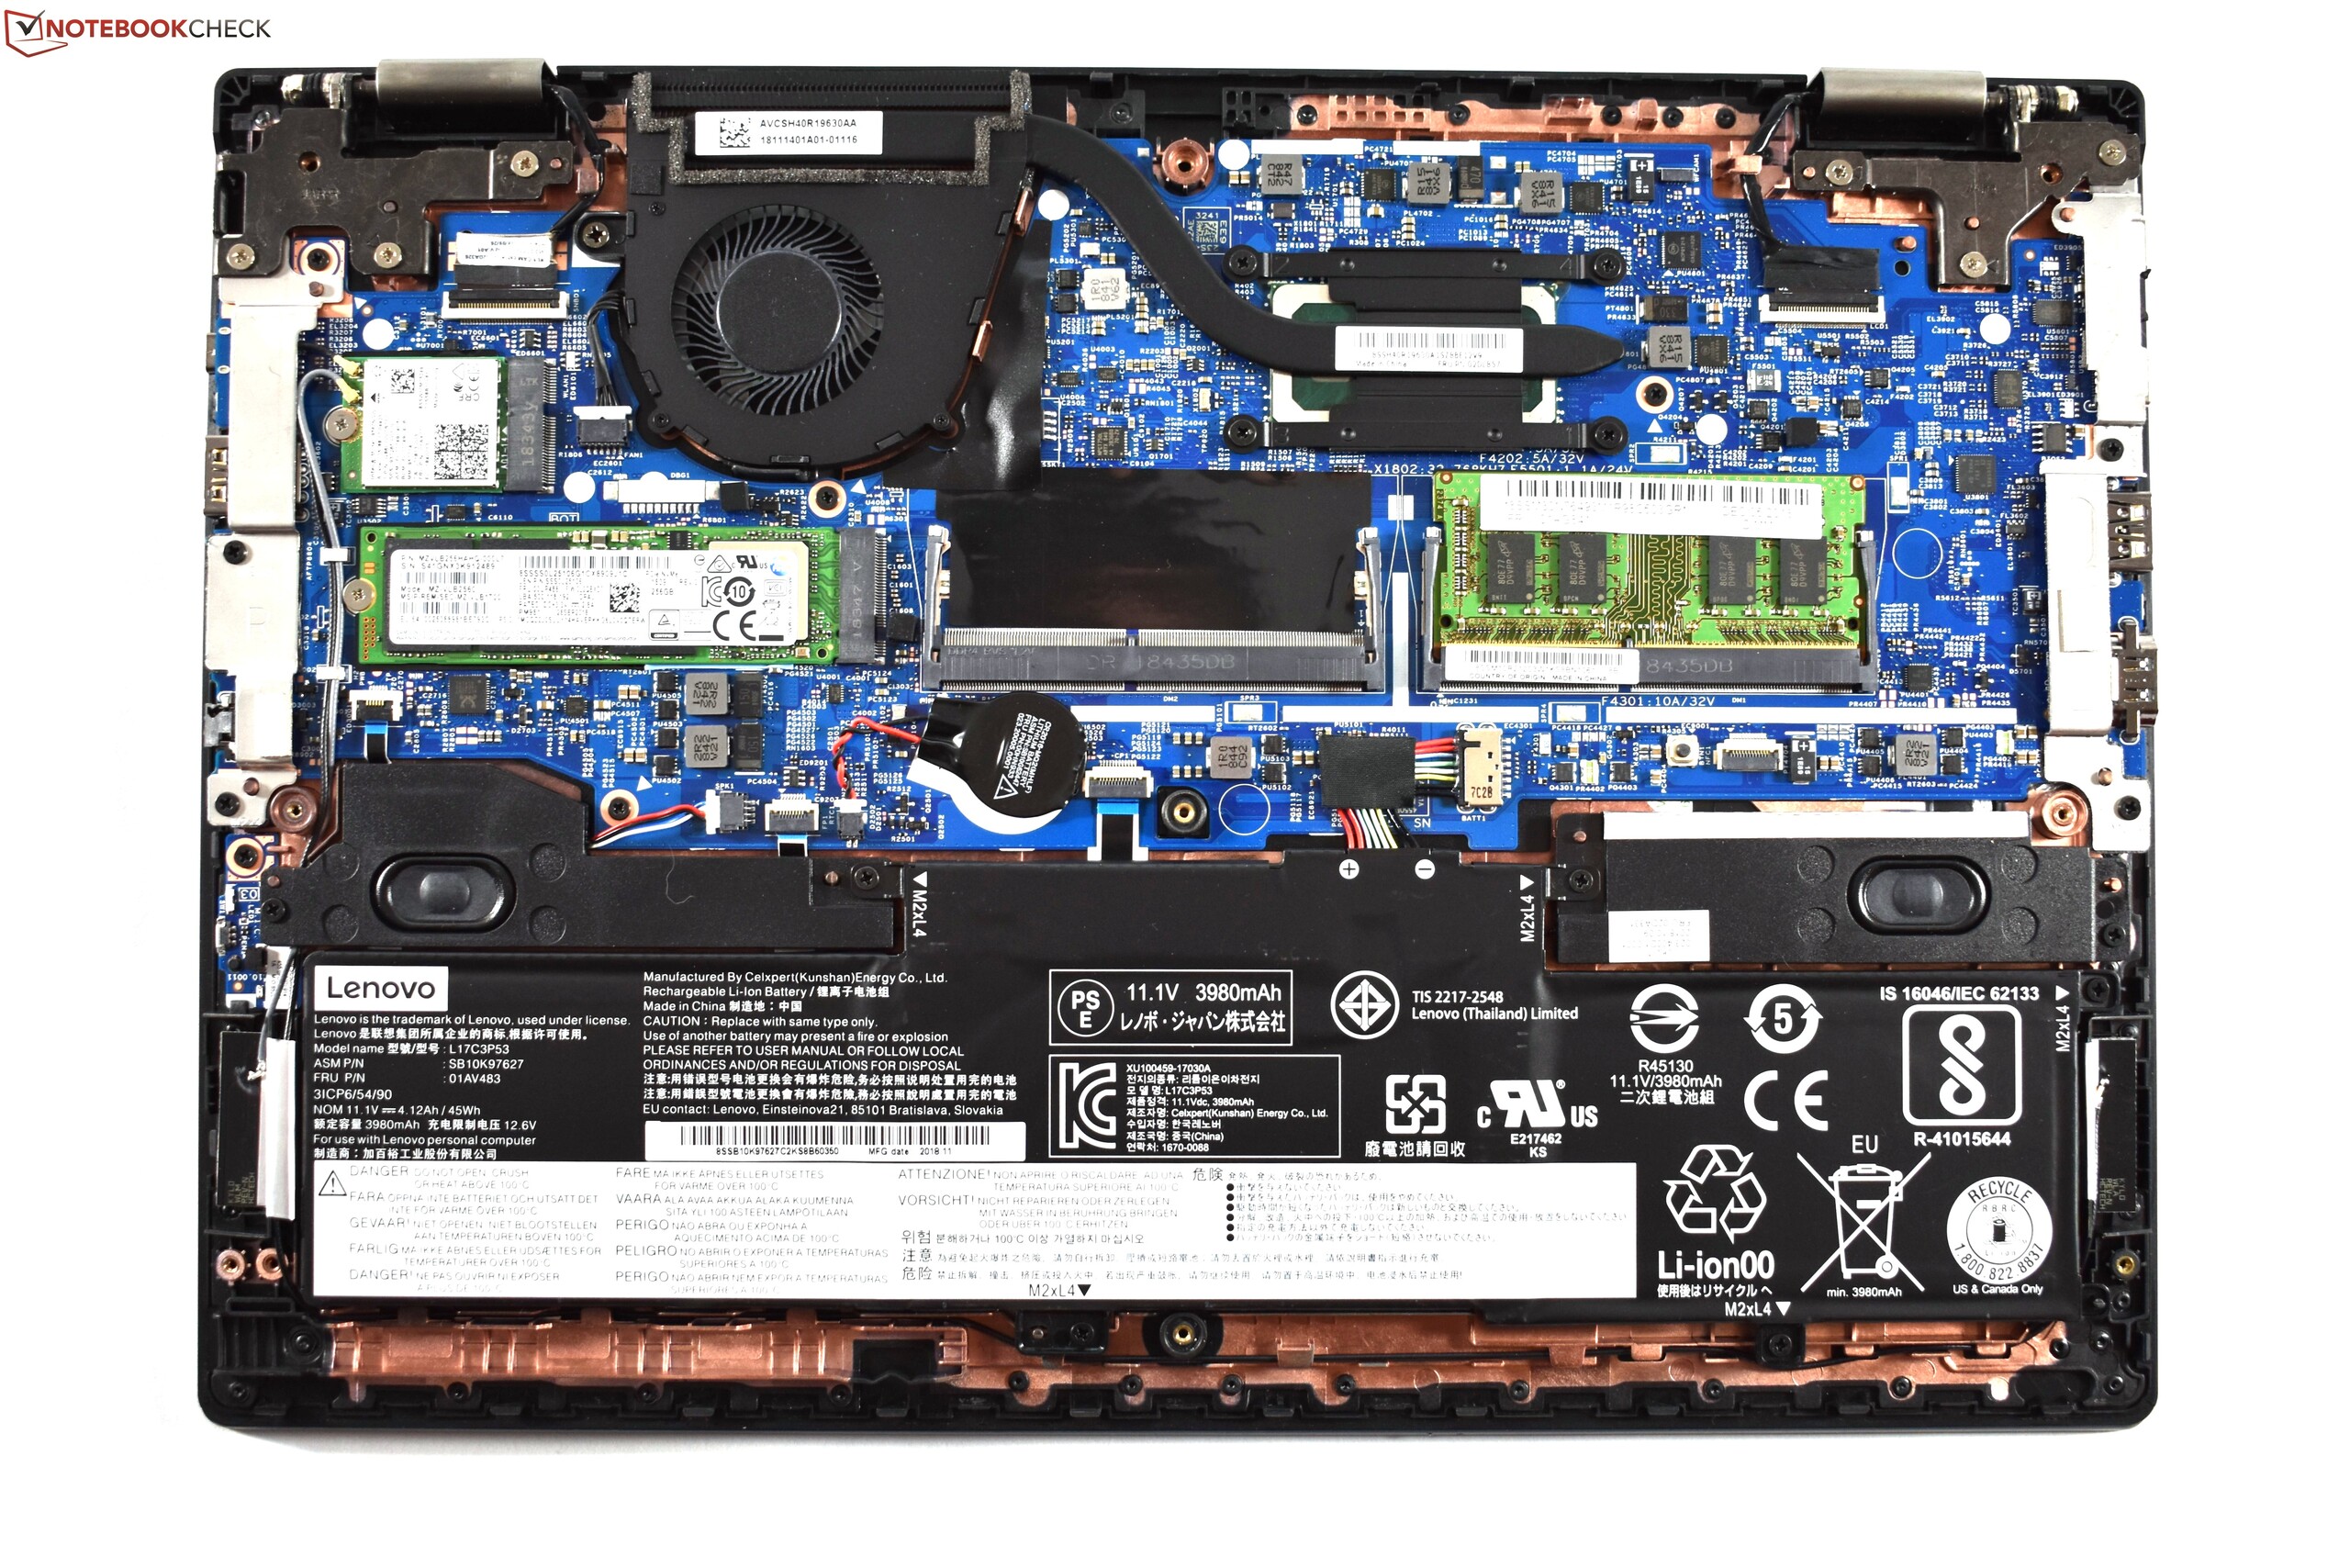
考虑到这一点,ThinkPad L390的优点和缺点与其前身几乎完全相同也就不足为奇了。它的一个优点是在大多数运行时间下没有风扇噪音,风扇在负载下也非常安静。输入设备也值得称赞:触摸板和TrackPoint的组合非常舒适,全尺寸ThinkPad键盘的效果与人们期望的一样好。与L380相比,第一个真正的差异是CPU性能,联想已经通过更高的TDP限制对其进行了改进。 ThinkPad L390的其他优点包括稳定的机身,更好的接口选择和可升级的RAM,这对于紧凑型笔记本电脑来说非常重要。最后但同样重要的是,L390拥有一个实惠的价格。
与L380相比,显示器并不是很差,甚至亮度上来讲更亮一点,但低色域仍然是一个痛点。L390的另一个缺点是它的商务功能比其他ThinkPad少。例如,它缺少机械对接端口,ThinkShutter以及智能卡读卡器。不幸的是,与ThinkPad L380相比,续航时间更差,而L390机身也比其前代产品明显温度更高。此外,L390的标准保修期仅为一年,并且没有Thunderbolt端口。
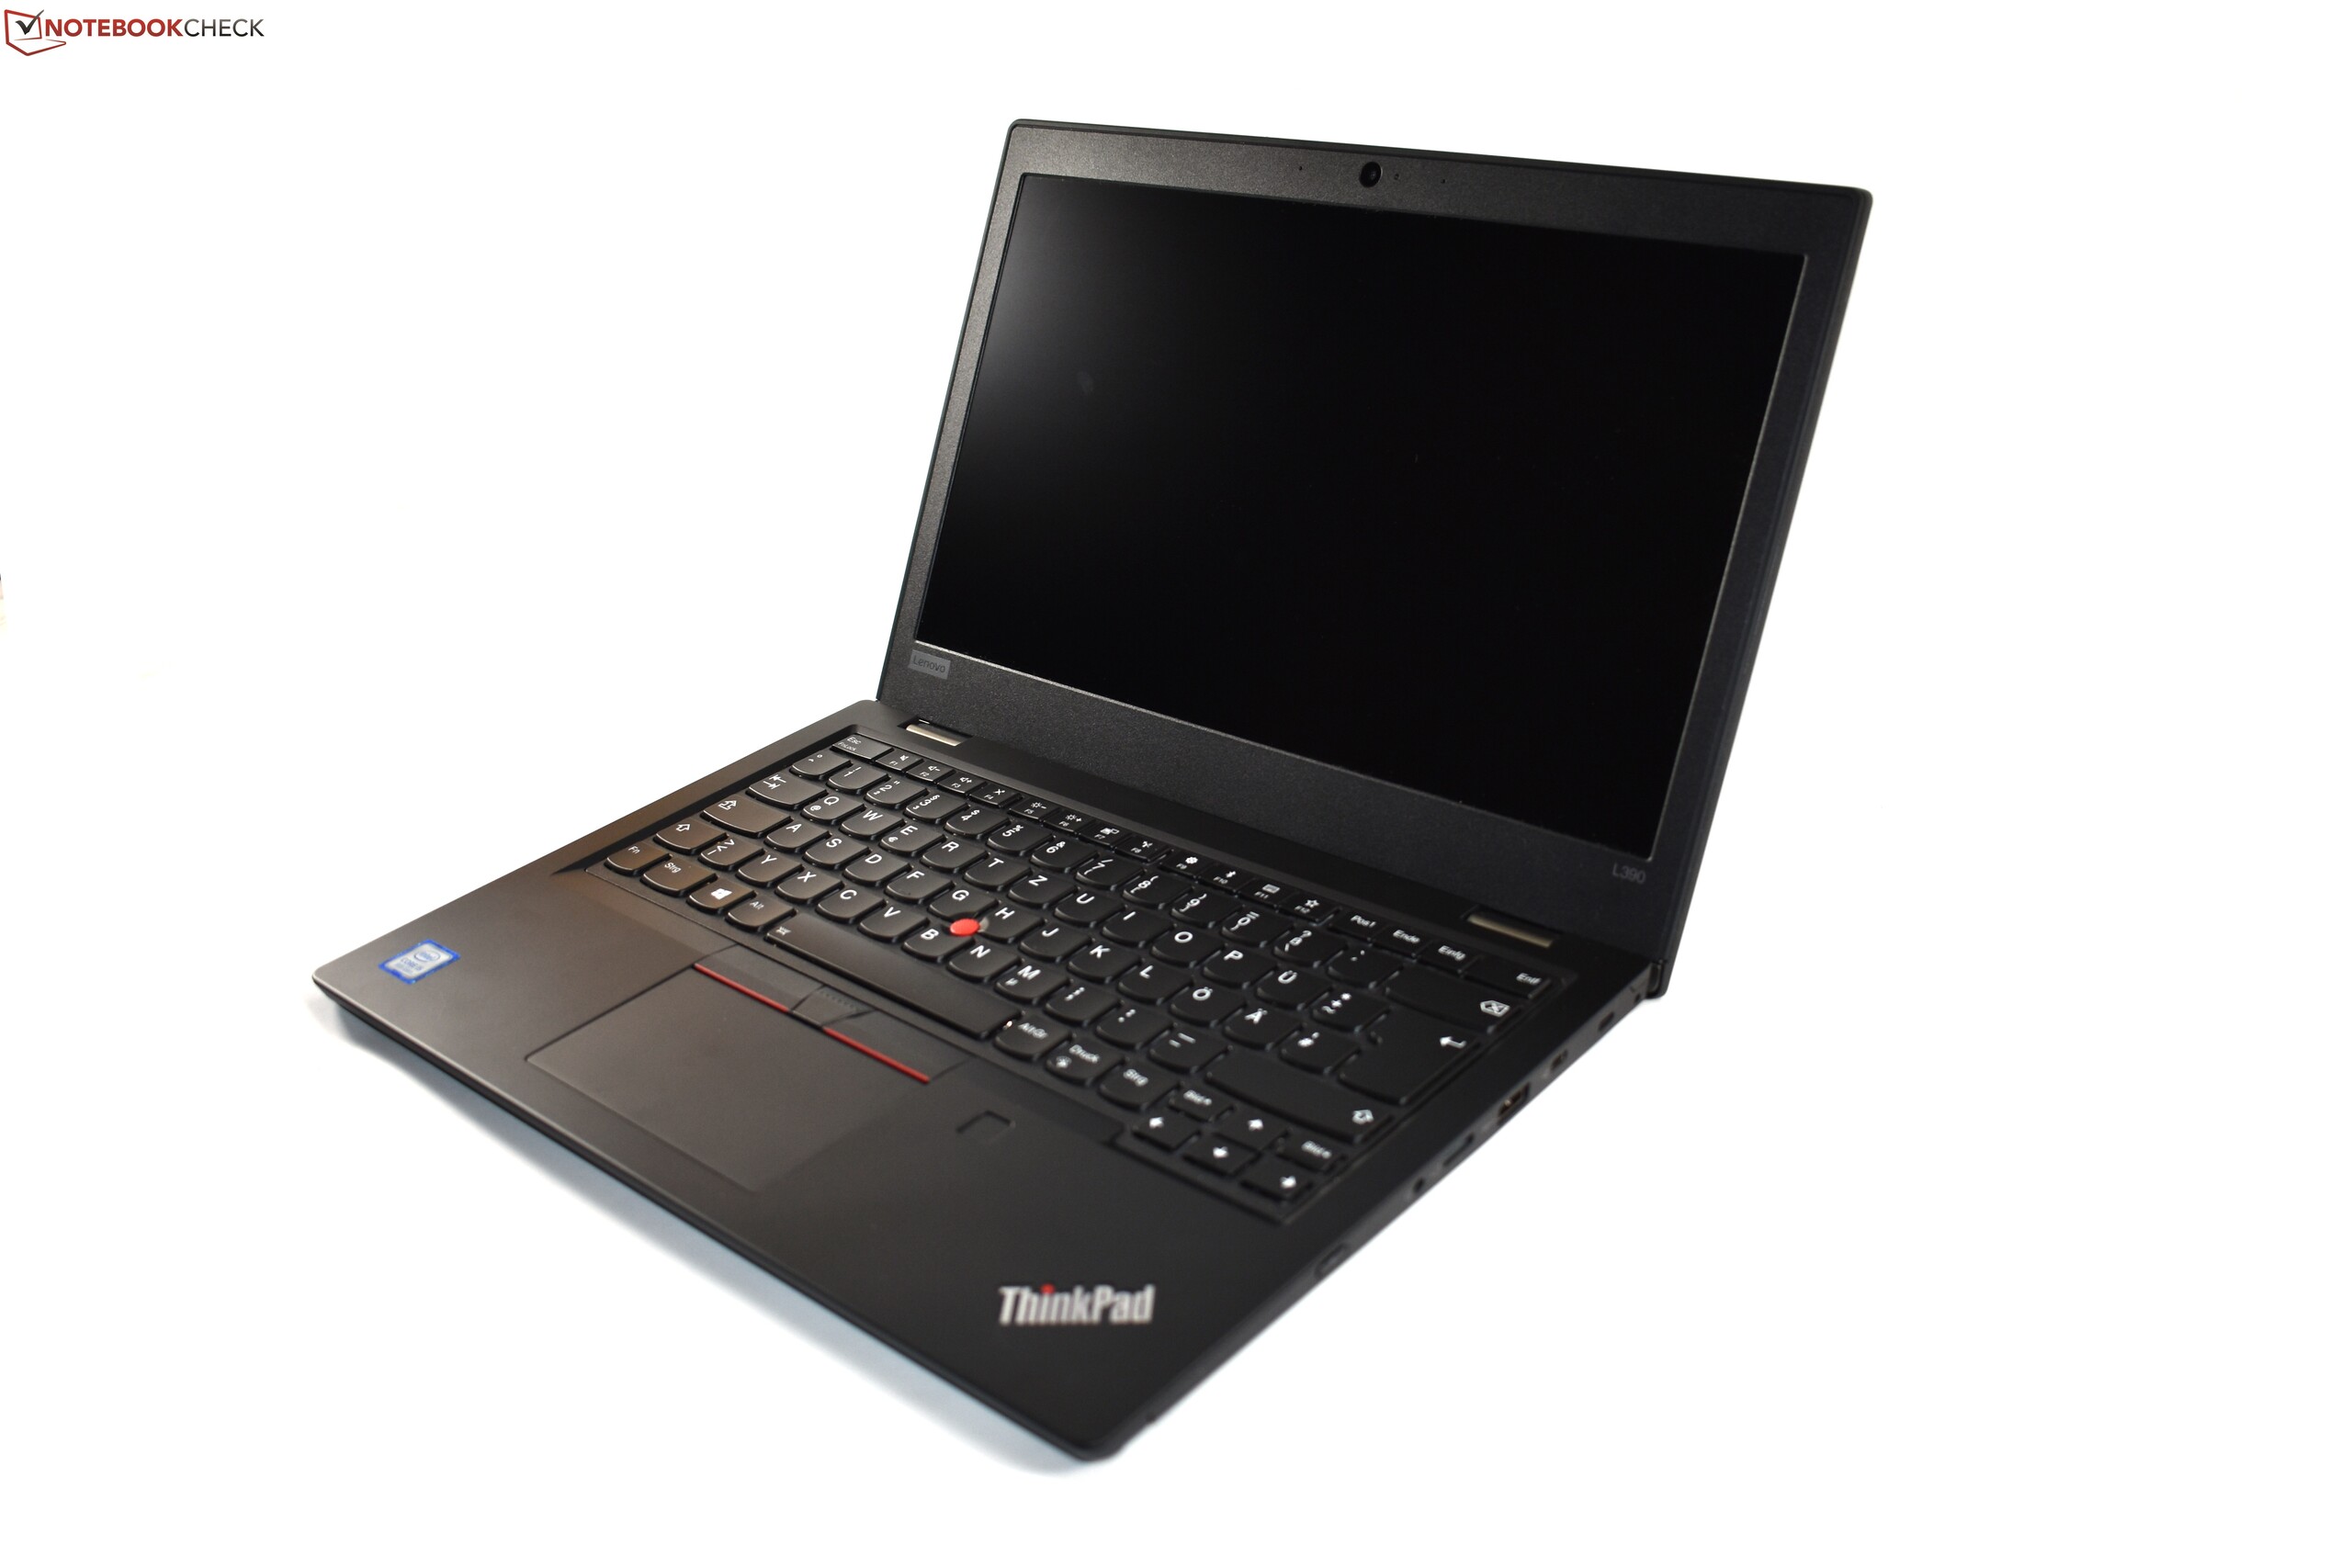
ThinkPad L390是一款坚固的笔记本电脑,没有巨大的缺陷,它提供了物有所值的服务,就像它的前身一样。
尽管存在这些缺点,ThinkPad L390总体上还是不错的的,它也是我们的推荐。联想ThinkPad L390可以被认为是一款极具吸引力且价格合理的办公笔记本电脑,尤其适合学生。
Lenovo ThinkPad L390-20NR0013GE
- 02/15/2019 v6 (old)
Benjamin Herzig
Price comparison

