联想ThinkPad X390(i5-8265U, FHD)笔记本电脑评测
| SD Card Reader | |
| average JPG Copy Test (av. of 3 runs) | |
| Lenovo ThinkPad X1 Carbon 2018-20KGS03900 (Toshiba Exceria Pro M501) | |
| Dell Latitude 7390 (Toshiba Exceria Pro M501) | |
| Lenovo ThinkPad X390-20Q1S02M00 (Toshiba Exceria Pro M501) | |
| Lenovo ThinkPad X280-20KES01S00 (Toshiba Excerie Pro M501) | |
| Average of class Subnotebook (23.7 - 188, n=9, last 2 years) | |
| Lenovo ThinkPad T490s-20NYS02A00 (Toshiba Exceria Pro M501) | |
| maximum AS SSD Seq Read Test (1GB) | |
| Lenovo ThinkPad X1 Carbon 2018-20KGS03900 (Toshiba Exceria Pro M501) | |
| Dell Latitude 7390 (Toshiba Exceria Pro M501) | |
| Average of class Subnotebook (24.9 - 195, n=8, last 2 years) | |
| Lenovo ThinkPad T490s-20NYS02A00 (Toshiba Exceria Pro M501) | |
| Lenovo ThinkPad X390-20Q1S02M00 (Toshiba Exceria Pro M501) | |
| Lenovo ThinkPad X280-20KES01S00 (Toshiba Excerie Pro M501) | |
| |||||||||||||||||||||||||
Brightness Distribution: 88 %
Center on Battery: 355 cd/m²
Contrast: 2225:1 (Black: 0.16 cd/m²)
ΔE ColorChecker Calman: 3.6 | ∀{0.5-29.43 Ø4.73}
calibrated: 1.1
ΔE Greyscale Calman: 4.7 | ∀{0.09-98 Ø4.97}
95.7% sRGB (Argyll 1.6.3 3D)
61.3% AdobeRGB 1998 (Argyll 1.6.3 3D)
66.6% AdobeRGB 1998 (Argyll 3D)
95.9% sRGB (Argyll 3D)
65.3% Display P3 (Argyll 3D)
Gamma: 2.48
CCT: 6374 K
| Lenovo ThinkPad X390-20Q1S02M00 LP133WF7-SPB1, , 1920x1080, 13.3" | Lenovo ThinkPad X280-20KES01S00 B125HAN02.2, , 1920x1080, 12.5" | Lenovo ThinkPad T490s-20NYS02A00 B140HAN05.7, , 1920x1080, 14" | Lenovo ThinkPad X1 Carbon G6-20KG0025UK Lenovo LEN40A9 / AUO B140HAK02.3, , 1920x1080, 14" | HP EliteBook 830 G5-3JX74EA IVO M133NVF3-R0, , 1920x1080, 13.3" | Dell Latitude 7390 AU Optronics AUO462D / B133HAN [DELL P/N:F7VDJ], , 1920x1080, 13.3" | |
|---|---|---|---|---|---|---|
| Display | -33% | 3% | 3% | -4% | -2% | |
| Display P3 Coverage (%) | 65.3 | 44 -33% | 67.1 3% | 68.3 5% | 64.2 -2% | 65.1 0% |
| sRGB Coverage (%) | 95.9 | 64.5 -33% | 97.6 2% | 94.9 -1% | 89.2 -7% | 90.8 -5% |
| AdobeRGB 1998 Coverage (%) | 66.6 | 45.45 -32% | 68.5 3% | 69.3 4% | 65.2 -2% | 65.9 -1% |
| Response Times | 22% | -11% | 29% | 32% | 6% | |
| Response Time Grey 50% / Grey 80% * (ms) | 57.6 ? | 40 ? 31% | 61.6 ? -7% | 40 ? 31% | 36 ? 37% | 48.8 ? 15% |
| Response Time Black / White * (ms) | 34 ? | 29.6 ? 13% | 38.8 ? -14% | 25 ? 26% | 24.8 ? 27% | 35.2 ? -4% |
| PWM Frequency (Hz) | 1020 ? | |||||
| Screen | -41% | -0% | -2% | -36% | -25% | |
| Brightness middle (cd/m²) | 356 | 344 -3% | 391 10% | 298 -16% | 316 -11% | 329 -8% |
| Brightness (cd/m²) | 336 | 313 -7% | 389 16% | 287 -15% | 326 -3% | 316 -6% |
| Brightness Distribution (%) | 88 | 82 -7% | 87 -1% | 91 3% | 85 -3% | 92 5% |
| Black Level * (cd/m²) | 0.16 | 0.25 -56% | 0.23 -44% | 0.2 -25% | 0.19 -19% | 0.25 -56% |
| Contrast (:1) | 2225 | 1376 -38% | 1700 -24% | 1490 -33% | 1663 -25% | 1316 -41% |
| Colorchecker dE 2000 * | 3.6 | 4.7 -31% | 3.4 6% | 2.19 39% | 4.5 -25% | 4.3 -19% |
| Colorchecker dE 2000 max. * | 5.5 | 19.4 -253% | 4.7 15% | 4.39 20% | 12.1 -120% | 7.8 -42% |
| Colorchecker dE 2000 calibrated * | 1.1 | 1.1 -0% | 1.67 -52% | 2.9 -164% | 2.5 -127% | |
| Greyscale dE 2000 * | 4.7 | 2.2 53% | 4 15% | 1.97 58% | 5 -6% | 3.6 23% |
| Gamma | 2.48 89% | 2.16 102% | 2.49 88% | 2.43 91% | 2.22 99% | 2.43 91% |
| CCT | 6374 102% | 6252 104% | 6809 95% | 6571 99% | 6018 108% | 6928 94% |
| Color Space (Percent of AdobeRGB 1998) (%) | 61.3 | 41.2 -33% | 62.4 2% | 62 1% | 57.9 -6% | 59.1 -4% |
| Color Space (Percent of sRGB) (%) | 95.7 | 64.1 -33% | 97.4 2% | 95 -1% | 87.3 -9% | 90.6 -5% |
| Total Average (Program / Settings) | -17% /
-31% | -3% /
-1% | 10% /
3% | -3% /
-21% | -7% /
-17% |
* ... smaller is better
Display Response Times
| ↔ Response Time Black to White | ||
|---|---|---|
| 34 ms ... rise ↗ and fall ↘ combined | ↗ 18.4 ms rise | 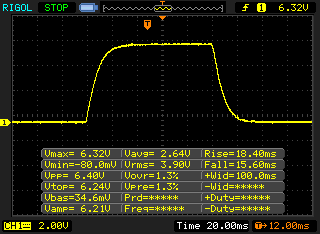 |
| ↘ 15.6 ms fall | ||
| The screen shows slow response rates in our tests and will be unsatisfactory for gamers. In comparison, all tested devices range from 0.1 (minimum) to 240 (maximum) ms. » 91 % of all devices are better. This means that the measured response time is worse than the average of all tested devices (19.9 ms). | ||
| ↔ Response Time 50% Grey to 80% Grey | ||
| 57.6 ms ... rise ↗ and fall ↘ combined | ↗ 28.4 ms rise | 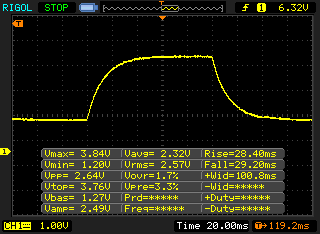 |
| ↘ 29.2 ms fall | ||
| The screen shows slow response rates in our tests and will be unsatisfactory for gamers. In comparison, all tested devices range from 0.165 (minimum) to 636 (maximum) ms. » 94 % of all devices are better. This means that the measured response time is worse than the average of all tested devices (31.1 ms). | ||
Screen Flickering / PWM (Pulse-Width Modulation)
| Screen flickering / PWM not detected | 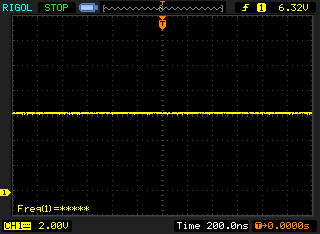 | ||
In comparison: 52 % of all tested devices do not use PWM to dim the display. If PWM was detected, an average of 7794 (minimum: 5 - maximum: 343500) Hz was measured. | |||
| PCMark 8 Home Score Accelerated v2 | 3629 points | |
| PCMark 8 Work Score Accelerated v2 | 4896 points | |
| PCMark 10 Score | 3832 points | |
Help | ||
| Lenovo ThinkPad X390-20Q1S02M00 Intel SSD Pro 7600p SSDPEKKF512G8L | Lenovo ThinkPad X280-20KES01S00 Samsung SSD PM981 MZVLB512HAJQ | Lenovo ThinkPad X1 Carbon 2018-20KGS03900 Samsung SSD PM981 MZVLB512HAJQ | HP EliteBook 830 G5-3JX74EA Samsung SSD PM961 1TB M.2 PCIe 3.0 x4 NVMe (MZVLW1T0) | Dell Latitude 7390 Samsung PM961 MZVLW256HEHP | Average Intel SSD Pro 7600p SSDPEKKF512G8L | |
|---|---|---|---|---|---|---|
| CrystalDiskMark 5.2 / 6 | 11% | 9% | -1% | 13% | 6% | |
| Write 4K (MB/s) | 120.7 | 125.3 4% | 131.9 9% | 108.5 -10% | 139.4 15% | 133.9 ? 11% |
| Read 4K (MB/s) | 58.5 | 43.5 -26% | 44.6 -24% | 40.53 -31% | 43.18 -26% | 59.1 ? 1% |
| Write Seq (MB/s) | 1491 | 112 -92% | 1824 22% | 1026 -31% | 1075 -28% | 1378 ? -8% |
| Read Seq (MB/s) | 2760 | 2273 -18% | 2163 -22% | 2080 -25% | 1639 -41% | 2341 ? -15% |
| Write 4K Q32T1 (MB/s) | 237.5 | 641 170% | 338.1 42% | 451 90% | 662 179% | 355 ? 49% |
| Read 4K Q32T1 (MB/s) | 336.1 | 392 17% | 351.9 5% | 269.7 -20% | 413.9 23% | 429 ? 28% |
| Write Seq Q32T1 (MB/s) | 1512 | 1903 26% | 1972 30% | 1770 17% | 1195 -21% | 1514 ? 0% |
| Read Seq Q32T1 (MB/s) | 3154 | 3398 8% | 3387 7% | 3214 2% | 3116 -1% | 2677 ? -15% |

| 3DMark 11 Performance | 2062 points | |
| 3DMark Cloud Gate Standard Score | 8361 points | |
| 3DMark Fire Strike Score | 1115 points | |
Help | ||
| low | med. | high | ultra | |
|---|---|---|---|---|
| BioShock Infinite (2013) | 79.3 | 37.4 | 31.3 | 10.3 |
| The Witcher 3 (2015) | 16.9 | |||
| Rise of the Tomb Raider (2016) | 25.7 | 14.9 | ||
| Civilization 6 (2016) | 54.4 | 20.3 | ||
| F1 2018 (2018) | 33 | 15 |
Noise level
| Idle |
| 29.2 / 29.2 / 29.2 dB(A) |
| Load |
| 34.8 / 34.8 dB(A) |
 | ||
30 dB silent 40 dB(A) audible 50 dB(A) loud |
||
min: | ||
(±) The maximum temperature on the upper side is 44.6 °C / 112 F, compared to the average of 35.9 °C / 97 F, ranging from 21.4 to 59 °C for the class Subnotebook.
(±) The bottom heats up to a maximum of 41.1 °C / 106 F, compared to the average of 39.2 °C / 103 F
(+) In idle usage, the average temperature for the upper side is 22.8 °C / 73 F, compared to the device average of 30.8 °C / 87 F.
(+) The palmrests and touchpad are reaching skin temperature as a maximum (32.8 °C / 91 F) and are therefore not hot.
(-) The average temperature of the palmrest area of similar devices was 28.2 °C / 82.8 F (-4.6 °C / -8.2 F).
Lenovo ThinkPad X390-20Q1S02M00 audio analysis
(±) | speaker loudness is average but good (72.6 dB)
Bass 100 - 315 Hz
(-) | nearly no bass - on average 20.8% lower than median
(±) | linearity of bass is average (13.6% delta to prev. frequency)
Mids 400 - 2000 Hz
(+) | balanced mids - only 2.3% away from median
(+) | mids are linear (5.5% delta to prev. frequency)
Highs 2 - 16 kHz
(+) | balanced highs - only 2.4% away from median
(+) | highs are linear (6.1% delta to prev. frequency)
Overall 100 - 16.000 Hz
(±) | linearity of overall sound is average (20.5% difference to median)
Compared to same class
» 66% of all tested devices in this class were better, 7% similar, 27% worse
» The best had a delta of 5%, average was 18%, worst was 53%
Compared to all devices tested
» 54% of all tested devices were better, 8% similar, 38% worse
» The best had a delta of 4%, average was 24%, worst was 134%
HP EliteBook 830 G5-3JX74EA audio analysis
(+) | speakers can play relatively loud (82.7 dB)
Bass 100 - 315 Hz
(-) | nearly no bass - on average 19.9% lower than median
(±) | linearity of bass is average (11.3% delta to prev. frequency)
Mids 400 - 2000 Hz
(+) | balanced mids - only 2.3% away from median
(+) | mids are linear (4.8% delta to prev. frequency)
Highs 2 - 16 kHz
(+) | balanced highs - only 4% away from median
(+) | highs are linear (5.6% delta to prev. frequency)
Overall 100 - 16.000 Hz
(±) | linearity of overall sound is average (17% difference to median)
Compared to same class
» 43% of all tested devices in this class were better, 8% similar, 49% worse
» The best had a delta of 5%, average was 18%, worst was 53%
Compared to all devices tested
» 30% of all tested devices were better, 8% similar, 62% worse
» The best had a delta of 4%, average was 24%, worst was 134%
| Off / Standby | |
| Idle | |
| Load |
|
Key:
min: | |
| Lenovo ThinkPad X390-20Q1S02M00 i5-8265U, UHD Graphics 620, Intel SSD Pro 7600p SSDPEKKF512G8L, IPS LED, 1920x1080, 13.3" | Lenovo ThinkPad X280-20KES01S00 i5-8250U, UHD Graphics 620, Samsung SSD PM981 MZVLB512HAJQ, IPS LED, 1920x1080, 12.5" | Lenovo ThinkPad X1 Carbon 2018-20KGS03900 i5-8550U, UHD Graphics 620, Samsung SSD PM981 MZVLB512HAJQ, IPS, 2560x1440, 14" | HP EliteBook 830 G5-3JX74EA i5-8550U, UHD Graphics 620, Samsung SSD PM961 1TB M.2 PCIe 3.0 x4 NVMe (MZVLW1T0), IPS LED, 1920x1080, 13.3" | Dell Latitude 7390 i5-8350U, UHD Graphics 620, SK hynix SC311 M.2, IPS, 1920x1080, 13.3" | Average Intel UHD Graphics 620 | Average of class Subnotebook | |
|---|---|---|---|---|---|---|---|
| Power Consumption | 9% | -20% | -7% | 11% | 2% | -3% | |
| Idle Minimum * (Watt) | 3.4 | 3.11 9% | 3.8 -12% | 4.5 -32% | 2.34 31% | 3.81 ? -12% | 3.82 ? -12% |
| Idle Average * (Watt) | 5.6 | 5.01 11% | 8.9 -59% | 6.4 -14% | 5.6 -0% | 6.94 ? -24% | 6.61 ? -18% |
| Idle Maximum * (Watt) | 8.7 | 8.11 7% | 11.9 -37% | 9.2 -6% | 6.5 25% | 8.75 ? -1% | 7.99 ? 8% |
| Load Average * (Watt) | 43.6 | 44.6 -2% | 47.5 -9% | 35.7 18% | 43 1% | 35 ? 20% | 41.9 ? 4% |
| Load Maximum * (Watt) | 65 | 51.7 20% | 52.5 19% | 65.4 -1% | 67.4 -4% | 47.5 ? 27% | 64.1 ? 1% |
* ... smaller is better
| Lenovo ThinkPad X390-20Q1S02M00 i5-8265U, UHD Graphics 620, 48 Wh | Lenovo ThinkPad X280-20KES01S00 i5-8250U, UHD Graphics 620, 50 Wh | Lenovo ThinkPad X1 Carbon 2018-20KGS03900 i5-8550U, UHD Graphics 620, 57 Wh | Lenovo ThinkPad T490s-20NYS02A00 i5-8265U, UHD Graphics 620, 57 Wh | HP EliteBook 830 G5-3JX74EA i5-8550U, UHD Graphics 620, 49 Wh | Dell Latitude 7390 i5-8350U, UHD Graphics 620, 60 Wh | Average of class Subnotebook | |
|---|---|---|---|---|---|---|---|
| Battery runtime | 2% | -3% | 12% | -2% | -4% | 38% | |
| H.264 (h) | 12.7 | 9.5 -25% | 9.4 -26% | 13.9 9% | 8 -37% | 12.5 -2% | 15.6 ? 23% |
| WiFi v1.3 (h) | 8.3 | 8.9 7% | 8.7 5% | 10.1 22% | 7.1 -14% | 14 ? 69% | |
| Load (h) | 1.6 | 2 25% | 1.8 13% | 1.7 6% | 2.3 44% | 1.5 -6% | 1.946 ? 22% |
| Reader / Idle (h) | 20.2 | 22.1 | 12.8 | 27.7 | 28.6 ? |
Pros
Cons
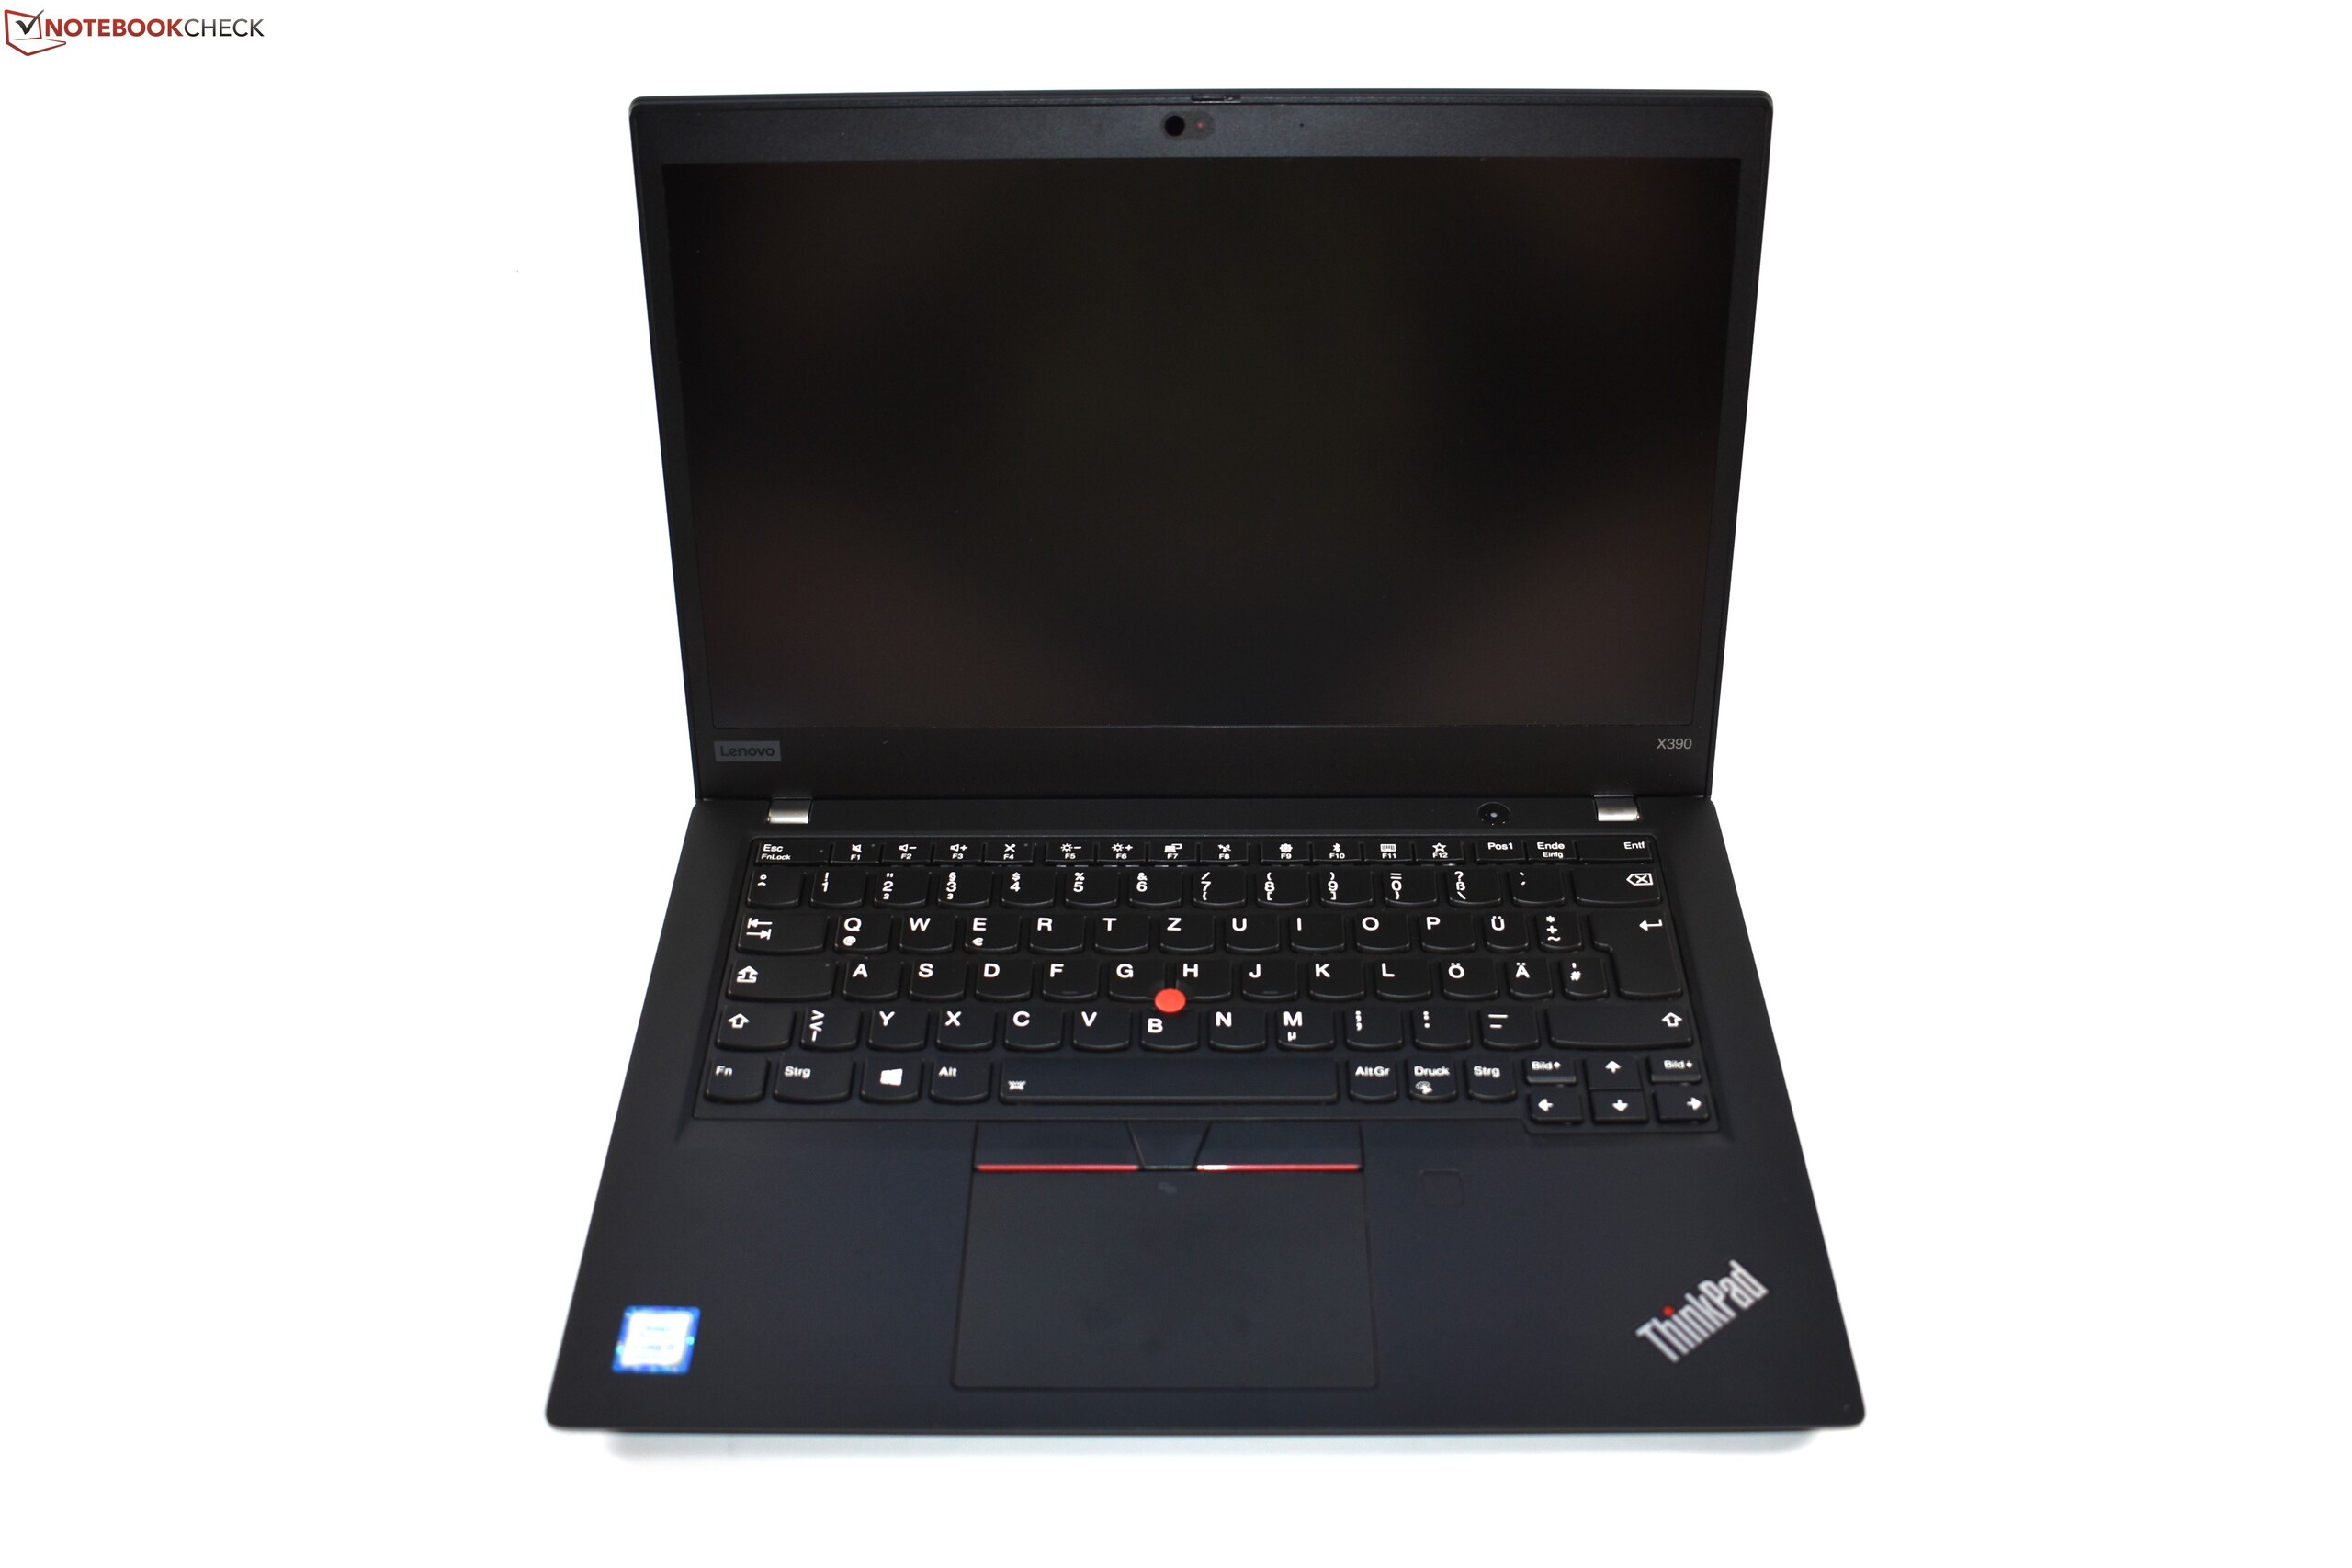
当去年ThinkPad X280发布时,我们不禁提问这款经典的12.5英寸笔记本是否已经过时。 ThinkPad X390的发布现在回答了这个问题——的确如此,买家现在更喜欢大屏幕。但是对于ThinkPad X390的我们仍有一些疑问。
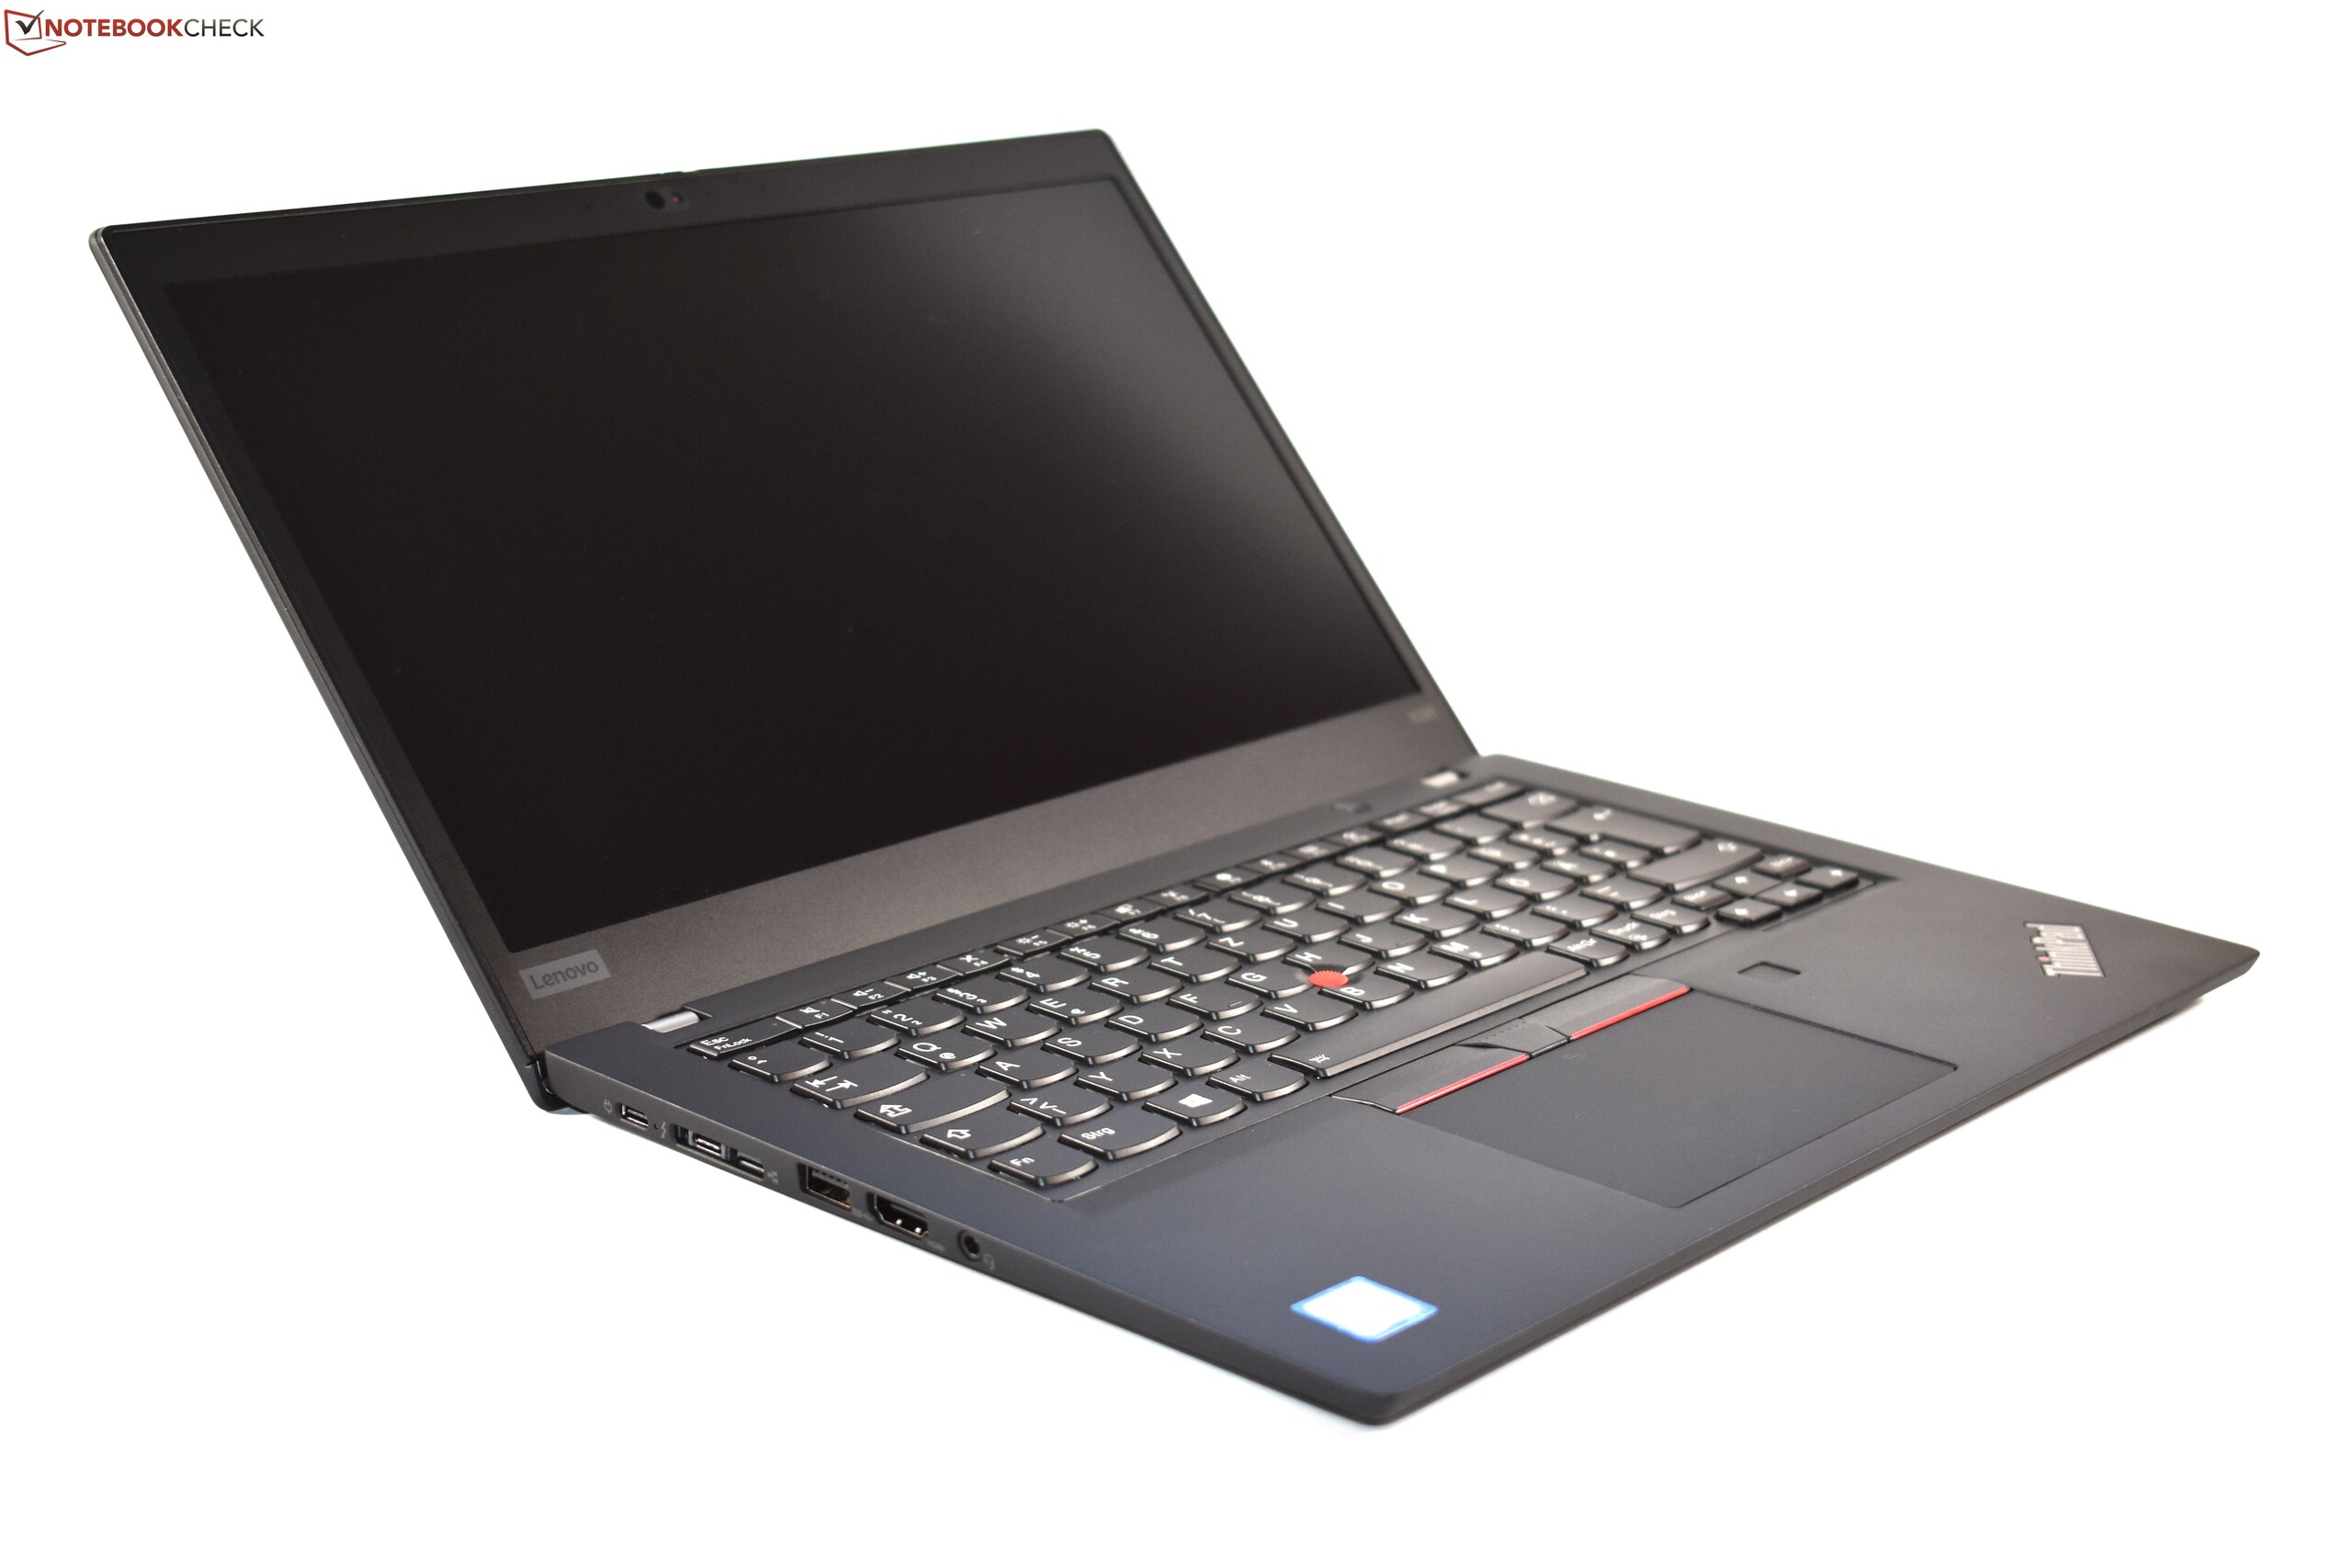
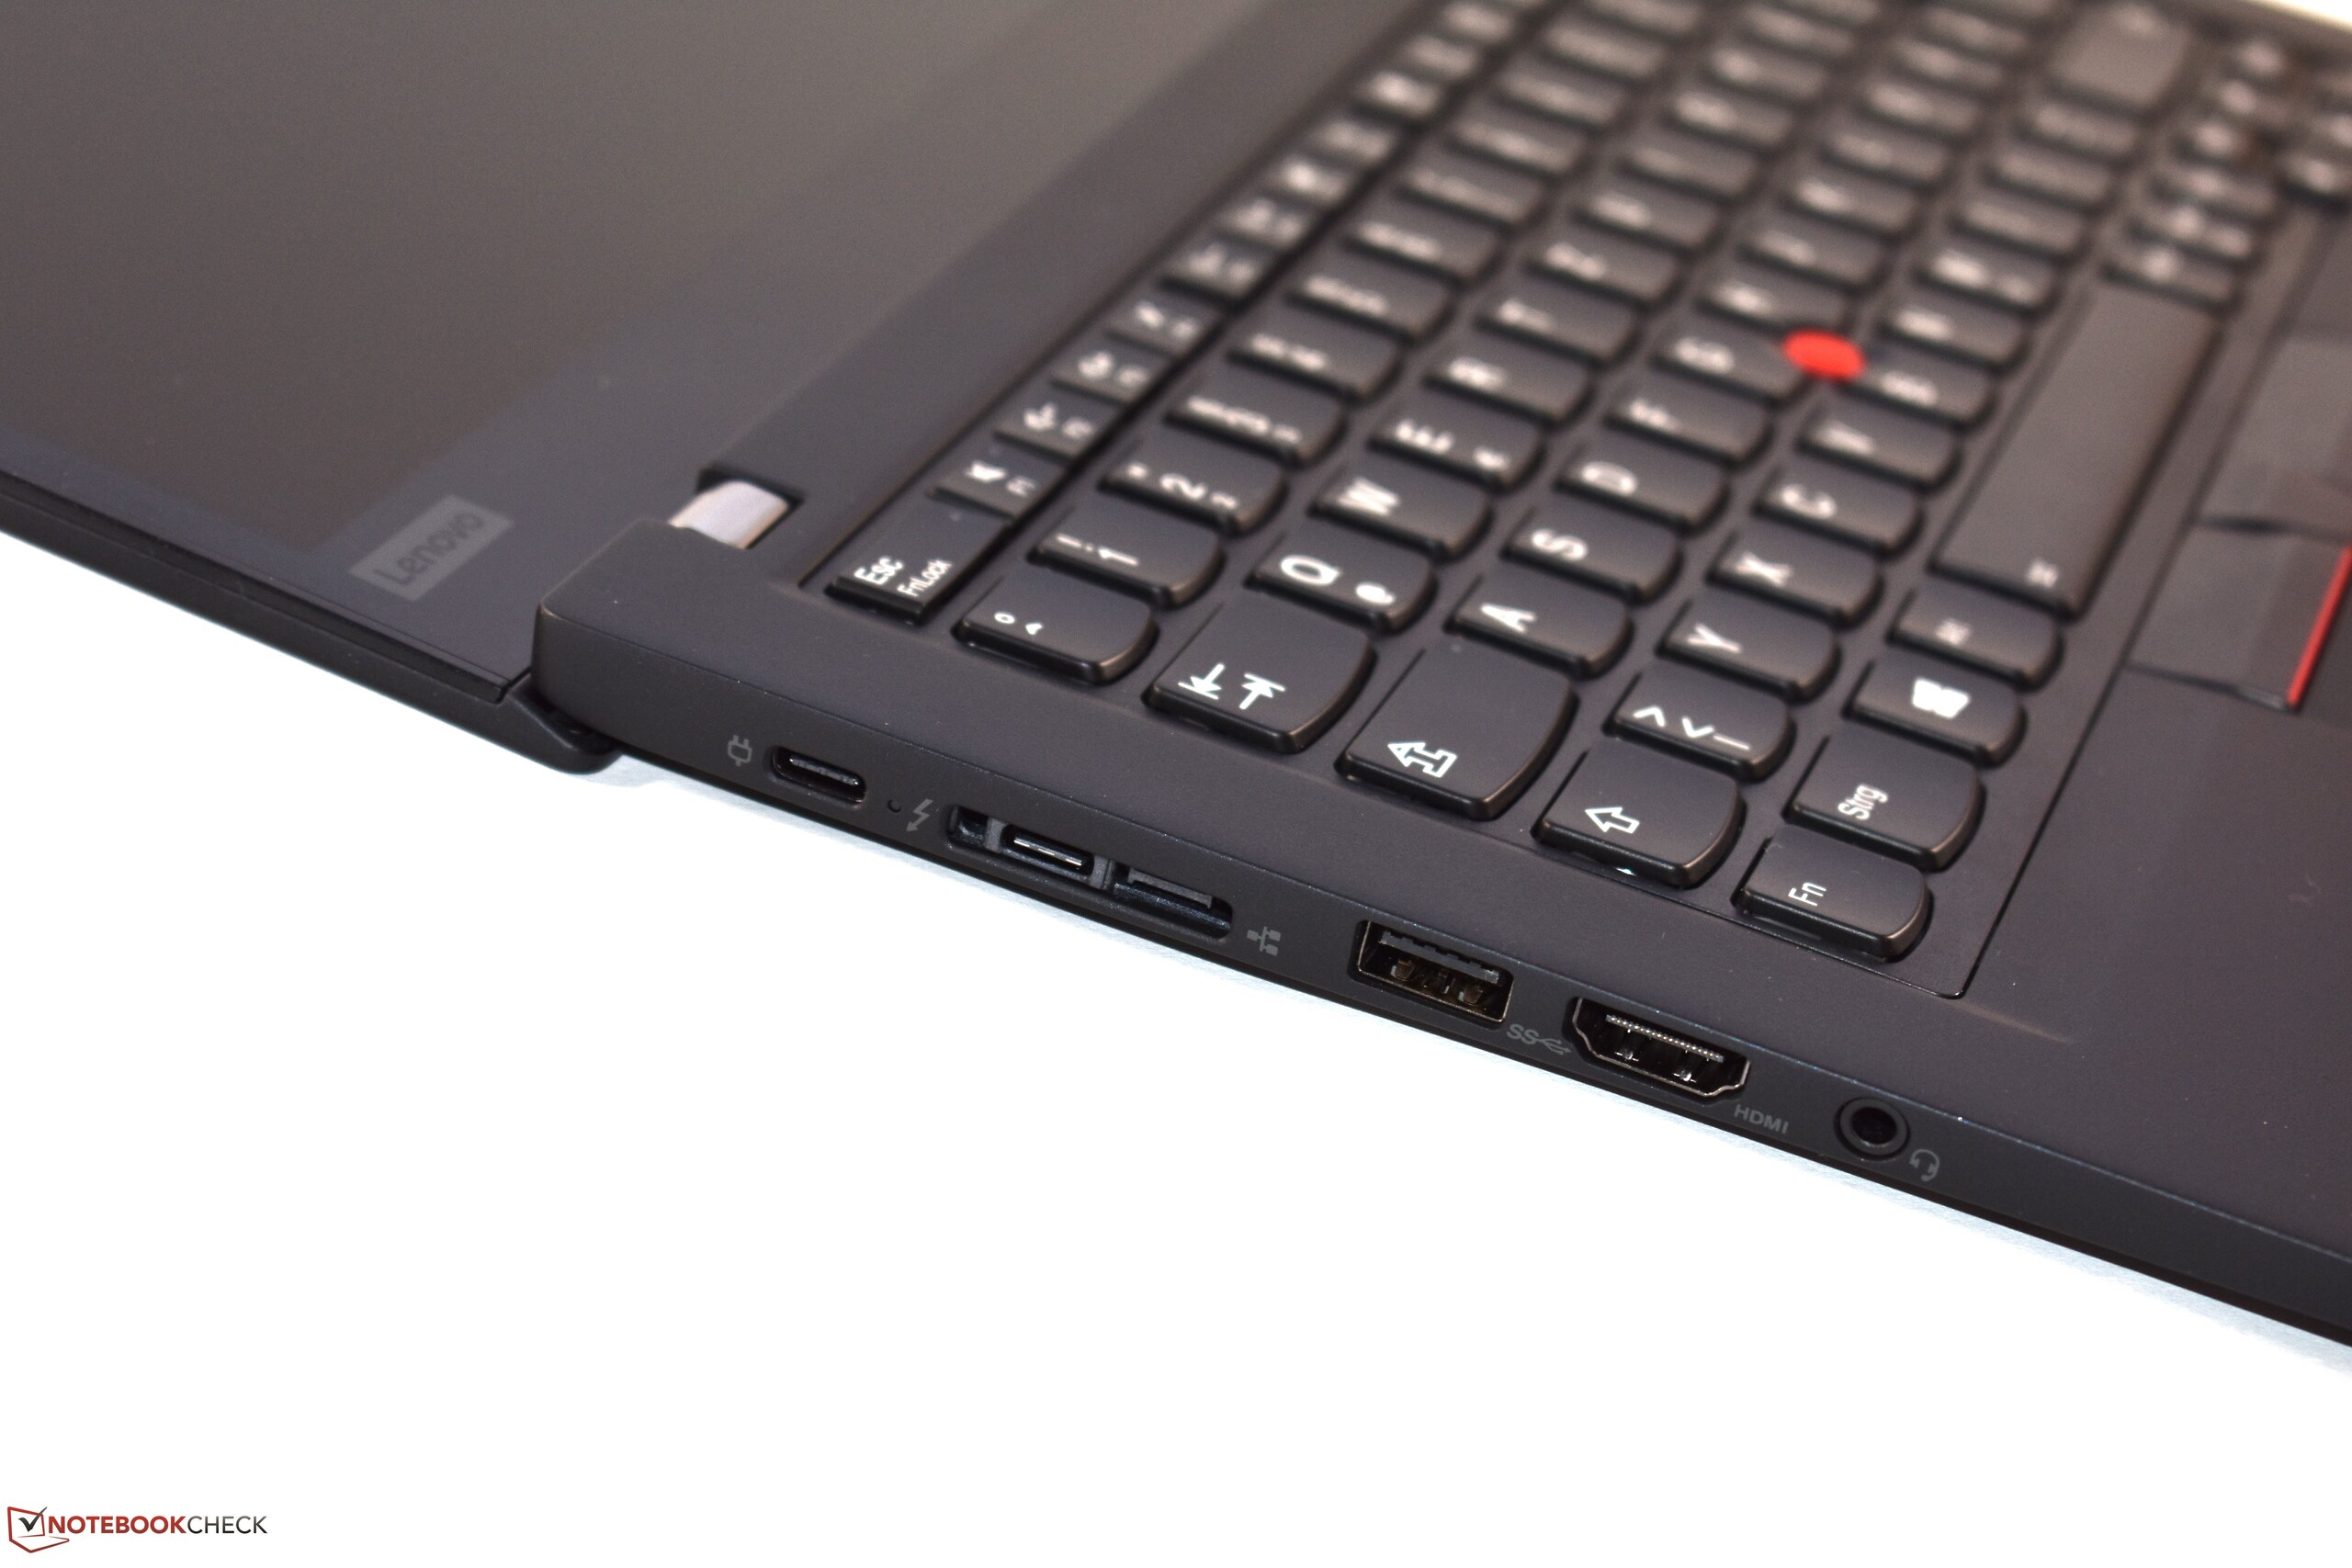
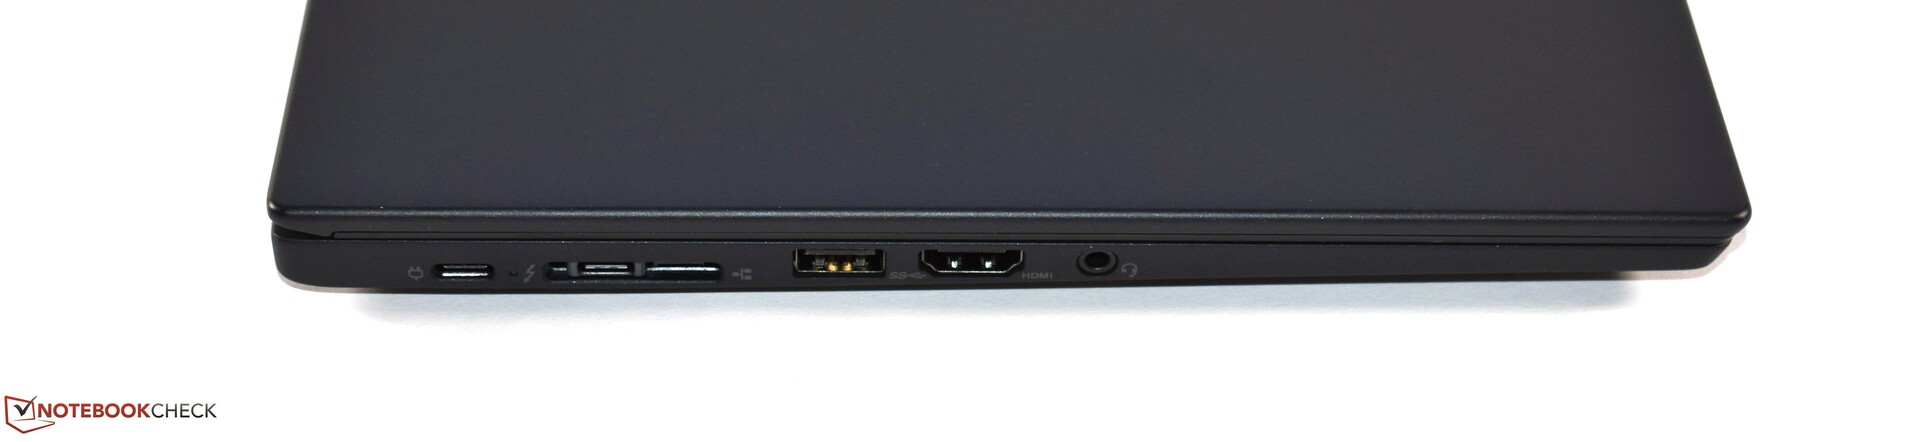
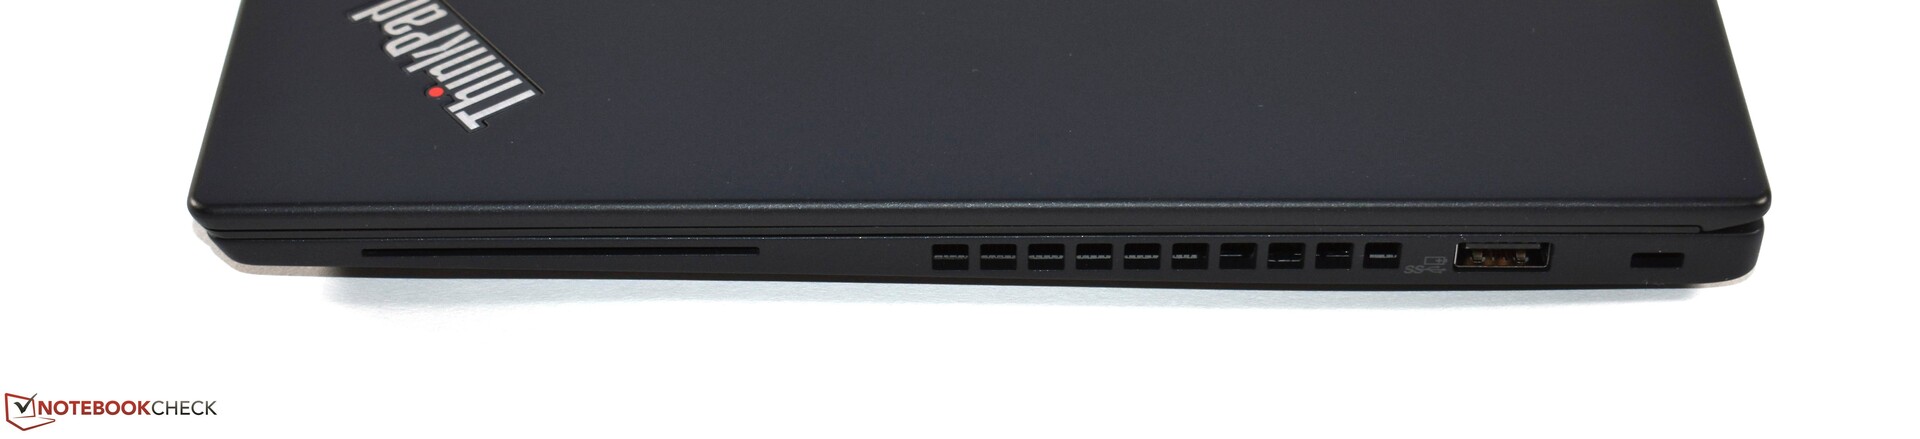
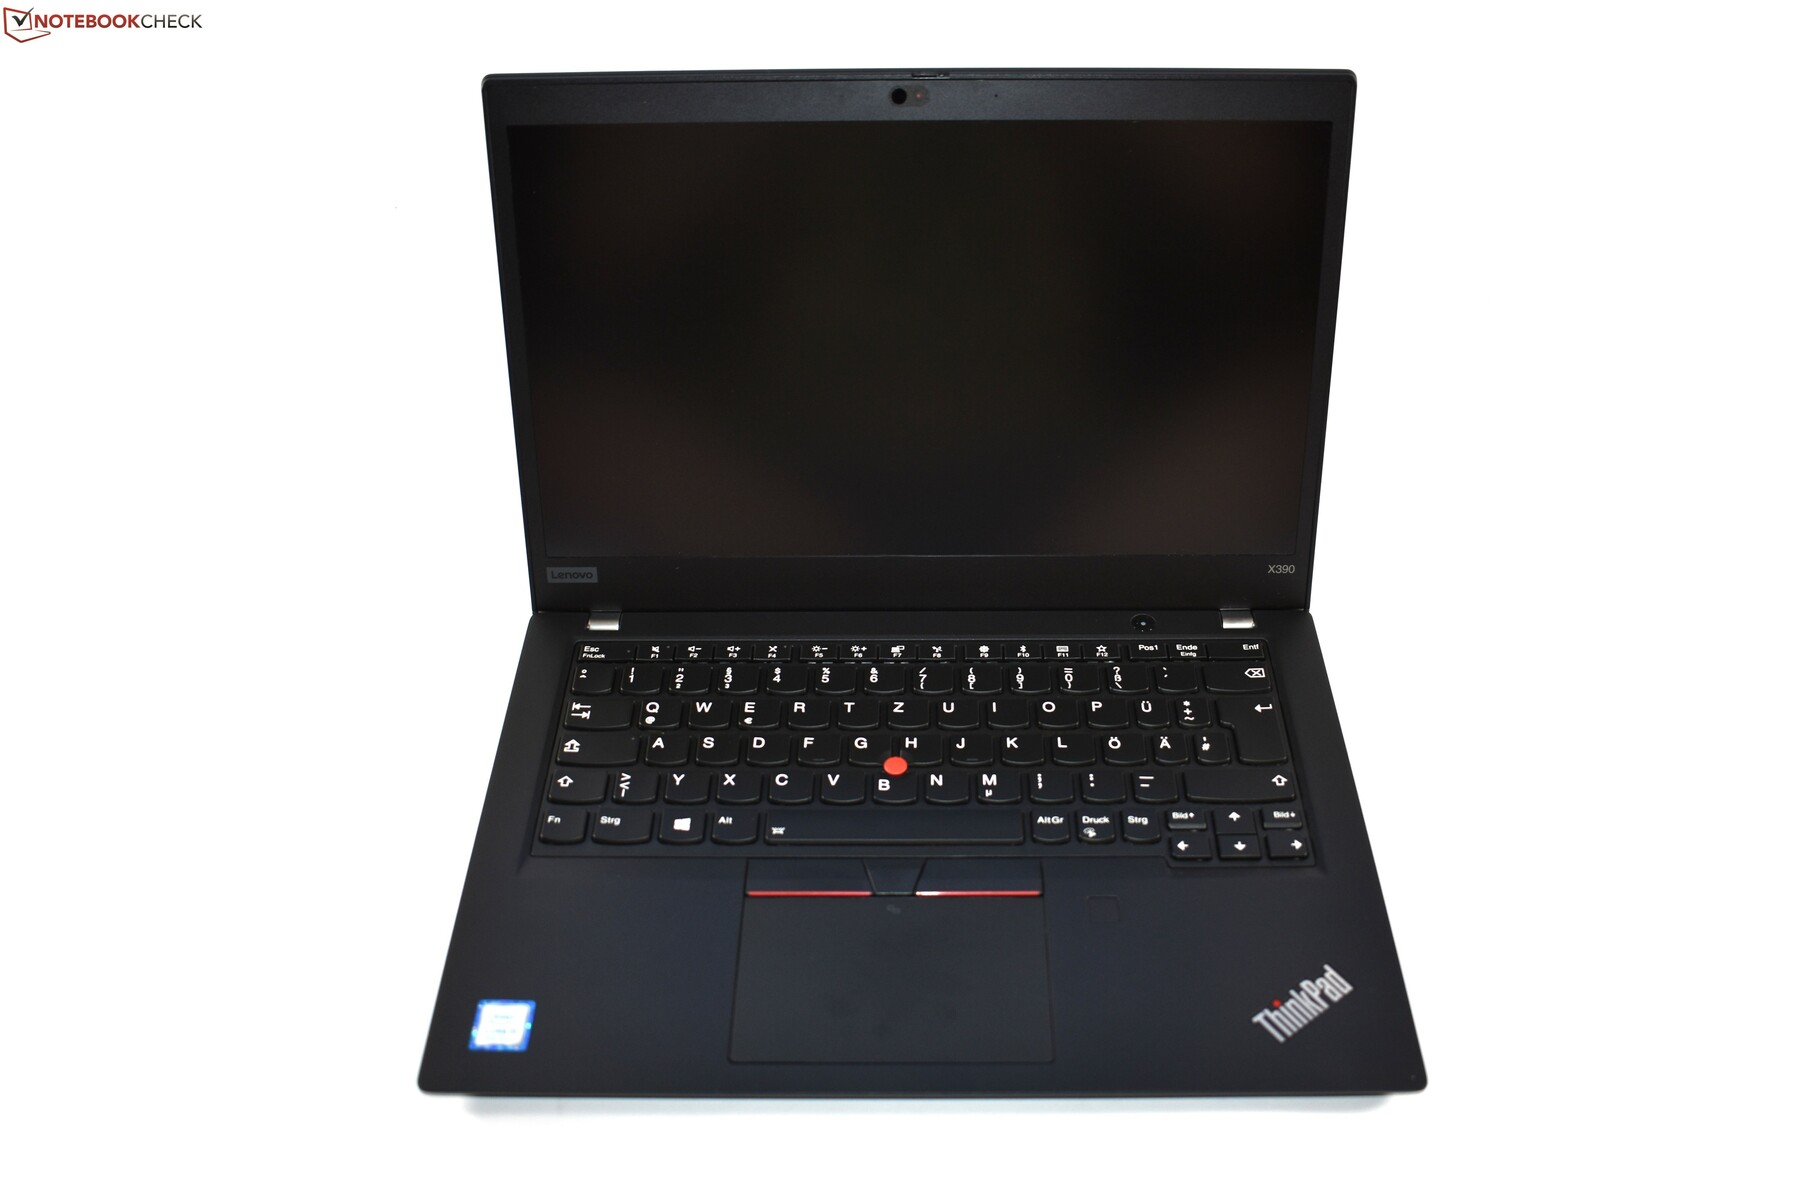
首先,联想ThinkPad X390有很多优点,这是联想进步的证明。 ThinkPad X390具有坚固,高品质和纤薄的机身,包含出色的输入设备和大量的接口。商务功能和连接性非常丰富,并且具有三年Premier支持的保修也非常良心。 ThinkPad X390使用户可以非常轻松地更换键盘,这与许多其他小型笔记本电脑有所不同。屏幕哑光,明亮,色域很好。这解决了我们对X280的一个重大问题。 CPU性能良好,ThinkPad X390不会变得特别热,而且几乎完全安静。
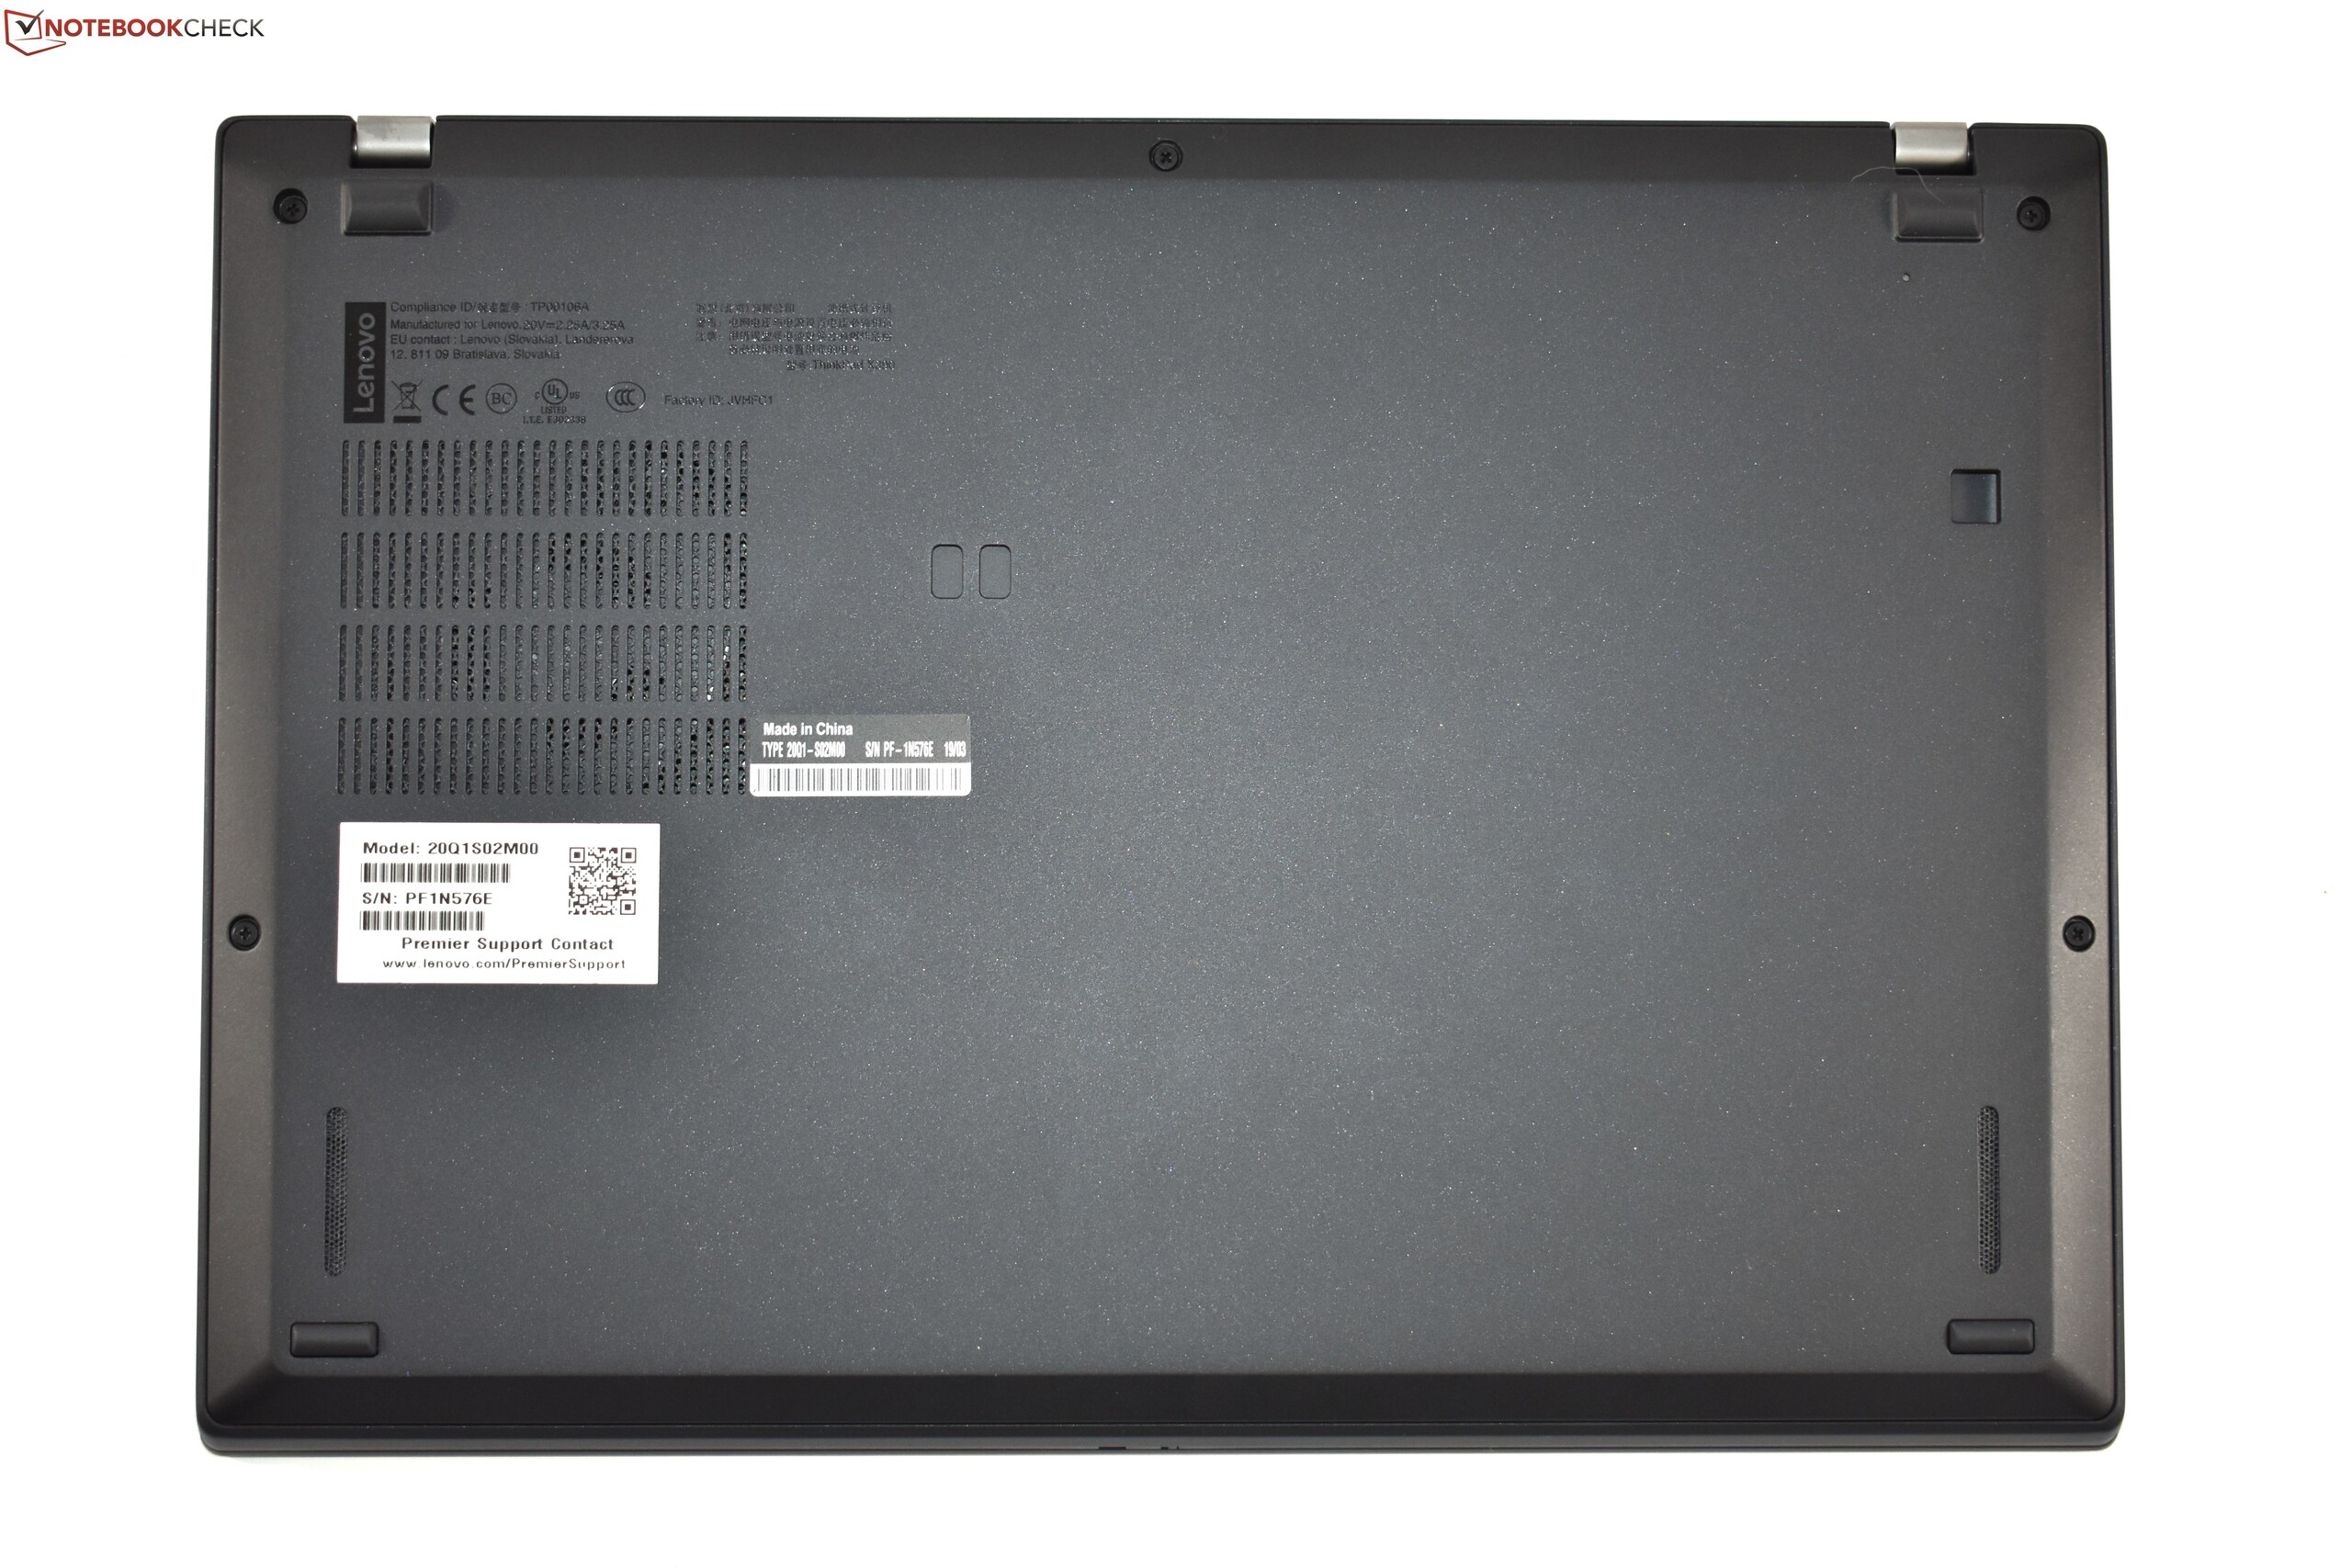
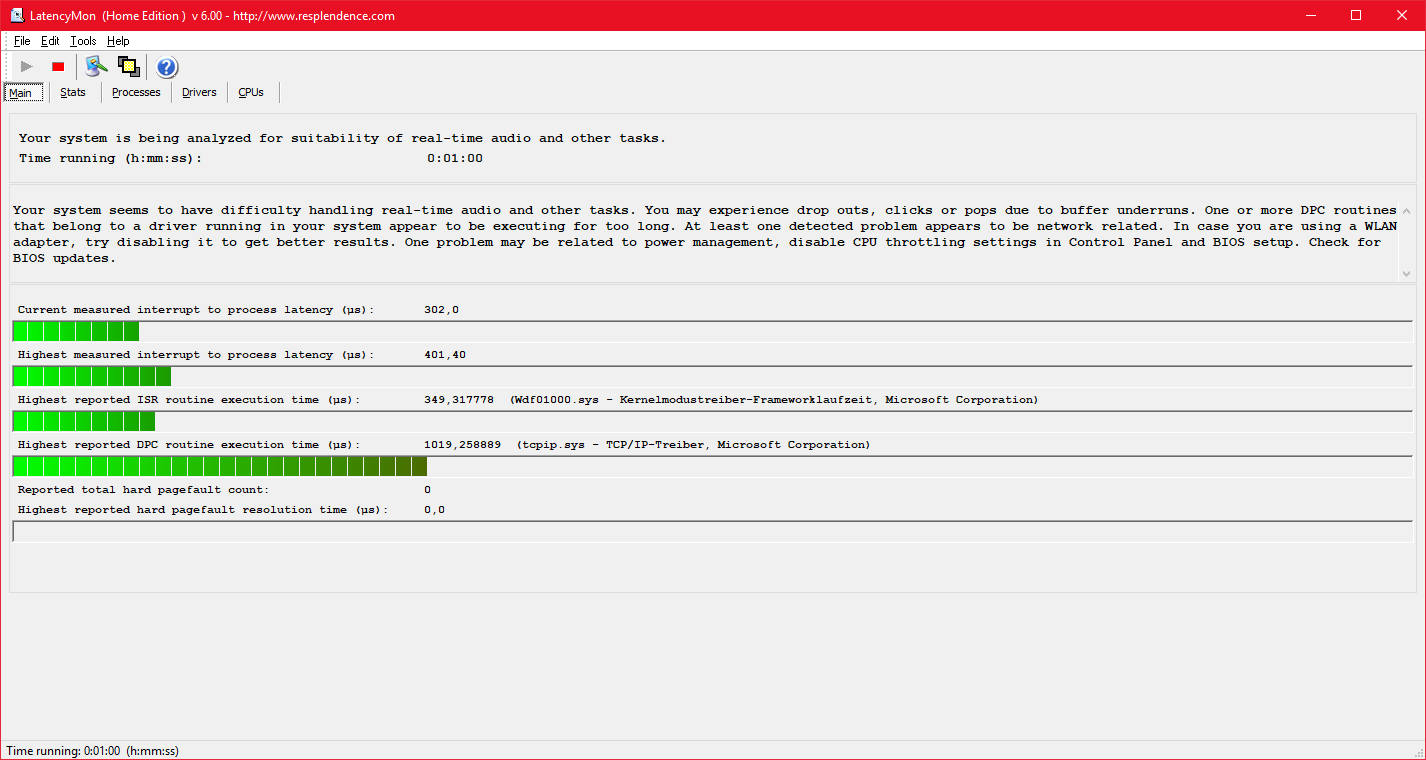
有了这么多的有点,是否还有任何缺点?并不多,因为联想不会在这款商务笔记本电脑上犯很多错误。一个不太讨人喜欢的细节是只有microSD卡读卡器,这很糟糕。当设备只使用电池运行时,CPU性能有限,而且X390的键盘明显窄于其他ThinkPad。 X390的升级性能并不理想,特别是完全焊丝的RAM—— 我们希望看到至少一个可升级的RAM插槽。屏幕响应时间较短,Thunderbolt端口仅通过两个PCIe通道连接。同样令人遗憾的是联想没有提供高分辨率的屏幕。
一台完成度极高的机器:联想用X390证明了自己能做对很多事情——但联想内部却有强大的竞争对手。
所有这些都是实实在在的抱怨,但它们有点太挑剔——这款ThinkPad没有大问题。这就是为什么它当然得到我们的推荐。尽管有这个积极的判断,但我们不得不问问ThinkPad T490s是不是更好的选择?后略大,价格更昂贵,没有易于拆卸的键盘,但它有更大的电池,更大的屏幕,可选择更高的分辨率和更宽的键盘。除了那些东西,两个ThinkPad几乎完全相同。最后,如果选择更大或更小的ThinkPad只是一个个人选择问题。也许,联想应该考虑合并这两个产品,因为T490和X390在很多方面都太相似了。
Lenovo ThinkPad X390-20Q1S02M00
- 04/25/2019 v6 (old)
Benjamin Herzig
Price comparison

