东芝 Portégé X30 (i7-7600U, 256 GB) 笔记本电脑简短评测

| SD Card Reader | |
| average JPG Copy Test (av. of 3 runs) | |
| Dell XPS 13 9360 FHD i7 Iris | |
| Lenovo ThinkPad T470s-20HF0012US | |
| Toshiba Portege X30-D (PT274U-01N001) | |
| Lenovo ThinkPad X1 Carbon 2017-20HQS03P00 | |
| maximum AS SSD Seq Read Test (1GB) | |
| Dell XPS 13 9360 FHD i7 Iris | |
| Lenovo ThinkPad T470s-20HF0012US | |
| Toshiba Portege X30-D (PT274U-01N001) | |
| Lenovo ThinkPad X1 Carbon 2017-20HQS03P00 | |
| Networking | |
| iperf3 transmit AX12 | |
| Apple MacBook 12 2017 | |
| HP Spectre 13-v131ng | |
| Dell XPS 13 9360 FHD i7 Iris | |
| Lenovo ThinkPad X1 Carbon 2017-20HQS03P00 | |
| Lenovo ThinkPad T470s-20HF0012US | |
| Toshiba Portege X30-D (PT274U-01N001) | |
| iperf3 receive AX12 | |
| Apple MacBook 12 2017 | |
| Toshiba Portege X30-D (PT274U-01N001) | |
| Lenovo ThinkPad X1 Carbon 2017-20HQS03P00 | |
| Lenovo ThinkPad T470s-20HF0012US | |
| Dell XPS 13 9360 FHD i7 Iris | |
| HP Spectre 13-v131ng | |
| |||||||||||||||||||||||||
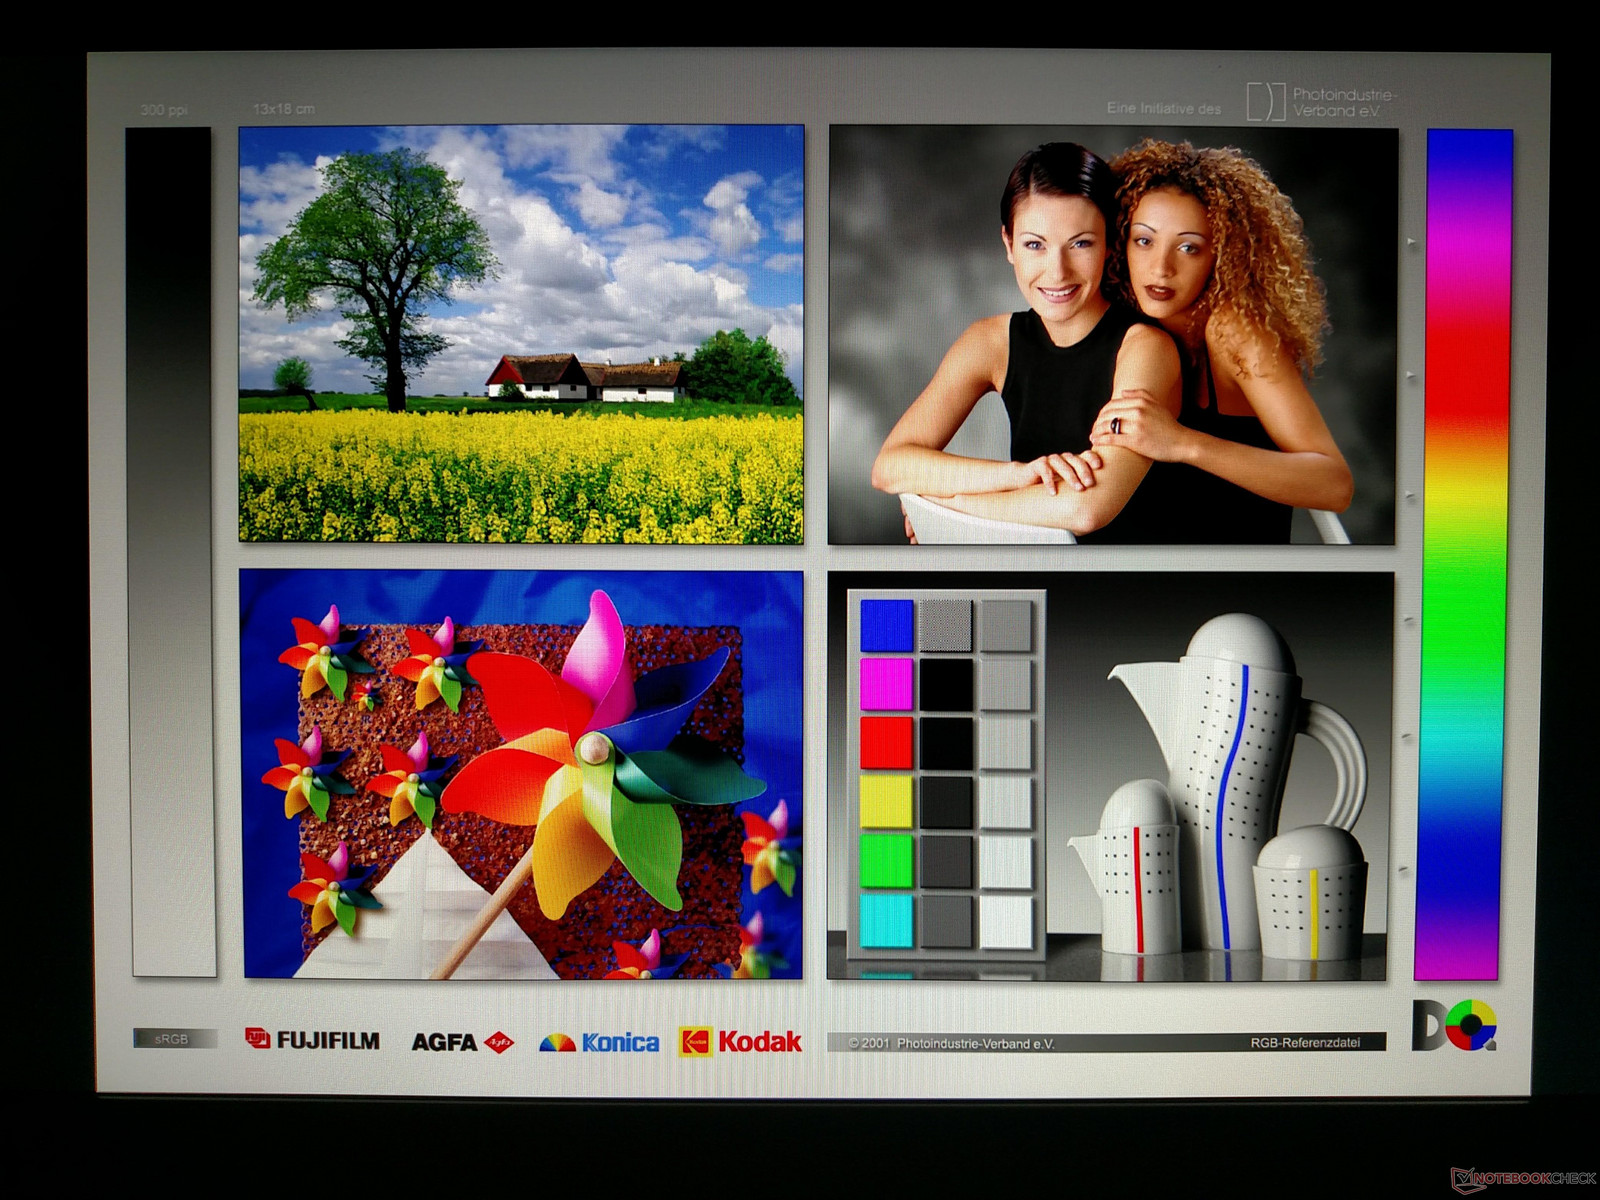
Brightness Distribution: 86 %
Center on Battery: 332.6 cd/m²
Contrast: 1188:1 (Black: 0.28 cd/m²)
ΔE ColorChecker Calman: 2.6 | ∀{0.5-29.43 Ø4.71}
ΔE Greyscale Calman: 2.5 | ∀{0.09-98 Ø4.96}
94% sRGB (Argyll 1.6.3 3D)
62% AdobeRGB 1998 (Argyll 1.6.3 3D)
66.6% AdobeRGB 1998 (Argyll 3D)
93.5% sRGB (Argyll 3D)
66.4% Display P3 (Argyll 3D)
Gamma: 2.12
CCT: 6720 K
| Toshiba Portege X30-D (PT274U-01N001) Toshiba TOS508F, IPS, 13.3", 1920x1080 | Lenovo ThinkPad X1 Carbon 2017-20HQS03P00 B140HAN03_1, IPS, 14", 1920x1080 | Lenovo ThinkPad T470s-20HF0012US LEN40A9 (R140NWF5 R1), IPS, 14", 1920x1080 | Apple MacBook 12 2017 APPA027, LED IPS, 12", 2304x1440 | HP Spectre 13-v131ng CMN1374, IPS UWVA, 13.3", 1920x1080 | |
|---|---|---|---|---|---|
| Display | -7% | -37% | -4% | ||
| Display P3 Coverage (%) | 66.4 | 61.4 -8% | 40.35 -39% | 64.6 -3% | |
| sRGB Coverage (%) | 93.5 | 85.9 -8% | 60.3 -36% | 88.8 -5% | |
| AdobeRGB 1998 Coverage (%) | 66.6 | 62.4 -6% | 41.72 -37% | 64.8 -3% | |
| Response Times | -10% | -4% | -5% | -18% | |
| Response Time Grey 50% / Grey 80% * (ms) | 36.8 ? | 41.6 ? -13% | 40.8 ? -11% | 40.8 ? -11% | 46 ? -25% |
| Response Time Black / White * (ms) | 29.6 ? | 31.6 ? -7% | 28.8 ? 3% | 29.2 ? 1% | 33 ? -11% |
| PWM Frequency (Hz) | 219.3 ? | 116000 | |||
| Screen | -31% | -60% | -30% | ||
| Brightness middle (cd/m²) | 332.6 | 311 -6% | 271.6 -18% | 404 21% | |
| Brightness (cd/m²) | 323 | 288 -11% | 264 -18% | 382 18% | |
| Brightness Distribution (%) | 86 | 85 -1% | 88 2% | 91 6% | |
| Black Level * (cd/m²) | 0.28 | 0.24 14% | 0.24 14% | 0.35 -25% | |
| Contrast (:1) | 1188 | 1296 9% | 1132 -5% | 1154 -3% | |
| Colorchecker dE 2000 * | 2.6 | 5.5 -112% | 6.1 -135% | 5.37 -107% | |
| Colorchecker dE 2000 max. * | 6.7 | 9 -34% | 28.6 -327% | 9.46 -41% | |
| Greyscale dE 2000 * | 2.5 | 6.2 -148% | 3.4 -36% | 6.44 -158% | |
| Gamma | 2.12 104% | 2.02 109% | 2.12 104% | 2.52 87% | |
| CCT | 6720 97% | 5950 109% | 6077 107% | 6738 96% | |
| Color Space (Percent of AdobeRGB 1998) (%) | 62 | 55.96 -10% | 38 -39% | 58 -6% | |
| Color Space (Percent of sRGB) (%) | 94 | 85.77 -9% | 60 -36% | 89 -5% | |
| Total Average (Program / Settings) | -16% /
-23% | -34% /
-48% | -5% /
-5% | -17% /
-23% |
* ... smaller is better
Display Response Times
| ↔ Response Time Black to White | ||
|---|---|---|
| 29.6 ms ... rise ↗ and fall ↘ combined | ↗ 17.2 ms rise | 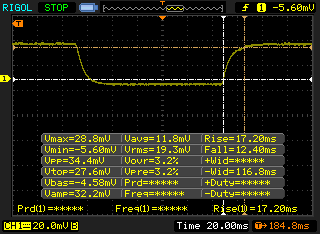 |
| ↘ 12.4 ms fall | ||
| The screen shows relatively slow response rates in our tests and may be too slow for gamers. In comparison, all tested devices range from 0.1 (minimum) to 240 (maximum) ms. » 79 % of all devices are better. This means that the measured response time is worse than the average of all tested devices (19.8 ms). | ||
| ↔ Response Time 50% Grey to 80% Grey | ||
| 36.8 ms ... rise ↗ and fall ↘ combined | ↗ 18.8 ms rise | 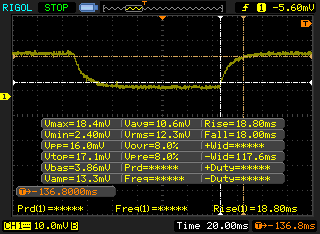 |
| ↘ 18 ms fall | ||
| The screen shows slow response rates in our tests and will be unsatisfactory for gamers. In comparison, all tested devices range from 0.165 (minimum) to 636 (maximum) ms. » 53 % of all devices are better. This means that the measured response time is worse than the average of all tested devices (31 ms). | ||
Screen Flickering / PWM (Pulse-Width Modulation)
| Screen flickering / PWM not detected | 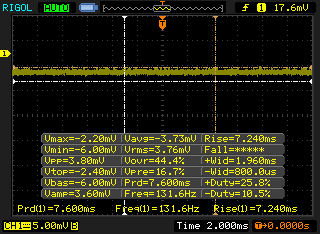 | ||
In comparison: 52 % of all tested devices do not use PWM to dim the display. If PWM was detected, an average of 7757 (minimum: 5 - maximum: 343500) Hz was measured. | |||
| Cinebench R15 | |
| CPU Single 64Bit | |
| Dell XPS 13 9360 FHD i7 Iris | |
| Lenovo ThinkPad X1 Carbon 2017-20HQS03P00 | |
| Lenovo ThinkPad T470s-20HF0012US | |
| HP Spectre 13-v131ng | |
| Toshiba Portege X30-D (PT274U-01N001) | |
| Apple MacBook 12 2017 | |
| CPU Multi 64Bit | |
| Lenovo ThinkPad T470s-20HF0012US | |
| Lenovo ThinkPad X1 Carbon 2017-20HQS03P00 | |
| Toshiba Portege X30-D (PT274U-01N001) | |
| Dell XPS 13 9360 FHD i7 Iris | |
| HP Spectre 13-v131ng | |
| Apple MacBook 12 2017 | |
| Cinebench R11.5 | |
| CPU Single 64Bit | |
| Toshiba Portege X30-D (PT274U-01N001) | |
| Lenovo ThinkPad T470s-20HF0012US | |
| HP Spectre 13-v131ng | |
| CPU Multi 64Bit | |
| Lenovo ThinkPad T470s-20HF0012US | |
| Toshiba Portege X30-D (PT274U-01N001) | |
| HP Spectre 13-v131ng | |
| Cinebench R10 | |
| Rendering Multiple CPUs 32Bit | |
| Toshiba Portege X30-D (PT274U-01N001) | |
| HP Spectre 13-v131ng | |
| Rendering Single 32Bit | |
| Toshiba Portege X30-D (PT274U-01N001) | |
| HP Spectre 13-v131ng | |
| wPrime 2.10 - 1024m | |
| Toshiba Portege X30-D (PT274U-01N001) | |
| Lenovo ThinkPad T470s-20HF0012US | |
* ... smaller is better
| PCMark 8 | |
| Home Score Accelerated v2 | |
| Lenovo ThinkPad X1 Carbon 2017-20HQS03P00 | |
| Lenovo ThinkPad T470s-20HF0012US | |
| Dell XPS 13 9360 FHD i7 Iris | |
| HP Spectre 13-v131ng | |
| Toshiba Portege X30-D (PT274U-01N001) | |
| Apple MacBook 12 2017 | |
| Work Score Accelerated v2 | |
| HP Spectre 13-v131ng | |
| Lenovo ThinkPad T470s-20HF0012US | |
| Lenovo ThinkPad X1 Carbon 2017-20HQS03P00 | |
| Toshiba Portege X30-D (PT274U-01N001) | |
| Dell XPS 13 9360 FHD i7 Iris | |
| Apple MacBook 12 2017 | |
| Creative Score Accelerated v2 | |
| Dell XPS 13 9360 FHD i7 Iris | |
| Lenovo ThinkPad T470s-20HF0012US | |
| Lenovo ThinkPad X1 Carbon 2017-20HQS03P00 | |
| HP Spectre 13-v131ng | |
| Toshiba Portege X30-D (PT274U-01N001) | |
| Apple MacBook 12 2017 | |
| PCMark 7 Score | 5667 points | |
| PCMark 8 Home Score Accelerated v2 | 3543 points | |
| PCMark 8 Creative Score Accelerated v2 | 4561 points | |
| PCMark 8 Work Score Accelerated v2 | 4910 points | |
Help | ||
| Toshiba Portege X30-D (PT274U-01N001) Samsung PM961 MZVLW256HEHP | Lenovo ThinkPad X1 Carbon 2017-20HQS03P00 Samsung PM961 NVMe MZVLW512HMJP | Lenovo ThinkPad T470s-20HF0012US Samsung PM961 MZVLW256HEHP | Apple MacBook 12 2017 Apple SSD AP0256 | HP Spectre 13-v131ng Samsung PM961 NVMe MZVLW512HMJP | |
|---|---|---|---|---|---|
| CrystalDiskMark 3.0 | 19% | 8% | -39% | -3% | |
| Read Seq (MB/s) | 1270 | 1827 44% | 1399 10% | 955 -25% | 1090 -14% |
| Write Seq (MB/s) | 1213 | 1383 14% | 1213 0% | 899 -26% | 1088 -10% |
| Read 512 (MB/s) | 858 | 814 -5% | 831 -3% | 658 -23% | 753 -12% |
| Write 512 (MB/s) | 763 | 1098 44% | 856 12% | 579 -24% | 911 19% |
| Read 4k (MB/s) | 40.9 | 61 49% | 60.7 48% | 9.721 -76% | 57.5 41% |
| Write 4k (MB/s) | 143.6 | 172.2 20% | 159.2 11% | 12.78 -91% | 140.2 -2% |
| Read 4k QD32 (MB/s) | 626 | 601 -4% | 580 -7% | 521 -17% | 497.1 -21% |
| Write 4k QD32 (MB/s) | 536 | 495.6 -8% | 499.4 -7% | 370.1 -31% | 416 -22% |

| 3DMark 11 | |
| 1280x720 Performance GPU | |
| Dell XPS 13 9360 FHD i7 Iris | |
| Lenovo ThinkPad X1 Carbon 2017-20HQS03P00 | |
| Lenovo ThinkPad T470s-20HF0012US | |
| HP Spectre 13-v131ng | |
| Toshiba Portege X30-D (PT274U-01N001) | |
| Apple MacBook 12 2017 | |
| 1280x720 Performance Combined | |
| Dell XPS 13 9360 FHD i7 Iris | |
| Lenovo ThinkPad X1 Carbon 2017-20HQS03P00 | |
| Lenovo ThinkPad T470s-20HF0012US | |
| HP Spectre 13-v131ng | |
| Toshiba Portege X30-D (PT274U-01N001) | |
| Apple MacBook 12 2017 | |
| 3DMark | |
| 1280x720 Cloud Gate Standard Graphics | |
| Dell XPS 13 9360 FHD i7 Iris | |
| Lenovo ThinkPad X1 Carbon 2017-20HQS03P00 | |
| Lenovo ThinkPad T470s-20HF0012US | |
| HP Spectre 13-v131ng | |
| Toshiba Portege X30-D (PT274U-01N001) | |
| Apple MacBook 12 2017 | |
| 1920x1080 Fire Strike Graphics | |
| Dell XPS 13 9360 FHD i7 Iris | |
| Lenovo ThinkPad X1 Carbon 2017-20HQS03P00 | |
| Lenovo ThinkPad T470s-20HF0012US | |
| HP Spectre 13-v131ng | |
| Toshiba Portege X30-D (PT274U-01N001) | |
| 1920x1080 Ice Storm Extreme Graphics | |
| HP Spectre 13-v131ng | |
| Toshiba Portege X30-D (PT274U-01N001) | |
| 3DMark 11 Performance | 1577 points | |
| 3DMark Ice Storm Standard Score | 52149 points | |
| 3DMark Cloud Gate Standard Score | 5812 points | |
| 3DMark Fire Strike Score | 780 points | |
Help | ||
Noise level
| Idle |
| 28.4 / 28.4 / 28.4 dB(A) |
| Load |
| 33.2 / 37.9 dB(A) |
 | ||
30 dB silent 40 dB(A) audible 50 dB(A) loud |
||
min: | ||
| Toshiba Portege X30-D (PT274U-01N001) HD Graphics 620, i7-7600U, Samsung PM961 MZVLW256HEHP | Lenovo ThinkPad X1 Carbon 2017-20HQS03P00 HD Graphics 620, i7-7500U, Samsung PM961 NVMe MZVLW512HMJP | Lenovo ThinkPad T470s-20HF0012US HD Graphics 620, i5-7300U, Samsung PM961 MZVLW256HEHP | Apple MacBook 12 2017 HD Graphics 615, m3-7Y32, Apple SSD AP0256 | HP Spectre 13-v131ng HD Graphics 620, i7-7500U, Samsung PM961 NVMe MZVLW512HMJP | Dell XPS 13 9360 FHD i7 Iris Iris Plus Graphics 640, i7-7560U, Toshiba XG4 NVMe (THNSN5512GPUK) | |
|---|---|---|---|---|---|---|
| Noise | -5% | -1% | -9% | -3% | ||
| off / environment * (dB) | 28.4 | 29.3 -3% | 27.8 2% | 30.4 -7% | 29.9 -5% | |
| Idle Minimum * (dB) | 28.4 | 29.3 -3% | 27.8 2% | 30.4 -7% | 29.9 -5% | |
| Idle Average * (dB) | 28.4 | 29.3 -3% | 27.8 2% | 30.4 -7% | 29.9 -5% | |
| Idle Maximum * (dB) | 28.4 | 32.2 -13% | 27.8 2% | 30.4 -7% | 30.3 -7% | |
| Load Average * (dB) | 33.2 | 34.3 -3% | 34.8 -5% | 40 -20% | 33.9 -2% | |
| Load Maximum * (dB) | 37.9 | 39.3 -4% | 42 -11% | 40 -6% | 34.9 8% | |
| Witcher 3 ultra * (dB) | 42 |
* ... smaller is better
(±) The maximum temperature on the upper side is 40.6 °C / 105 F, compared to the average of 34.3 °C / 94 F, ranging from 21.2 to 62.5 °C for the class Office.
(±) The bottom heats up to a maximum of 40 °C / 104 F, compared to the average of 36.8 °C / 98 F
(+) In idle usage, the average temperature for the upper side is 26.7 °C / 80 F, compared to the device average of 29.5 °C / 85 F.
(+) The palmrests and touchpad are cooler than skin temperature with a maximum of 27.2 °C / 81 F and are therefore cool to the touch.
(±) The average temperature of the palmrest area of similar devices was 27.5 °C / 81.5 F (+0.3 °C / 0.5 F).
Toshiba Portege X30-D (PT274U-01N001) audio analysis
(±) | speaker loudness is average but good (77 dB)
Bass 100 - 315 Hz
(-) | nearly no bass - on average 16.7% lower than median
(±) | linearity of bass is average (14.2% delta to prev. frequency)
Mids 400 - 2000 Hz
(+) | balanced mids - only 2.6% away from median
(+) | mids are linear (6.8% delta to prev. frequency)
Highs 2 - 16 kHz
(+) | balanced highs - only 3.5% away from median
(±) | linearity of highs is average (9.3% delta to prev. frequency)
Overall 100 - 16.000 Hz
(±) | linearity of overall sound is average (19.7% difference to median)
Compared to same class
» 41% of all tested devices in this class were better, 7% similar, 51% worse
» The best had a delta of 7%, average was 21%, worst was 53%
Compared to all devices tested
» 50% of all tested devices were better, 7% similar, 43% worse
» The best had a delta of 4%, average was 23%, worst was 134%
HP Spectre 13-v131ng audio analysis
(-) | not very loud speakers (68 dB)
Bass 100 - 315 Hz
(-) | nearly no bass - on average 23.7% lower than median
(±) | linearity of bass is average (9.6% delta to prev. frequency)
Mids 400 - 2000 Hz
(±) | reduced mids - on average 5.1% lower than median
(±) | linearity of mids is average (7.6% delta to prev. frequency)
Highs 2 - 16 kHz
(±) | higher highs - on average 7.7% higher than median
(+) | highs are linear (3.1% delta to prev. frequency)
Overall 100 - 16.000 Hz
(±) | linearity of overall sound is average (28.6% difference to median)
Compared to same class
» 90% of all tested devices in this class were better, 2% similar, 7% worse
» The best had a delta of 5%, average was 18%, worst was 53%
Compared to all devices tested
» 86% of all tested devices were better, 3% similar, 11% worse
» The best had a delta of 4%, average was 23%, worst was 134%
| Off / Standby | |
| Idle | |
| Load |
|
Key:
min: | |
| Toshiba Portege X30-D (PT274U-01N001) i7-7600U, HD Graphics 620, Samsung PM961 MZVLW256HEHP, IPS, 1920x1080, 13.3" | Lenovo ThinkPad X1 Carbon 2017-20HQS03P00 i7-7500U, HD Graphics 620, Samsung PM961 NVMe MZVLW512HMJP, IPS, 1920x1080, 14" | Lenovo ThinkPad T470s-20HF0012US i5-7300U, HD Graphics 620, Samsung PM961 MZVLW256HEHP, IPS, 1920x1080, 14" | Apple MacBook 12 2017 m3-7Y32, HD Graphics 615, Apple SSD AP0256, LED IPS, 2304x1440, 12" | HP Spectre 13-v131ng i7-7500U, HD Graphics 620, Samsung PM961 NVMe MZVLW512HMJP, IPS UWVA, 1920x1080, 13.3" | |
|---|---|---|---|---|---|
| Power Consumption | -24% | -20% | 29% | -8% | |
| Idle Minimum * (Watt) | 4.6 | 3.84 17% | 4.8 -4% | 2 57% | 3.6 22% |
| Idle Average * (Watt) | 7.6 | 6.3 17% | 6.6 13% | 5.4 29% | 6.4 16% |
| Idle Maximum * (Watt) | 8.2 | 8.6 -5% | 7 15% | 6.6 20% | 9.2 -12% |
| Load Average * (Watt) | 23.8 | 41.9 -76% | 39.2 -65% | 22 8% | 34 -43% |
| Load Maximum * (Watt) | 28 | 48.7 -74% | 44.8 -60% | 20 29% | 34.4 -23% |
* ... smaller is better
| Toshiba Portege X30-D (PT274U-01N001) i7-7600U, HD Graphics 620, 48 Wh | Lenovo ThinkPad X1 Carbon 2017-20HQS03P00 i7-7500U, HD Graphics 620, 57 Wh | Lenovo ThinkPad T470s-20HF0012US i5-7300U, HD Graphics 620, 51 Wh | Apple MacBook 12 2017 m3-7Y32, HD Graphics 615, 41.4 Wh | HP Spectre 13-v131ng i7-7500U, HD Graphics 620, 38 Wh | |
|---|---|---|---|---|---|
| Battery runtime | 15% | 25% | 25% | -21% | |
| Reader / Idle (h) | 15 | 20.9 39% | 17.7 18% | 12 -20% | |
| WiFi v1.3 (h) | 7.2 | 8.3 15% | 8.1 13% | 9 25% | 6.6 -8% |
| Load (h) | 2 | 1.8 -10% | 2.9 45% | 1.3 -35% |
Pros
Cons
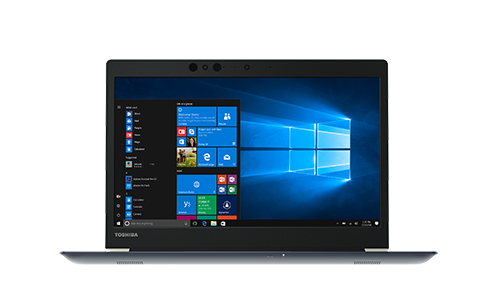
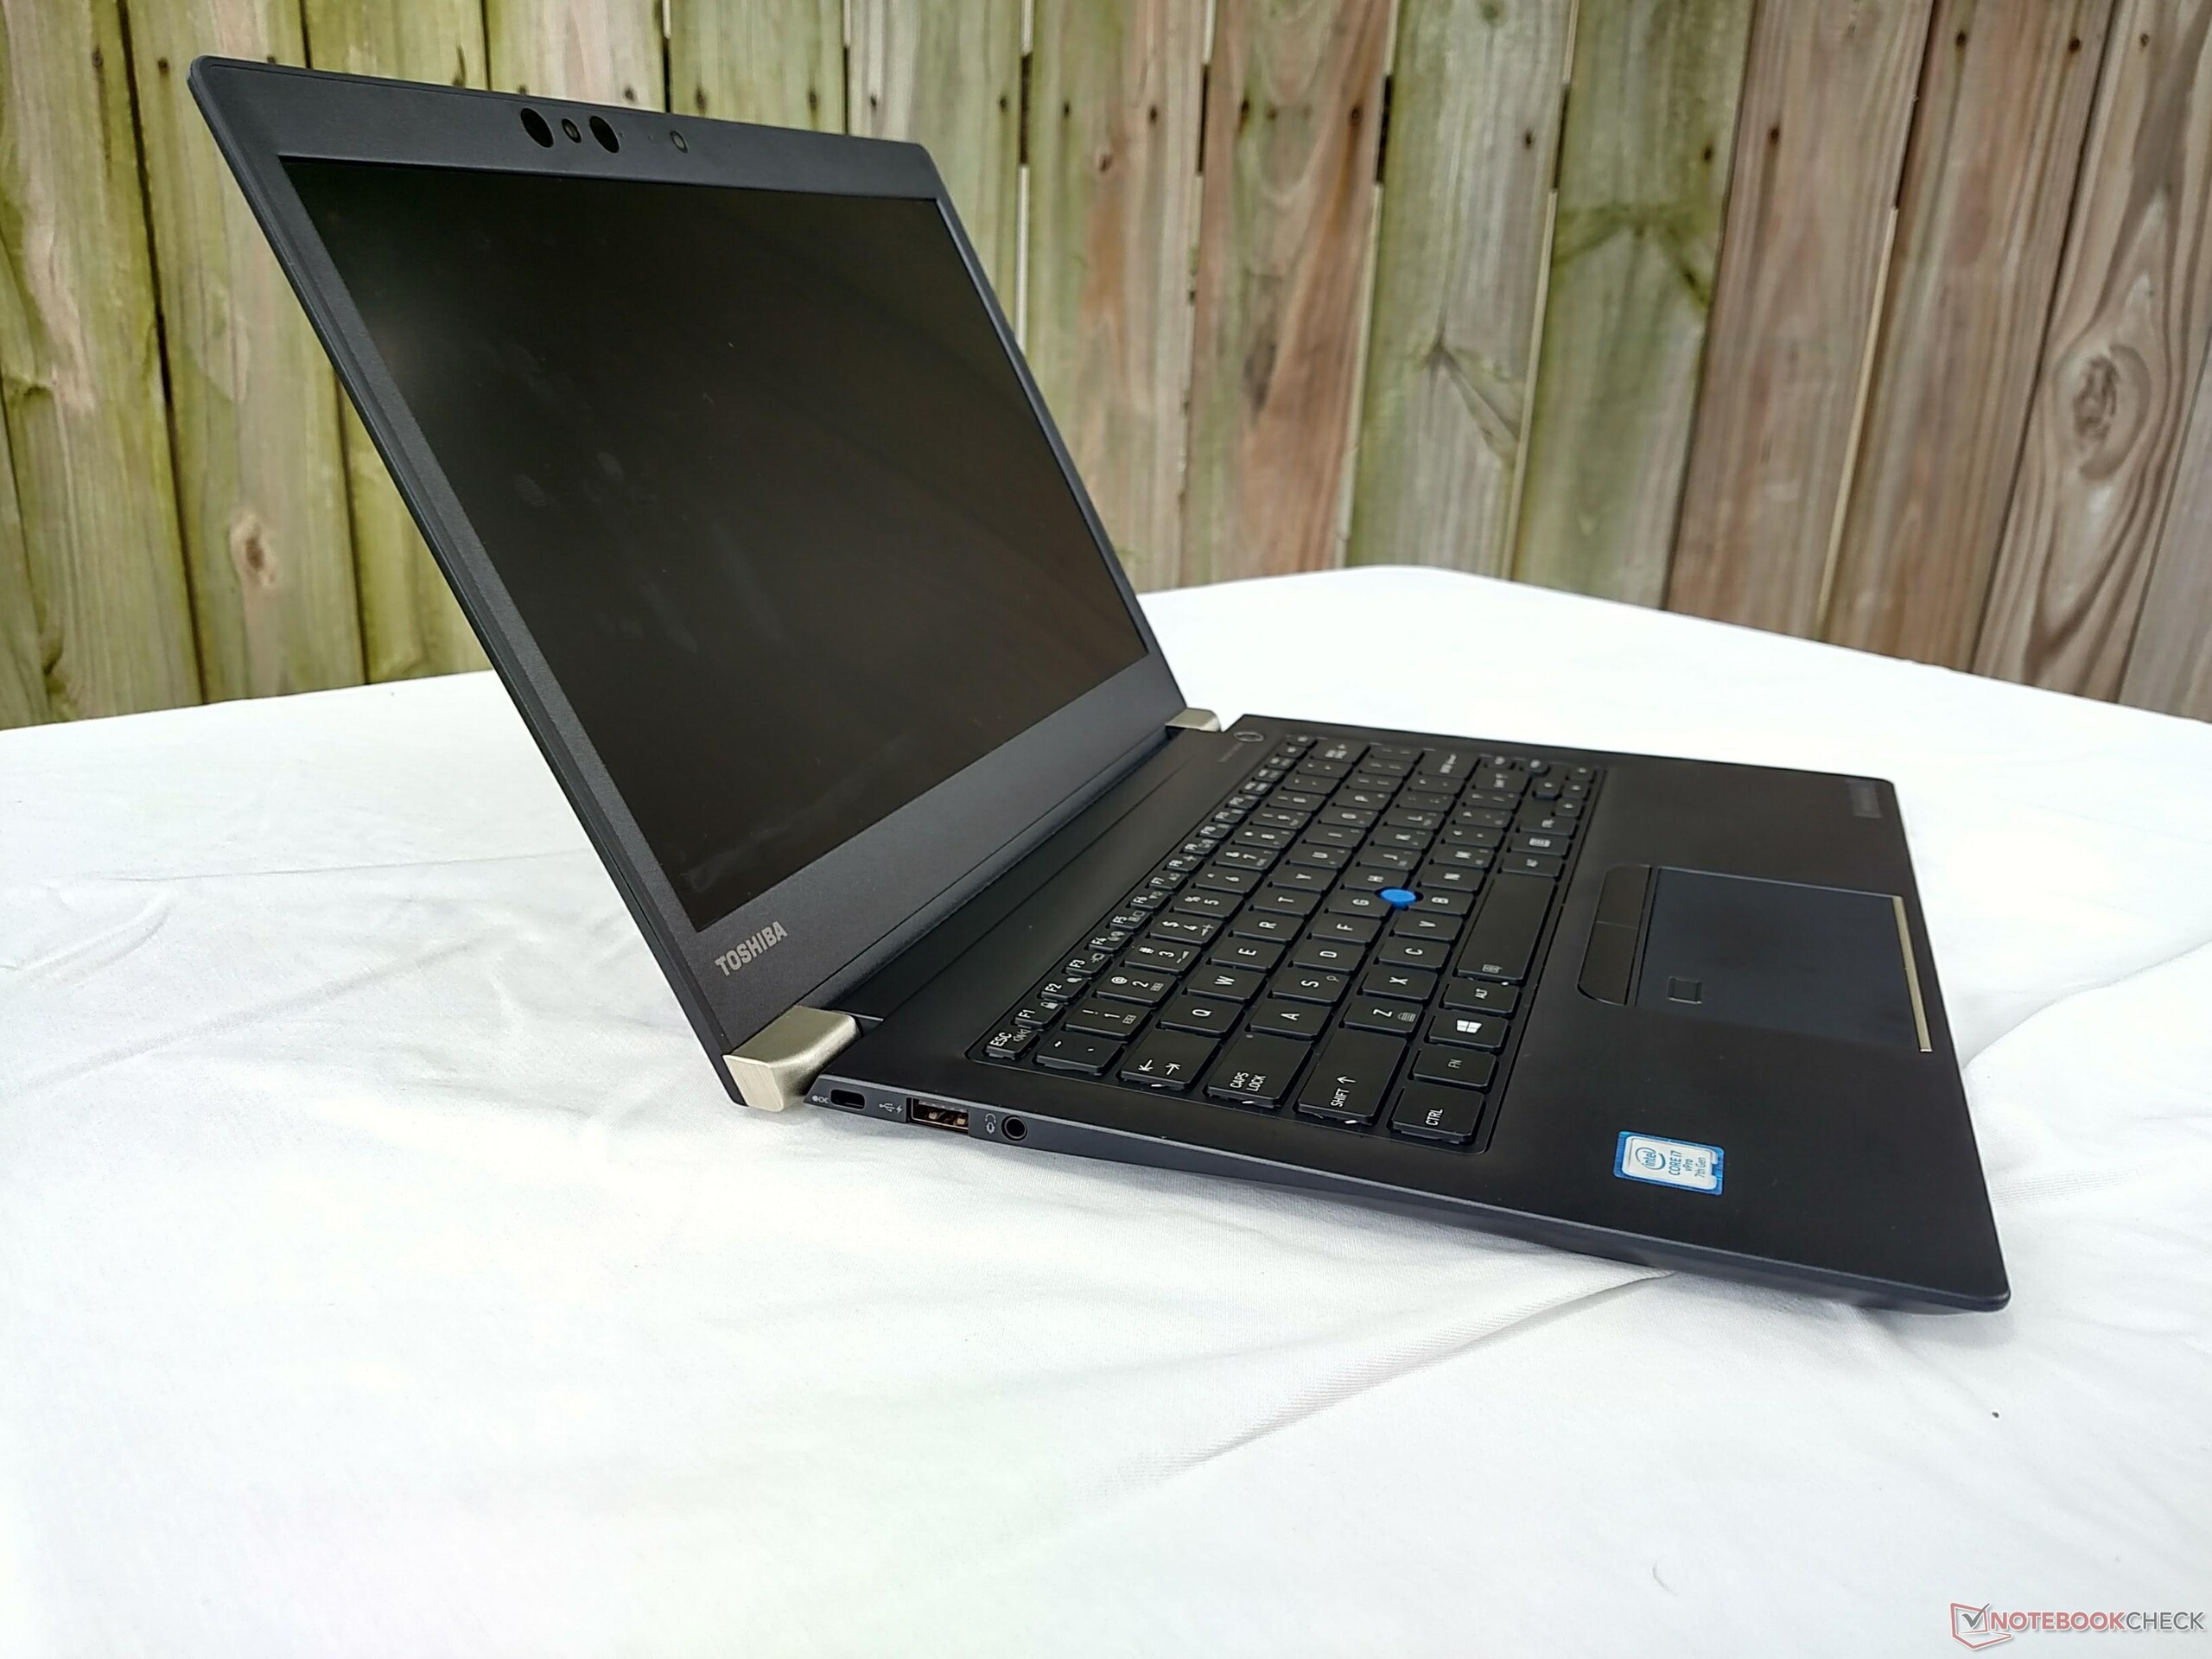
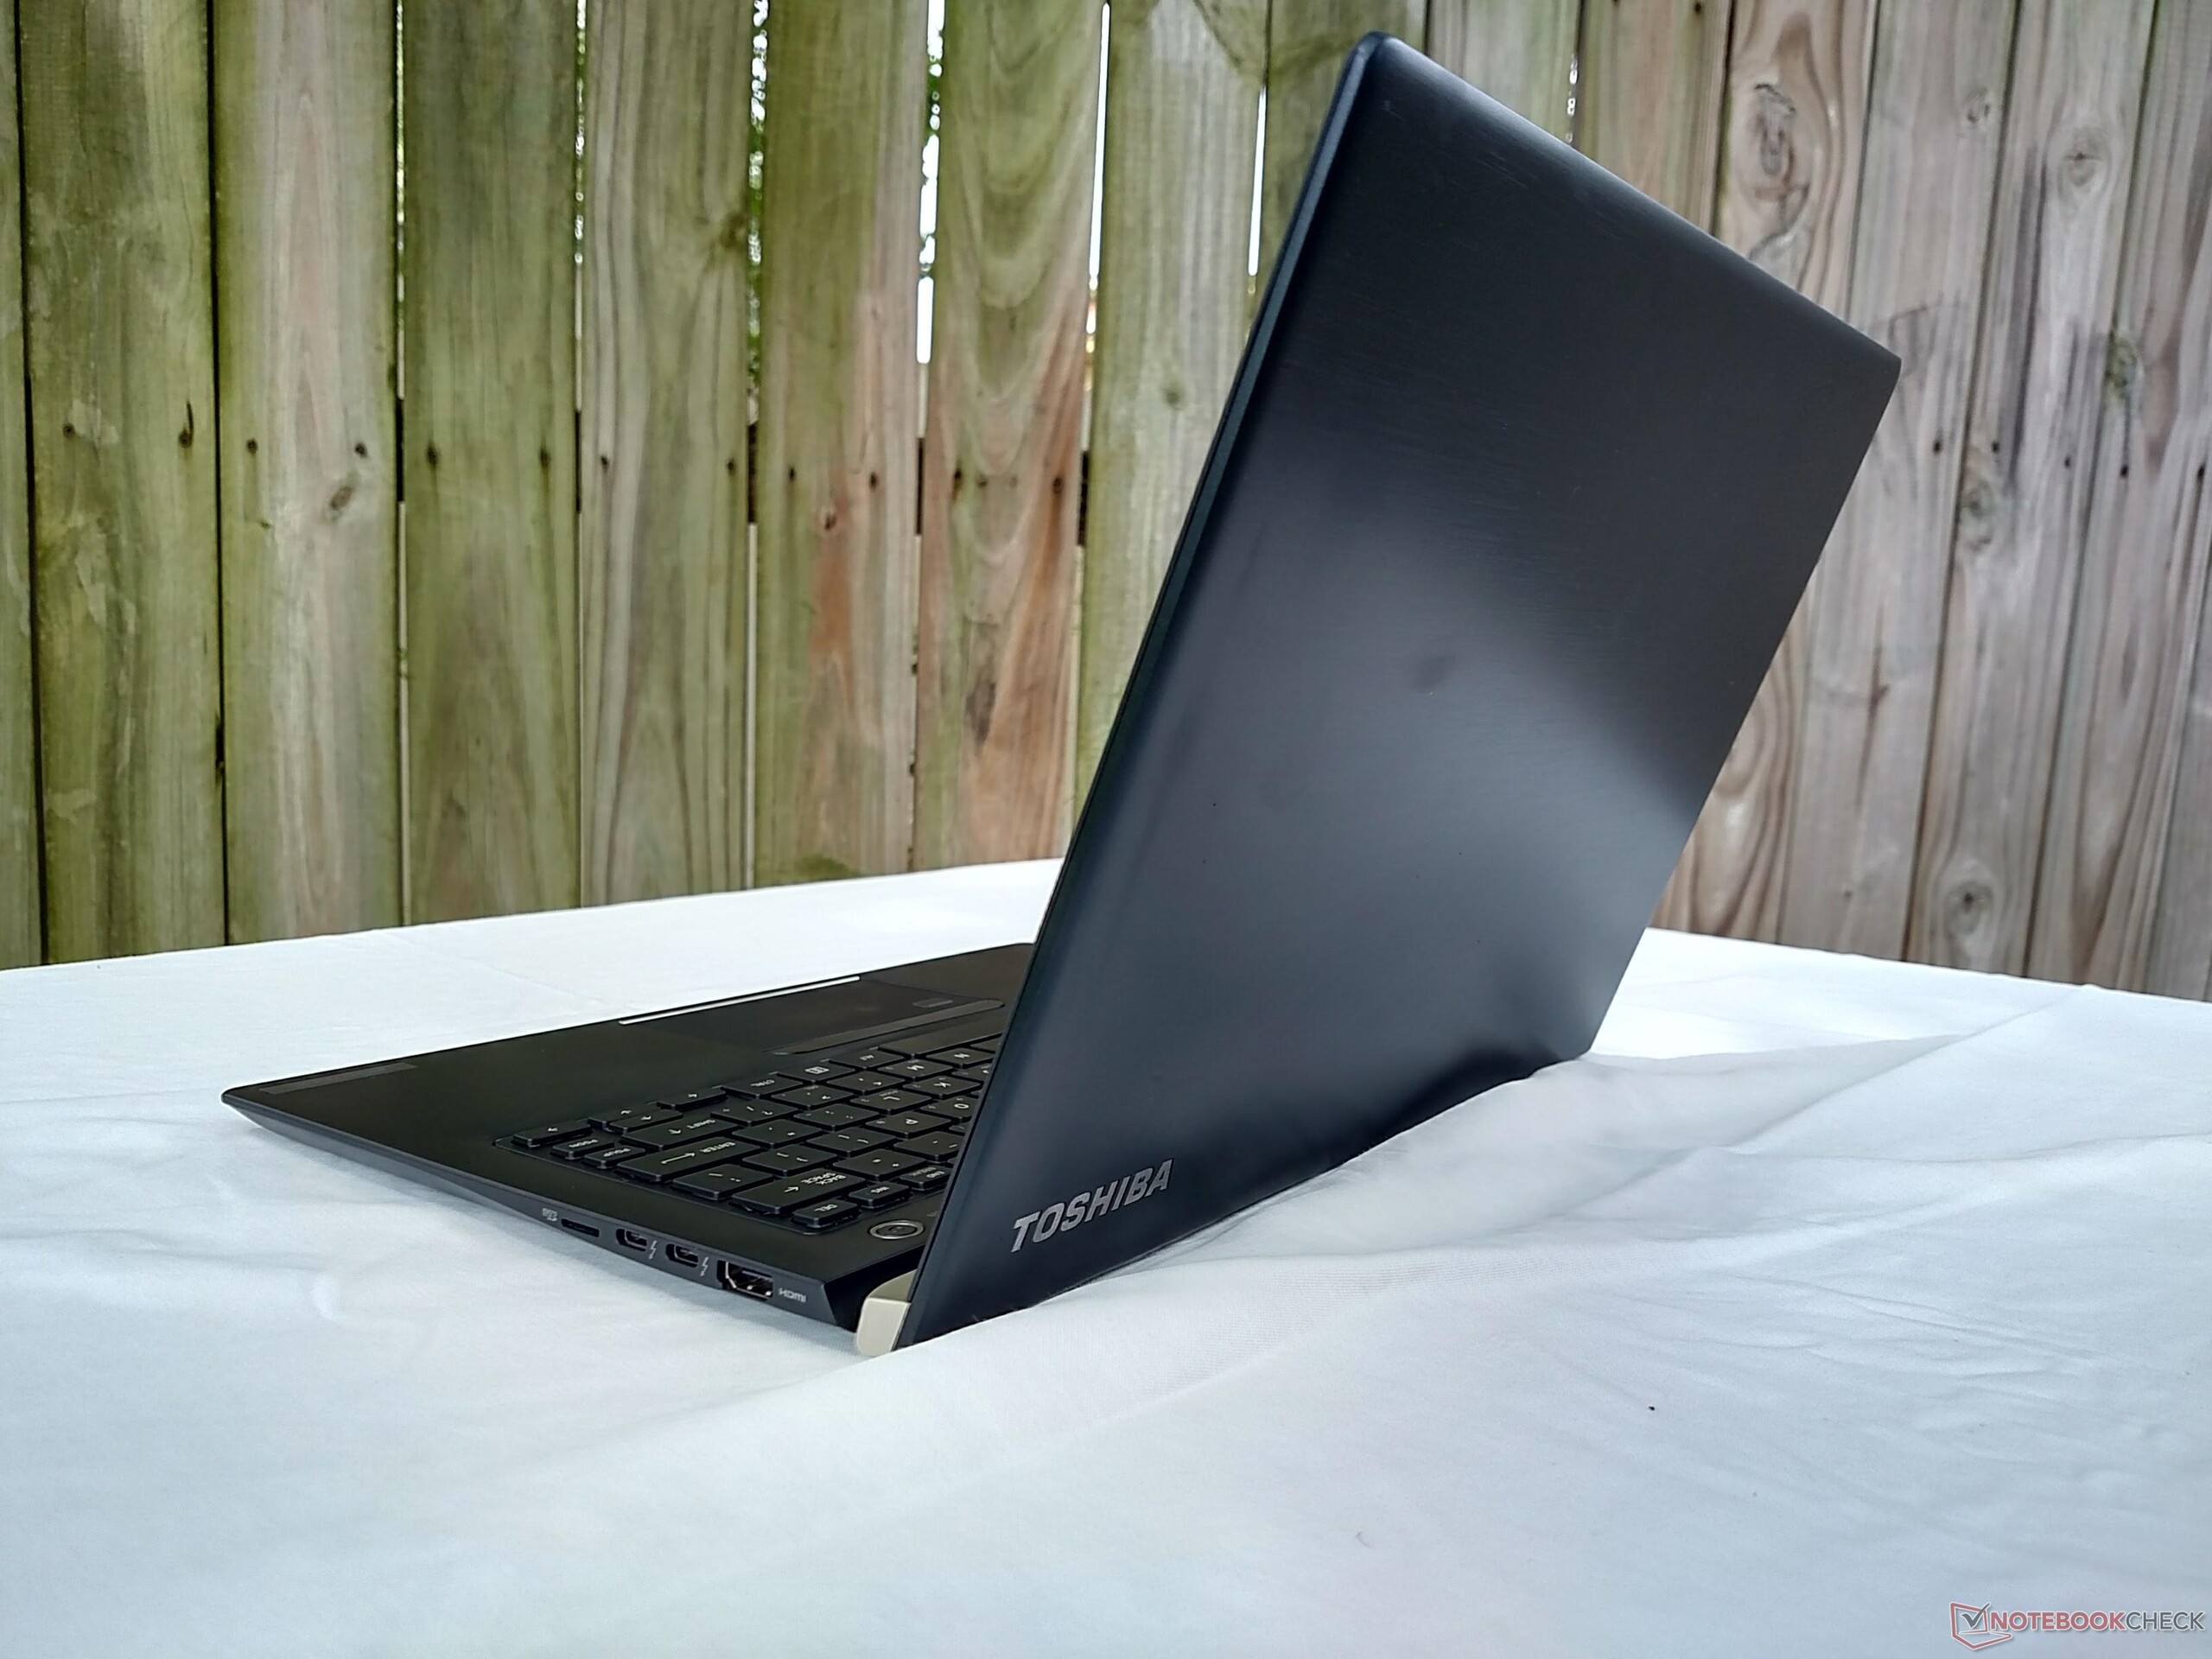
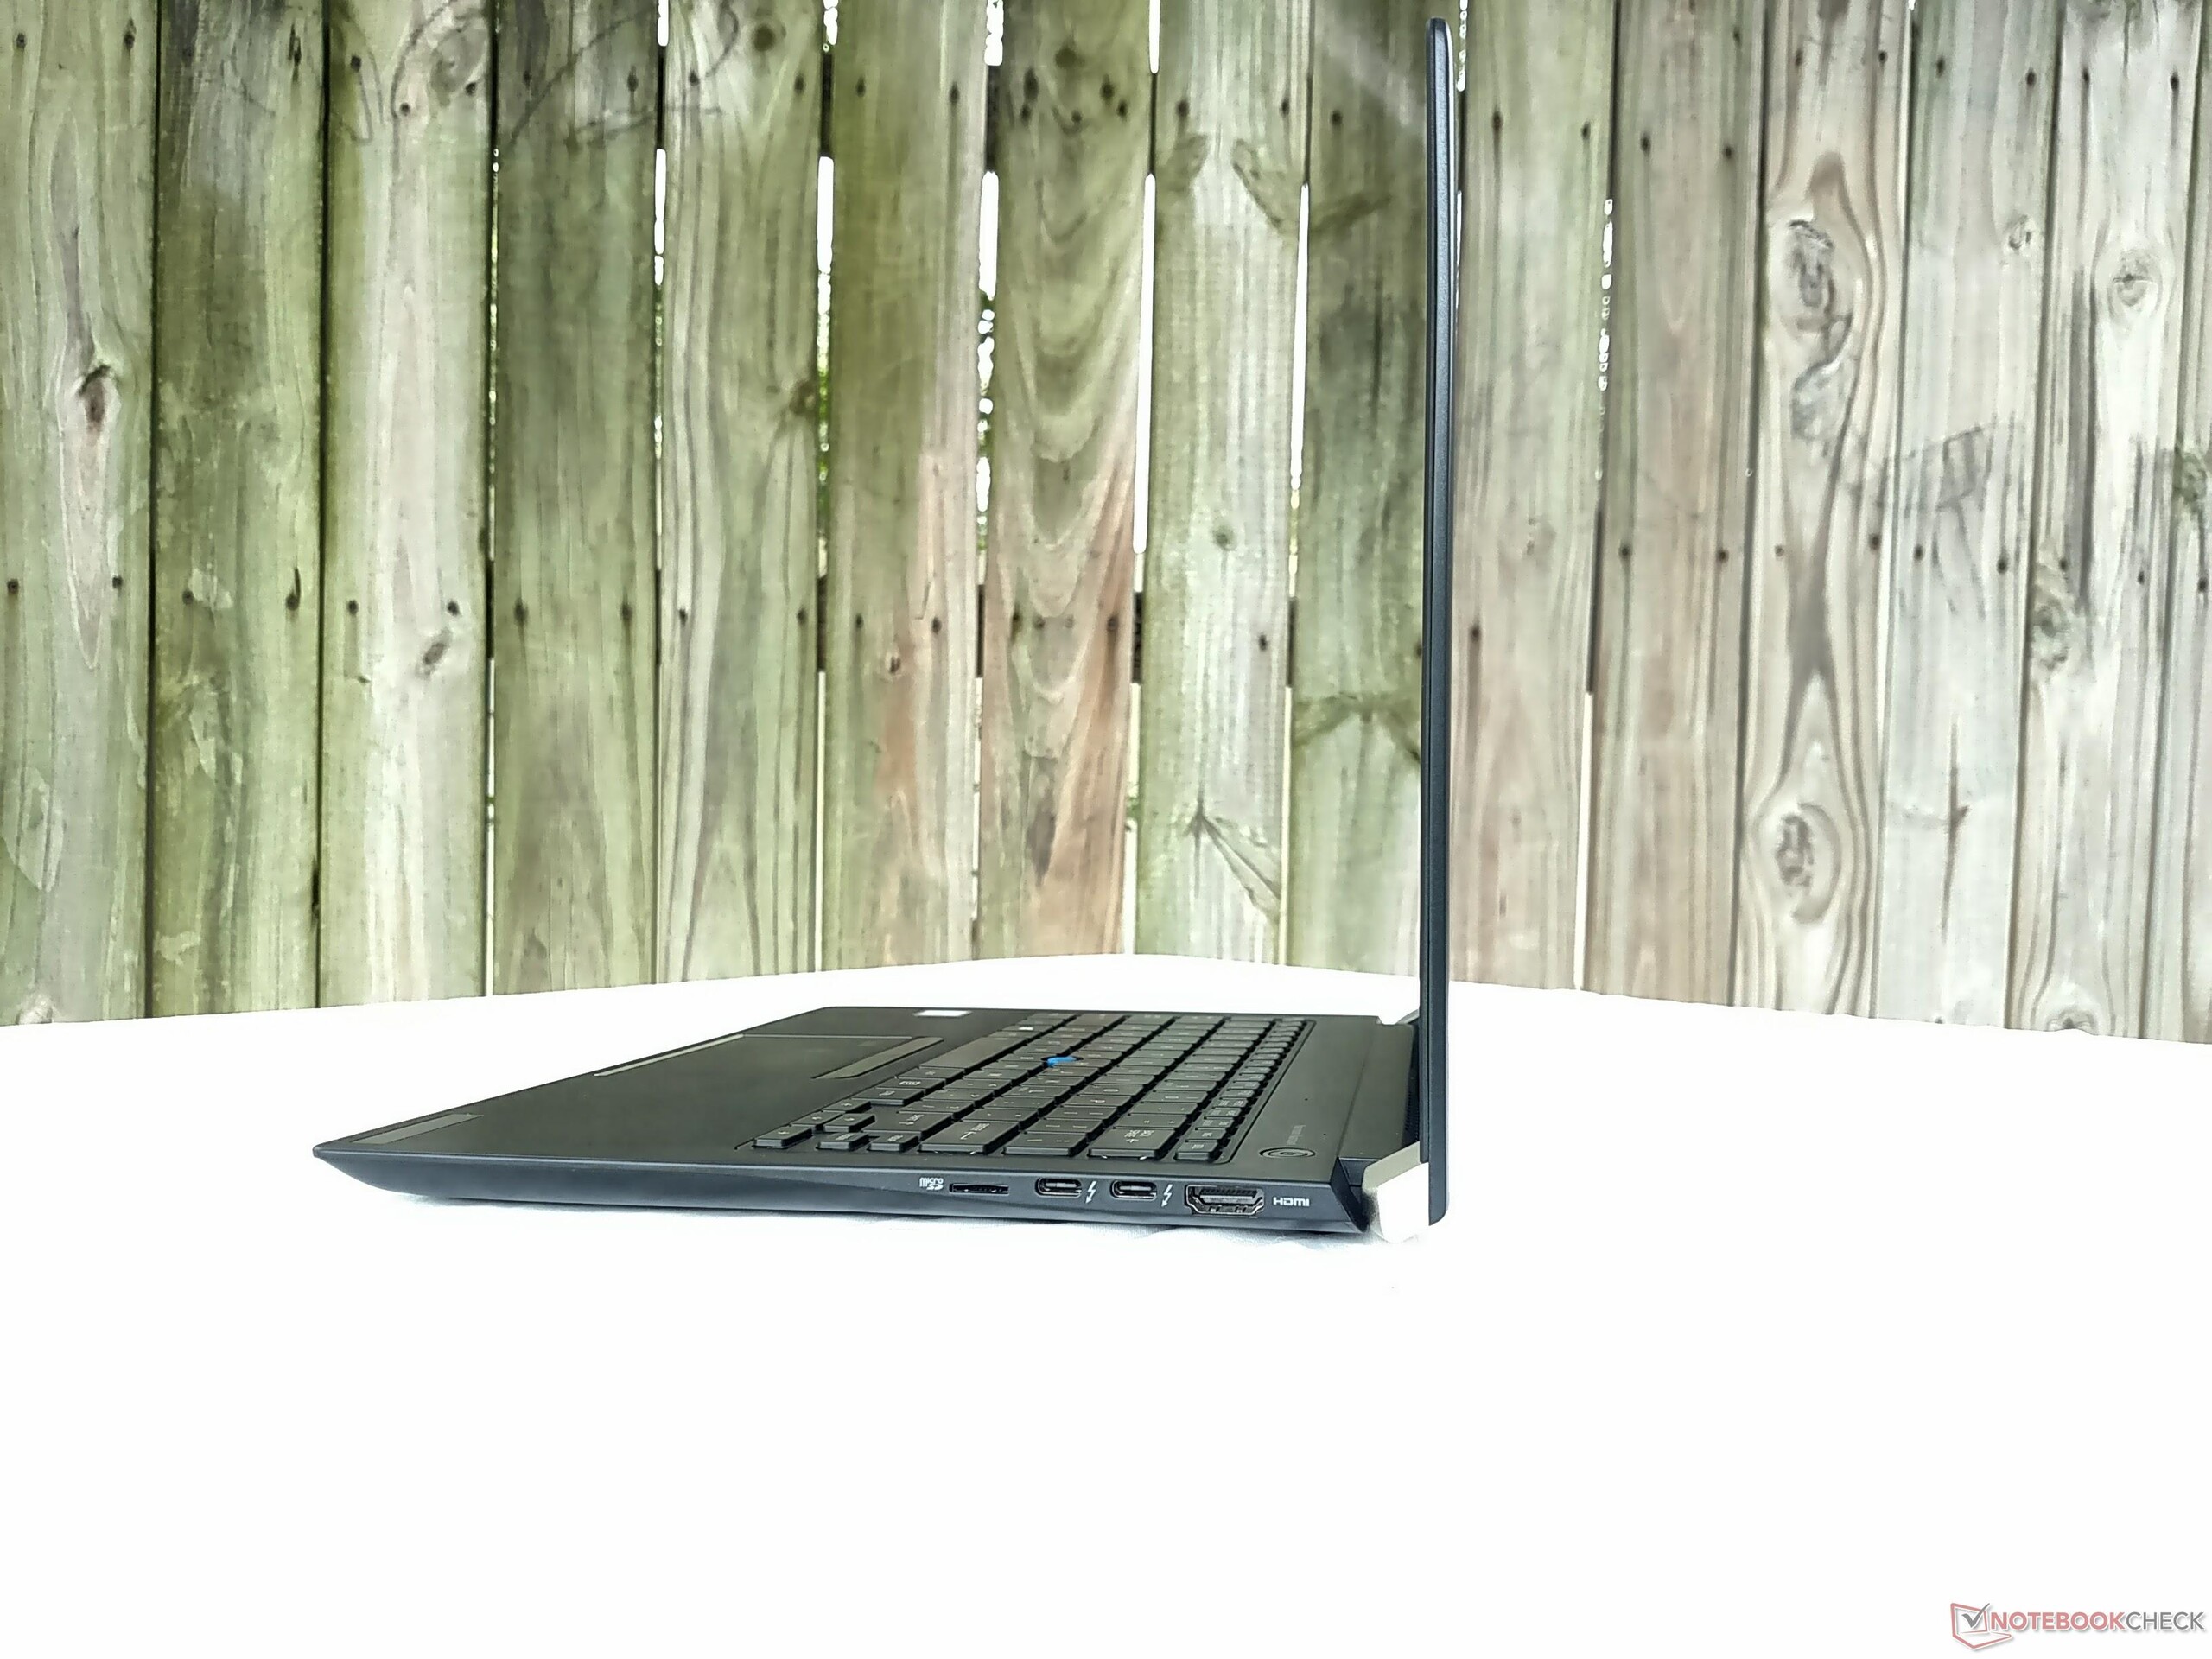
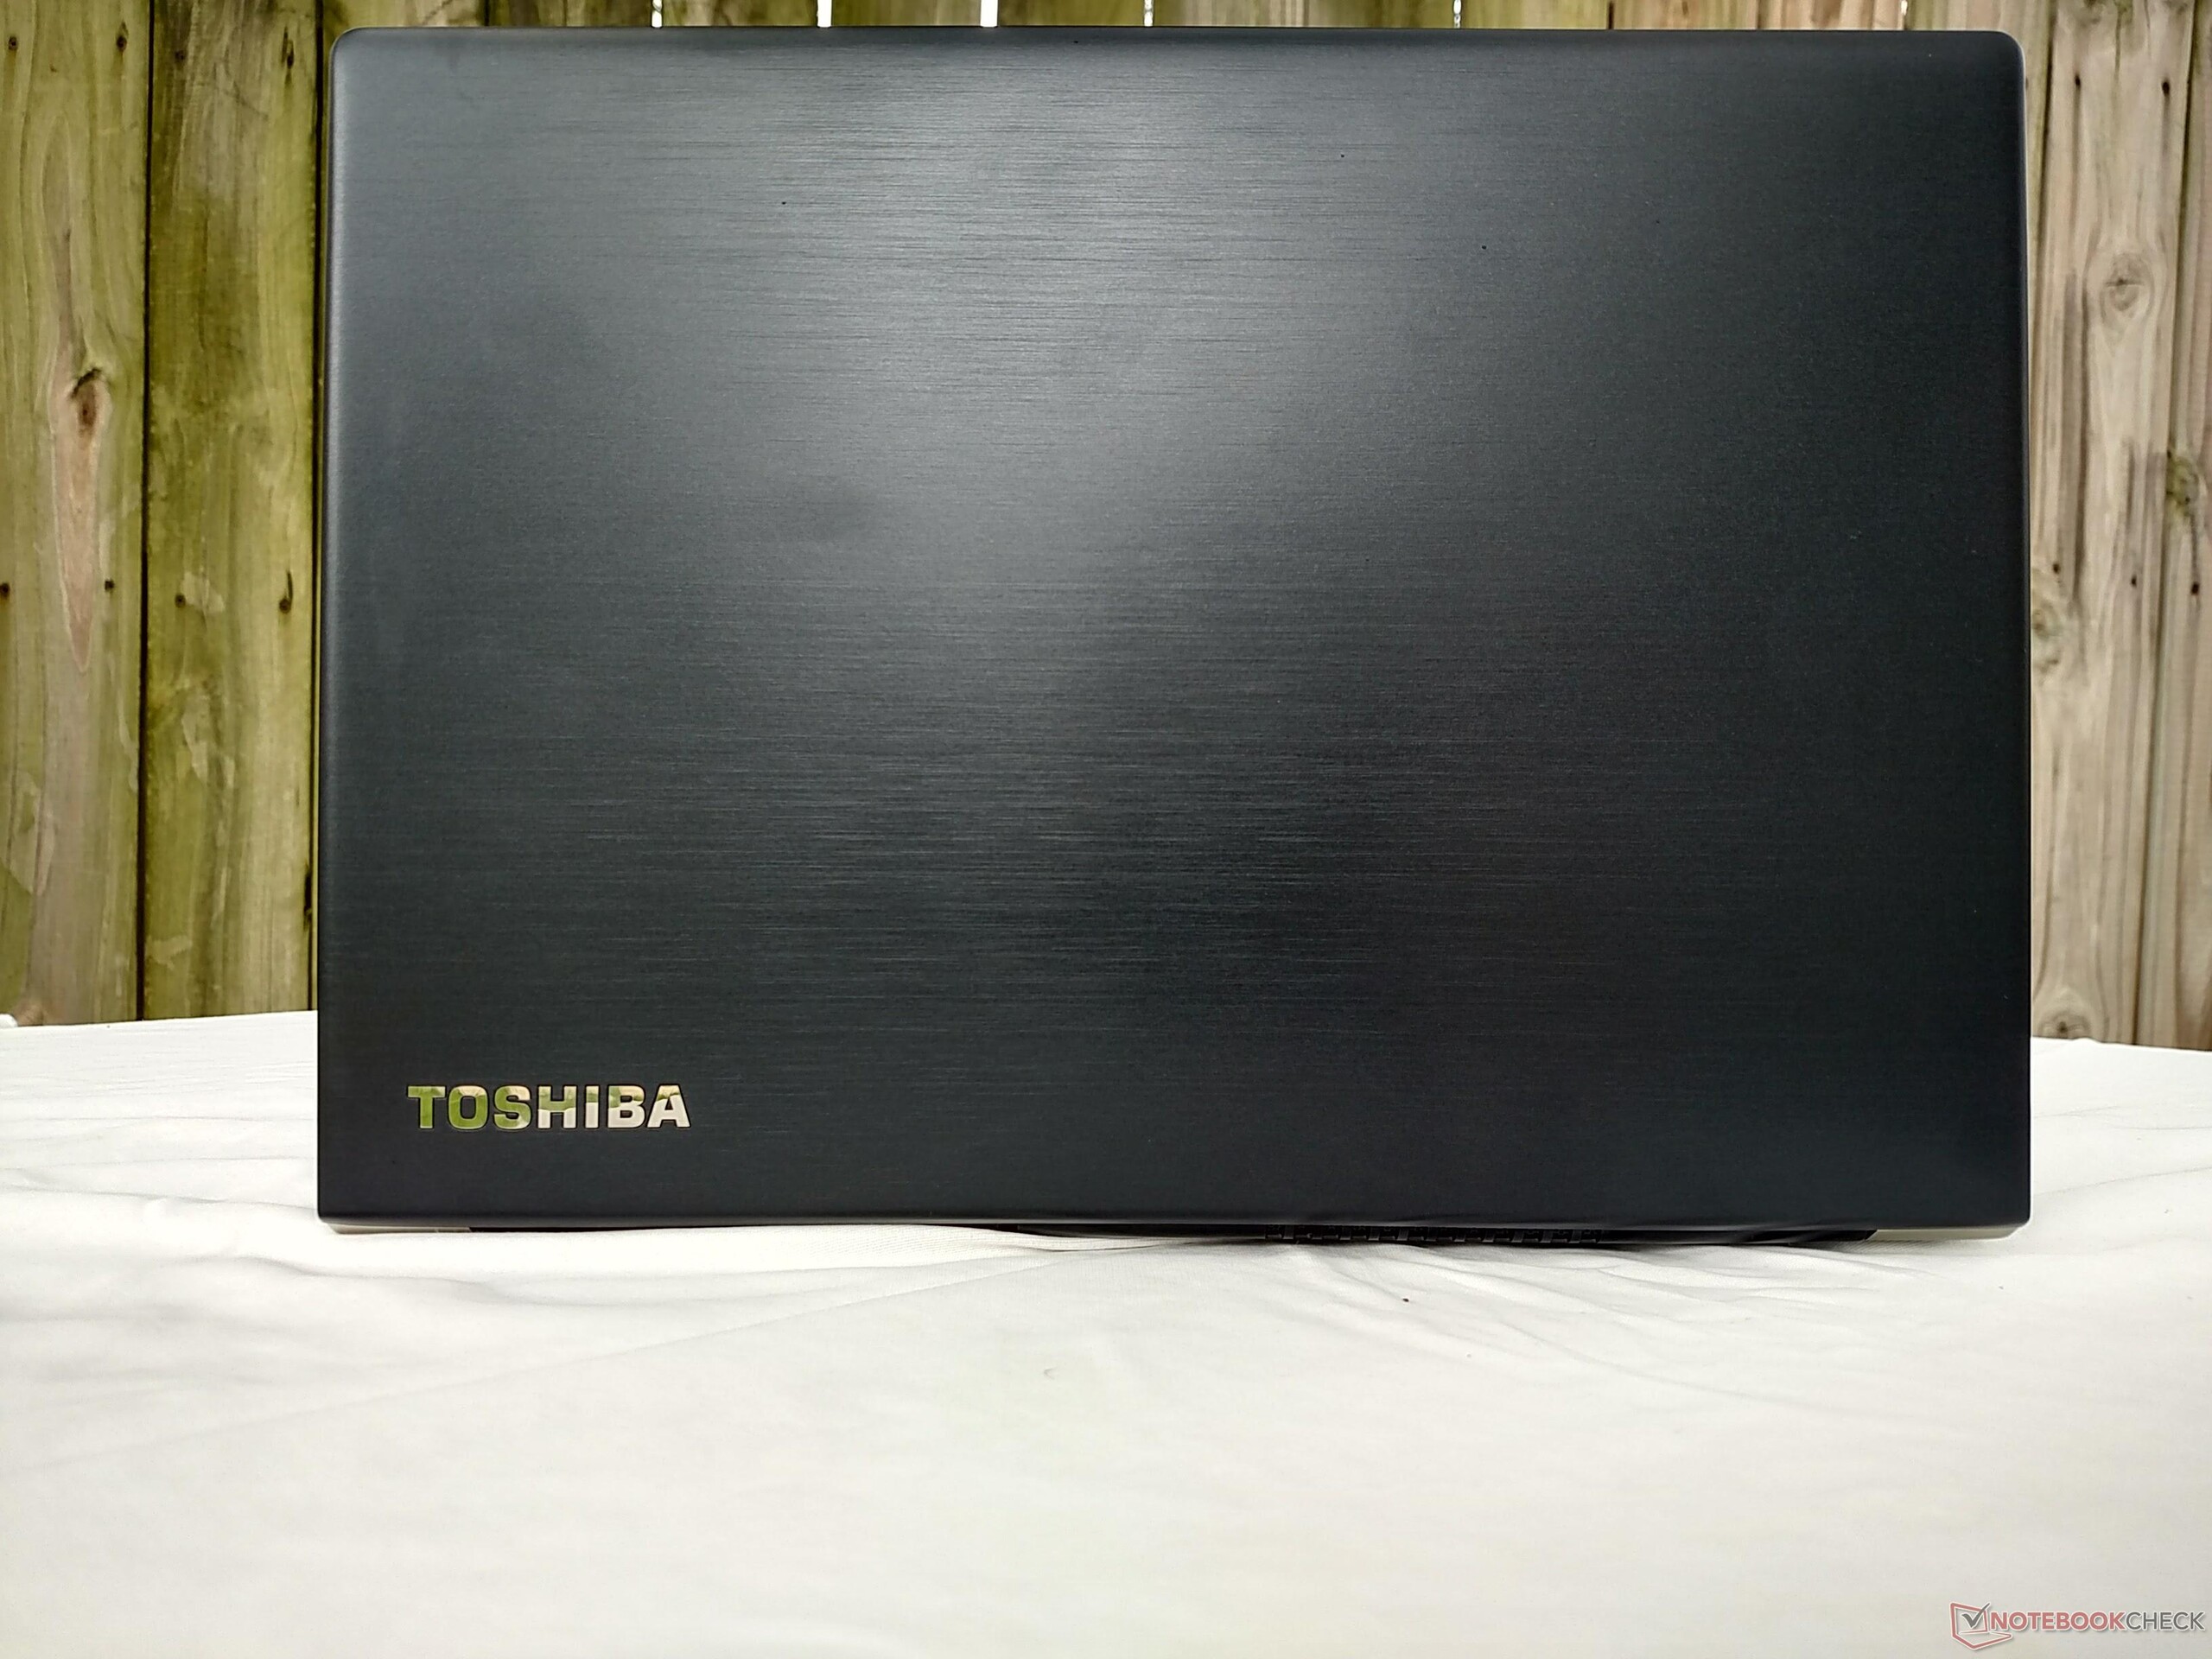
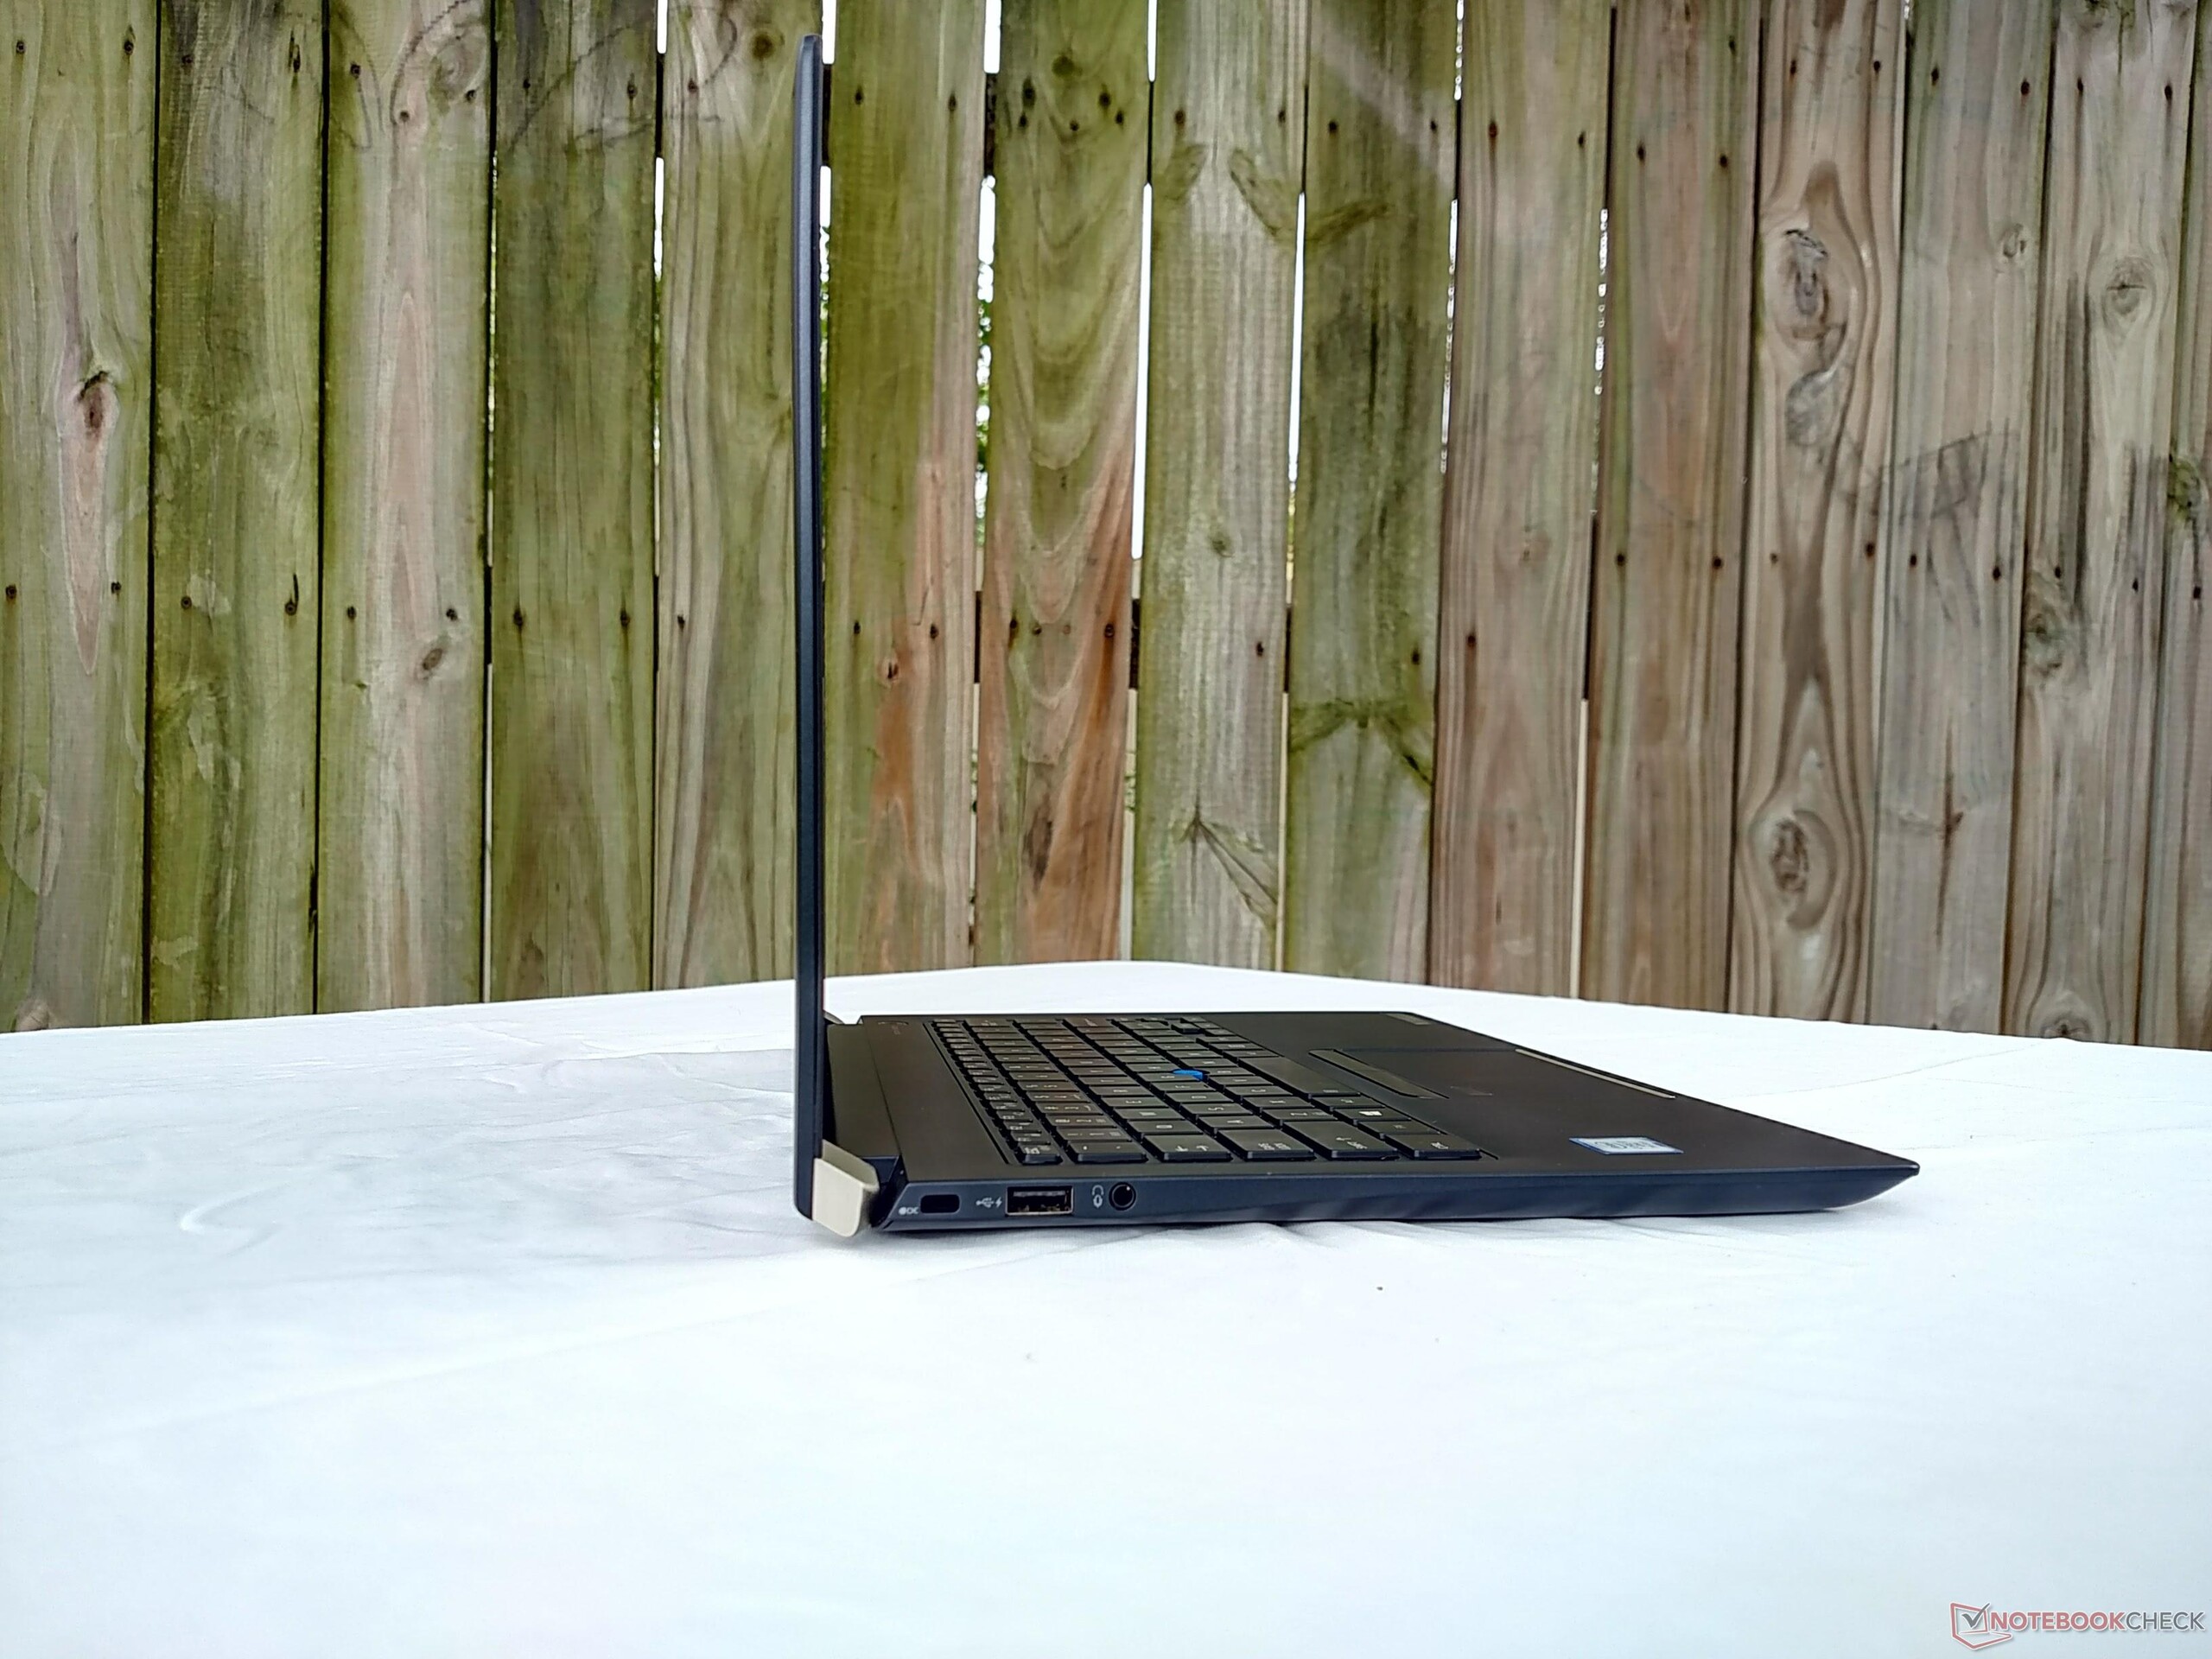
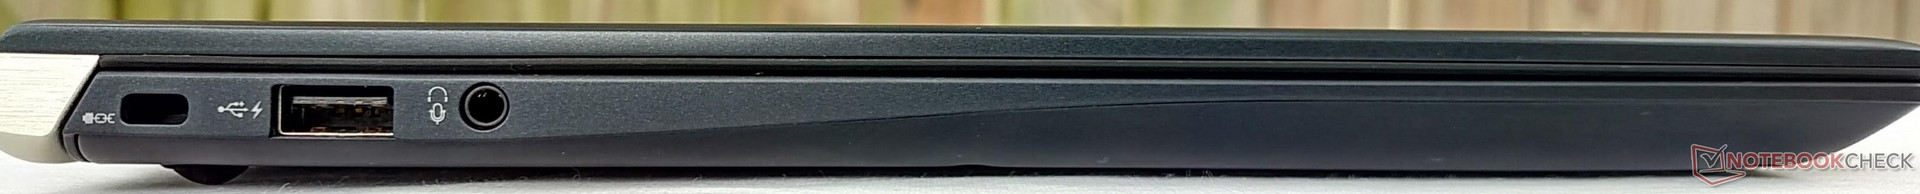
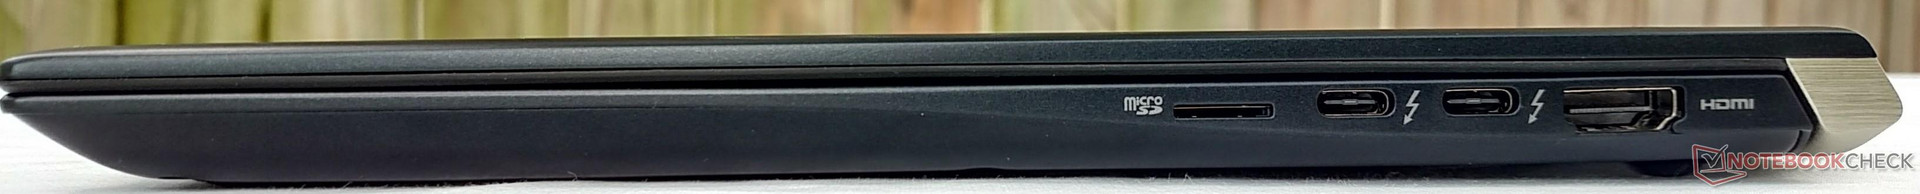
东芝的这台机器很有竞争力。Portégé X30 有着让人印象深刻的工艺水平;将一切整合到了这样一个轻薄机身中,值得赞赏。两个雷电3接口,有助于减轻轻薄笔记本接口较少的问题。除此之外,它还提供了许多其他的有用接口。当然,我们更喜欢 X1 Carbon 所提供的接口,它们的造价更高,重量和占地稍微大点。而X1 上更为强大的键盘和维护方式,也使得用户在东芝和联想之间的选择变得更为困难。
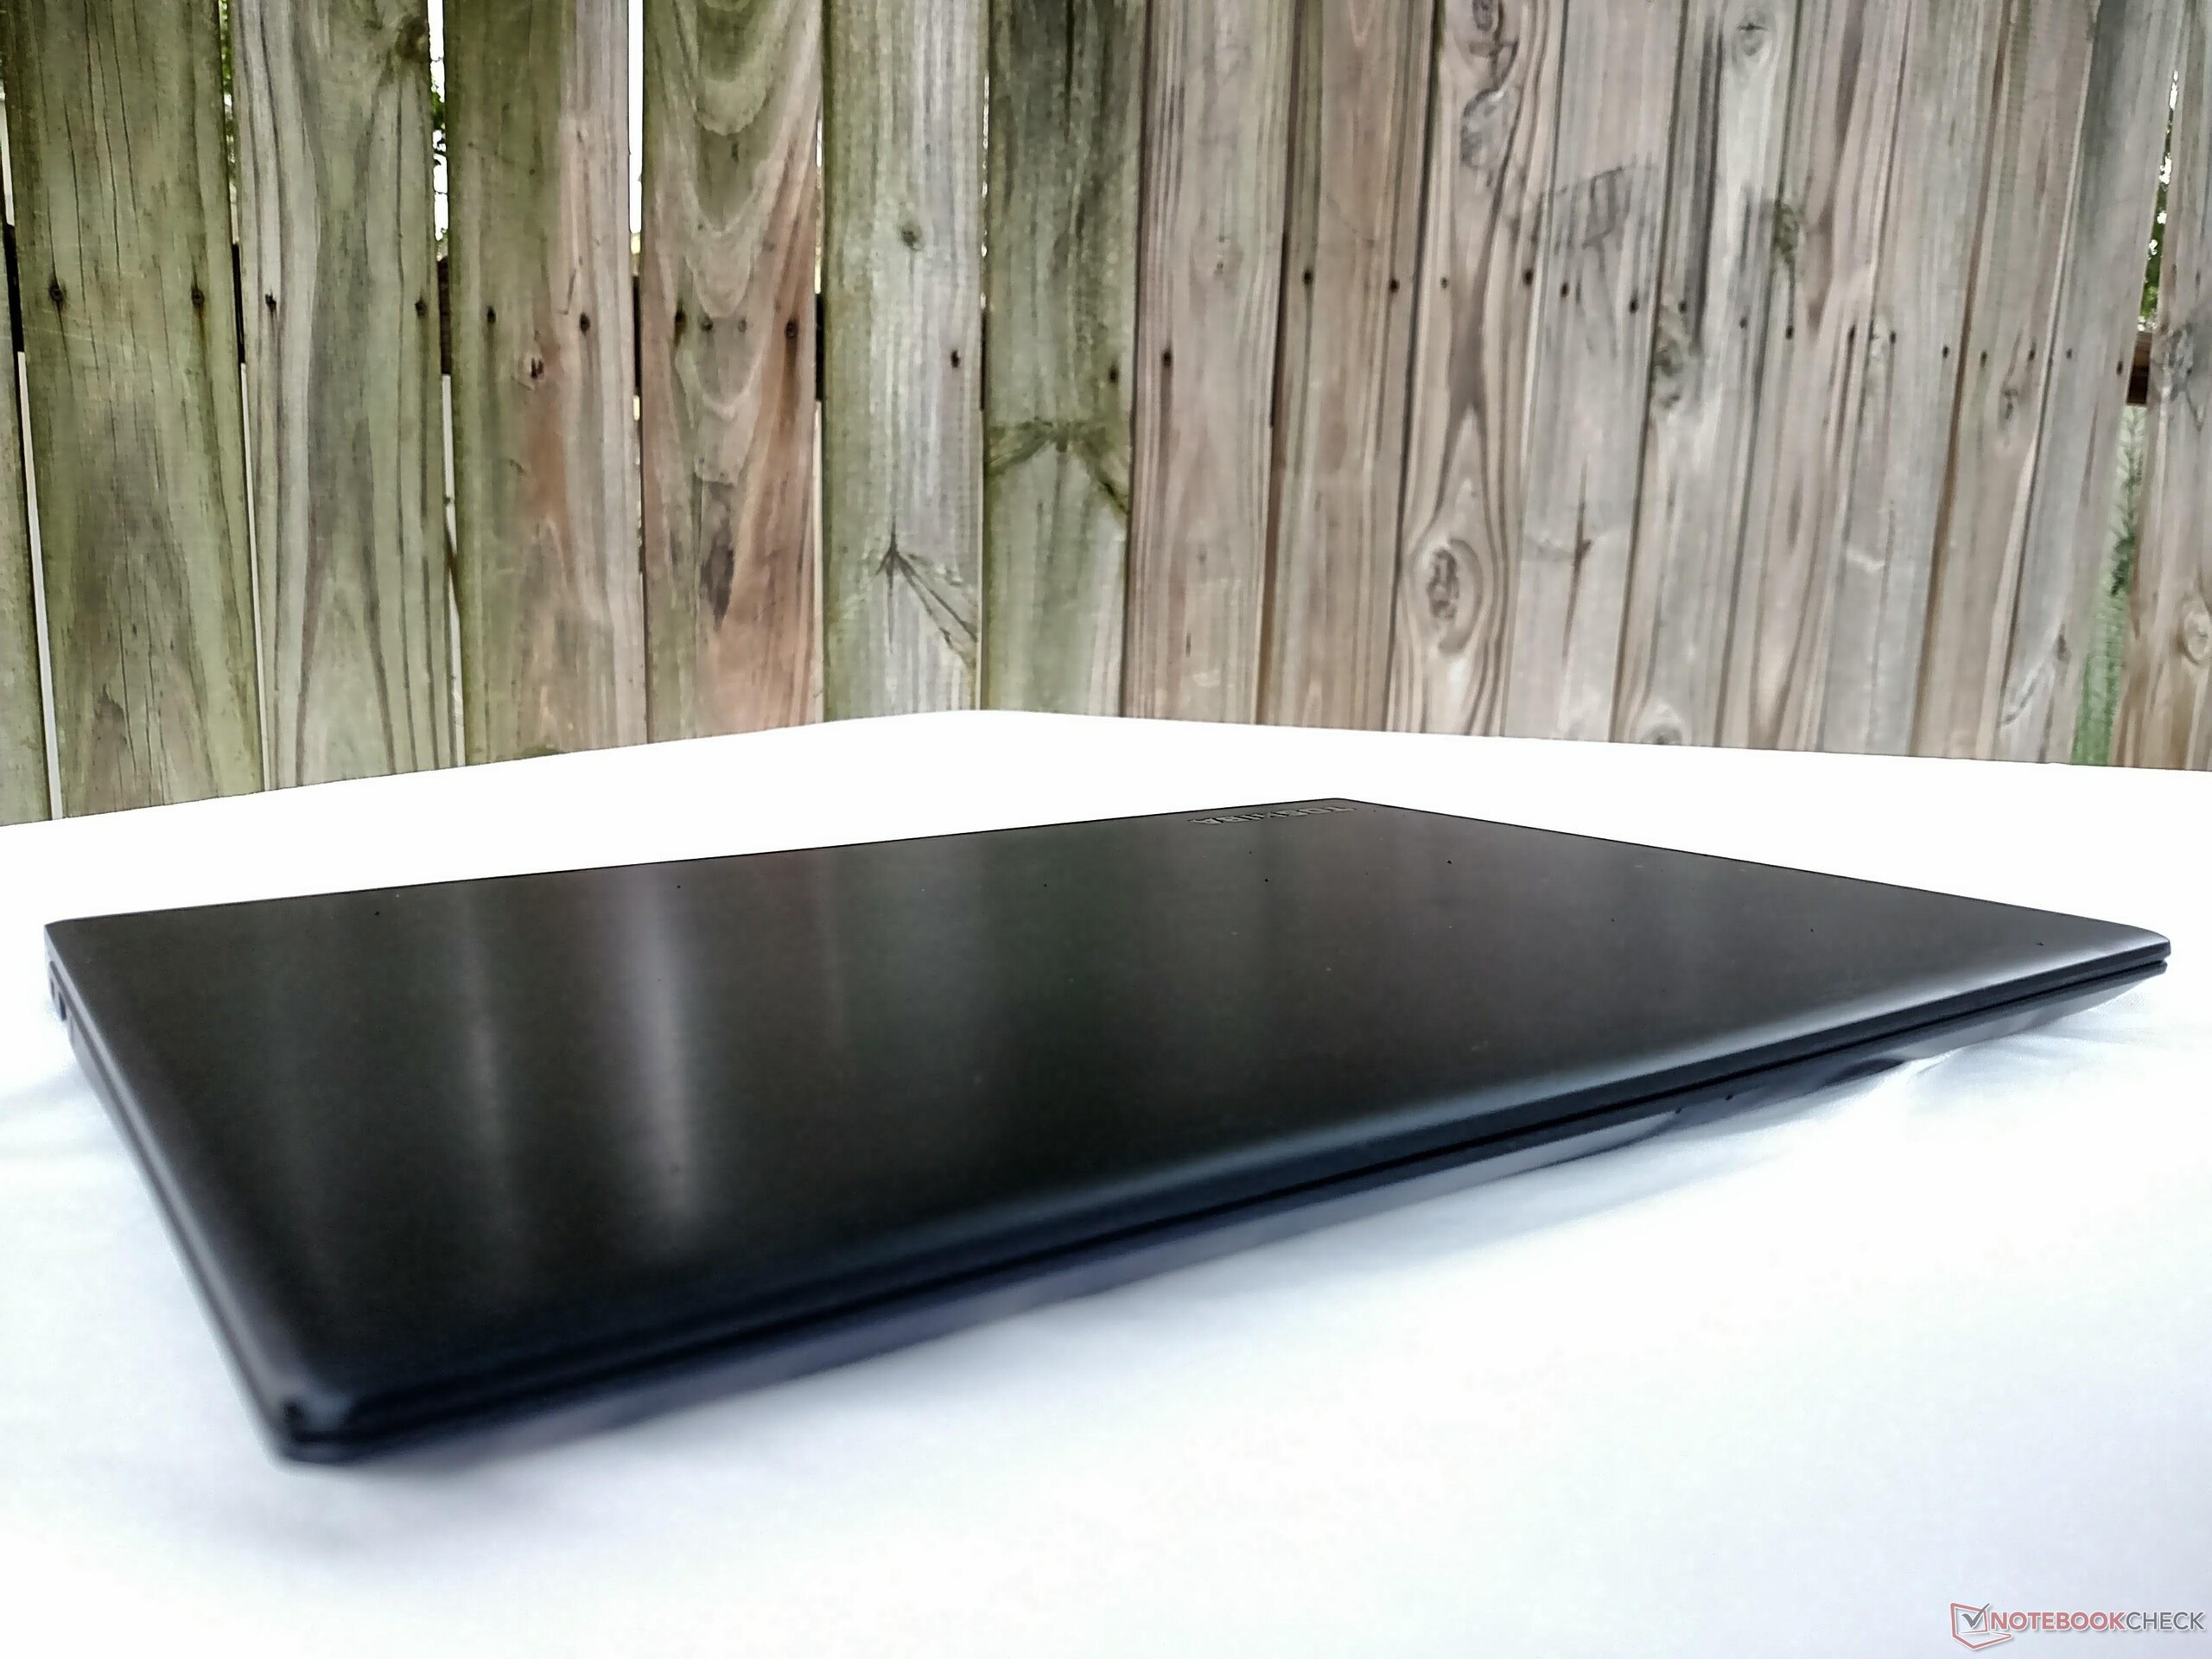
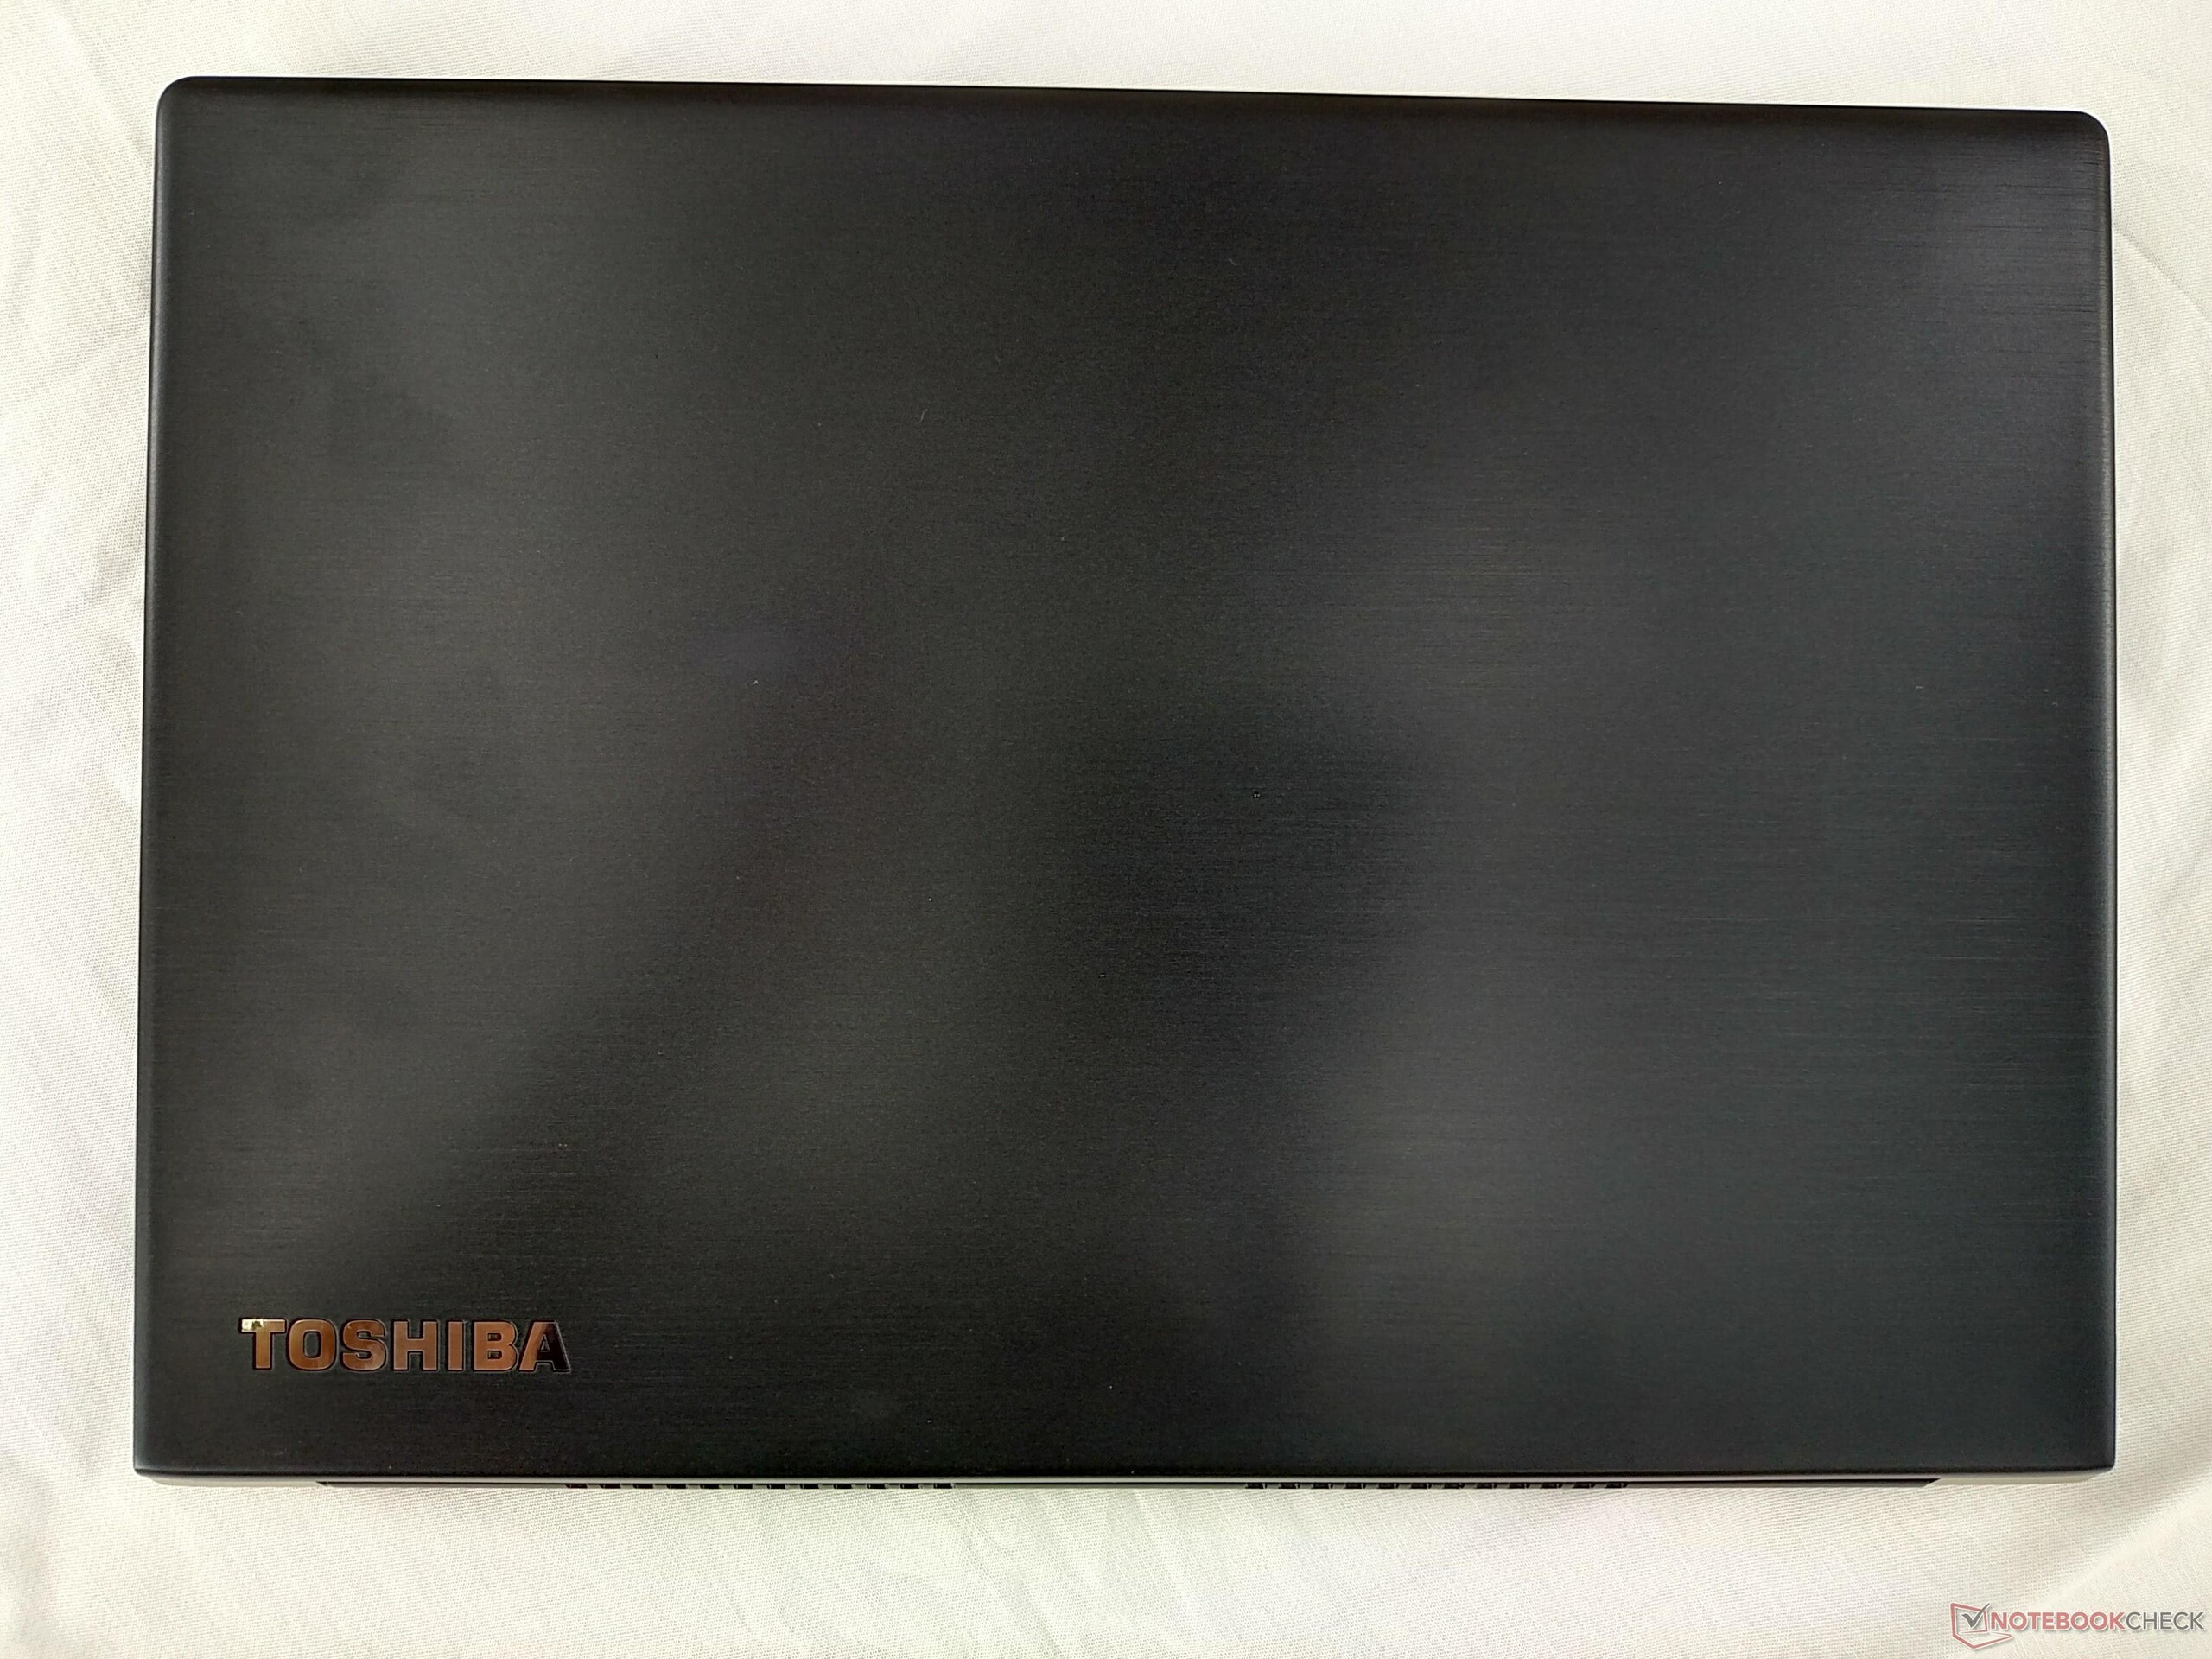
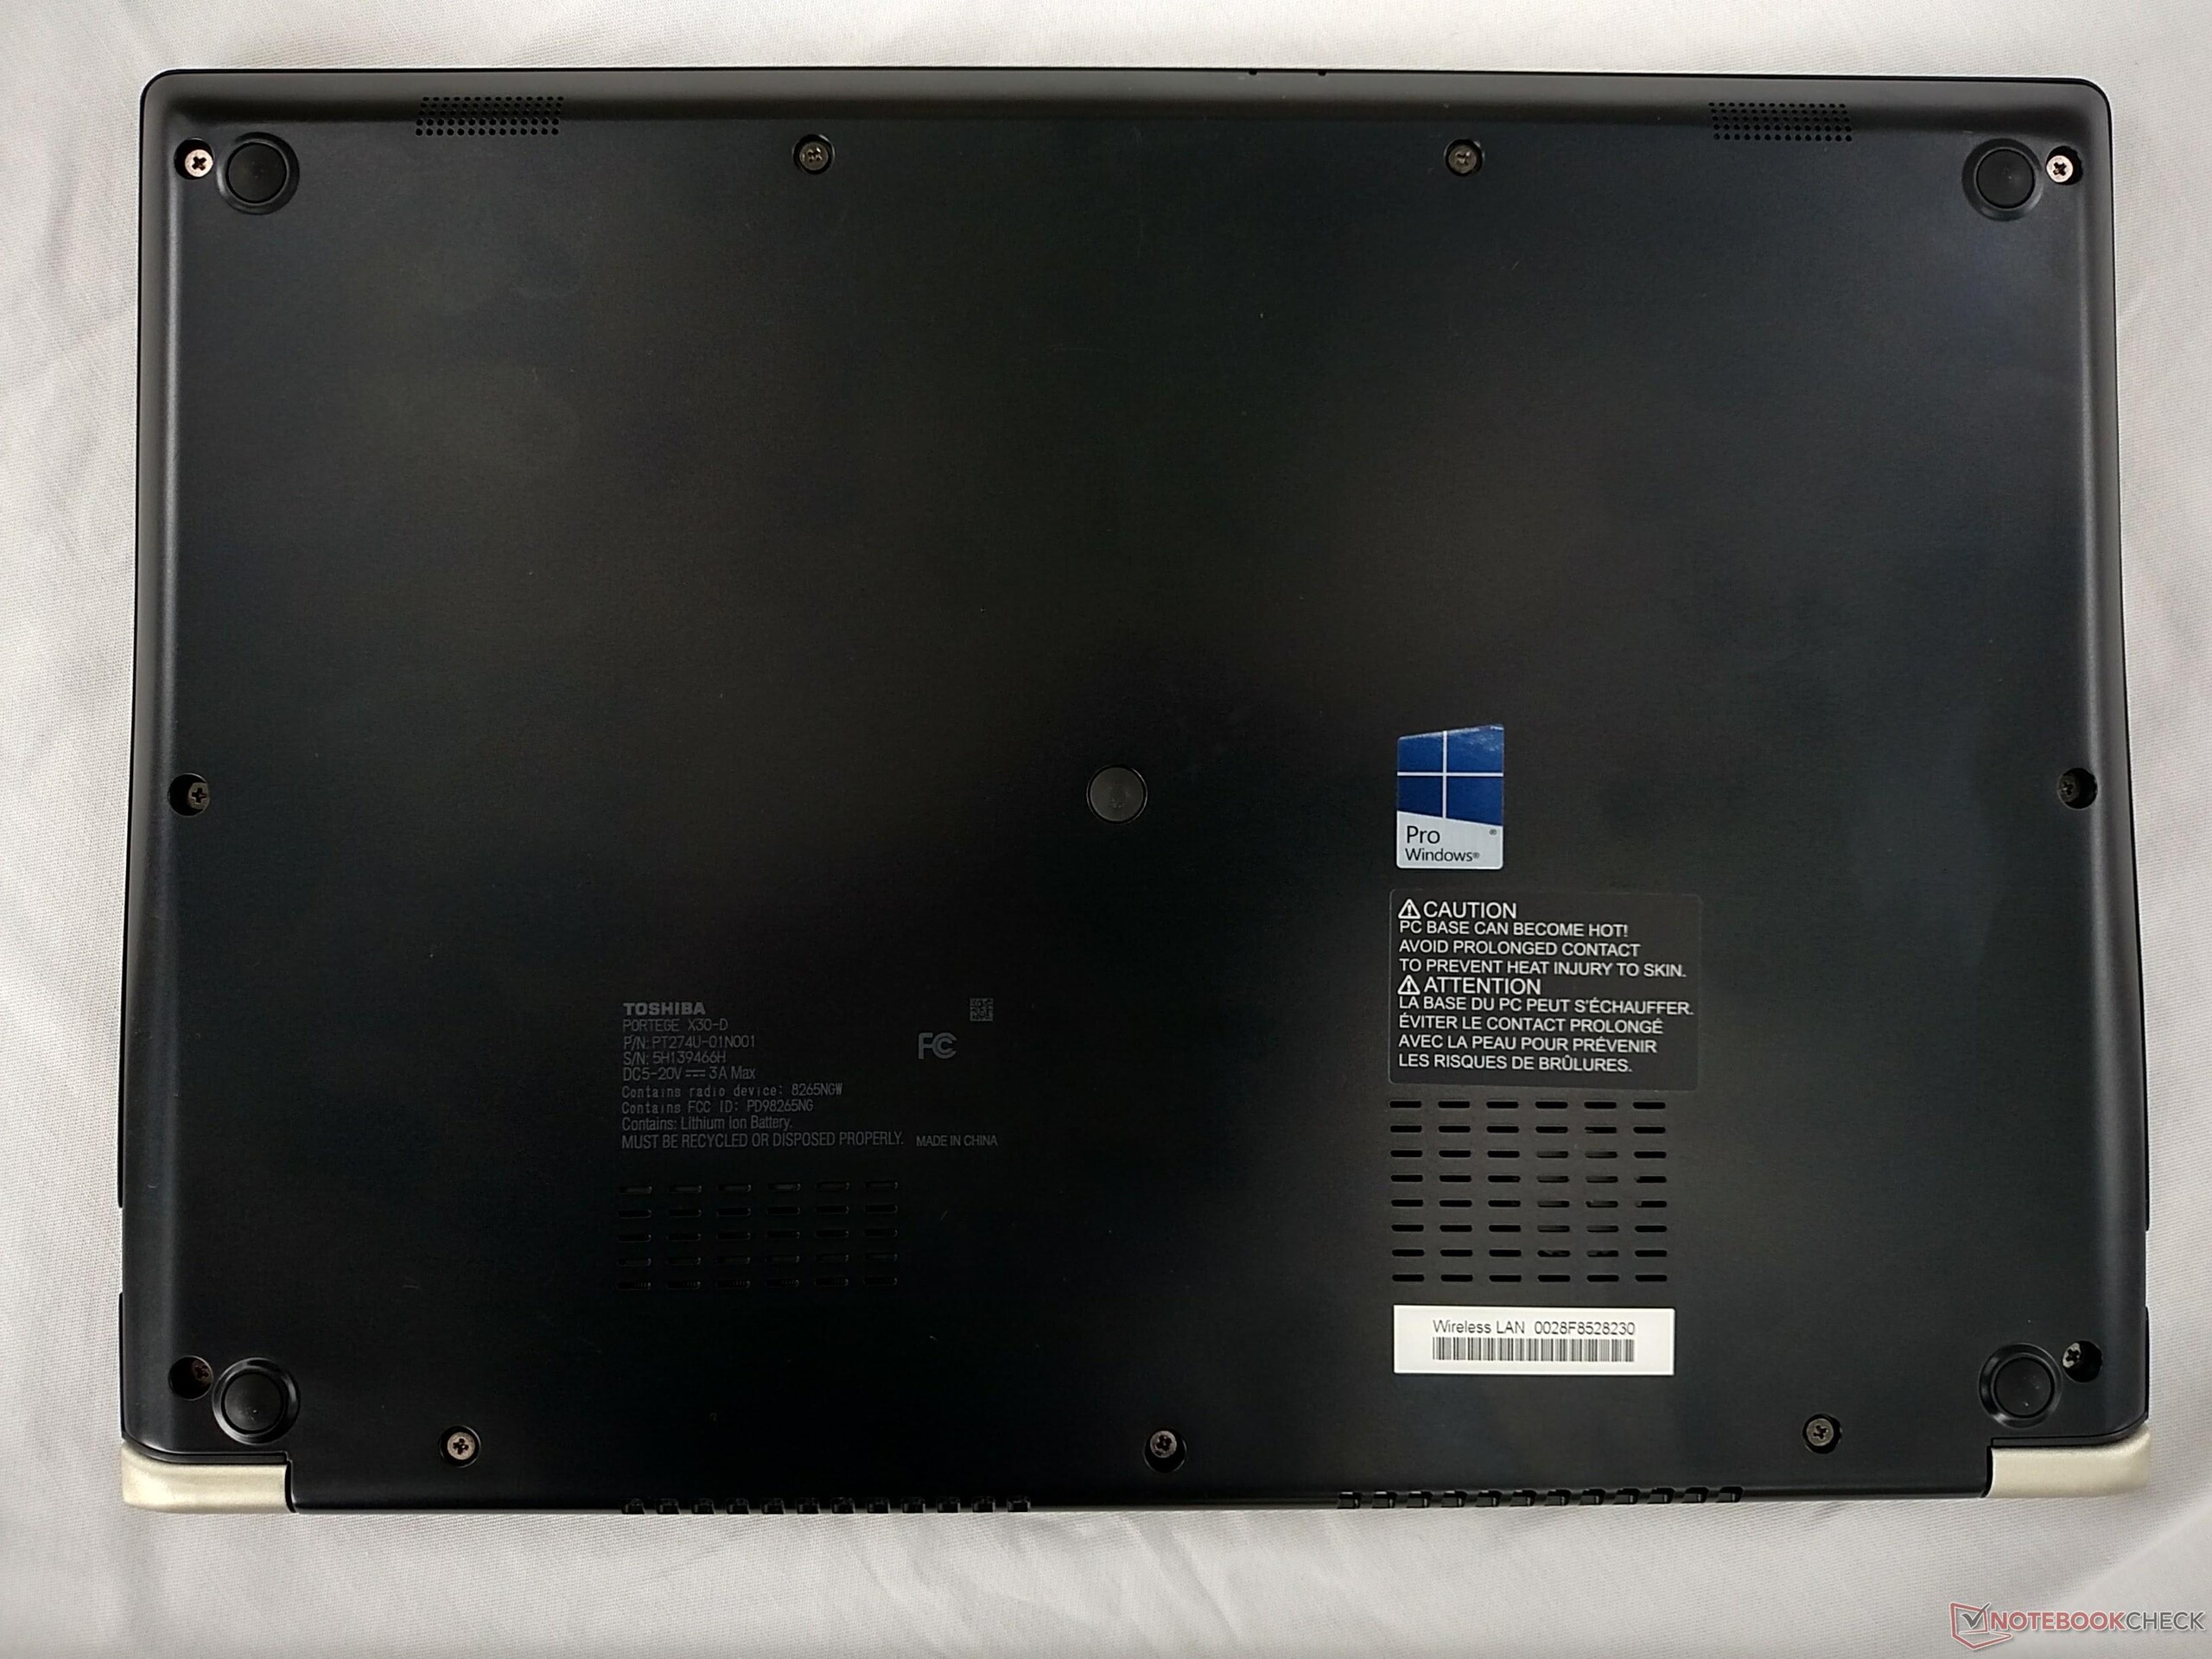
该机重量轻,而且外壳坚固。键盘面板和底面板几乎不会弯曲,这点再次令人印象深刻。但是,如果施加压力,则A面容易弯曲; 这可能会在几个月或几年的使用后成为问题。此外的缺点,包括平庸的键盘,按键让人失望的布局方式,以及设备本身容易沾染指纹的特性。我们主要关注在于处理器性能:酷睿 i7-7600U在字面上看起来好像很棒。但却可能因为节流(为了保持温度),使得处理器性能下降。虽然我们无法确任原因,但会一定程度上影响整体性能。是的,X30在基准测试中的表现比对手要慢一些,但是在现实世界中,它仍然让人感觉很快,很快。
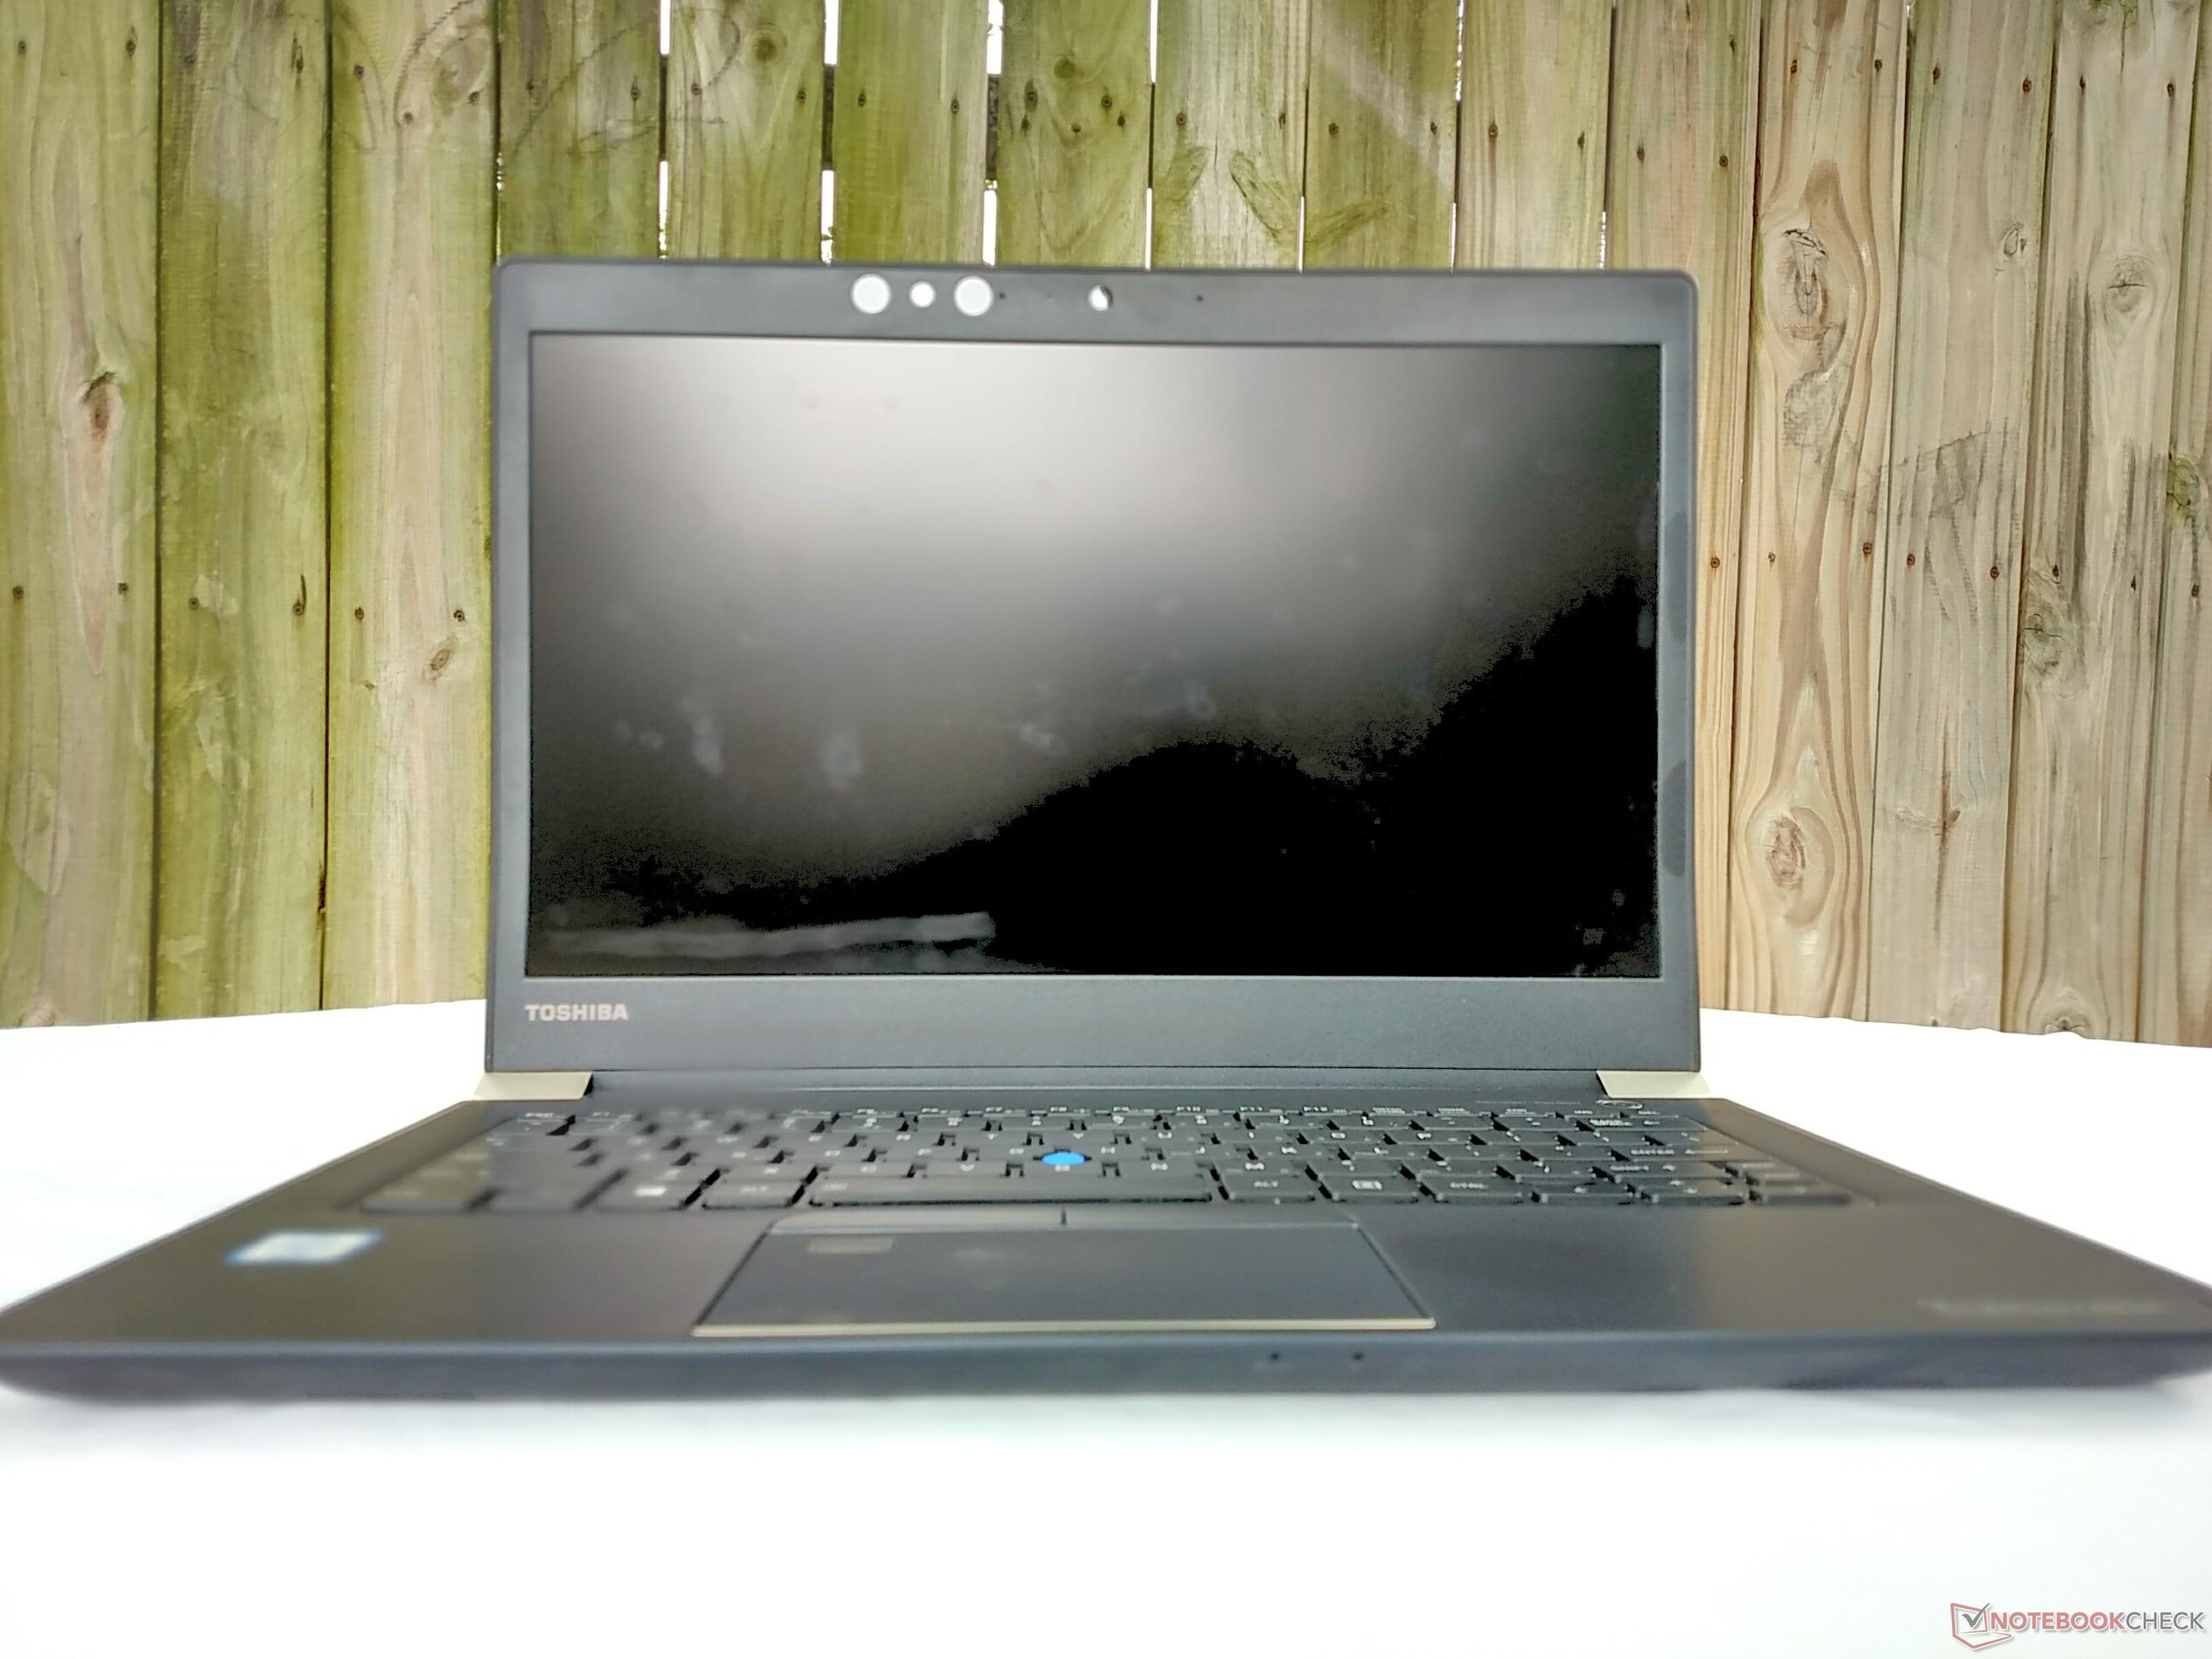
总的来说,东芝Portégé X30 是一款适合经常旅行和商务人士的优秀笔记本。良好的输入输出接口,漂亮的屏幕和精良的机身是这个优秀设备的亮点,而快速虹膜扫描部件和3年保修的优势则是锦上添花。
注:本文是基于完整评测的缩减版本,阅读完整的英文评测,请点击这里。
Toshiba Portege X30-D (PT274U-01N001)
- 06/27/2017 v6 (old)
Sam Medley
Price comparison
