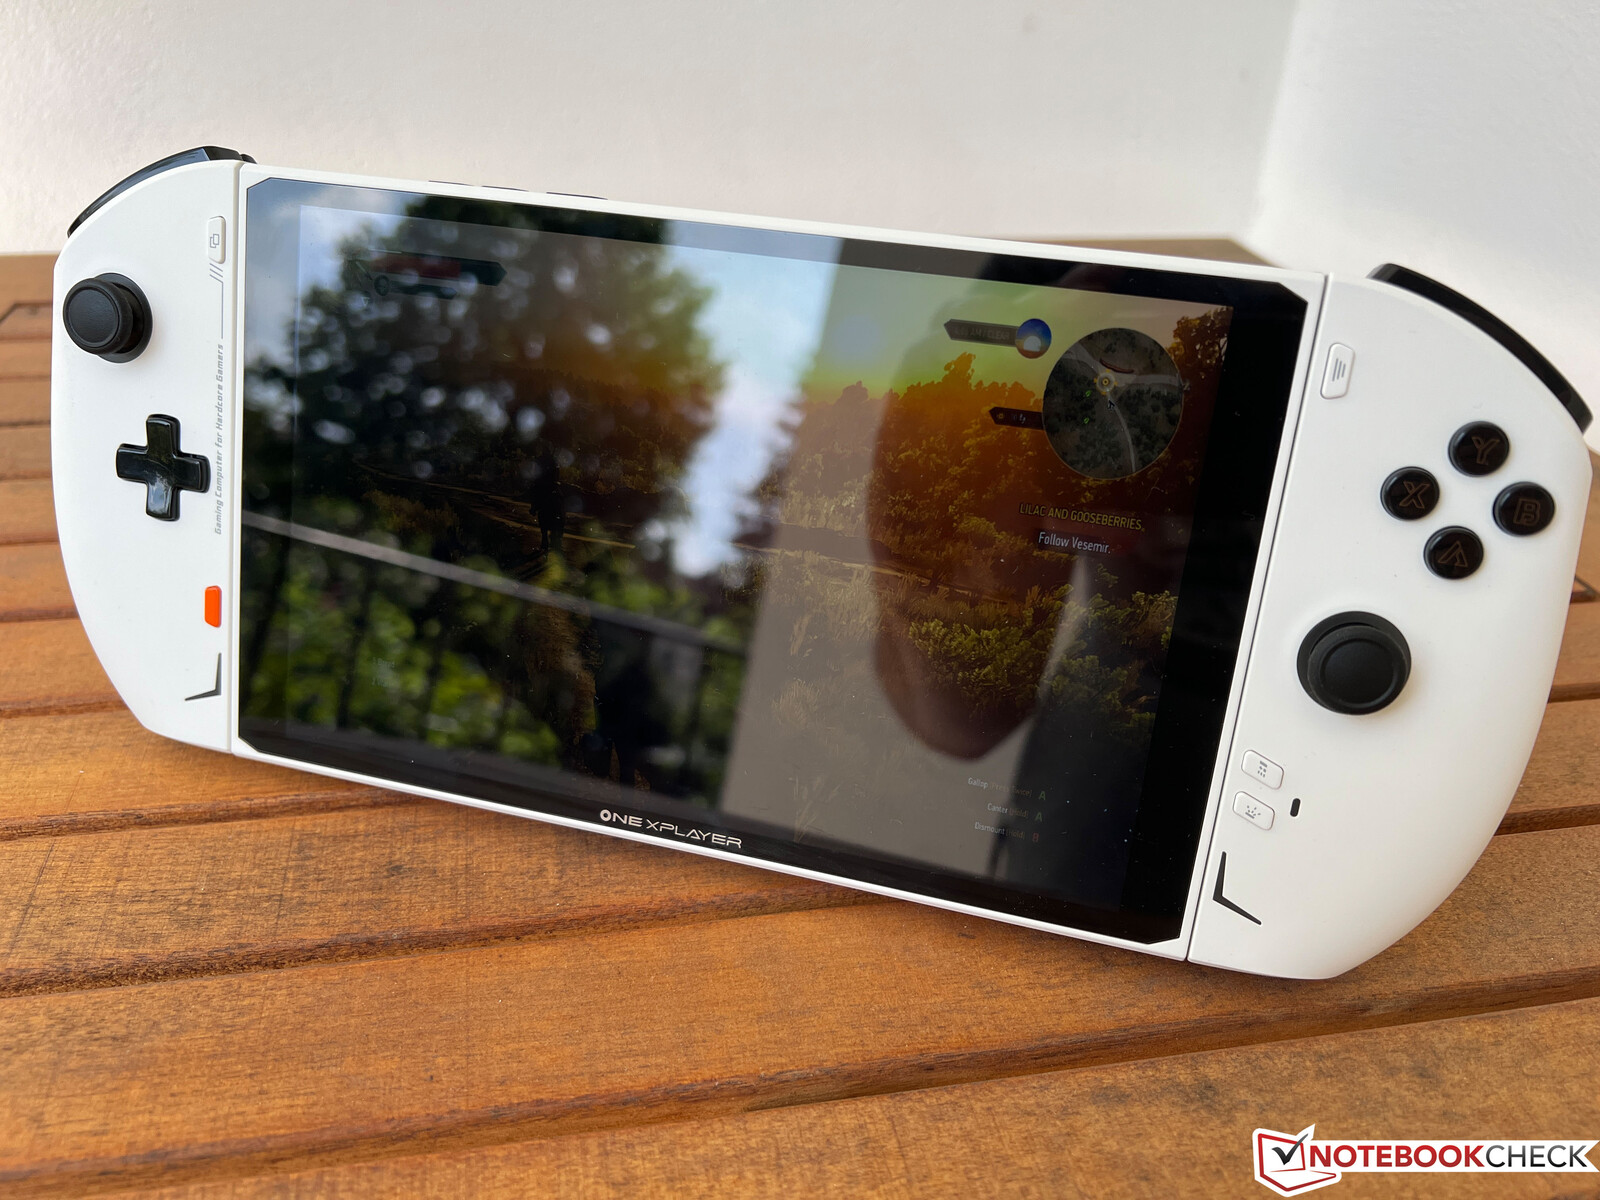
OneXPlayer 2评测--配备AMD Zen3+和可拆卸控制器的游戏掌机
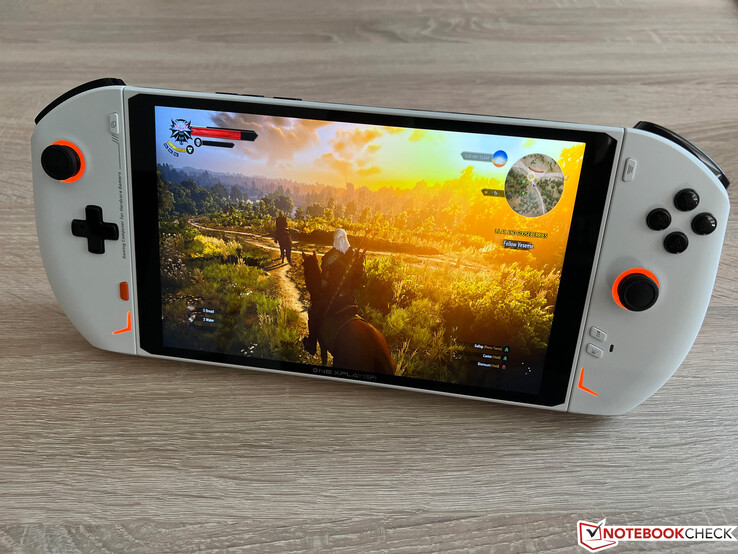
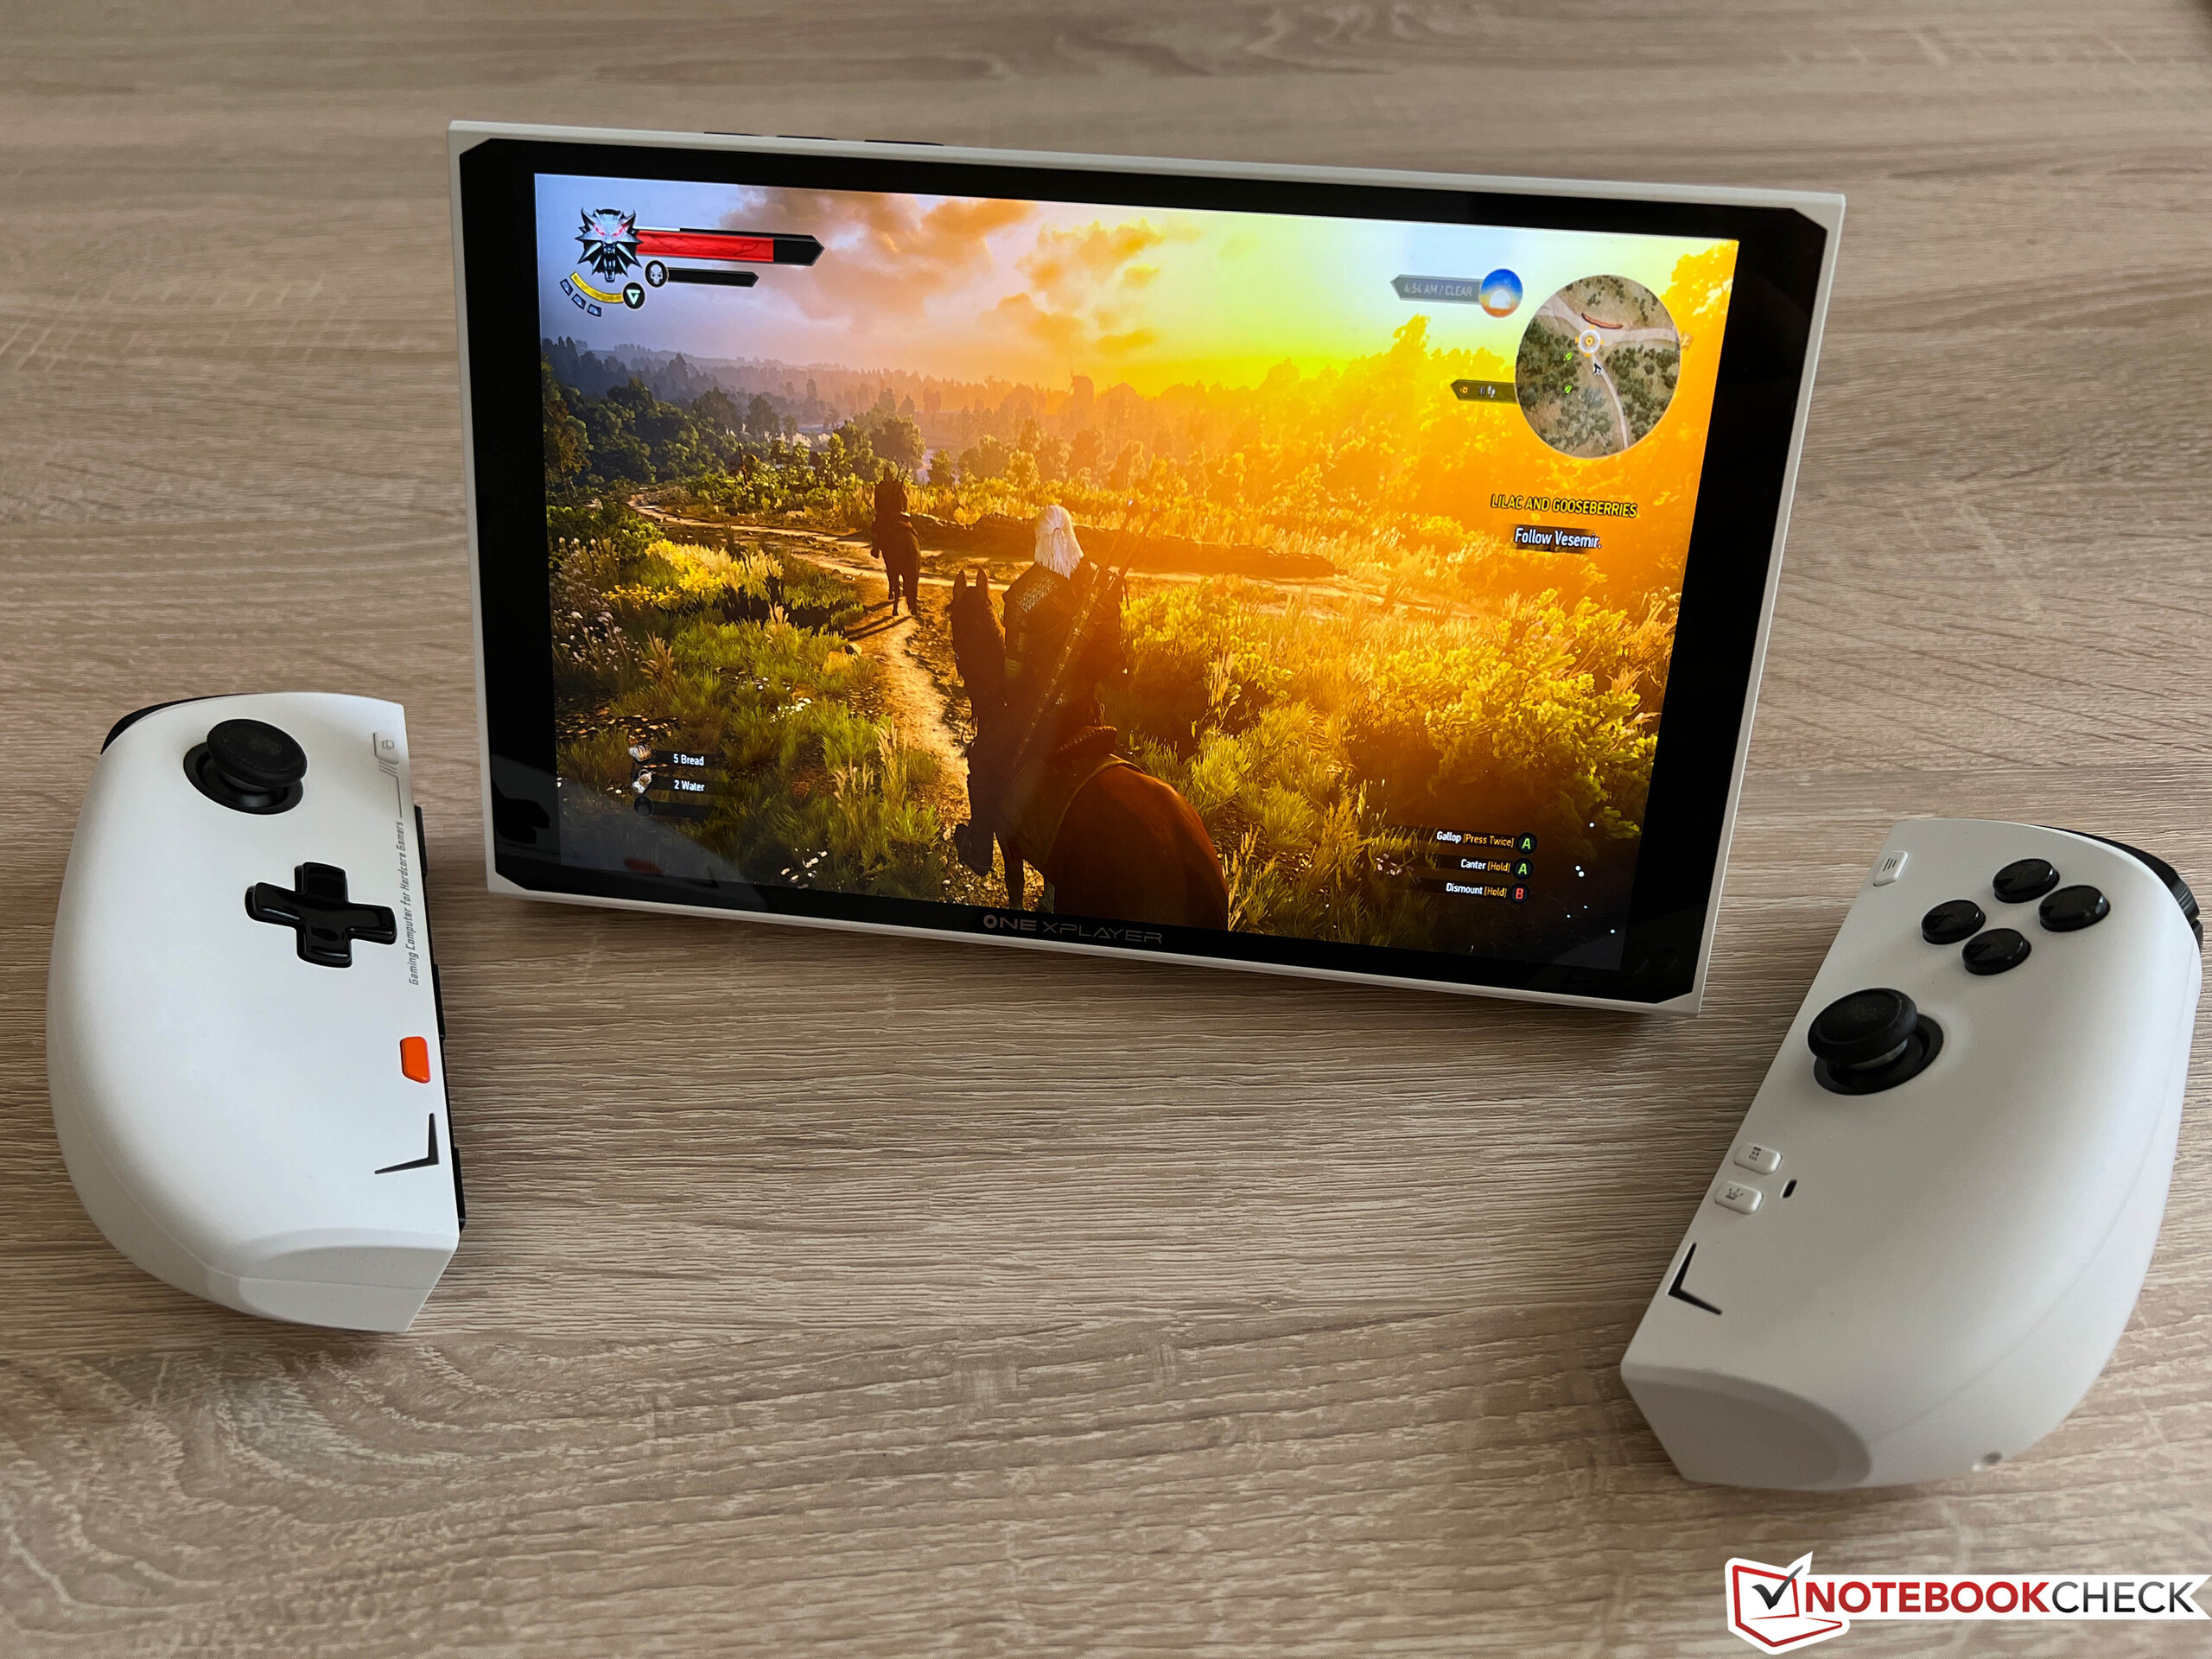
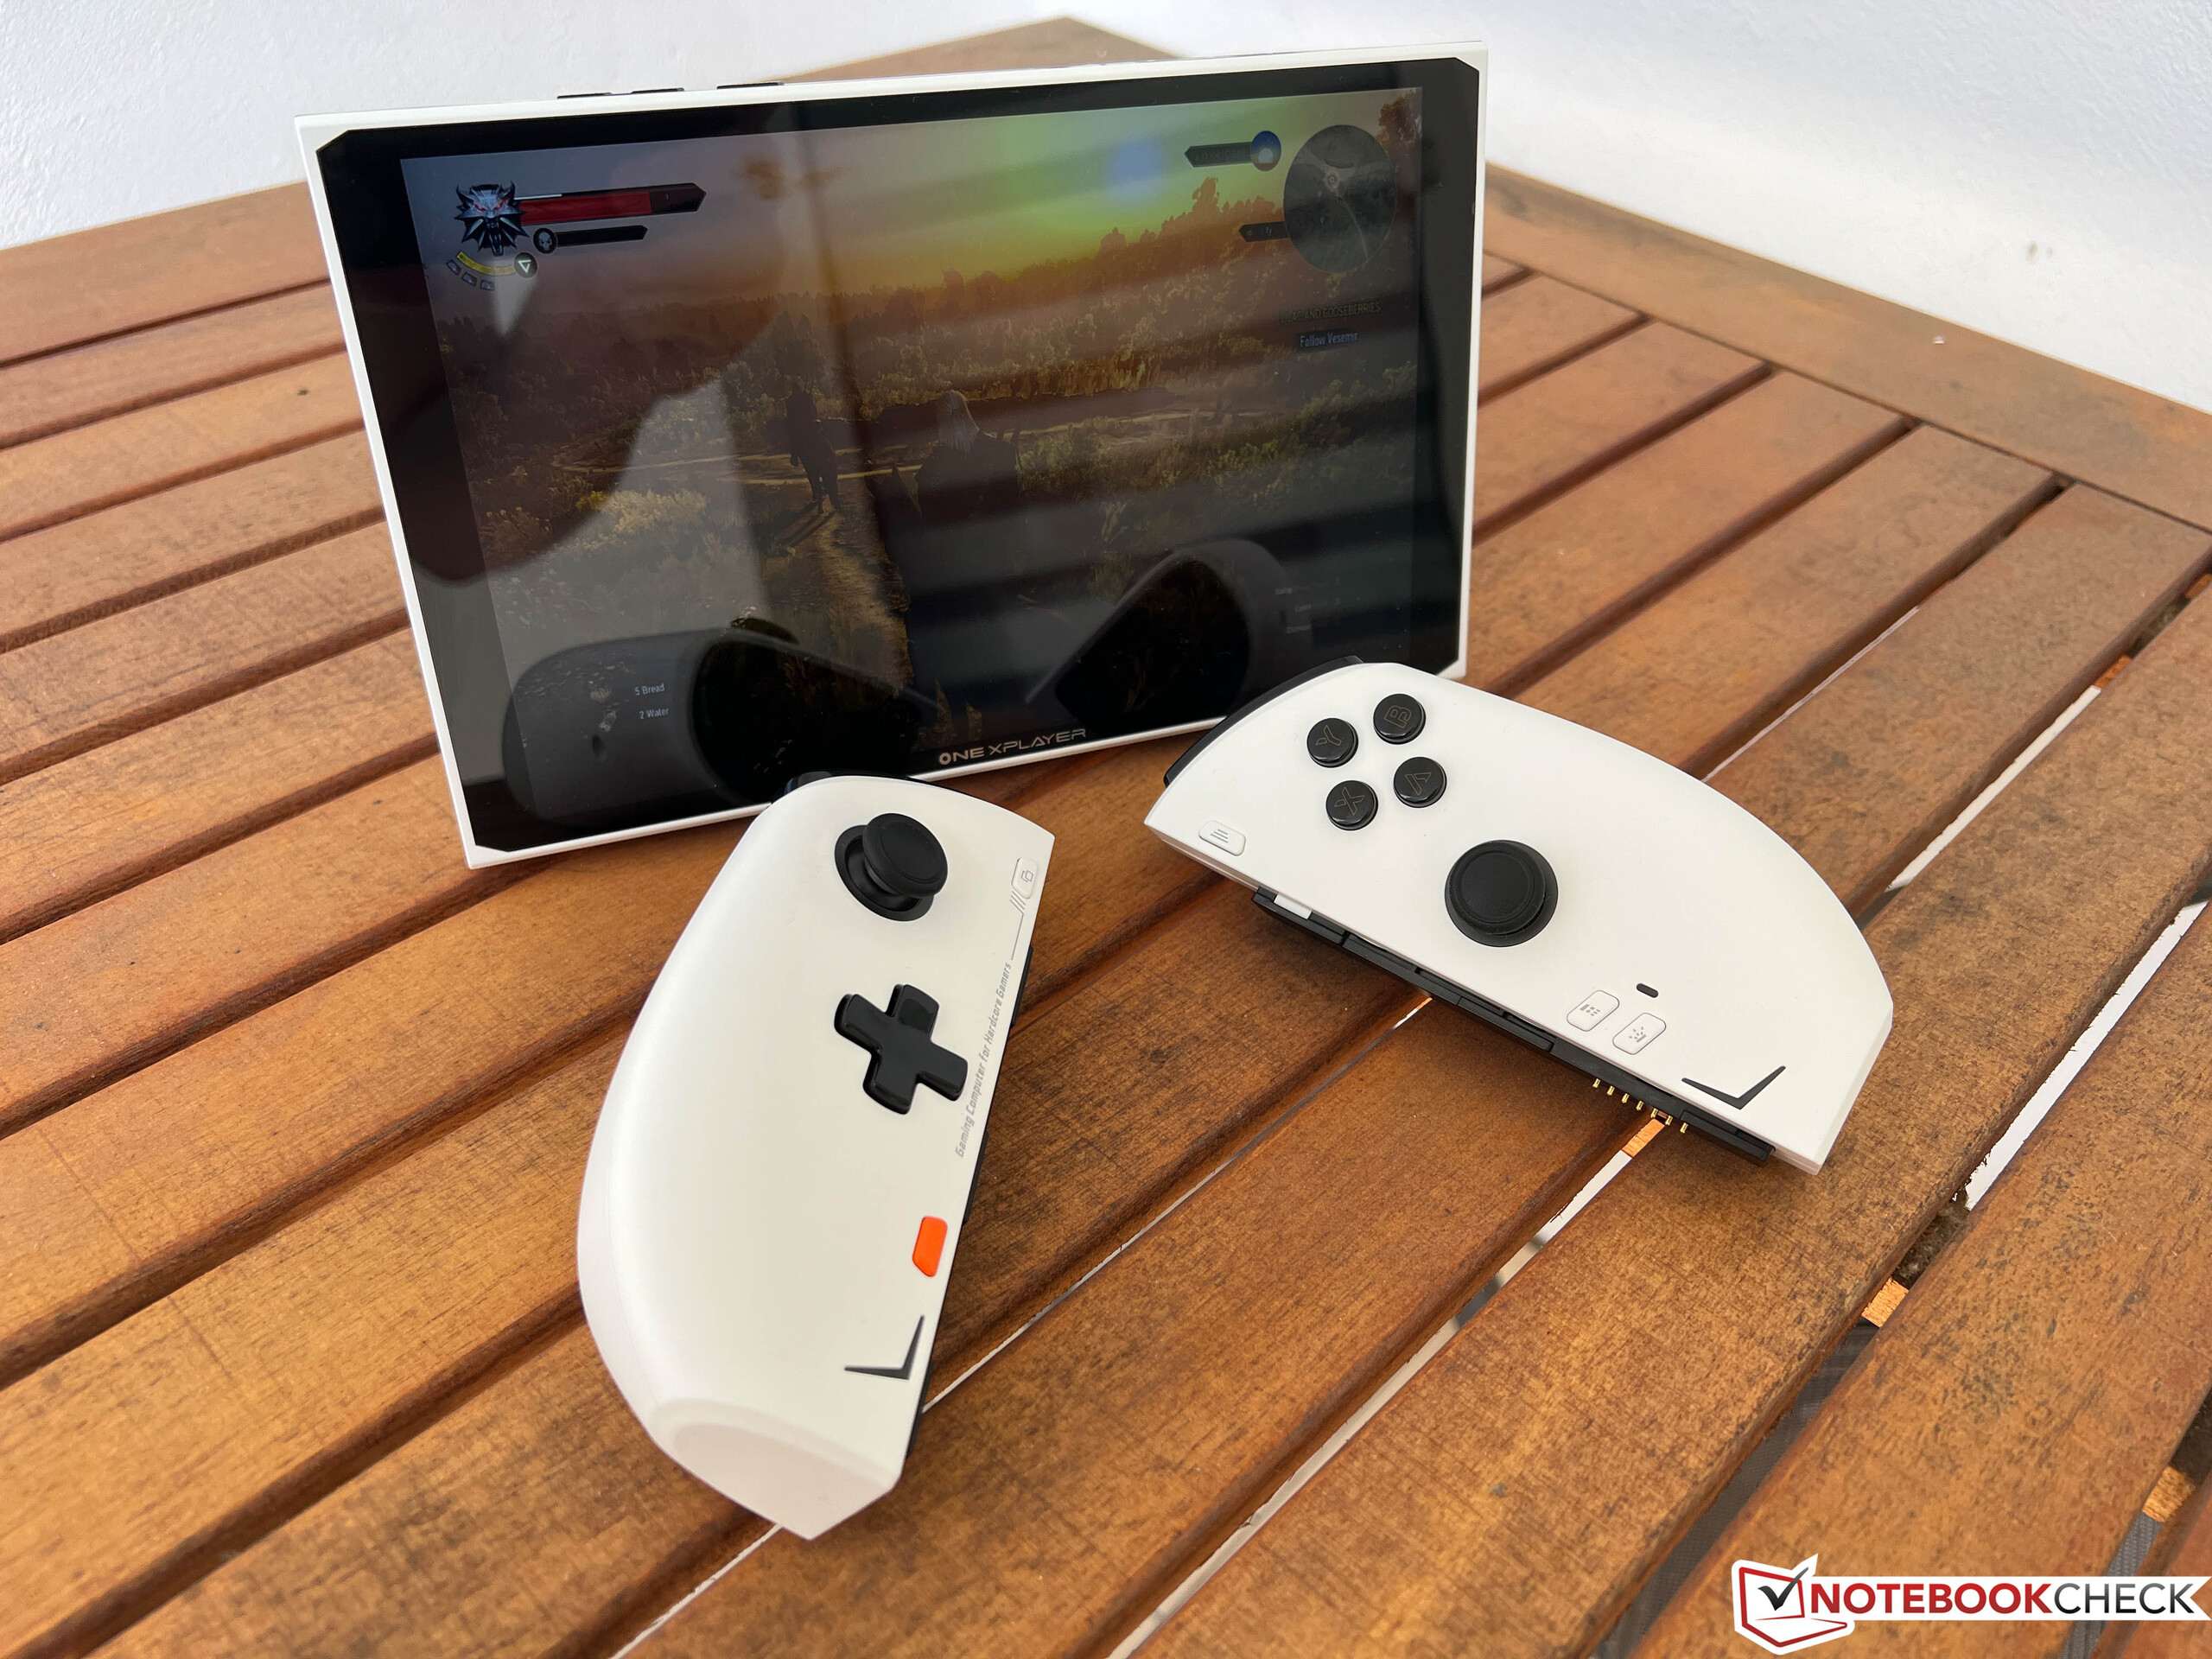
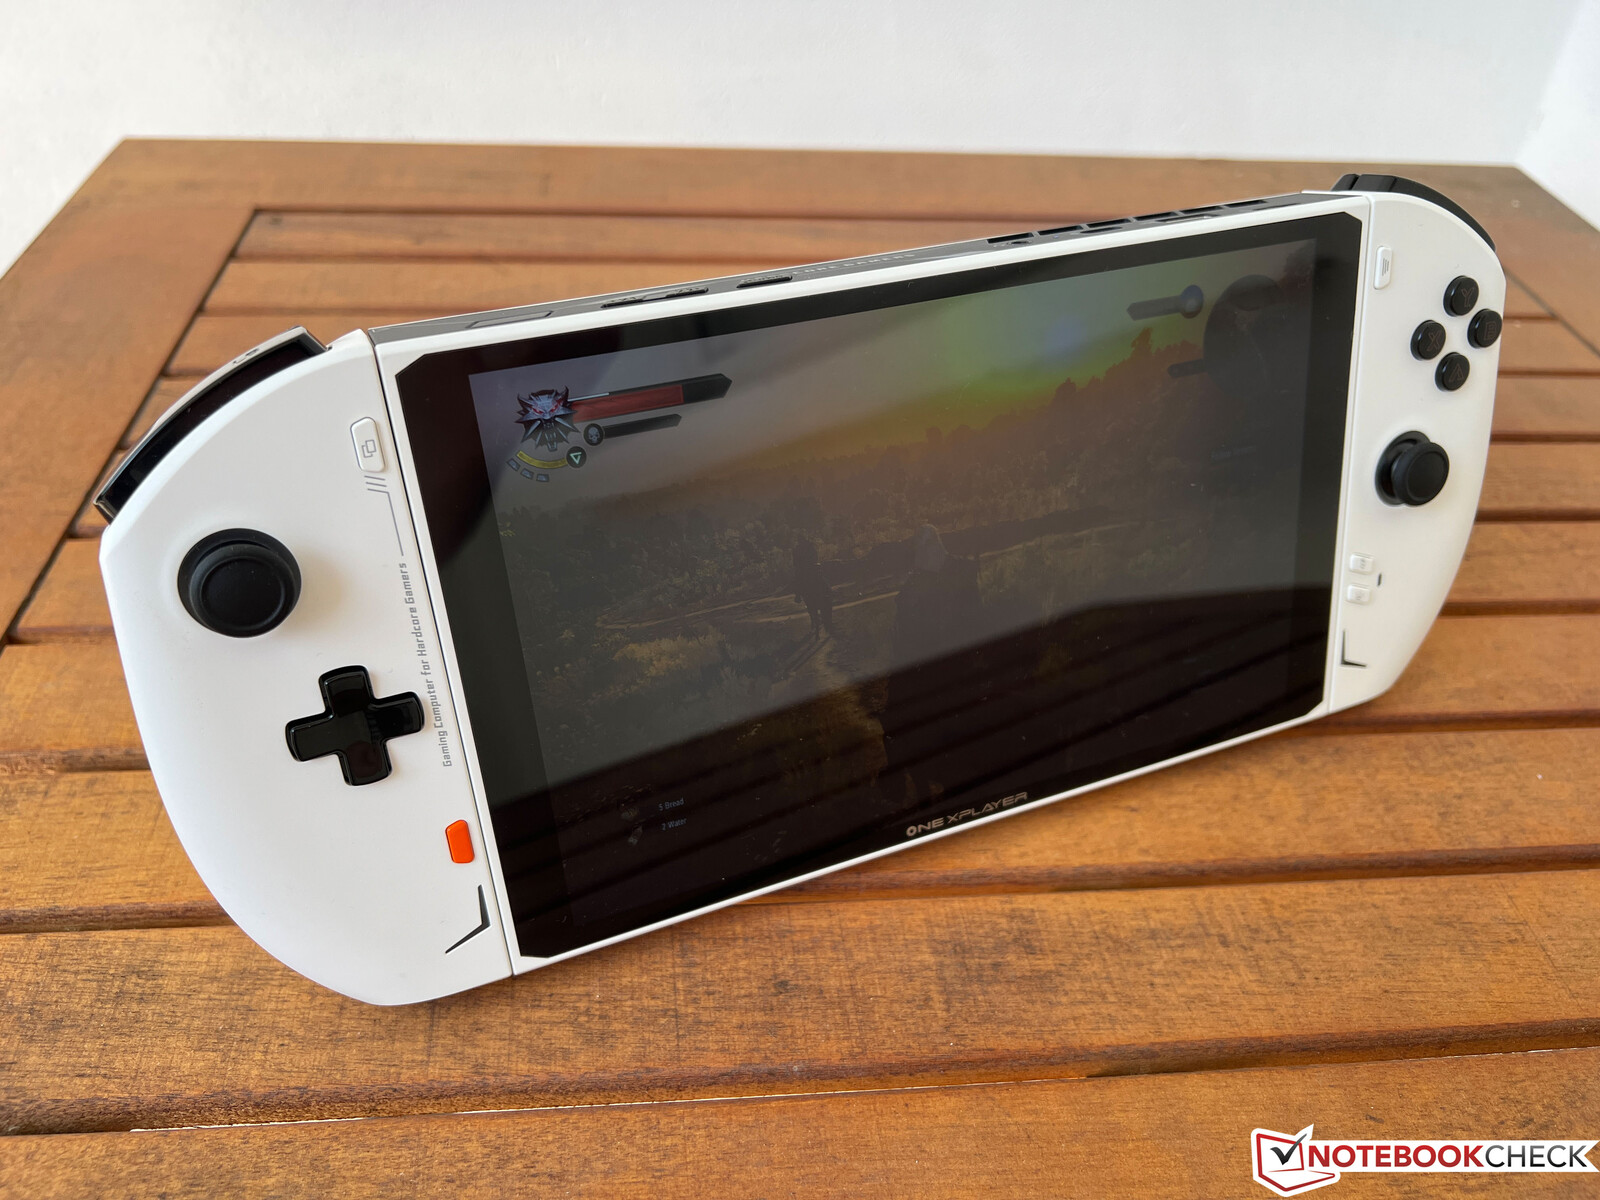
游戏掌机正在慢慢走出小众化的生存状态,最迟自去年Steam Deck的成功以来,选择越来越多。制造商One-Netbook也提供了几款掌机,包括我们今天测试的OneXPlayer 2。与像Steam Deck或最近测试的 ROG Ally,OneXPlayer 2看起来更像任天堂Switch,因为侧面的两个控制器可以被移除。
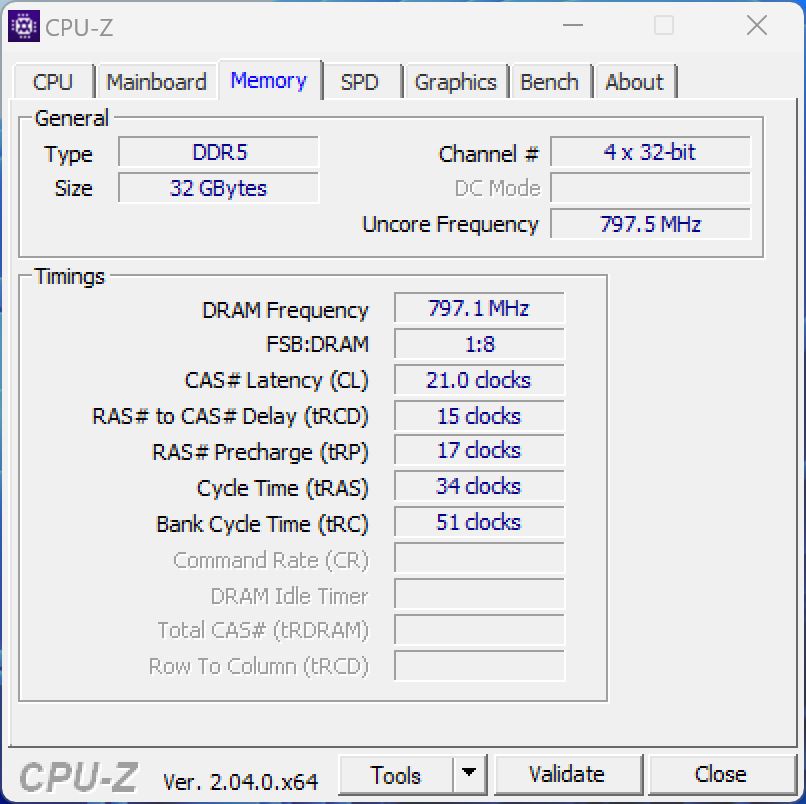
硬件是著名的 AMD Ryzen 7 6800U加上快速的Radeon 680M iGPU,驱动8.4英寸IPS显示屏,分辨率为2560 x 1600像素。内存和固态硬盘有多种选择,最高可达32GB/2TB。我们的评测样本分别配备了16GB和1TB固态硬盘。该设备的价格目前约为1,100欧元。
潜在的竞争对手比较
Rating | Date | Model | Weight | Height | Size | Resolution | Price |
|---|---|---|---|---|---|---|---|
| 84 % v7 (old) | 07 / 2023 | One Netbook XPlayer 2 R7 6800U, Radeon 680M | 864 g | 23 mm | 8.40" | 2560x1600 | |
| 87.5 % v7 (old) | 05 / 2023 | Asus ROG Ally Z1 Extreme Z1 Extreme, Radeon 780M | 611 g | 21.22 mm | 7.00" | 1920x1080 | |
v (old) | 09 / 2025 | Valve Steam Deck 512 GB LCD | 669 g | 49 mm | 7.00" | 1280x800 | |
| 80.3 % v7 (old) | 03 / 2023 | GPD Win 4 R7 6800U, Radeon 680M | 607 g | 28 mm | 6.00" | 1920x1080 | |
| 84.5 % v7 (old) | 07 / 2022 | GPD Win Max 2 i7-1260P, Iris Xe G7 96EUs | 1 kg | 23 mm | 10.10" | 2560x1600 | |
| 86.3 % v7 (old) | 11 / 2021 | GPD Pocket 3 i7-1195G7, Iris Xe G7 96EUs | 730 g | 20 mm | 8.00" | 1920x1200 |
案例与设备
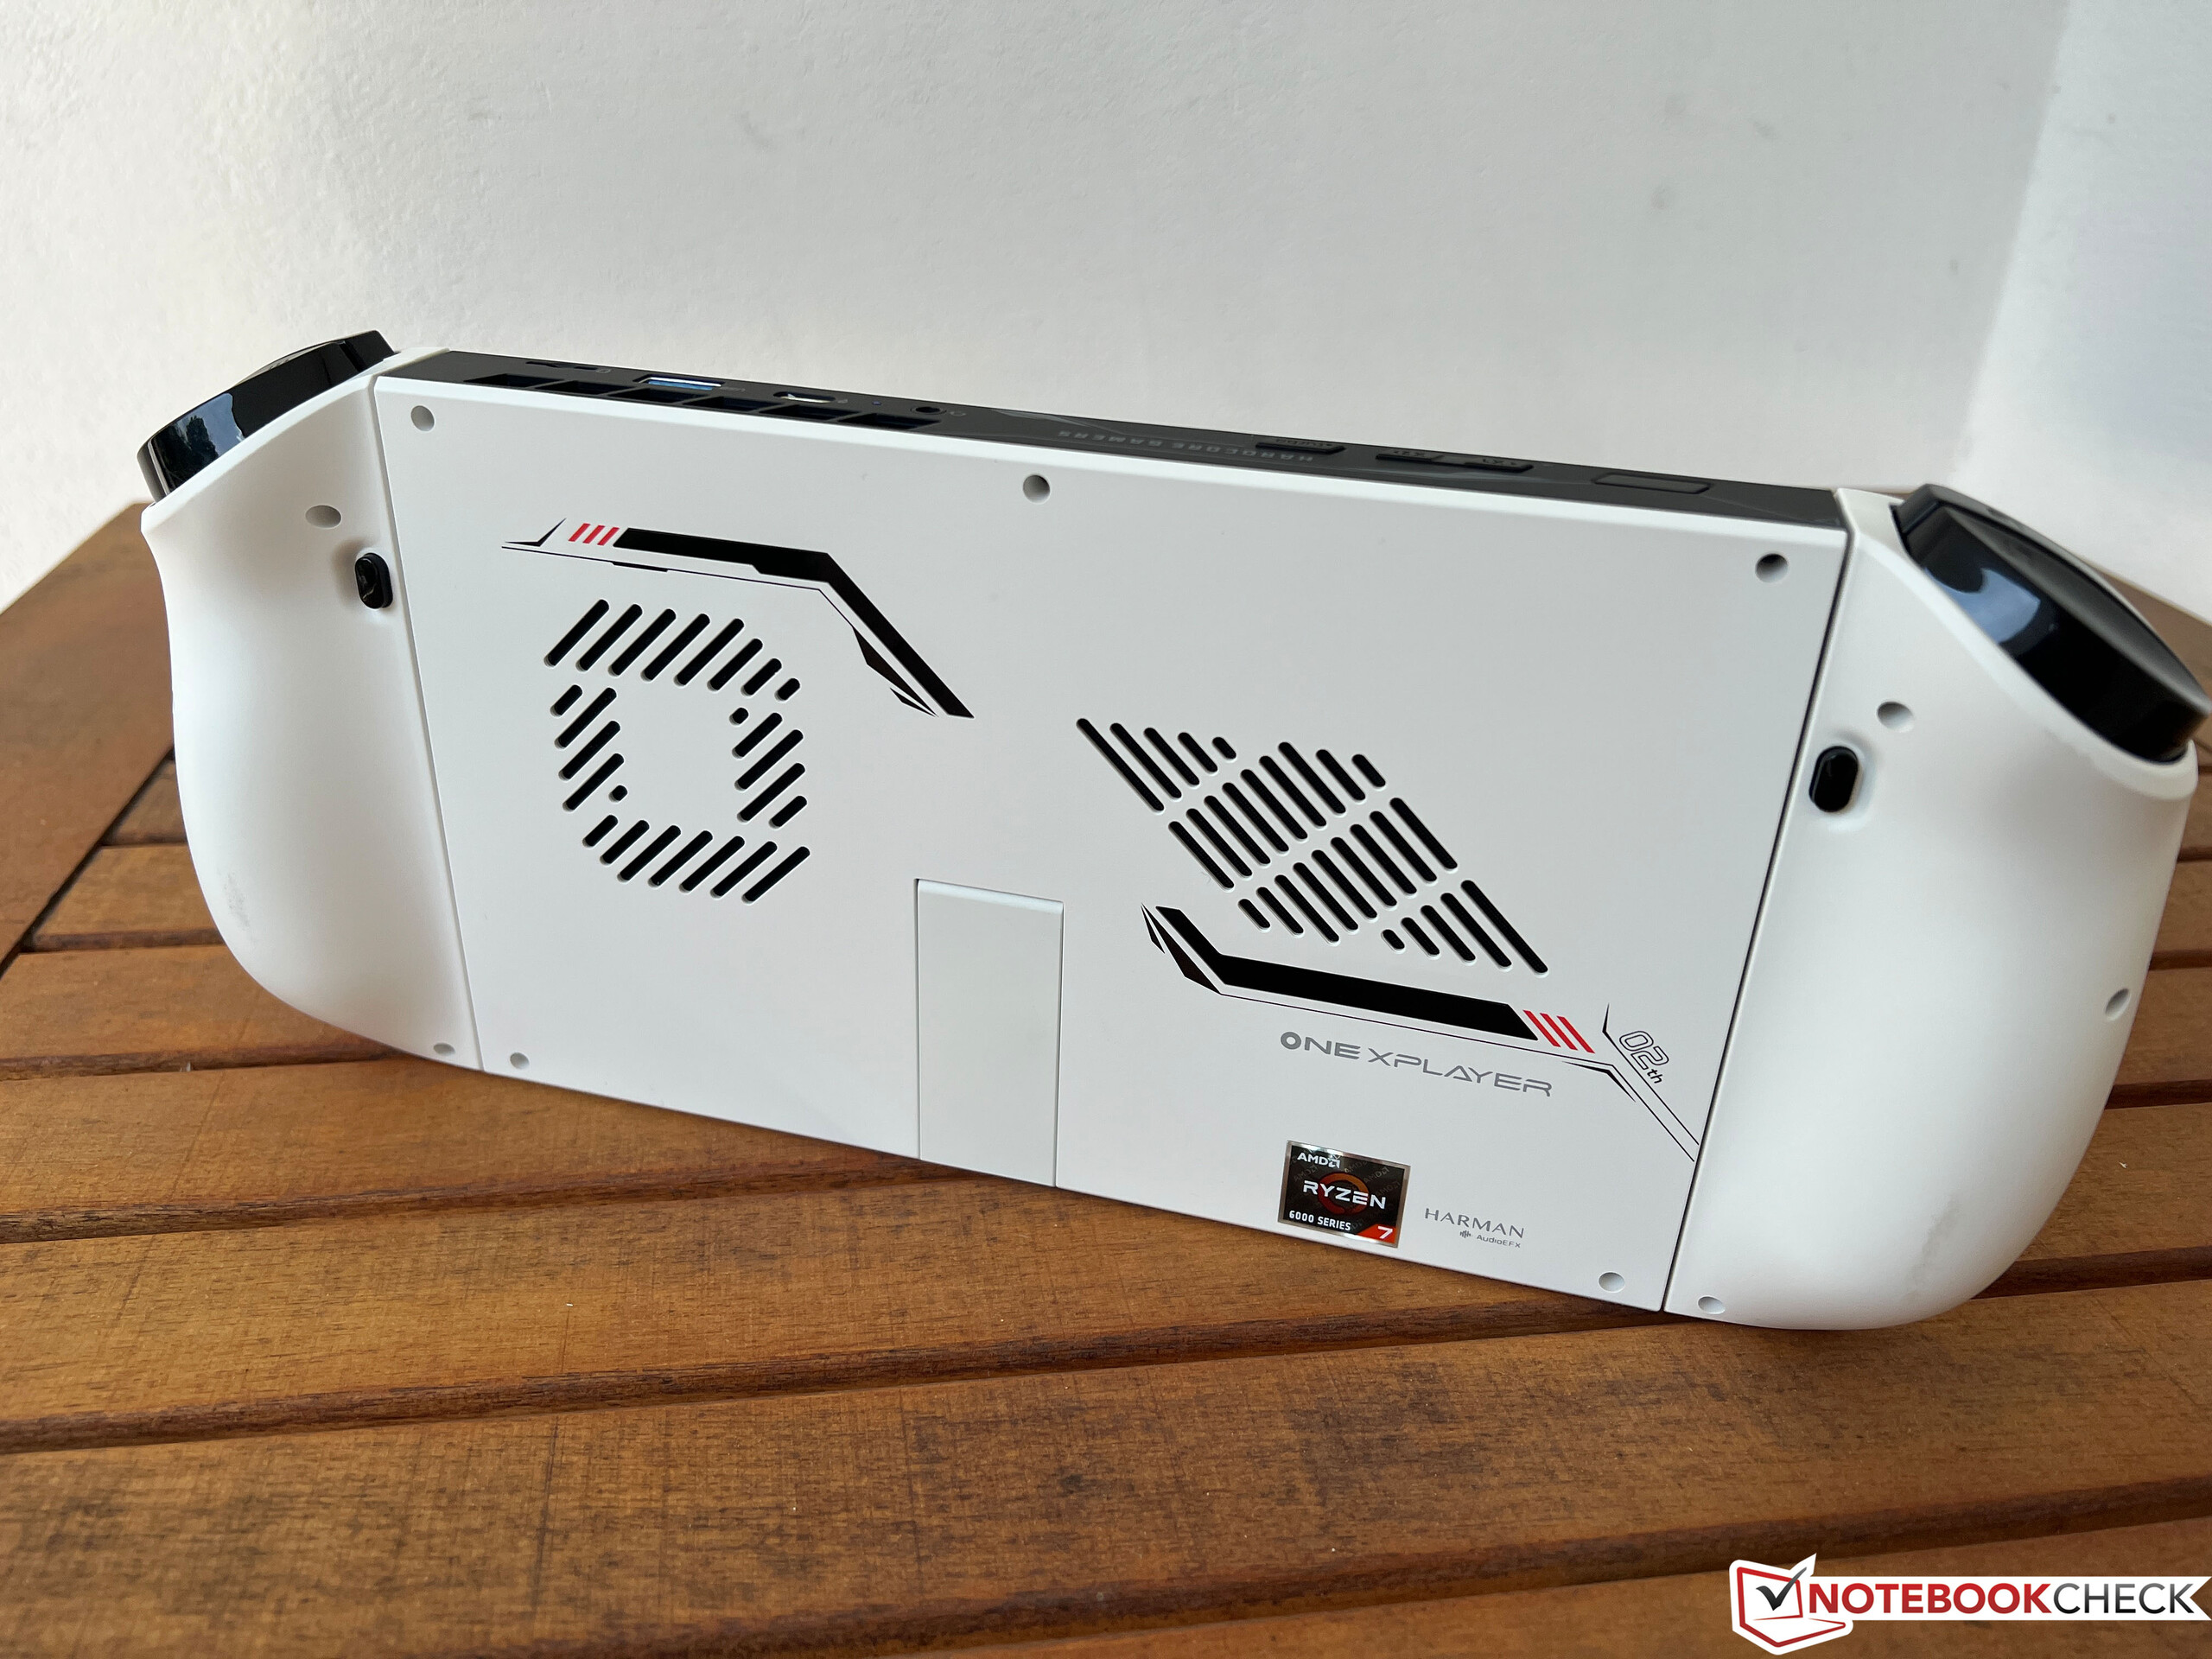
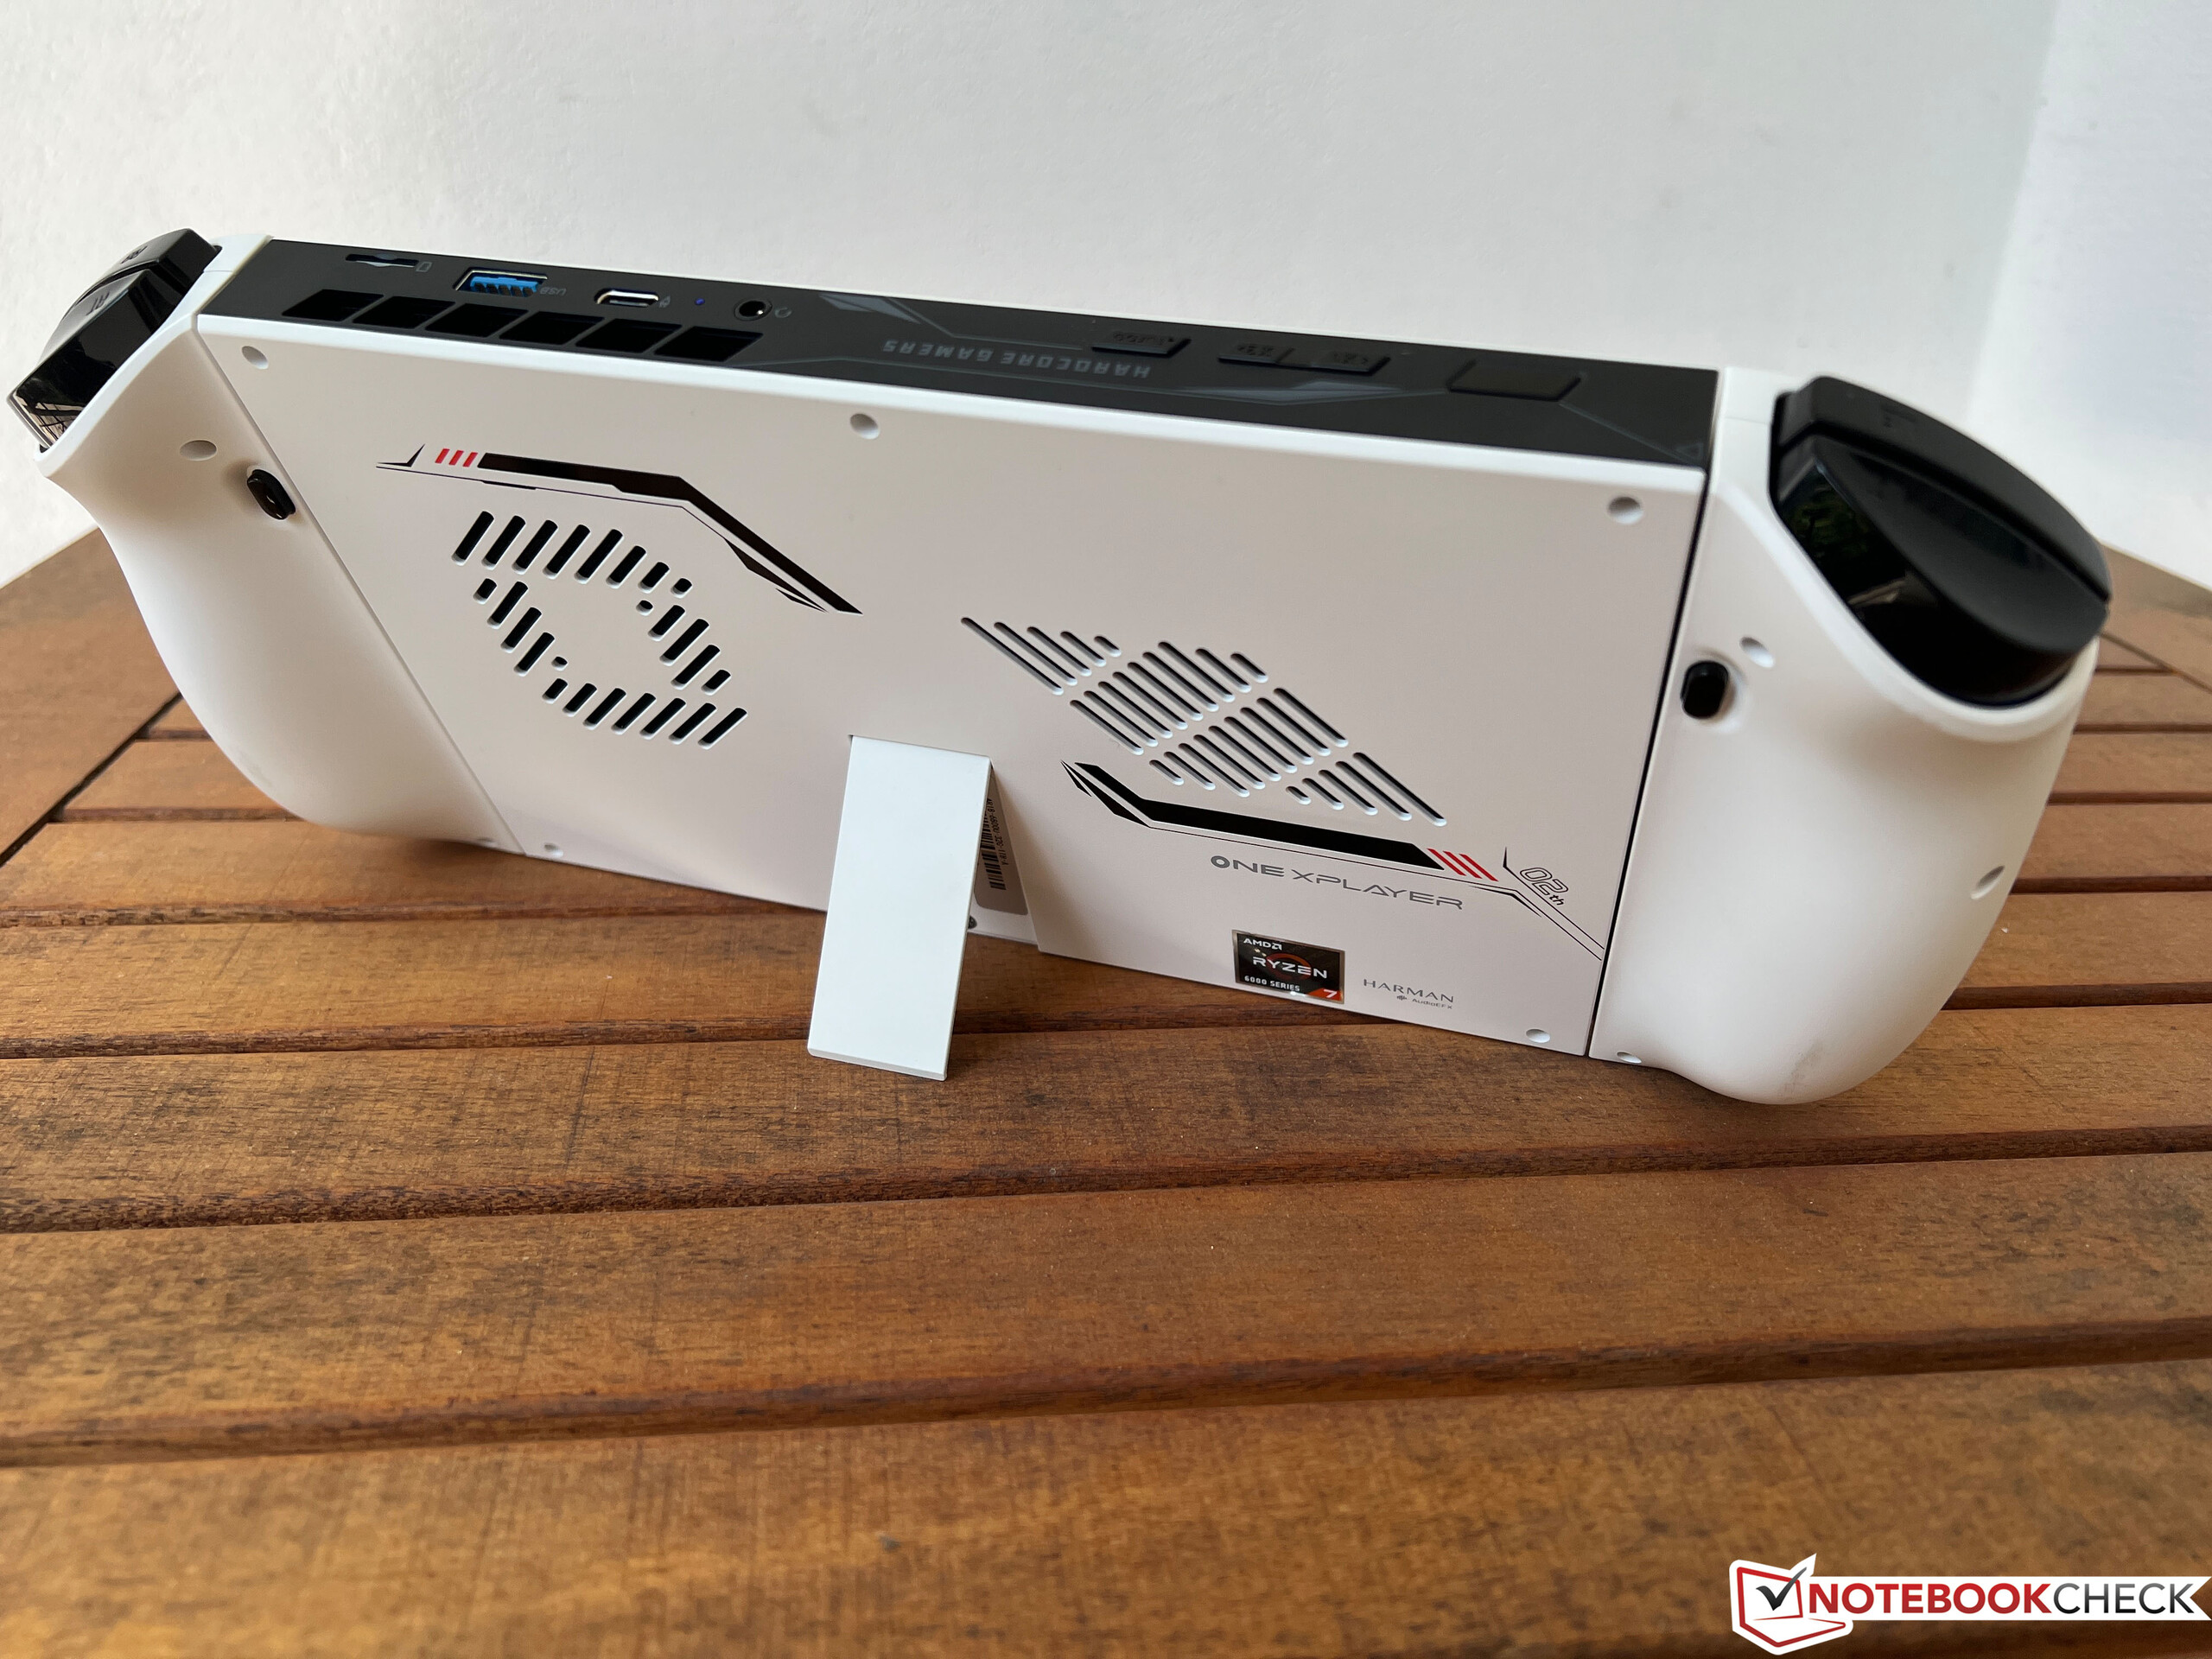
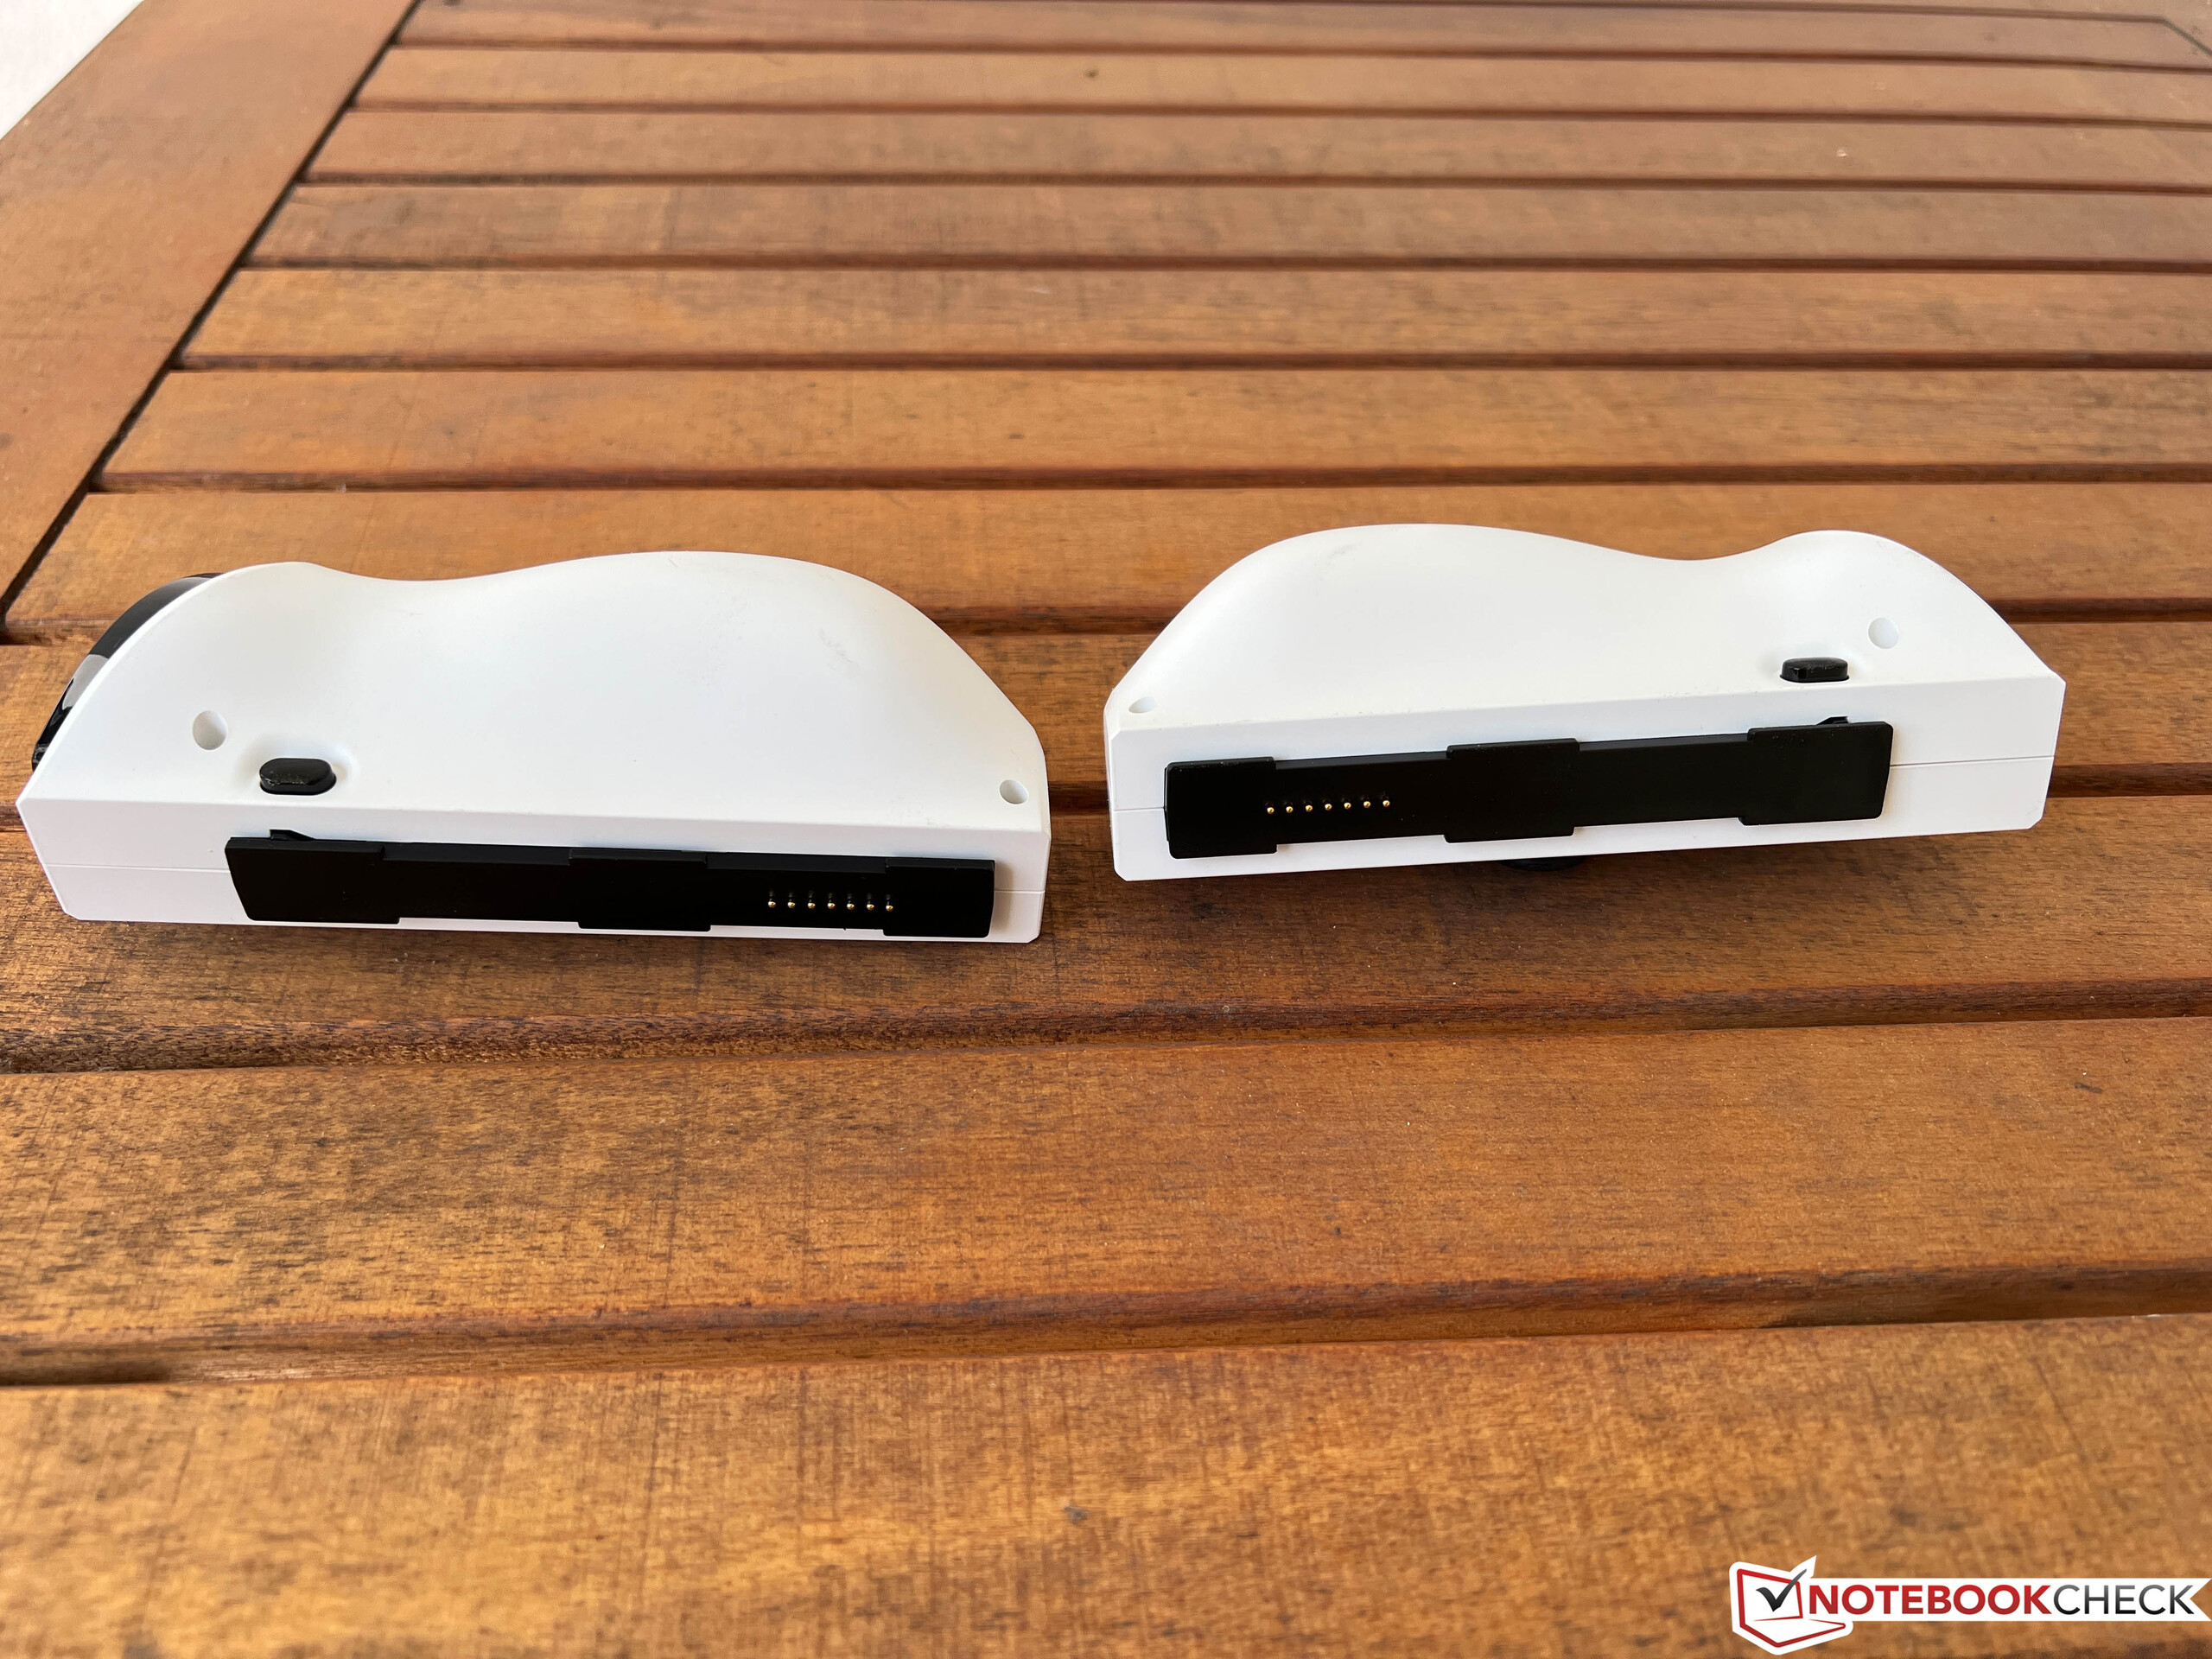
OneXPlayer 2有白色或黑色两种颜色,每种情况下都有橙色光元素(但可以禁用)。外壳由塑料制成,做工尚可,但侧面控制器的两个连接处在结构上造成了很小的偏差。不过,连接机制本身运作良好,控制器也能整齐地卡住。中央部分最终是一个带有集成脚架的小平板,所有部件都安装在其中。一个有点恼人的事实是,两个控制器没有电池,因此在断开连接时只能用一个额外的适配器工作,这个适配器必须单独购买。另外,你当然也可以通过USB或蓝牙连接一个普通的控制器。
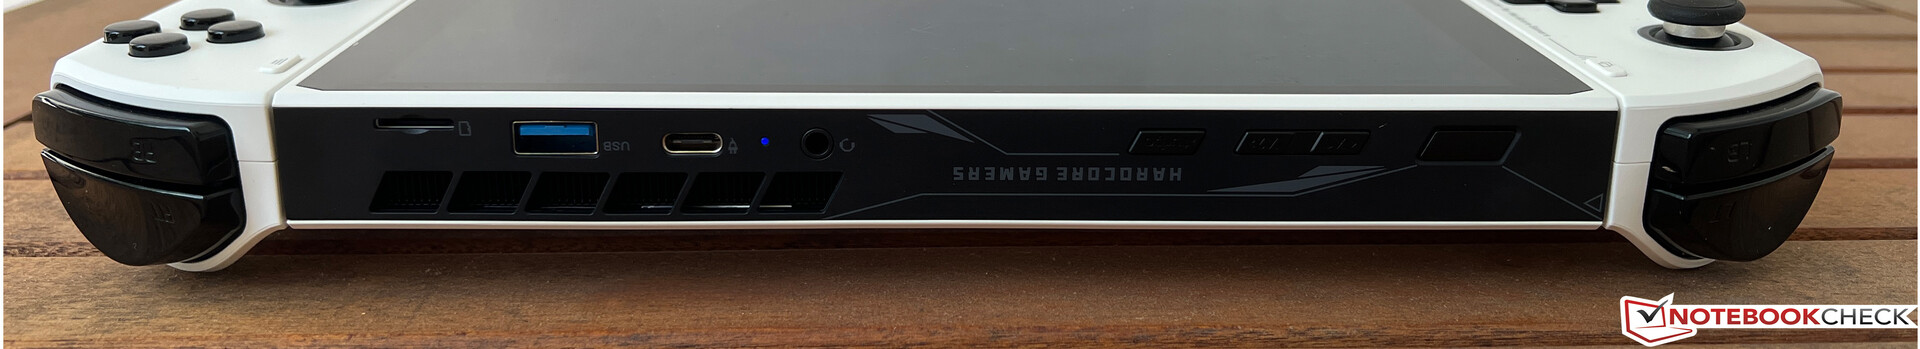
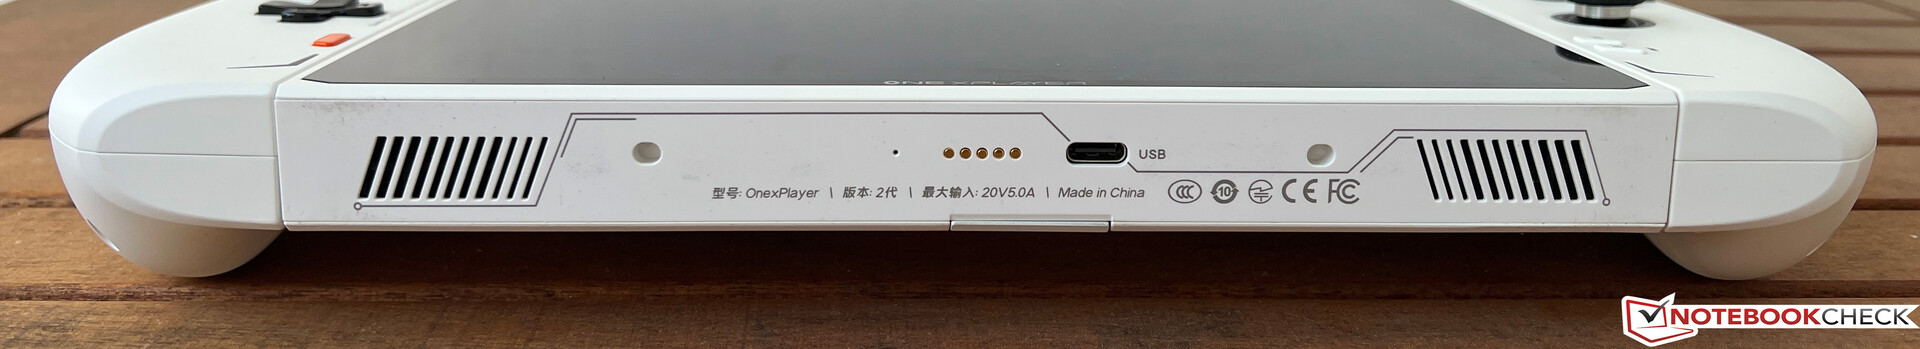
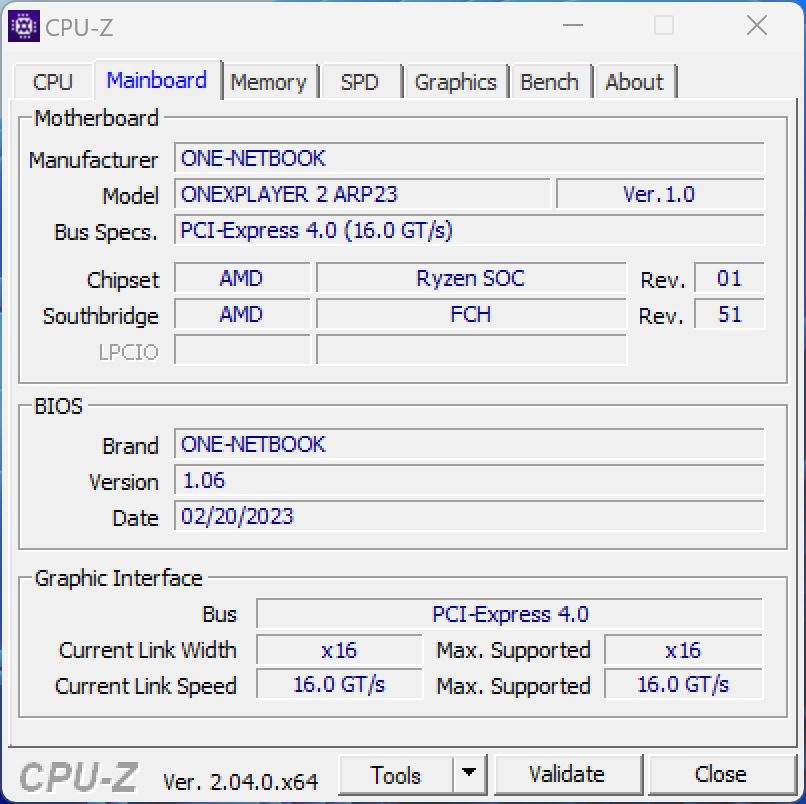
OneXPlayer 2提供广泛的端口,包括2个USB-C(1个USB 4.0),一个microSD读卡器,甚至一个普通的USB-A端口。还安装了一个普通的M.2-2280固态硬盘,但整个设备必须被拆下才能使用。由于有了USB 4.0,即使是外部显卡也可以在家里连接到设备上。microSD读卡器的速度甚至真的很快,最高可达246MB/s,因此也可以作为内存扩展使用。英特尔的AX210卡作为WLAN模块,因此也支持现代Wi-Fi 6连接。我们在测试中没有遇到任何连接问题,传输速率也很好。这款手持设备不提供网络摄像头。

| SD Card Reader | |
| average JPG Copy Test (av. of 3 runs) | |
| GPD Win Max 2 (Toshiba Exceria Pro SDXC 64 GB UHS-II) | |
| Asus ROG Ally Z1 Extreme (Angelbird AV Pro V60) | |
| One Netbook XPlayer 2 (Angelbird AV Pro V60) | |
| Average of class Multimedia (23 - 531, n=36, last 2 years) | |
| GPD Win 4 (AV Pro SD microSD 128 GB V60) | |
| Valve Steam Deck 512 GB LCD (Angelbird AV Pro V60) | |
| maximum AS SSD Seq Read Test (1GB) | |
| Asus ROG Ally Z1 Extreme (Angelbird AV Pro V60) | |
| One Netbook XPlayer 2 (Angelbird AV Pro V60) | |
| GPD Win Max 2 (Toshiba Exceria Pro SDXC 64 GB UHS-II) | |
| Average of class Multimedia (37.3 - 1455, n=35, last 2 years) | |
| GPD Win 4 (AV Pro SD microSD 128 GB V60) | |
| Networking | |
| One Netbook XPlayer 2 | |
| iperf3 transmit AXE11000 | |
| iperf3 receive AXE11000 | |
| Asus ROG Ally Z1 Extreme | |
| iperf3 transmit AXE11000 | |
| iperf3 receive AXE11000 | |
| GPD Win 4 | |
| iperf3 transmit AXE11000 | |
| iperf3 receive AXE11000 | |
| iperf3 transmit AXE11000 6GHz | |
| iperf3 receive AXE11000 6GHz | |
| GPD Win Max 2 | |
| iperf3 transmit AXE11000 6GHz | |
| iperf3 receive AXE11000 6GHz | |
| GPD Pocket 3 | |
| iperf3 transmit AX12 | |
| iperf3 receive AX12 | |
操作--没有优化的Windows
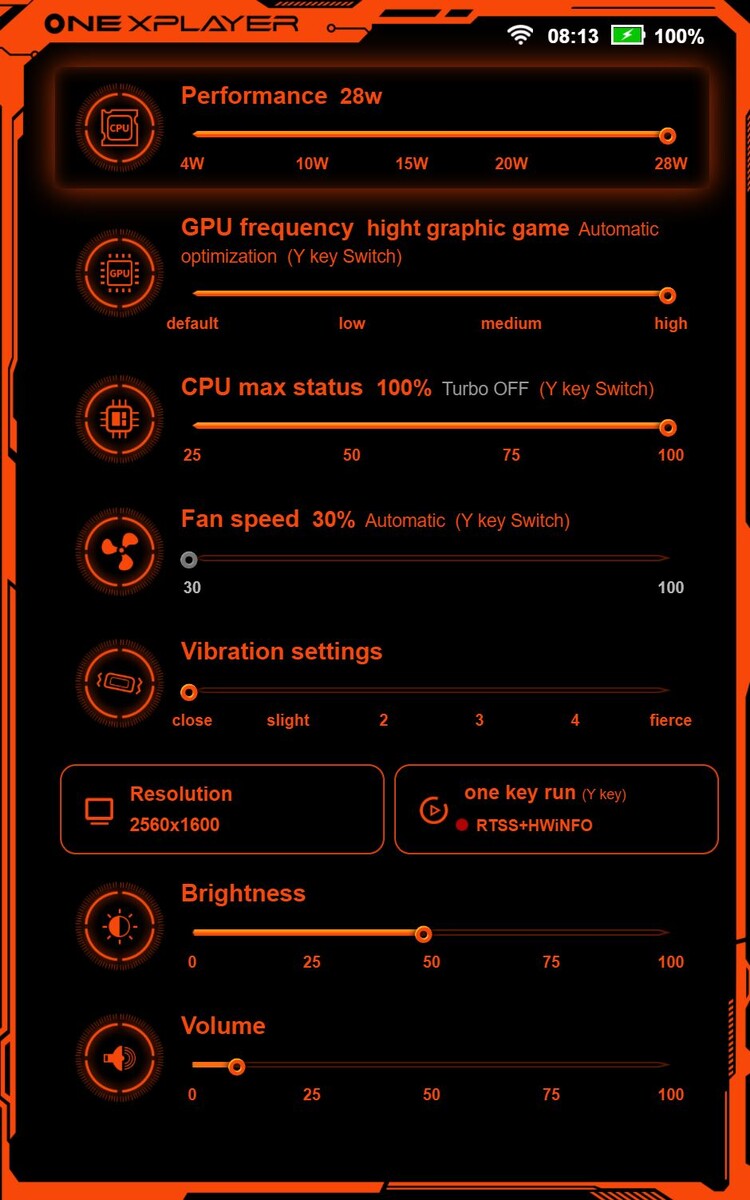
使用Windows 11 Home作为操作系统,但没有针对触摸操作进行任何调整。两个操纵杆可用于指针控制和滚动,这有点笨拙,但基本上可以使用。然而,与Steam Deck或ROG Ally不同,没有中央软件可以用来安装/启动游戏或调整设置等。在这里,仅限于一个名为Gamer Zone的小型控制中心,它允许你改变CPU的性能、振动和亮度以及音量。这个菜单相当实用,而且总是可以通过专用按钮进入,但我们希望在这里也能看到一个FPS锁,比如说。另一个缺点是,它是一个独立的应用程序,而不是一个覆盖,这就是为什么你不能在游戏中使用它,但它被扔到了桌面上。
操纵杆本身给人留下了体面的印象,我们在测试过程中对按钮没有任何问题。然而,特别是上侧的触发器并没有留下特别高质量的印象,控制器支持振动功能。电容式触摸屏本身的工作没有问题,正如预期的那样。总而言之,你只需注意到没有特别的软件优化,不幸的是,Windows主要通过触摸屏操作仍然不理想。
显示屏 - IPS面板,WQHD分辨率
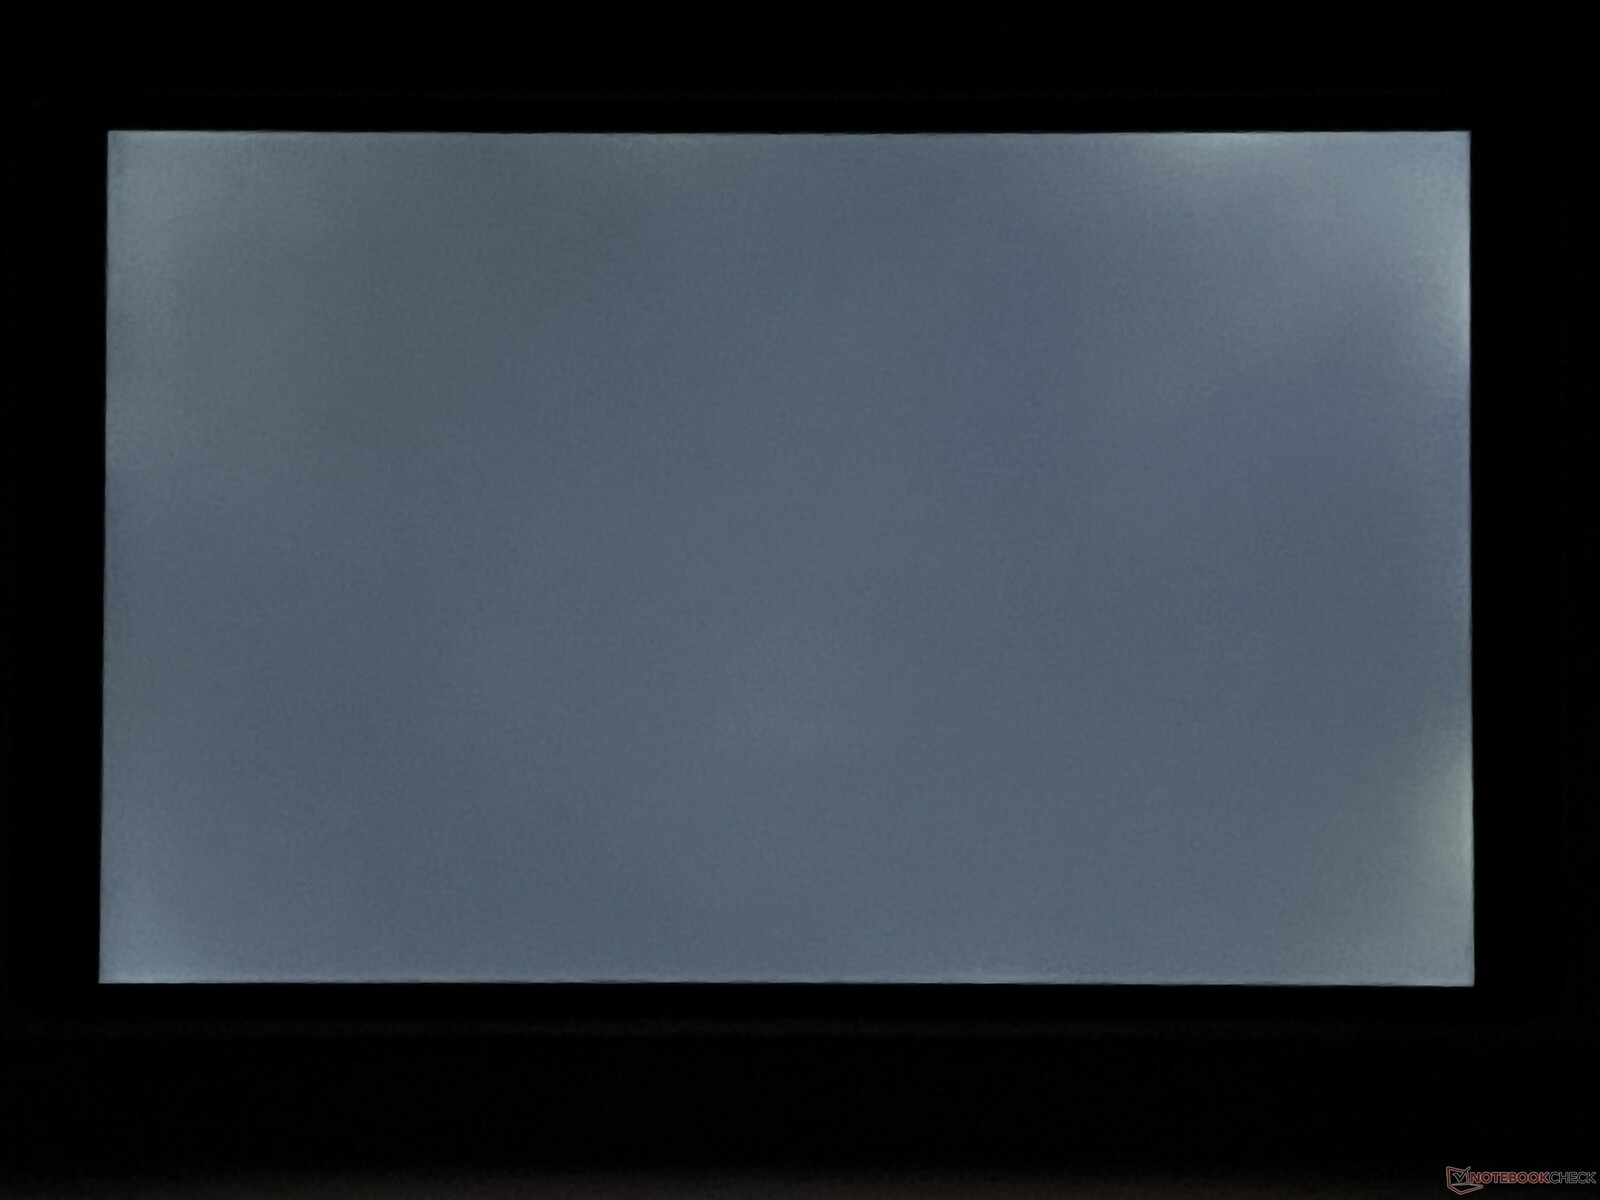
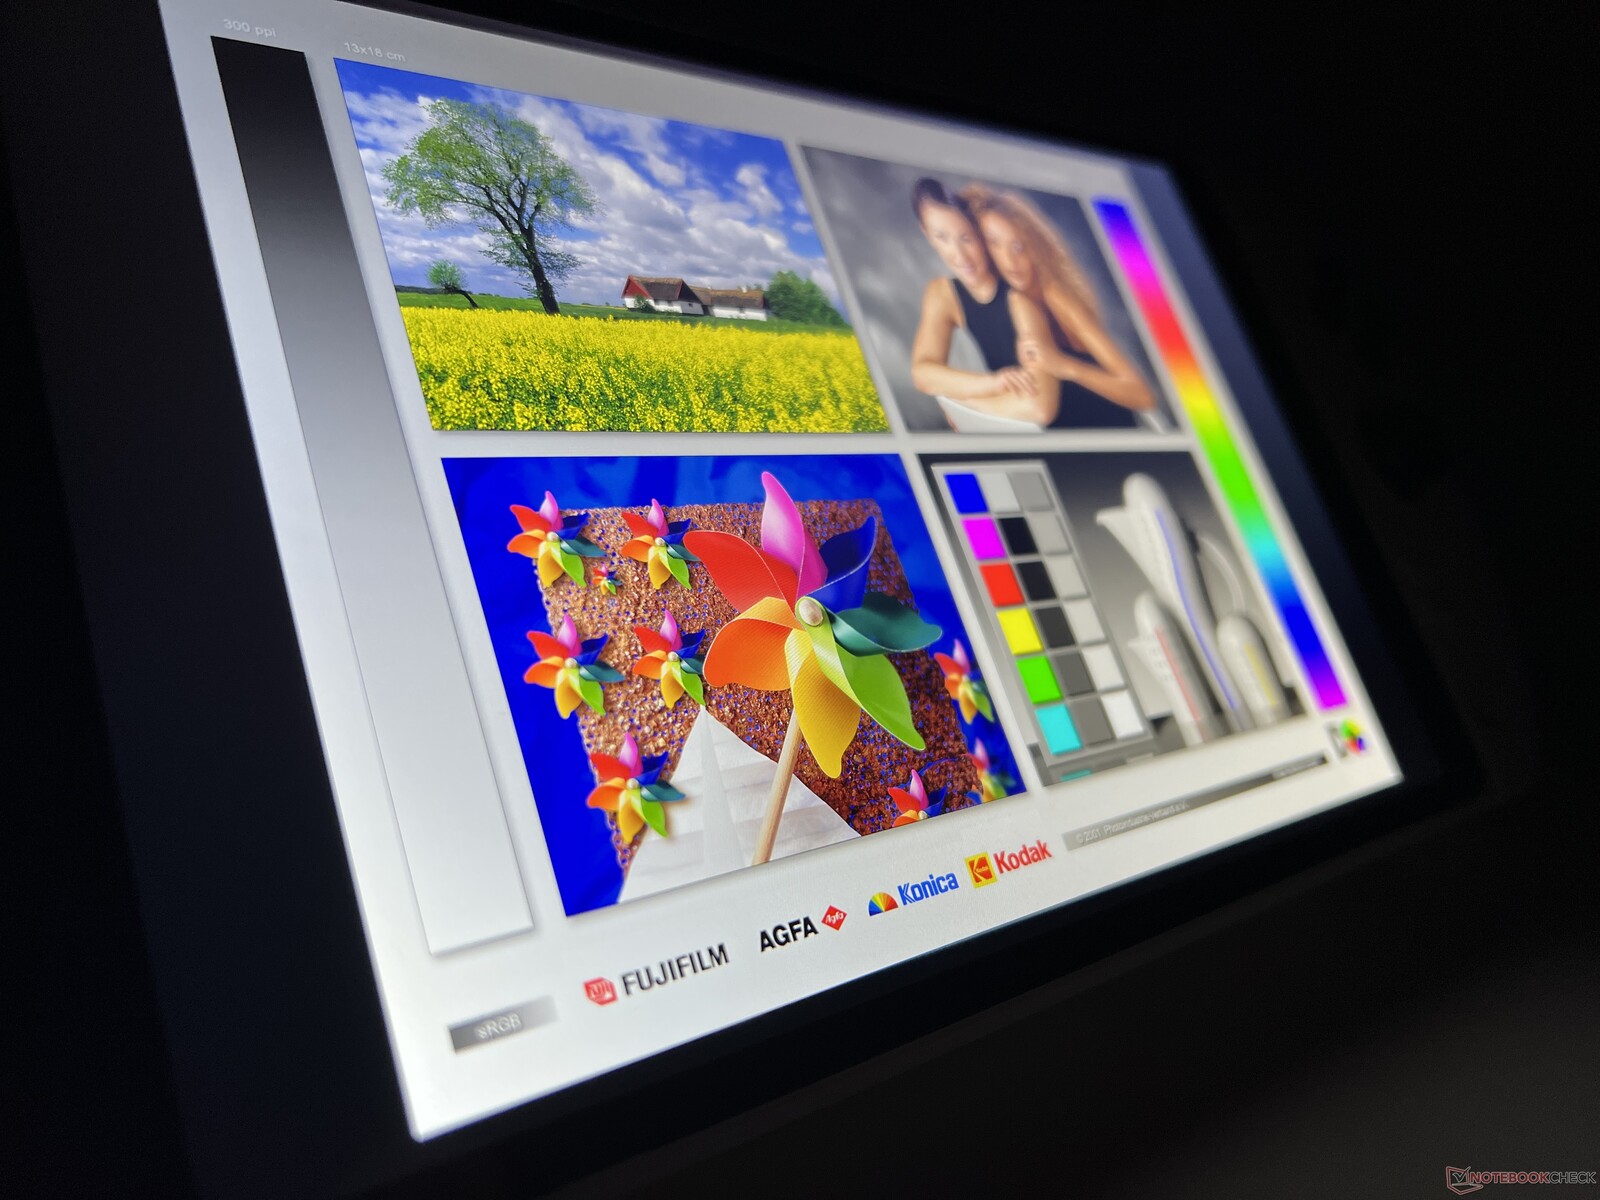
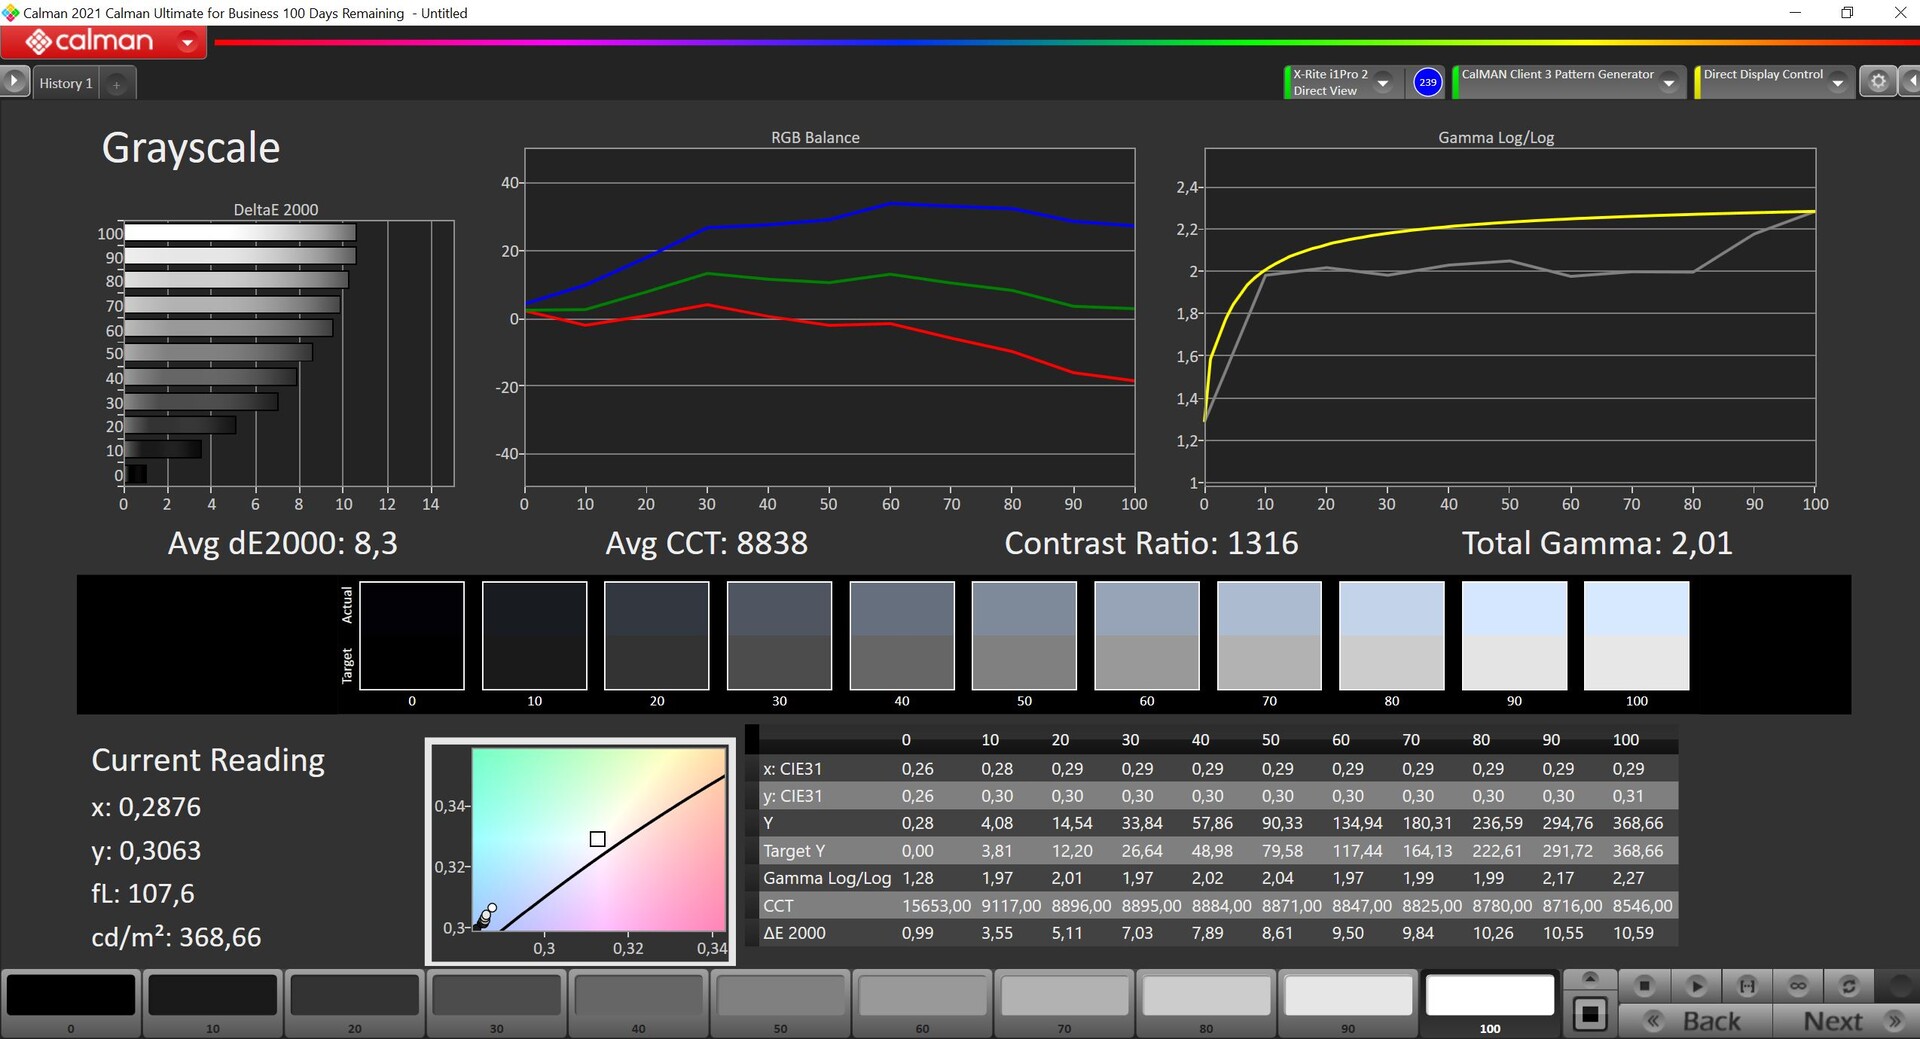
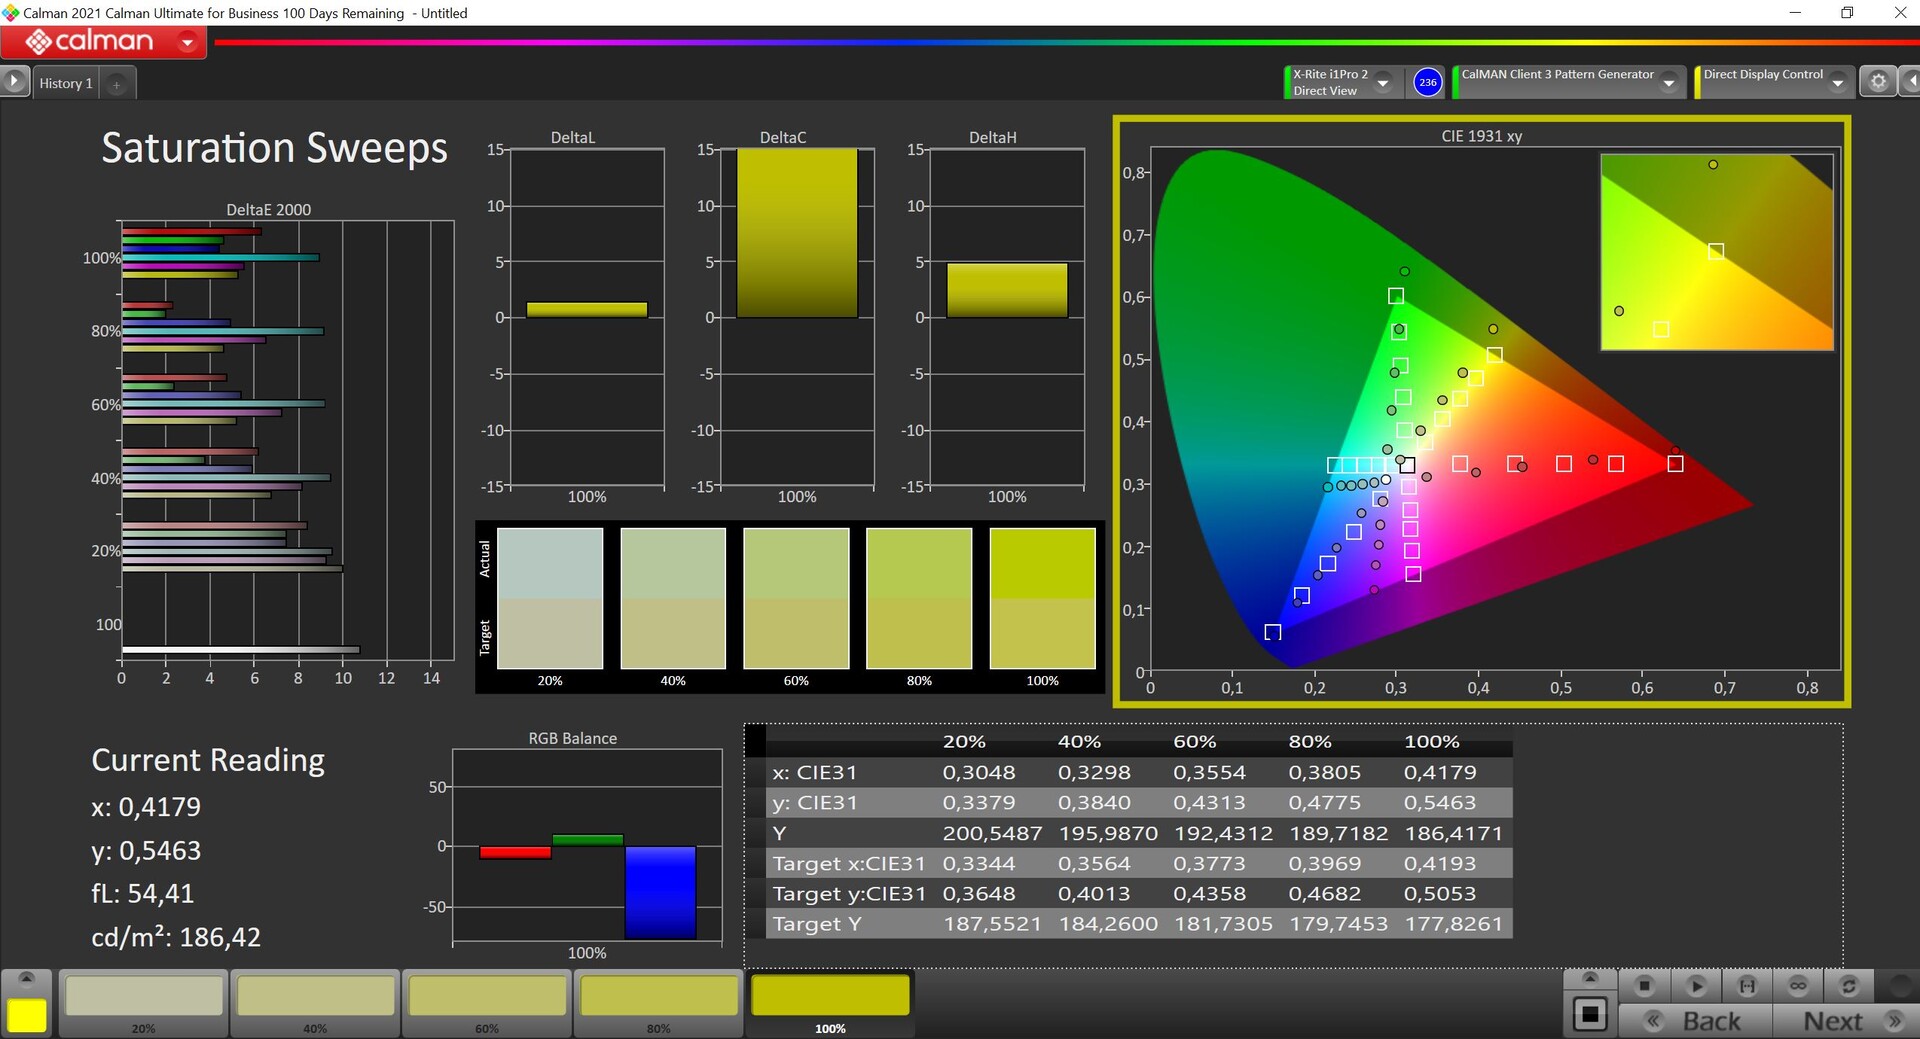
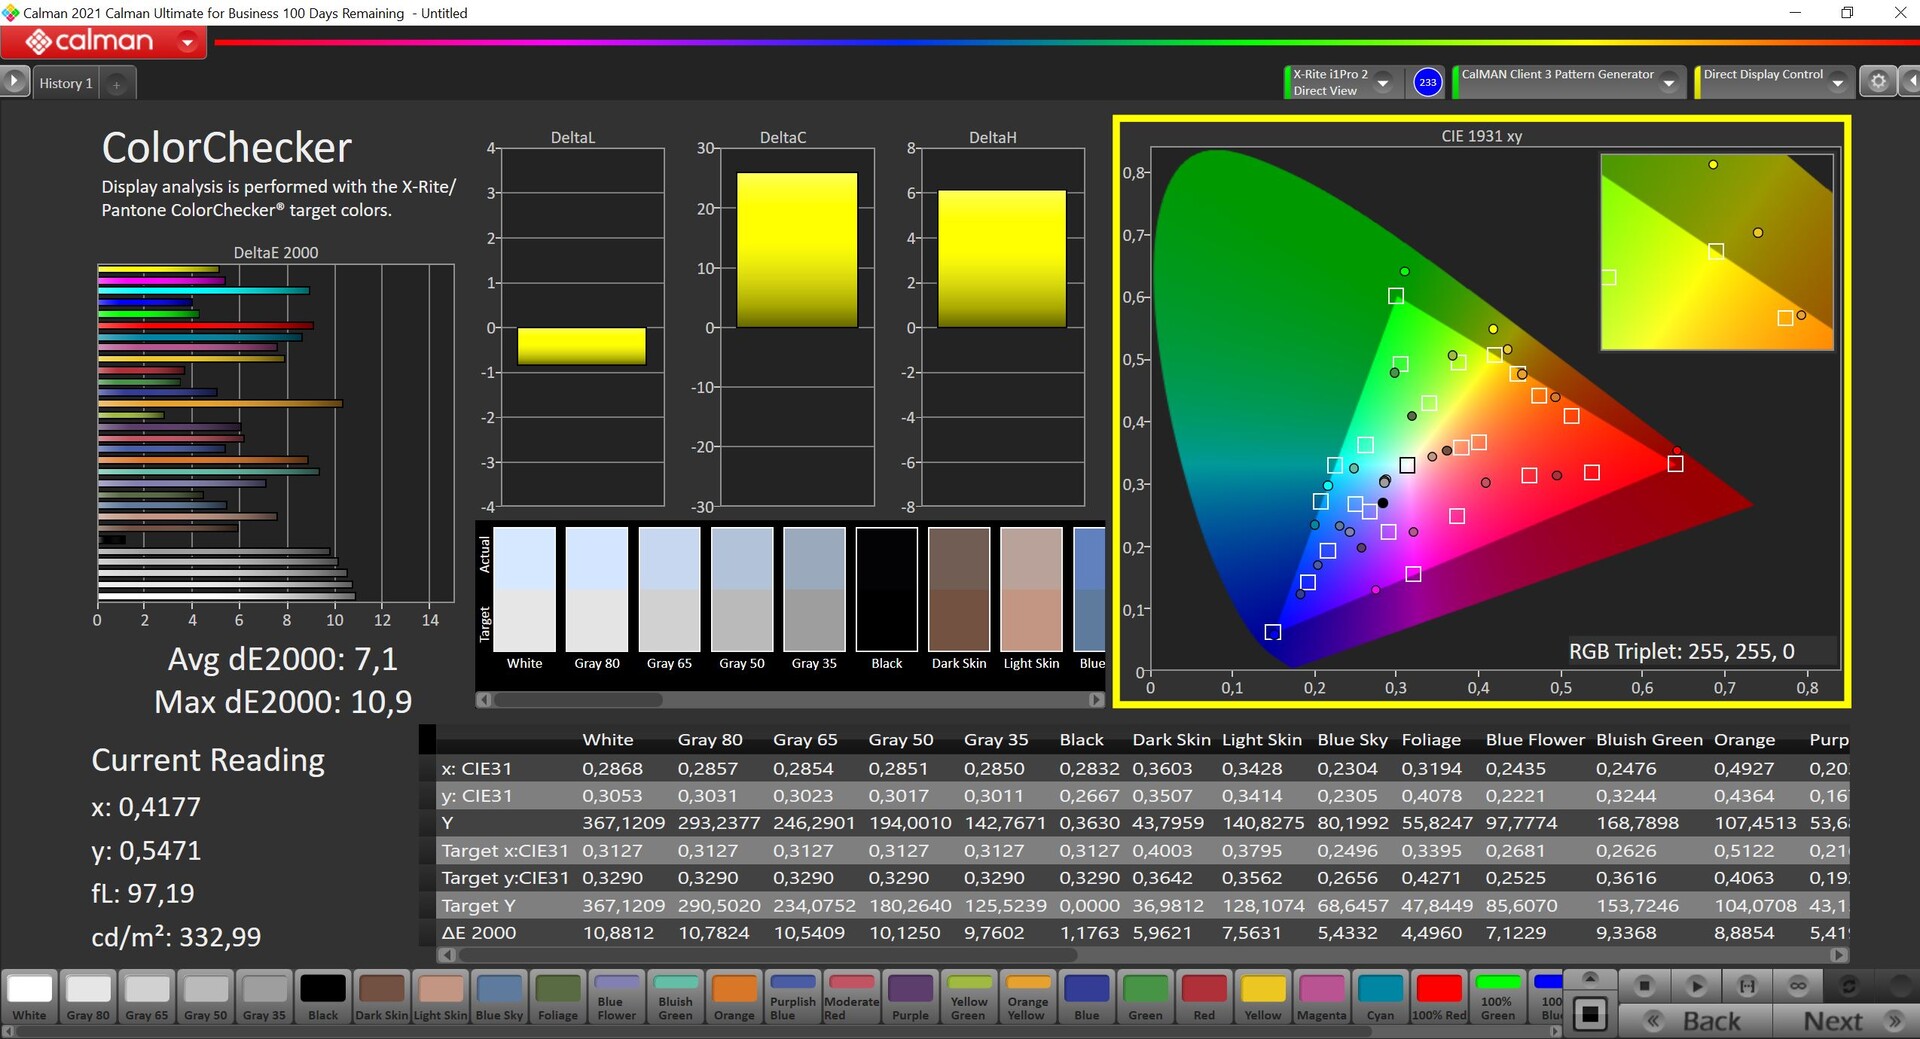
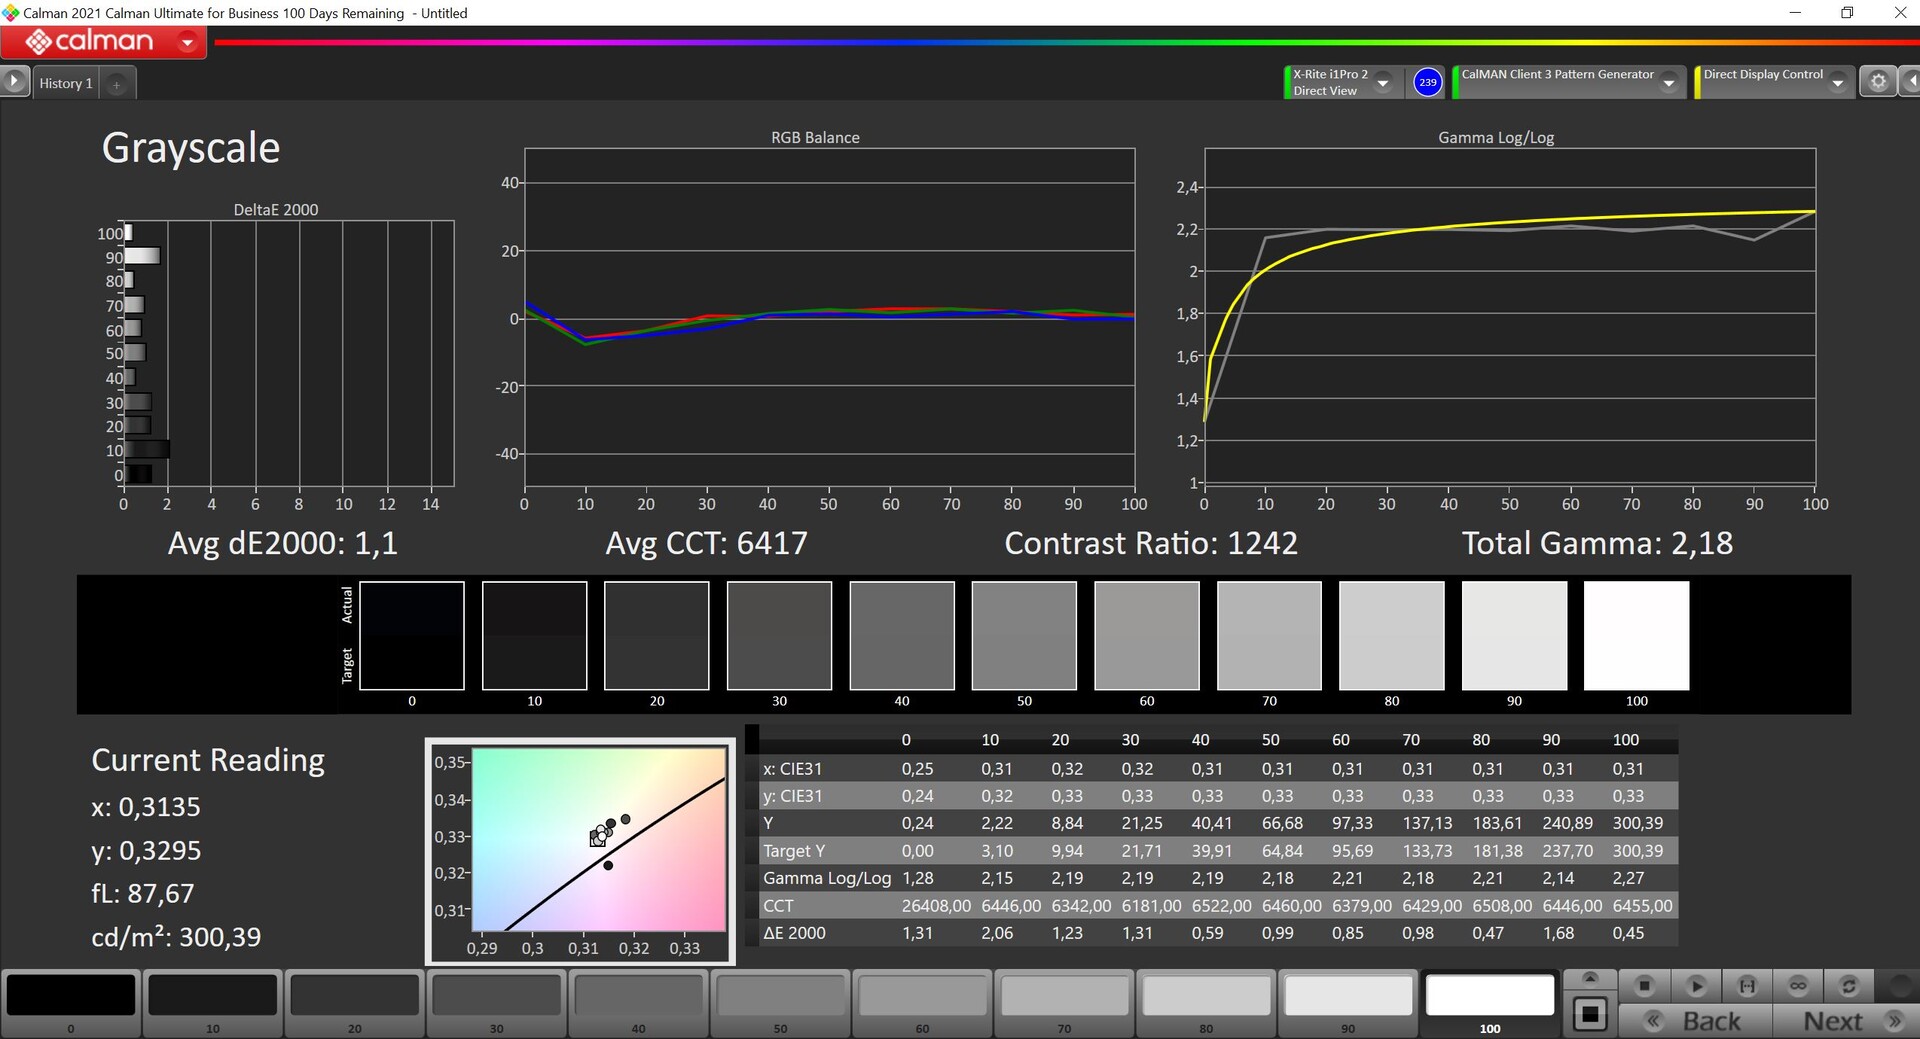
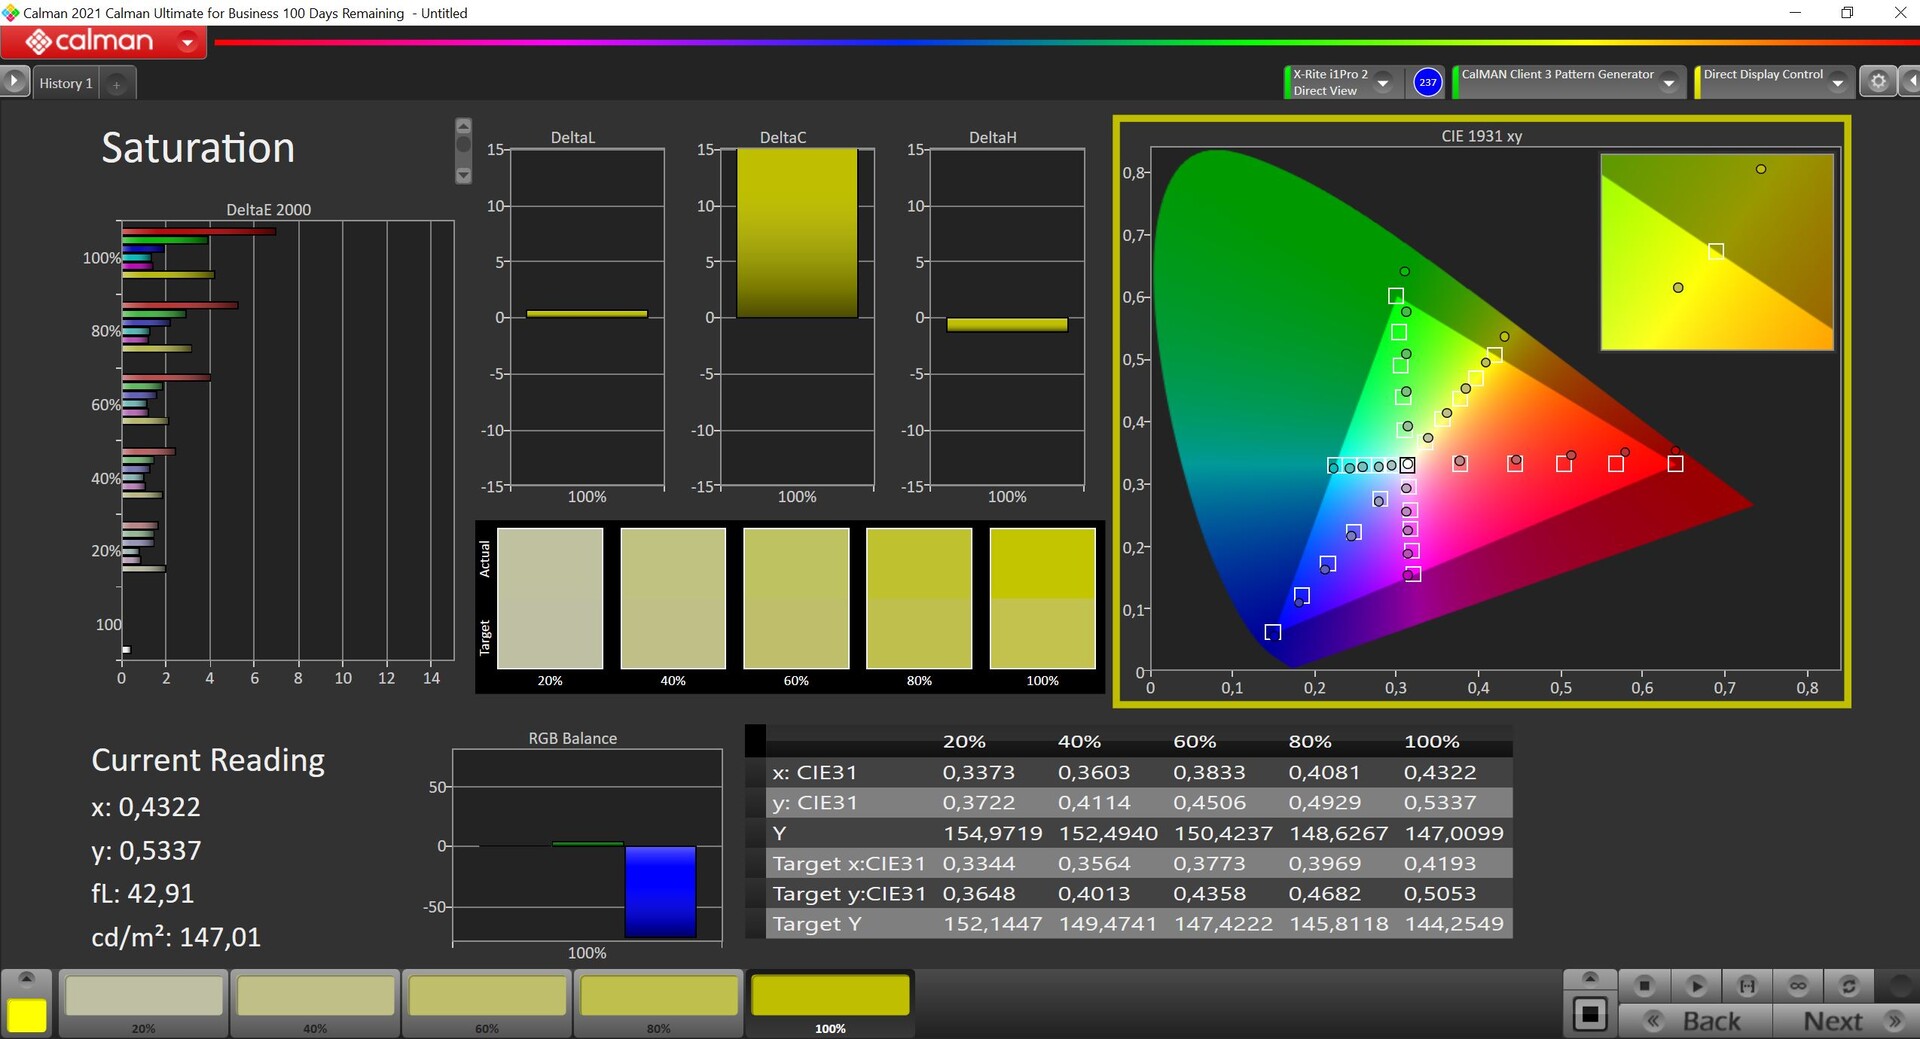
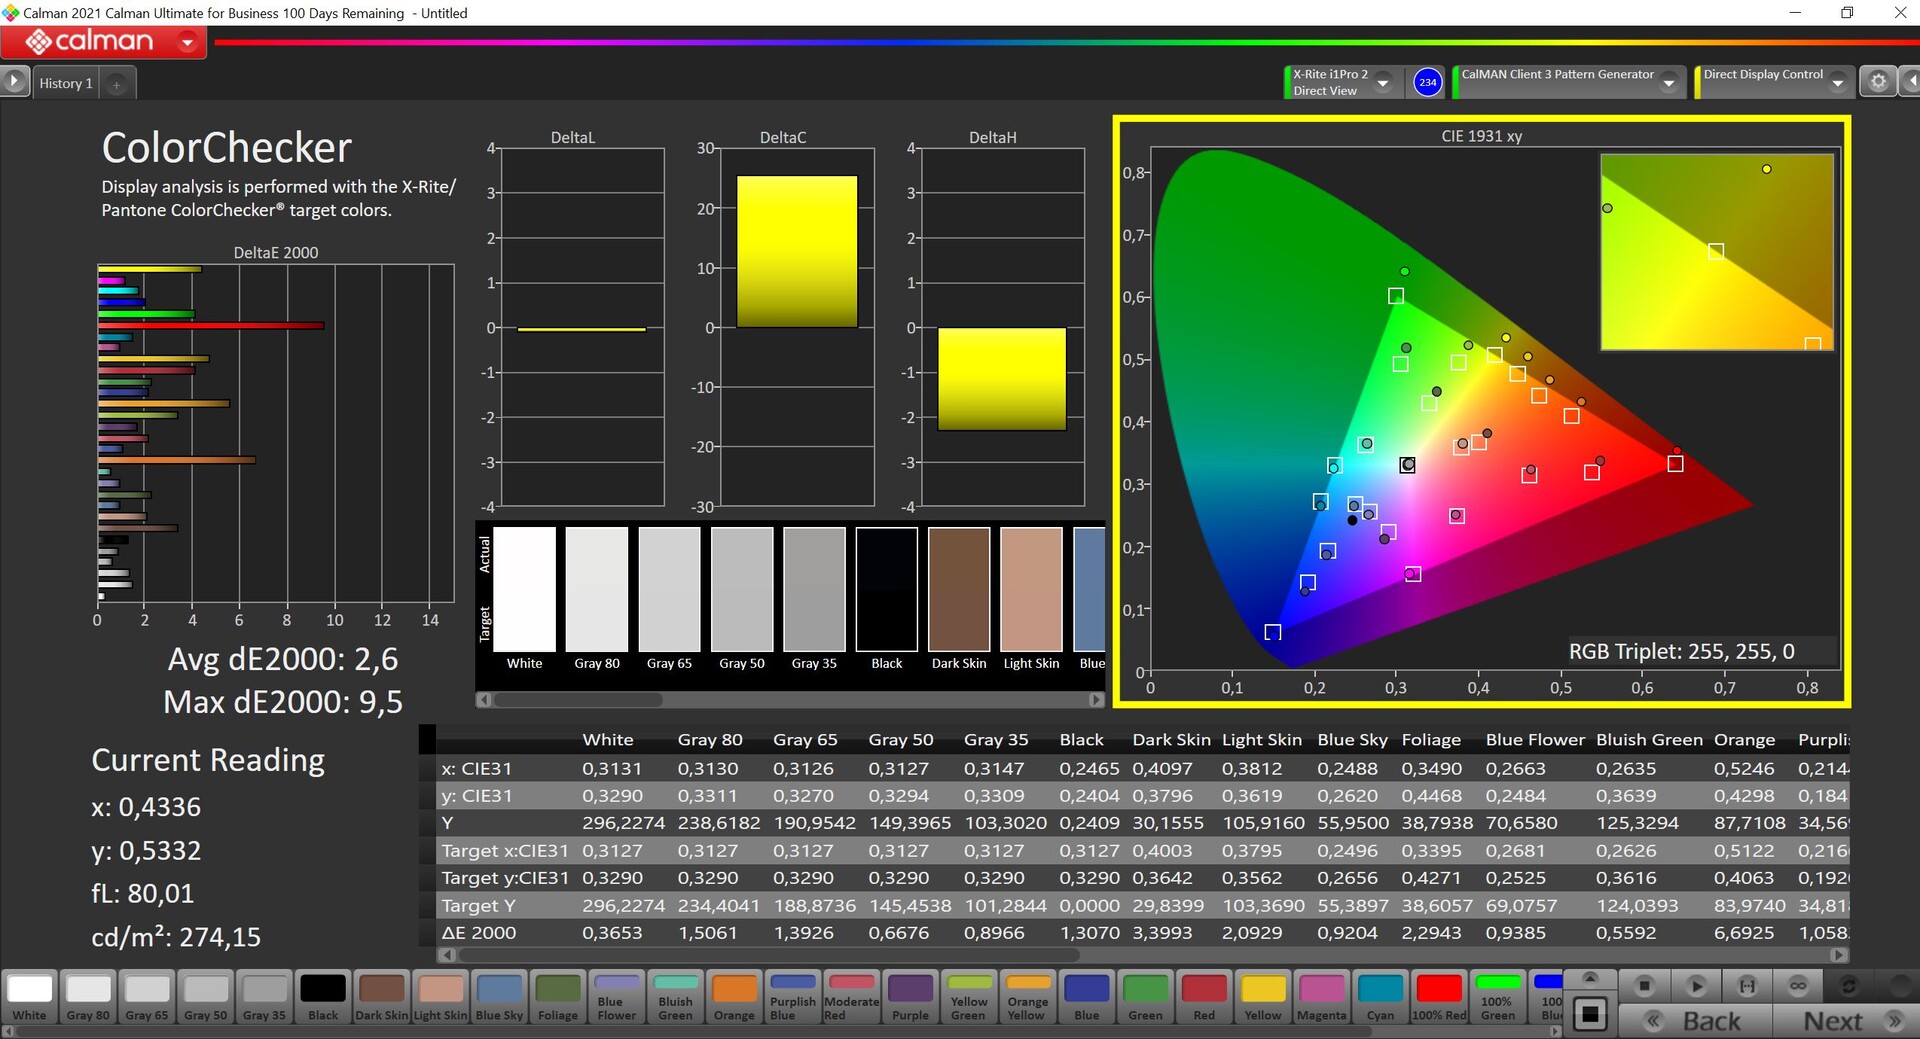
8.4英寸的IPS面板提供了2,560 x 1,600像素的高分辨率(16:10,WQHD),但只有60 Hz。主观的画面印象非常好,所有内容都很清晰。此外,明亮的表面看起来没有颗粒感。然而,也有一个明显的蓝色偏移,颜色整体看起来非常冷。我们的分析证实了这一点,但制造商设法实现了宣传的250cd/m²的亮度。事实上,我们的样品的平均亮度略高于360 cd/m²,最大亮度几乎达到390 cd/m²。黑值也同样不错,最大对比度超过1300:1。
然而,颜色的准确性还有待提高,即使在我们的校准之后,仍然有很大的偏差。灰度和偏色包括色温都在控制之中,但亮度下降了大约70cd/m²。竞争对手总体上提供了更好的速率,在响应时间方面也是如此。我们无法检测到PWM。视角的稳定性很好,但由于高反射的触摸屏,在户外有反射的问题。

| |||||||||||||||||||||||||
Brightness Distribution: 89 %
Center on Battery: 369 cd/m²
Contrast: 1318:1 (Black: 0.28 cd/m²)
ΔE ColorChecker Calman: 7.1 | ∀{0.5-29.43 Ø4.71}
calibrated: 2.6
ΔE Greyscale Calman: 8.3 | ∀{0.09-98 Ø4.96}
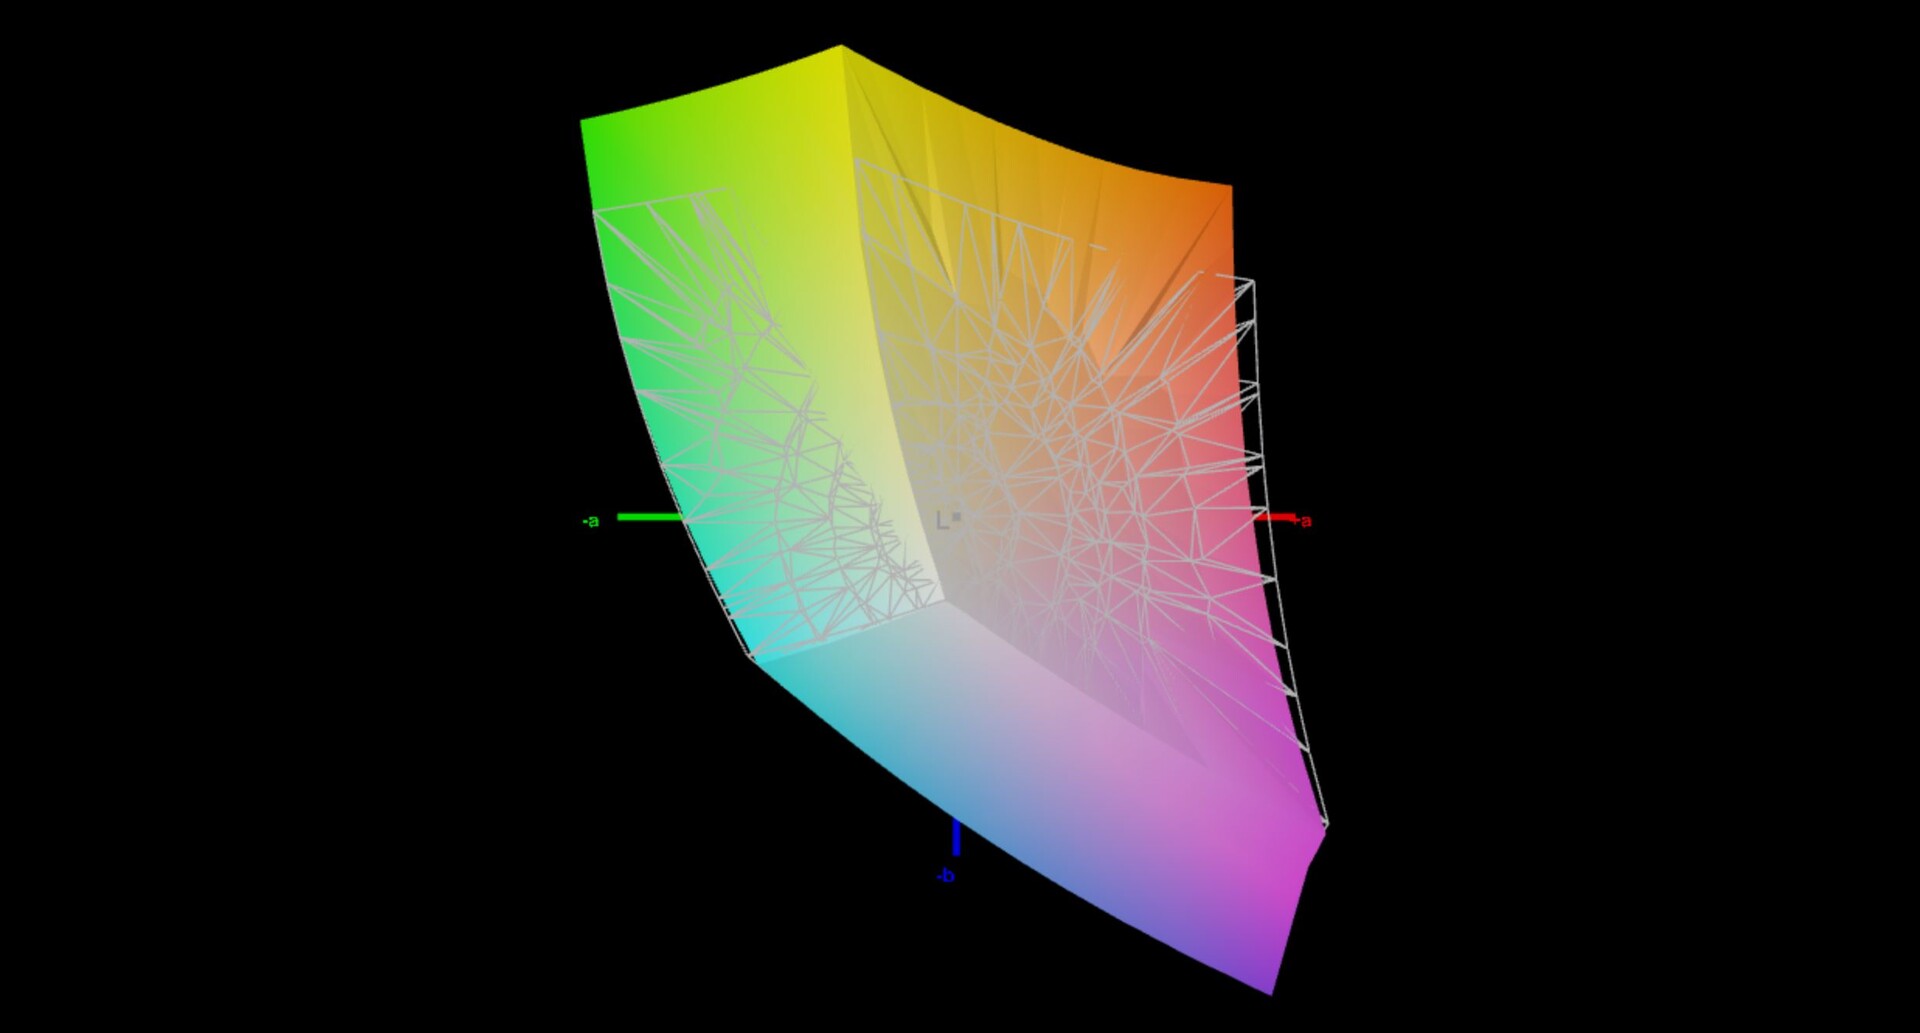
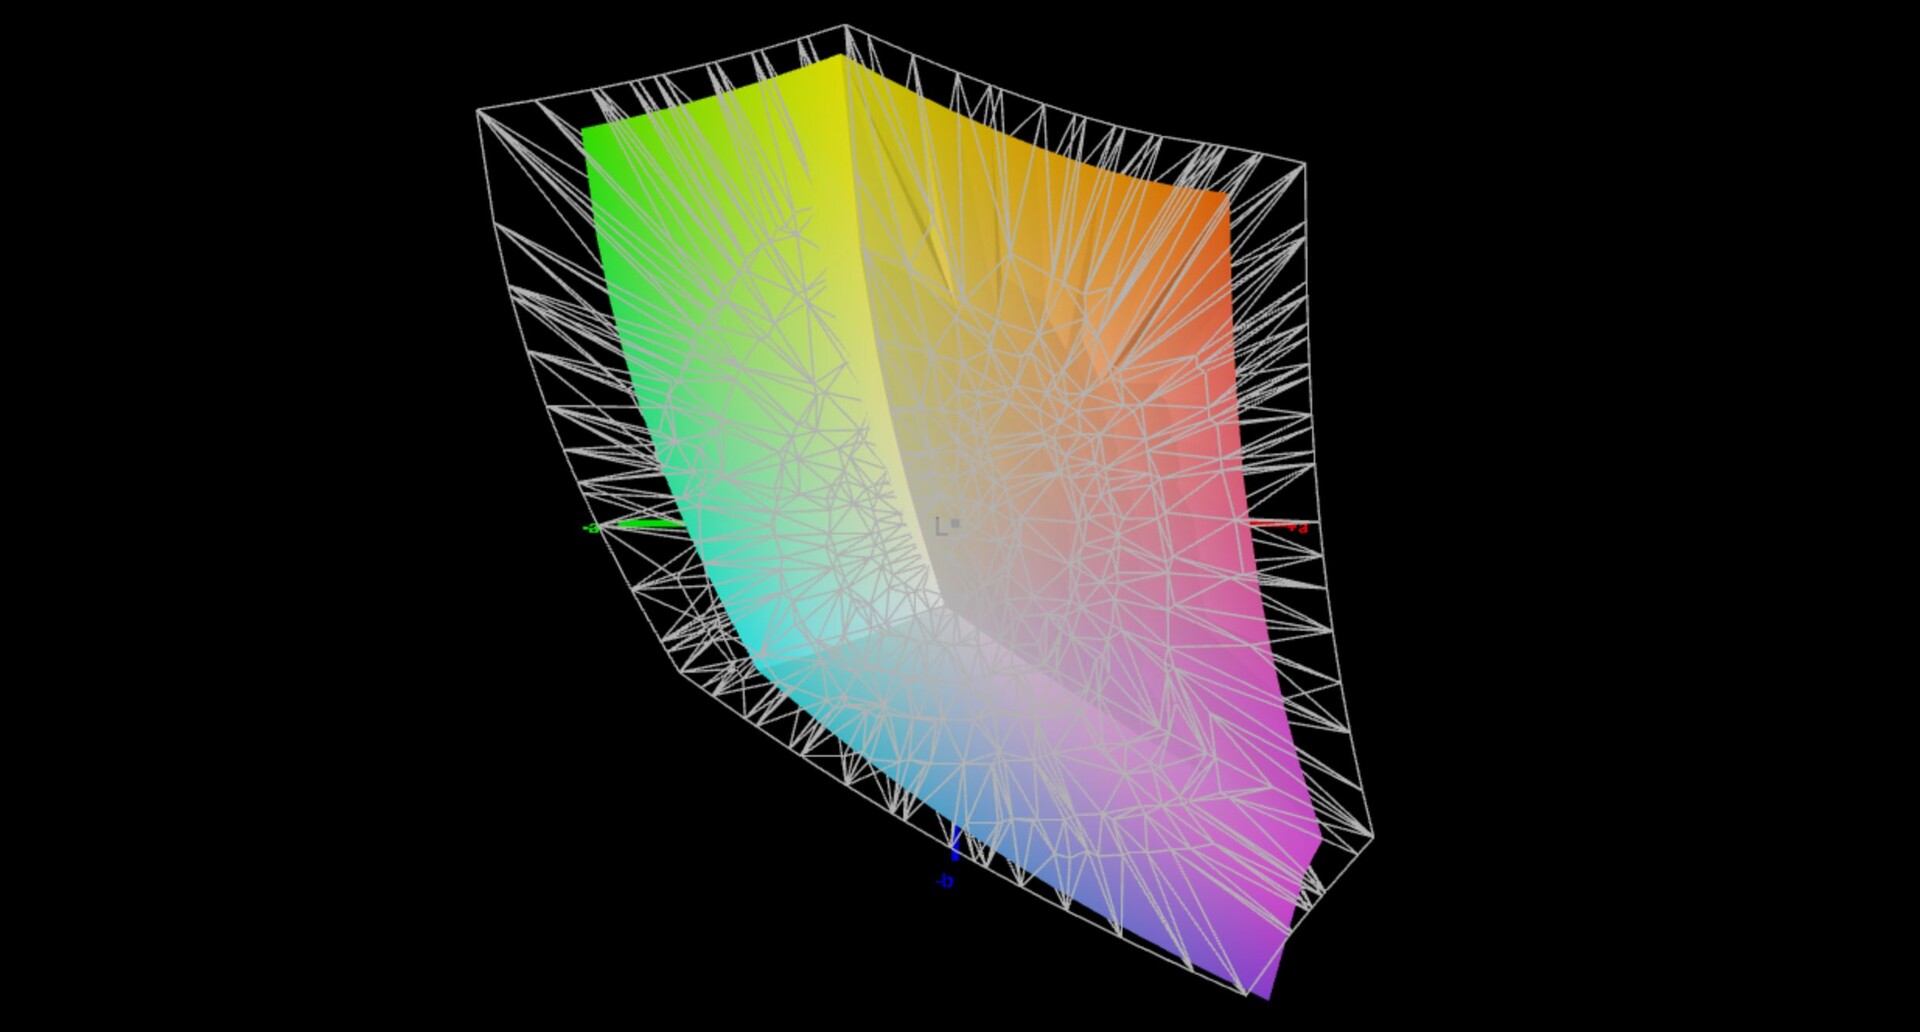
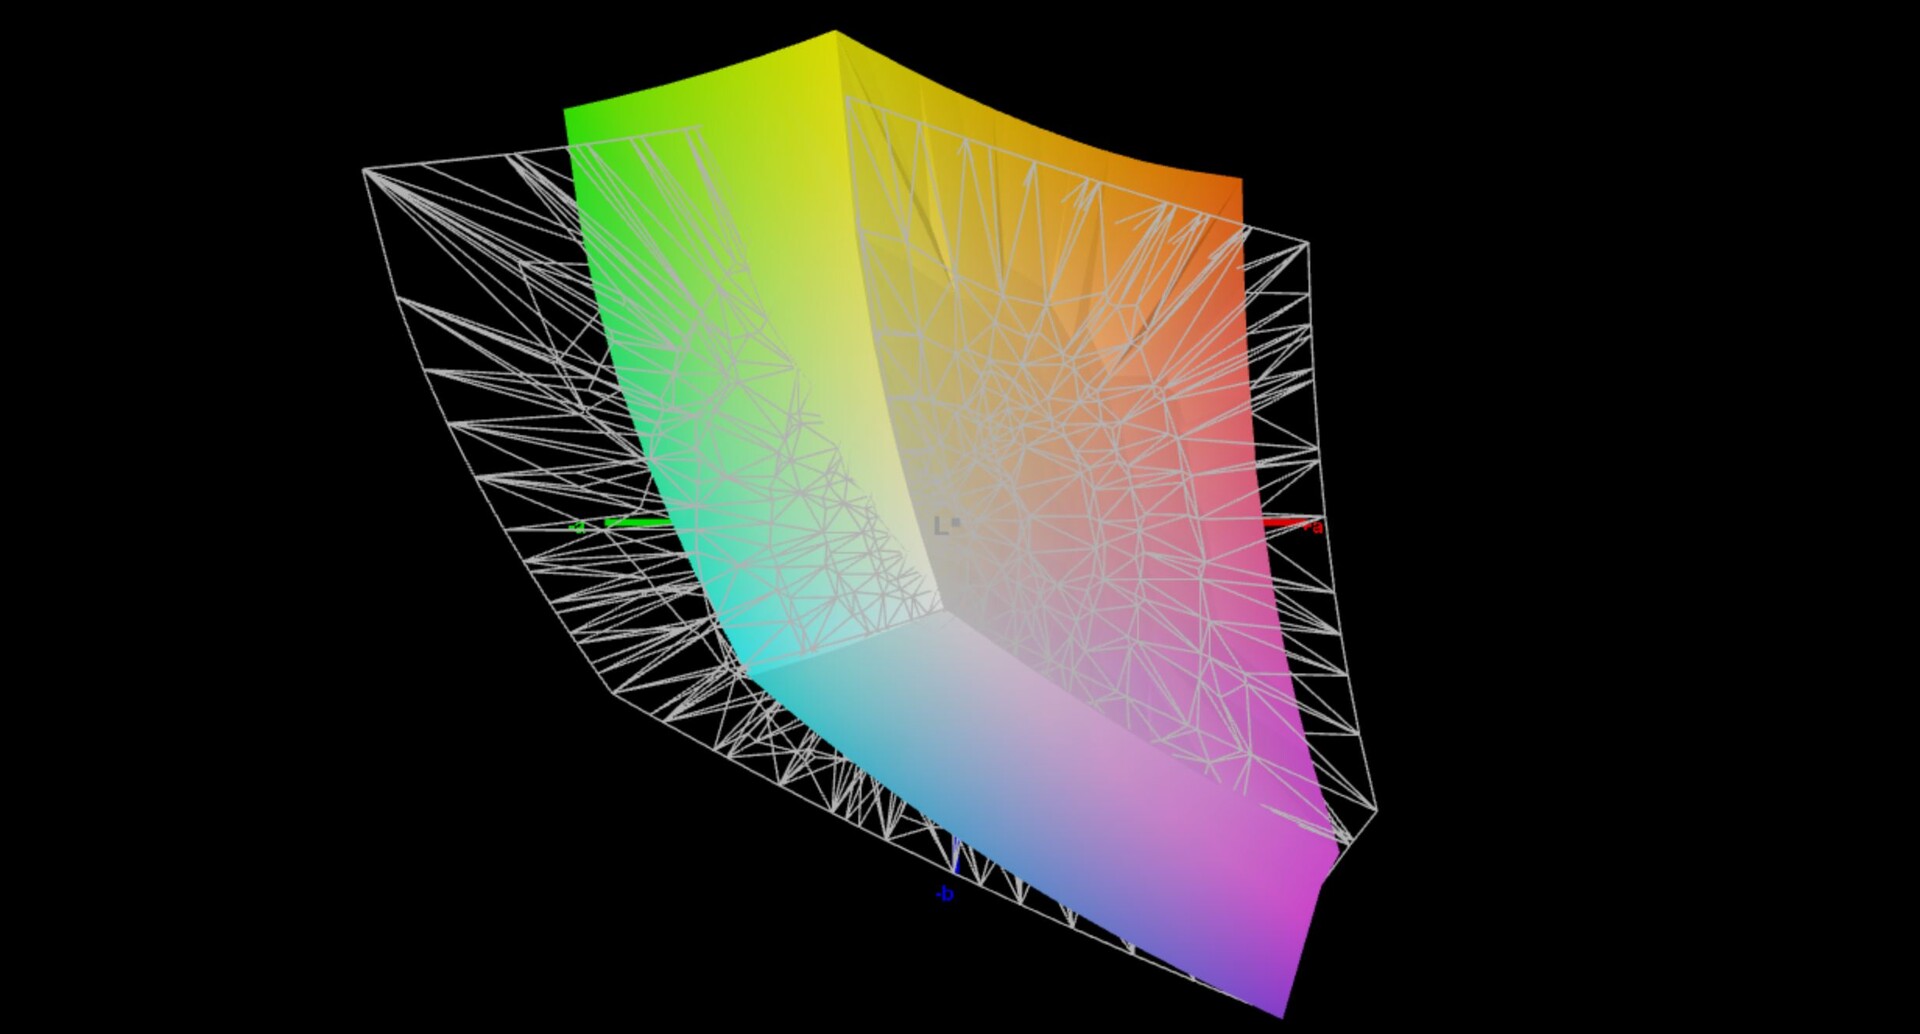
71.1% AdobeRGB 1998 (Argyll 3D)
97% sRGB (Argyll 3D)
75.4% Display P3 (Argyll 3D)
Gamma: 2.01
CCT: 8838 K
| One Netbook XPlayer 2 FLQ8423, IPS, 2560x1600, 8.4" | Asus ROG Ally Z1 Extreme TL070FVSX01-0, IPS, 1920x1080, 7" | Valve Steam Deck 512 GB LCD 1280x800, 7" | GPD Win 4 G1618-04, IPS, 1920x1080, 6" | GPD Win Max 2 Toshiba HX_10.1_LCD, IPS, 2560x1600, 10.1" | GPD Pocket 3 Digital Flat Panel, IPS, 1920x1200, 8" | |
|---|---|---|---|---|---|---|
| Display | -8% | -10% | -6% | -27% | ||
| Display P3 Coverage (%) | 75.4 | 65.6 -13% | 63.1 -16% | 69.8 -7% | 51.1 -32% | |
| sRGB Coverage (%) | 97 | 92.1 -5% | 92 -5% | 91 -6% | 74.7 -23% | |
| AdobeRGB 1998 Coverage (%) | 71.1 | 67.9 -5% | 64.6 -9% | 66.6 -6% | 52.8 -26% | |
| Response Times | 73% | 27% | 18% | 30% | -19% | |
| Response Time Grey 50% / Grey 80% * (ms) | 36.8 ? | 10.5 ? 71% | 30.1 ? 18% | 26.8 ? 27% | 21.2 ? 42% | 37.2 ? -1% |
| Response Time Black / White * (ms) | 22.8 ? | 6 ? 74% | 14.5 ? 36% | 20.9 ? 8% | 18.7 ? 18% | 31.2 ? -37% |
| PWM Frequency (Hz) | 1080 ? | |||||
| Screen | 18% | 8% | -4% | 7% | 2% | |
| Brightness middle (cd/m²) | 369 | 513 39% | 517 40% | 413.1 12% | 396.7 8% | 438.4 19% |
| Brightness (cd/m²) | 363 | 474 31% | 524 44% | 407 12% | 381 5% | 421 16% |
| Brightness Distribution (%) | 89 | 84 -6% | 97 9% | 81 -9% | 89 0% | 92 3% |
| Black Level * (cd/m²) | 0.28 | 0.38 -36% | 0.47 -68% | 0.39 -39% | 0.36 -29% | 0.4 -43% |
| Contrast (:1) | 1318 | 1350 2% | 1100 -17% | 1059 -20% | 1102 -16% | 1096 -17% |
| Colorchecker dE 2000 * | 7.1 | 3.7 48% | 5.7 20% | 6.97 2% | 6.31 11% | 5.02 29% |
| Colorchecker dE 2000 max. * | 10.9 | 8.3 24% | 10.5 4% | 14.11 -29% | 10.23 6% | 9.59 12% |
| Colorchecker dE 2000 calibrated * | 2.6 | 1.24 52% | 1.44 45% | 4.05 -56% | ||
| Greyscale dE 2000 * | 8.3 | 5.1 39% | 5.7 31% | 9.9 -19% | 5.5 34% | 4 52% |
| Gamma | 2.01 109% | 2.14 103% | 2.18 101% | 2.04 108% | 2.17 101% | 2.29 96% |
| CCT | 8838 74% | 7732 84% | 7733 84% | 9571 68% | 7502 87% | 7087 92% |
| Total Average (Program / Settings) | 28% /
20% | 18% /
12% | 1% /
-2% | 10% /
8% | -15% /
-7% |
* ... smaller is better
Display Response Times
| ↔ Response Time Black to White | ||
|---|---|---|
| 22.8 ms ... rise ↗ and fall ↘ combined | ↗ 10.4 ms rise | 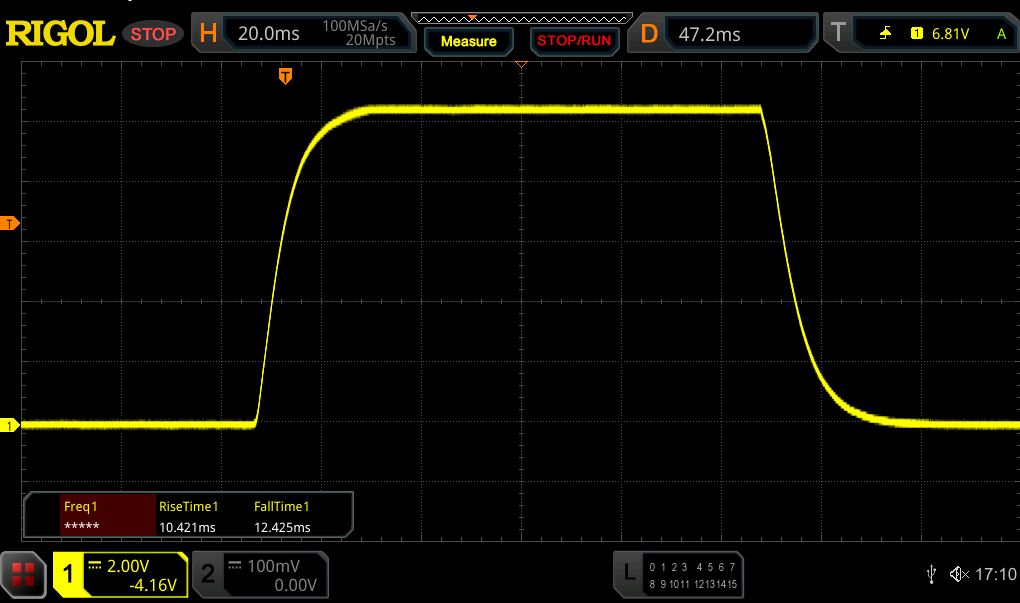 |
| ↘ 12.4 ms fall | ||
| The screen shows good response rates in our tests, but may be too slow for competitive gamers. In comparison, all tested devices range from 0.1 (minimum) to 240 (maximum) ms. » 51 % of all devices are better. This means that the measured response time is worse than the average of all tested devices (19.8 ms). | ||
| ↔ Response Time 50% Grey to 80% Grey | ||
| 36.8 ms ... rise ↗ and fall ↘ combined | ↗ 16.9 ms rise | 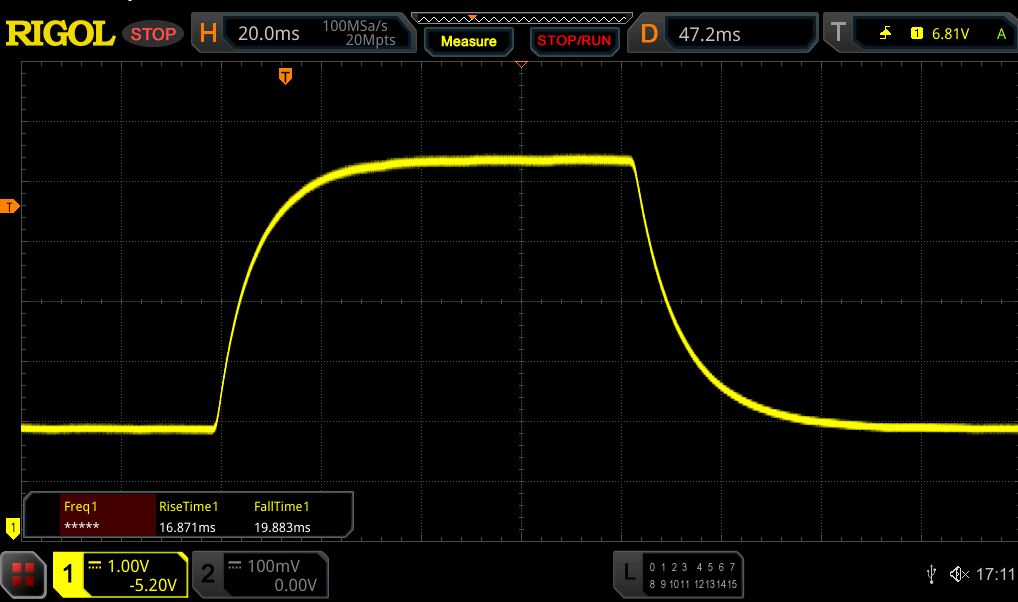 |
| ↘ 19.9 ms fall | ||
| The screen shows slow response rates in our tests and will be unsatisfactory for gamers. In comparison, all tested devices range from 0.165 (minimum) to 636 (maximum) ms. » 53 % of all devices are better. This means that the measured response time is worse than the average of all tested devices (30.9 ms). | ||
Screen Flickering / PWM (Pulse-Width Modulation)
| Screen flickering / PWM not detected | 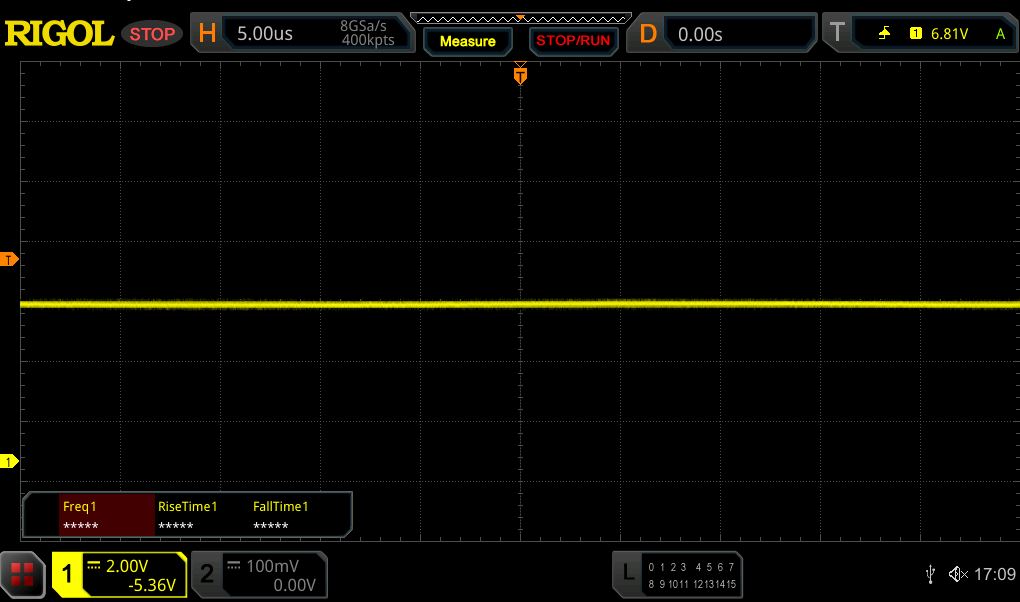 | ||
In comparison: 52 % of all tested devices do not use PWM to dim the display. If PWM was detected, an average of 7748 (minimum: 5 - maximum: 343500) Hz was measured. | |||
性能 - AMD Zen3+
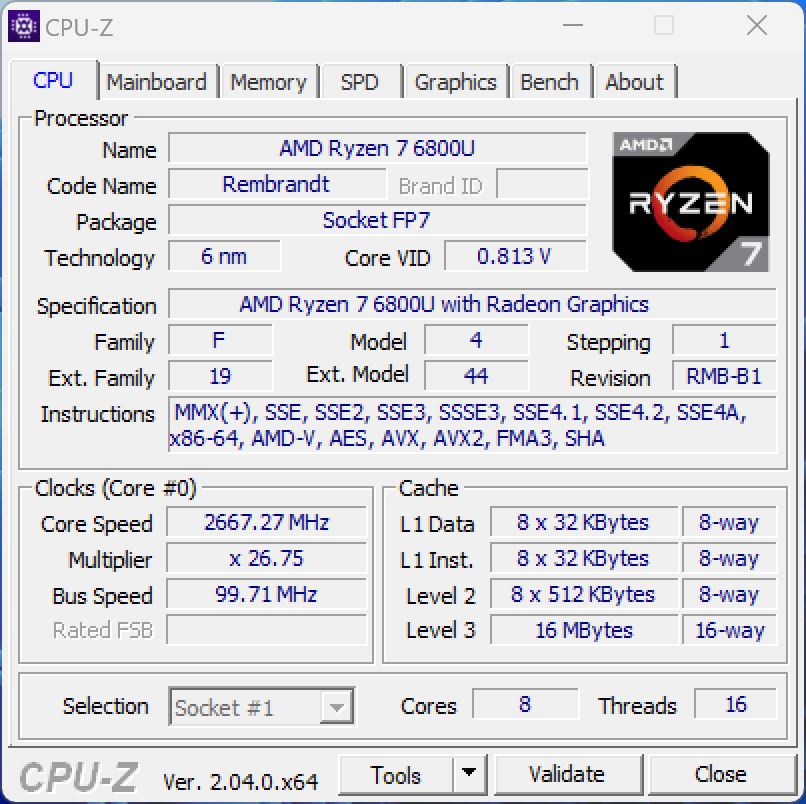
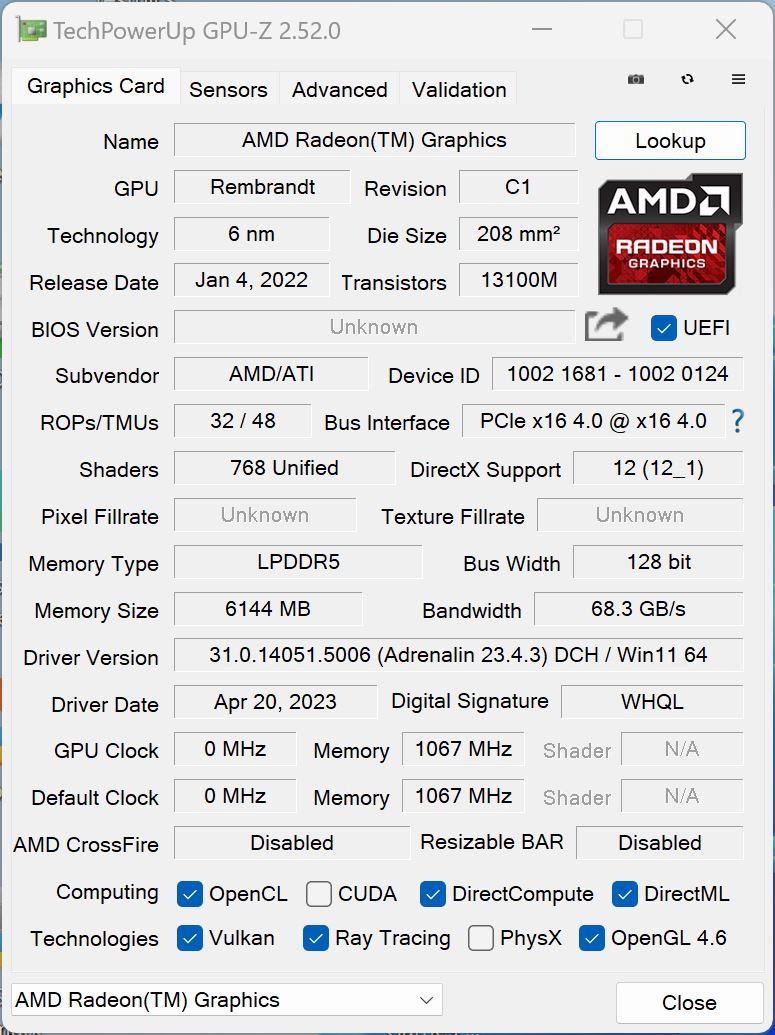
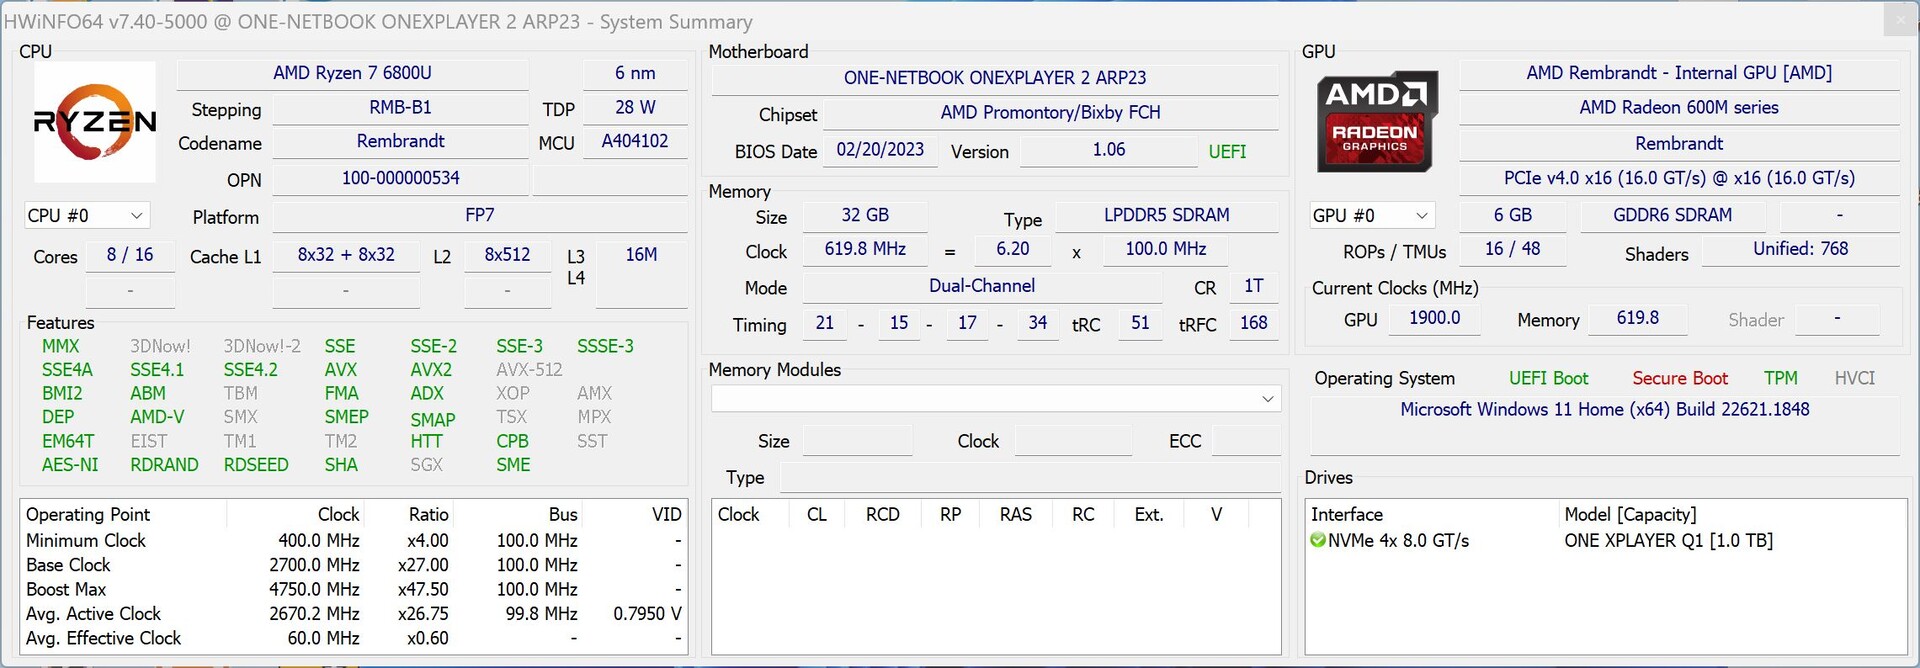
我们在以下基准和测量中默认使用28瓦的TDP,这是最高的性能值。的 AMD Ryzen 7 6800U提供8个Zen3+核心,多核心性能也非常好,最重要的是稳定。然而,在所有基准测试中,单核性能低于平均水平,但这几乎没有被注意到,至少在日常使用中。在这里,OneXPlayer仍然反应灵敏,特别是当你还在外部屏幕上使用它时(最好是通过USB-C),那么你可以把它当作一台完全正常的PC来使用。
Radeon 680M的图形性能完全满足我们的期望,也与GPD Win4、the ROG Ally与新的 Ryzen Z1 Extreme然而,在CPU和GPU测试中都更快。在长时间的负载以及电池模式下,OneXPlayer 2的性能没有下降。
1TB固态硬盘在出厂时被分成两个分区(首次启动后有409GB+499GB空闲),PCIe 3.0 x4固态硬盘的传输率在3GB/s左右,很不错。此外,即使在较长的负载下,这里的性能仍然稳定。
Cinebench R15 Multi Loop
Cinebench R23: Multi Core | Single Core
Cinebench R20: CPU (Multi Core) | CPU (Single Core)
Cinebench R15: CPU Multi 64Bit | CPU Single 64Bit
Blender: v2.79 BMW27 CPU
7-Zip 18.03: 7z b 4 | 7z b 4 -mmt1
Geekbench 5.5: Multi-Core | Single-Core
HWBOT x265 Benchmark v2.2: 4k Preset
LibreOffice : 20 Documents To PDF
| CPU Performance rating | |
| Average of class Multimedia | |
| Asus ROG Ally Z1 Extreme | |
| GPD Win 4 | |
| Average AMD Ryzen 7 6800U | |
| GPD Win Max 2 | |
| One Netbook XPlayer 2 | |
| GPD Pocket 3 -2! | |
| Cinebench R23 / Multi Core | |
| Average of class Multimedia (4861 - 33362, n=65, last 2 years) | |
| Asus ROG Ally Z1 Extreme | |
| Average AMD Ryzen 7 6800U (9130 - 11741, n=7) | |
| GPD Win 4 | |
| One Netbook XPlayer 2 | |
| GPD Win Max 2 | |
| GPD Pocket 3 | |
| Cinebench R23 / Single Core | |
| Average of class Multimedia (1128 - 2459, n=64, last 2 years) | |
| GPD Win Max 2 | |
| Asus ROG Ally Z1 Extreme | |
| GPD Win 4 | |
| Average AMD Ryzen 7 6800U (878 - 1534, n=7) | |
| GPD Pocket 3 | |
| One Netbook XPlayer 2 | |
| Cinebench R20 / CPU (Multi Core) | |
| Average of class Multimedia (1887 - 12912, n=56, last 2 years) | |
| Asus ROG Ally Z1 Extreme | |
| Average AMD Ryzen 7 6800U (3529 - 4574, n=8) | |
| GPD Win 4 | |
| One Netbook XPlayer 2 | |
| GPD Win Max 2 | |
| GPD Pocket 3 | |
| Cinebench R20 / CPU (Single Core) | |
| Average of class Multimedia (425 - 853, n=56, last 2 years) | |
| Asus ROG Ally Z1 Extreme | |
| GPD Win Max 2 | |
| GPD Win 4 | |
| Average AMD Ryzen 7 6800U (341 - 602, n=8) | |
| GPD Pocket 3 | |
| One Netbook XPlayer 2 | |
| Cinebench R15 / CPU Multi 64Bit | |
| Average of class Multimedia (856 - 5224, n=60, last 2 years) | |
| Asus ROG Ally Z1 Extreme | |
| GPD Win 4 | |
| Average AMD Ryzen 7 6800U (1463 - 1979, n=7) | |
| One Netbook XPlayer 2 | |
| GPD Win Max 2 | |
| GPD Pocket 3 | |
| GPD Pocket 3 | |
| Cinebench R15 / CPU Single 64Bit | |
| Average of class Multimedia (184.8 - 326, n=58, last 2 years) | |
| Asus ROG Ally Z1 Extreme | |
| GPD Win Max 2 | |
| GPD Win 4 | |
| Average AMD Ryzen 7 6800U (142.6 - 246, n=6) | |
| GPD Pocket 3 | |
| GPD Pocket 3 | |
| One Netbook XPlayer 2 | |
| Blender / v2.79 BMW27 CPU | |
| GPD Pocket 3 | |
| GPD Win Max 2 | |
| One Netbook XPlayer 2 | |
| GPD Win 4 | |
| Average AMD Ryzen 7 6800U (272 - 347, n=7) | |
| Average of class Multimedia (100 - 557, n=57, last 2 years) | |
| Asus ROG Ally Z1 Extreme | |
| 7-Zip 18.03 / 7z b 4 | |
| Asus ROG Ally Z1 Extreme | |
| Average of class Multimedia (26062 - 130368, n=54, last 2 years) | |
| GPD Win 4 | |
| Average AMD Ryzen 7 6800U (40058 - 53934, n=6) | |
| One Netbook XPlayer 2 | |
| GPD Win Max 2 | |
| GPD Pocket 3 | |
| 7-Zip 18.03 / 7z b 4 -mmt1 | |
| Asus ROG Ally Z1 Extreme | |
| Average of class Multimedia (3666 - 7545, n=55, last 2 years) | |
| GPD Win Max 2 | |
| GPD Win 4 | |
| GPD Pocket 3 | |
| Average AMD Ryzen 7 6800U (3398 - 5511, n=6) | |
| One Netbook XPlayer 2 | |
| Geekbench 5.5 / Multi-Core | |
| Average of class Multimedia (4652 - 20422, n=55, last 2 years) | |
| Asus ROG Ally Z1 Extreme | |
| GPD Win 4 | |
| Average AMD Ryzen 7 6800U (6854 - 8935, n=9) | |
| One Netbook XPlayer 2 | |
| GPD Win Max 2 | |
| Geekbench 5.5 / Single-Core | |
| Average of class Multimedia (805 - 2974, n=55, last 2 years) | |
| Asus ROG Ally Z1 Extreme | |
| GPD Win Max 2 | |
| GPD Win 4 | |
| Average AMD Ryzen 7 6800U (926 - 1555, n=9) | |
| One Netbook XPlayer 2 | |
| HWBOT x265 Benchmark v2.2 / 4k Preset | |
| Average of class Multimedia (5.26 - 36.1, n=55, last 2 years) | |
| Asus ROG Ally Z1 Extreme | |
| Average AMD Ryzen 7 6800U (11.8 - 14.2, n=6) | |
| GPD Win 4 | |
| One Netbook XPlayer 2 | |
| GPD Win Max 2 | |
| GPD Pocket 3 | |
| LibreOffice / 20 Documents To PDF | |
| One Netbook XPlayer 2 | |
| Average AMD Ryzen 7 6800U (50.1 - 84.9, n=6) | |
| GPD Win 4 | |
| Average of class Multimedia (23.9 - 146.7, n=56, last 2 years) | |
| GPD Pocket 3 | |
| GPD Win Max 2 | |
| Asus ROG Ally Z1 Extreme | |
* ... smaller is better
AIDA64: FP32 Ray-Trace | FPU Julia | CPU SHA3 | CPU Queen | FPU SinJulia | FPU Mandel | CPU AES | CPU ZLib | FP64 Ray-Trace | CPU PhotoWorxx
| Performance rating | |
| Asus ROG Ally Z1 Extreme | |
| Average of class Multimedia | |
| Average AMD Ryzen 7 6800U | |
| GPD Win 4 | |
| One Netbook XPlayer 2 | |
| GPD Win Max 2 | |
| GPD Pocket 3 | |
| AIDA64 / FP32 Ray-Trace | |
| Asus ROG Ally Z1 Extreme | |
| Average of class Multimedia (2214 - 50388, n=53, last 2 years) | |
| Average AMD Ryzen 7 6800U (10902 - 12818, n=6) | |
| GPD Win 4 | |
| One Netbook XPlayer 2 | |
| GPD Pocket 3 | |
| GPD Win Max 2 | |
| AIDA64 / FPU Julia | |
| Asus ROG Ally Z1 Extreme | |
| Average of class Multimedia (12867 - 201874, n=53, last 2 years) | |
| Average AMD Ryzen 7 6800U (67503 - 84031, n=6) | |
| GPD Win 4 | |
| One Netbook XPlayer 2 | |
| GPD Pocket 3 | |
| GPD Win Max 2 | |
| AIDA64 / CPU SHA3 | |
| Asus ROG Ally Z1 Extreme | |
| Average of class Multimedia (626 - 8623, n=53, last 2 years) | |
| Average AMD Ryzen 7 6800U (2296 - 2818, n=6) | |
| GPD Win 4 | |
| One Netbook XPlayer 2 | |
| GPD Pocket 3 | |
| GPD Win Max 2 | |
| AIDA64 / CPU Queen | |
| Asus ROG Ally Z1 Extreme | |
| GPD Win 4 | |
| Average AMD Ryzen 7 6800U (62082 - 96306, n=6) | |
| Average of class Multimedia (13483 - 181505, n=40, last 2 years) | |
| GPD Win Max 2 | |
| One Netbook XPlayer 2 | |
| GPD Pocket 3 | |
| AIDA64 / FPU SinJulia | |
| Asus ROG Ally Z1 Extreme | |
| GPD Win 4 | |
| Average AMD Ryzen 7 6800U (7753 - 11982, n=6) | |
| Average of class Multimedia (886 - 28794, n=53, last 2 years) | |
| One Netbook XPlayer 2 | |
| GPD Win Max 2 | |
| GPD Pocket 3 | |
| AIDA64 / FPU Mandel | |
| Asus ROG Ally Z1 Extreme | |
| Average of class Multimedia (6395 - 105740, n=53, last 2 years) | |
| Average AMD Ryzen 7 6800U (37417 - 45748, n=6) | |
| GPD Win 4 | |
| One Netbook XPlayer 2 | |
| GPD Pocket 3 | |
| GPD Win Max 2 | |
| AIDA64 / CPU AES | |
| GPD Win 4 | |
| Average AMD Ryzen 7 6800U (50547 - 115681, n=6) | |
| One Netbook XPlayer 2 | |
| Asus ROG Ally Z1 Extreme | |
| Average of class Multimedia (8171 - 126790, n=53, last 2 years) | |
| GPD Pocket 3 | |
| GPD Win Max 2 | |
| AIDA64 / CPU ZLib | |
| Asus ROG Ally Z1 Extreme | |
| Average of class Multimedia (143.8 - 2022, n=53, last 2 years) | |
| Average AMD Ryzen 7 6800U (554 - 755, n=6) | |
| GPD Win 4 | |
| One Netbook XPlayer 2 | |
| GPD Win Max 2 | |
| GPD Pocket 3 | |
| AIDA64 / FP64 Ray-Trace | |
| Asus ROG Ally Z1 Extreme | |
| Average of class Multimedia (1014 - 26875, n=53, last 2 years) | |
| Average AMD Ryzen 7 6800U (5825 - 6694, n=6) | |
| GPD Win 4 | |
| One Netbook XPlayer 2 | |
| GPD Pocket 3 | |
| GPD Win Max 2 | |
| AIDA64 / CPU PhotoWorxx | |
| Average of class Multimedia (8187 - 88154, n=53, last 2 years) | |
| Asus ROG Ally Z1 Extreme | |
| GPD Win Max 2 | |
| GPD Pocket 3 | |
| GPD Win 4 | |
| One Netbook XPlayer 2 | |
| Average AMD Ryzen 7 6800U (24728 - 27274, n=6) | |
CrossMark: Overall | Productivity | Creativity | Responsiveness
| PCMark 10 / Score | |
| Average of class Multimedia (4325 - 10386, n=51, last 2 years) | |
| Asus ROG Ally Z1 Extreme | |
| GPD Win 4 | |
| Average AMD Ryzen 7 6800U, AMD Radeon 680M (5057 - 6639, n=7) | |
| GPD Win Max 2 | |
| GPD Pocket 3 | |
| One Netbook XPlayer 2 | |
| PCMark 10 / Essentials | |
| GPD Win Max 2 | |
| GPD Pocket 3 | |
| Average of class Multimedia (8025 - 11664, n=50, last 2 years) | |
| Asus ROG Ally Z1 Extreme | |
| GPD Win 4 | |
| Average AMD Ryzen 7 6800U, AMD Radeon 680M (8143 - 10766, n=6) | |
| One Netbook XPlayer 2 | |
| PCMark 10 / Productivity | |
| Average of class Multimedia (7323 - 18233, n=50, last 2 years) | |
| Asus ROG Ally Z1 Extreme | |
| GPD Win 4 | |
| Average AMD Ryzen 7 6800U, AMD Radeon 680M (6089 - 9328, n=6) | |
| GPD Pocket 3 | |
| GPD Win Max 2 | |
| One Netbook XPlayer 2 | |
| PCMark 10 / Digital Content Creation | |
| Average of class Multimedia (3651 - 16240, n=50, last 2 years) | |
| Asus ROG Ally Z1 Extreme | |
| GPD Win 4 | |
| Average AMD Ryzen 7 6800U, AMD Radeon 680M (6066 - 8144, n=6) | |
| One Netbook XPlayer 2 | |
| GPD Win Max 2 | |
| GPD Pocket 3 | |
| CrossMark / Overall | |
| Average of class Multimedia (866 - 2728, n=59, last 2 years) | |
| Asus ROG Ally Z1 Extreme | |
| GPD Win Max 2 | |
| GPD Win 4 | |
| Average AMD Ryzen 7 6800U, AMD Radeon 680M (1009 - 1575, n=7) | |
| One Netbook XPlayer 2 | |
| CrossMark / Productivity | |
| Average of class Multimedia (931 - 2489, n=59, last 2 years) | |
| Asus ROG Ally Z1 Extreme | |
| GPD Win Max 2 | |
| GPD Win 4 | |
| Average AMD Ryzen 7 6800U, AMD Radeon 680M (971 - 1596, n=7) | |
| One Netbook XPlayer 2 | |
| CrossMark / Creativity | |
| Average of class Multimedia (907 - 3465, n=59, last 2 years) | |
| Asus ROG Ally Z1 Extreme | |
| GPD Win Max 2 | |
| GPD Win 4 | |
| Average AMD Ryzen 7 6800U, AMD Radeon 680M (1054 - 1686, n=7) | |
| One Netbook XPlayer 2 | |
| CrossMark / Responsiveness | |
| GPD Win Max 2 | |
| Average of class Multimedia (605 - 2024, n=59, last 2 years) | |
| GPD Win 4 | |
| Asus ROG Ally Z1 Extreme | |
| Average AMD Ryzen 7 6800U, AMD Radeon 680M (994 - 1473, n=7) | |
| One Netbook XPlayer 2 | |
| PCMark 10 Score | 5057 points | |
Help | ||
| AIDA64 / Memory Copy | |
| Asus ROG Ally Z1 Extreme | |
| Average of class Multimedia (11299 - 132135, n=53, last 2 years) | |
| GPD Win Max 2 | |
| GPD Pocket 3 | |
| GPD Win 4 | |
| Average AMD Ryzen 7 6800U (47010 - 52159, n=6) | |
| One Netbook XPlayer 2 | |
| AIDA64 / Memory Read | |
| Average of class Multimedia (11624 - 174586, n=53, last 2 years) | |
| GPD Win Max 2 | |
| GPD Pocket 3 | |
| Asus ROG Ally Z1 Extreme | |
| GPD Win 4 | |
| One Netbook XPlayer 2 | |
| Average AMD Ryzen 7 6800U (39197 - 45084, n=6) | |
| AIDA64 / Memory Write | |
| Asus ROG Ally Z1 Extreme | |
| Average of class Multimedia (11755 - 134998, n=53, last 2 years) | |
| GPD Win Max 2 | |
| GPD Pocket 3 | |
| GPD Win 4 | |
| One Netbook XPlayer 2 | |
| Average AMD Ryzen 7 6800U (48723 - 51117, n=6) | |
| AIDA64 / Memory Latency | |
| Average of class Multimedia (7 - 535, n=52, last 2 years) | |
| One Netbook XPlayer 2 | |
| Asus ROG Ally Z1 Extreme | |
| Average AMD Ryzen 7 6800U (106.3 - 123.1, n=6) | |
| GPD Win 4 | |
| GPD Win Max 2 | |
| GPD Pocket 3 | |
* ... smaller is better
| DPC Latencies / LatencyMon - interrupt to process latency (max), Web, Youtube, Prime95 | |
| One Netbook XPlayer 2 | |
| Asus ROG Ally Z1 Extreme | |
| GPD Win 4 | |
| GPD Pocket 3 | |
| GPD Win Max 2 | |
* ... smaller is better

| Drive Performance rating - Percent | |
| Average of class Multimedia | |
| GPD Win Max 2 | |
| GPD Pocket 3 | |
| GPD Win 4 | |
| One Netbook XPlayer 2 | |
| Asus ROG Ally Z1 Extreme | |
| Global Average -3 | |
* ... smaller is better
Continuous Read: DiskSpd Read Loop, Queue Depth 8
| 3DMark Performance rating - Percent | |
| Average of class Multimedia | |
| Asus ROG Ally Z1 Extreme | |
| GPD Win 4 | |
| One Netbook XPlayer 2 | |
| Average AMD Radeon 680M | |
| GPD Win Max 2 | |
| GPD Pocket 3 | |
| 3DMark 11 Performance | 9184 points | |
| 3DMark Fire Strike Score | 6490 points | |
| 3DMark Time Spy Score | 2673 points | |
Help | ||
| Blender / v3.3 Classroom HIP/AMD | |
| Average AMD Radeon 680M (270 - 555, n=34) | |
| One Netbook XPlayer 2 | |
| GPD Win 4 | |
| Blender / v3.3 Classroom CPU | |
| One Netbook XPlayer 2 | |
| GPD Win 4 | |
| Average AMD Radeon 680M (389 - 980, n=37) | |
| Average of class Multimedia (134.5 - 1042, n=61, last 2 years) | |
| Asus ROG Ally Z1 Extreme | |
* ... smaller is better
| Performance rating - Percent | |
| Average of class Multimedia | |
| Asus ROG Ally Z1 Extreme | |
| GPD Win 4 | |
| One Netbook XPlayer 2 | |
| GPD Win Max 2 | |
| GPD Pocket 3 | |
| The Witcher 3 - 1920x1080 Ultra Graphics & Postprocessing (HBAO+) | |
| Average of class Multimedia (11 - 107, n=5, last 2 years) | |
| Asus ROG Ally Z1 Extreme | |
| One Netbook XPlayer 2 | |
| GPD Win 4 | |
| GPD Win Max 2 | |
| GPD Pocket 3 | |
| GTA V - 1920x1080 Highest AA:4xMSAA + FX AF:16x | |
| Average of class Multimedia (7.92 - 141.6, n=53, last 2 years) | |
| Asus ROG Ally Z1 Extreme | |
| GPD Win 4 | |
| One Netbook XPlayer 2 | |
| GPD Win Max 2 | |
| GPD Pocket 3 | |
| Final Fantasy XV Benchmark - 1920x1080 High Quality | |
| Average of class Multimedia (7.61 - 144.4, n=56, last 2 years) | |
| Asus ROG Ally Z1 Extreme | |
| GPD Win 4 | |
| One Netbook XPlayer 2 | |
| GPD Win Max 2 | |
| GPD Pocket 3 | |
| Strange Brigade - 1920x1080 ultra AA:ultra AF:16 | |
| Average of class Multimedia (13.3 - 303, n=55, last 2 years) | |
| Asus ROG Ally Z1 Extreme | |
| GPD Win 4 | |
| One Netbook XPlayer 2 | |
| GPD Win Max 2 | |
| GPD Pocket 3 | |
| Dota 2 Reborn - 1920x1080 ultra (3/3) best looking | |
| Average of class Multimedia (29 - 179.9, n=57, last 2 years) | |
| Asus ROG Ally Z1 Extreme | |
| GPD Win 4 | |
| One Netbook XPlayer 2 | |
| GPD Win Max 2 | |
| GPD Pocket 3 | |
| X-Plane 11.11 - 1920x1080 high (fps_test=3) | |
| Average of class Multimedia (16.9 - 141.1, n=53, last 2 years) | |
| GPD Win 4 | |
| One Netbook XPlayer 2 | |
| GPD Win Max 2 | |
| Asus ROG Ally Z1 Extreme | |
| GPD Pocket 3 | |
Witcher 3 FPS Chart
| low | med. | high | ultra | |
|---|---|---|---|---|
| GTA V (2015) | 138.6 | 60.7 | 49.6 | 24.5 |
| The Witcher 3 (2015) | 36 | 23.1 | ||
| Dota 2 Reborn (2015) | 93.7 | 86.7 | 71.7 | 63.1 |
| Final Fantasy XV Benchmark (2018) | 32.5 | 23.9 | ||
| X-Plane 11.11 (2018) | 53.1 | 39 | 33.5 | |
| Strange Brigade (2018) | 143.5 | 56.7 | 47 | 40.9 |
| F1 2021 (2021) | 133.1 | 92.3 | 64.4 | |
| F1 22 (2022) | 77.3 | 65.4 | 52.5 | 13.1 |
排放与能源
即使在要求不高的任务中,OneXPlayer 2的风扇也经常处于活动状态,然后也以近32 dB(A)的速度运行,这一点可以清楚地注意到。降低TDP设置有一些帮助,但在日常使用中,它并不是一个真正安静的设备。在游戏时,这又取决于处理器的配置,因为我们测量到28瓦的全功率下有43分贝(A)。如果你把处理器的功率降到15瓦,它就会有一个更令人愉快的35.7分贝(A)。
游戏时的电池寿命也得益于TDP降低到15瓦,因为Witcher 3 (高设置,150cd/m²)可以运行142分钟,而在28瓦和超细节的情况下,只有96分钟。在这里,65.5瓦的大电池起到了积极的作用,这也使得WLAN测试中的运行时间非常好(10.5小时@150cd/m²,8.5小时@最高亮度)。
游戏时,表面温度完全不是问题,因为只有中央部分会变热,而控制器总是保持令人愉快的凉爽。底部的两个立体声扬声器可以变得非常响亮,声音总体上是好的,但它缺乏低音,结果是不太强大。
Noise level
| Idle |
| 26.1 / 31.6 / 31.6 dB(A) |
| Load |
| 35.7 / 43.3 dB(A) |
 | ||
30 dB silent 40 dB(A) audible 50 dB(A) loud |
||
min: | ||
| One Netbook XPlayer 2 Radeon 680M, R7 6800U | Asus ROG Ally Z1 Extreme Radeon 780M, Z1 Extreme, Micron 2400 MTFDKBK512QFM | Valve Steam Deck 512 GB LCD , | GPD Win 4 Radeon 680M, R7 6800U, BiWin CE480Y2D100-1TB | GPD Win Max 2 Iris Xe G7 96EUs, i7-1260P, BiWin NQ200 1TB CNF82GS1D00-1TB | GPD Pocket 3 Iris Xe G7 96EUs, i7-1195G7, BiWin NQ200 1TB CNF82GS1D00-1TB | |
|---|---|---|---|---|---|---|
| Noise | 10% | 9% | -10% | 10% | 9% | |
| off / environment * (dB) | 26.1 | 23.3 11% | 24.3 7% | 24 8% | 22.6 13% | 23.4 10% |
| Idle Minimum * (dB) | 26.1 | 23.3 11% | 24.3 7% | 31.2 -20% | 23.7 9% | 24.3 7% |
| Idle Average * (dB) | 31.6 | 23.3 26% | 24.3 23% | 31.2 1% | 23.7 25% | 25.6 19% |
| Idle Maximum * (dB) | 31.6 | 27.3 14% | 30 5% | 33.5 -6% | 28.5 10% | 25.6 19% |
| Load Average * (dB) | 35.7 | 39.2 -10% | 45.5 -27% | 36.5 -2% | 38.3 -7% | |
| Witcher 3 ultra * (dB) | 43.3 | 39.2 9% | 40.7 6% | 48.6 -12% | 39.8 8% | 40.7 6% |
| Load Maximum * (dB) | 43.3 | 39.2 9% | 40.7 6% | 49 -13% | 40.5 6% | 40.7 6% |
* ... smaller is better
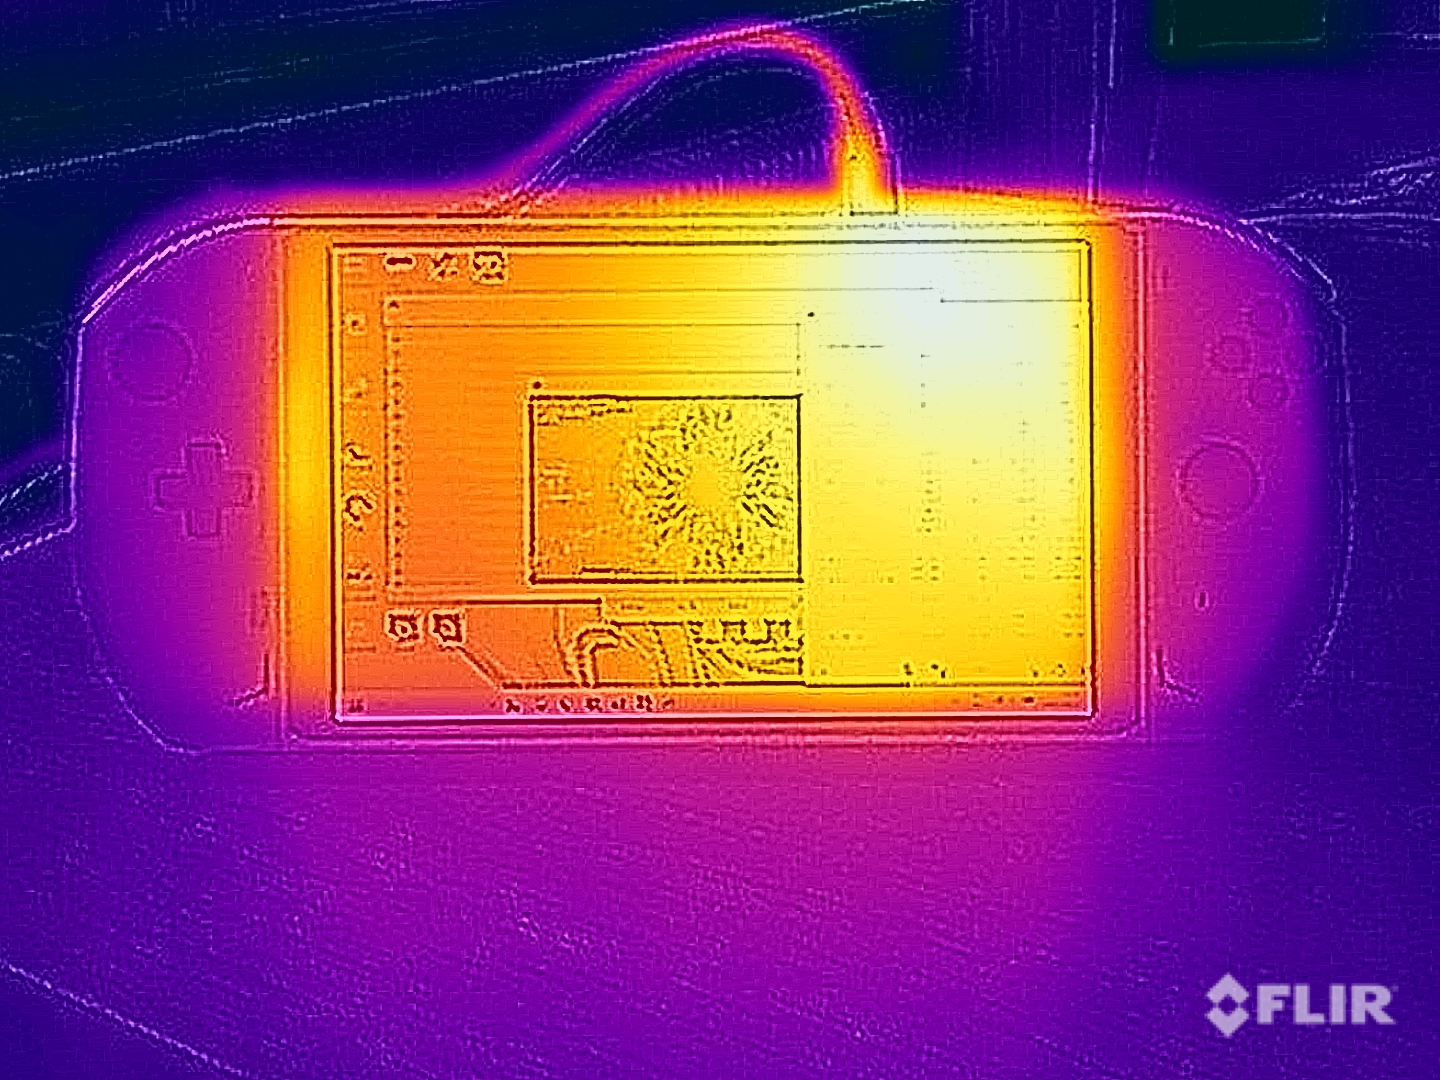
(±) The maximum temperature on the upper side is 42.6 °C / 109 F, compared to the average of 36.8 °C / 98 F, ranging from 21 to 71 °C for the class Multimedia.
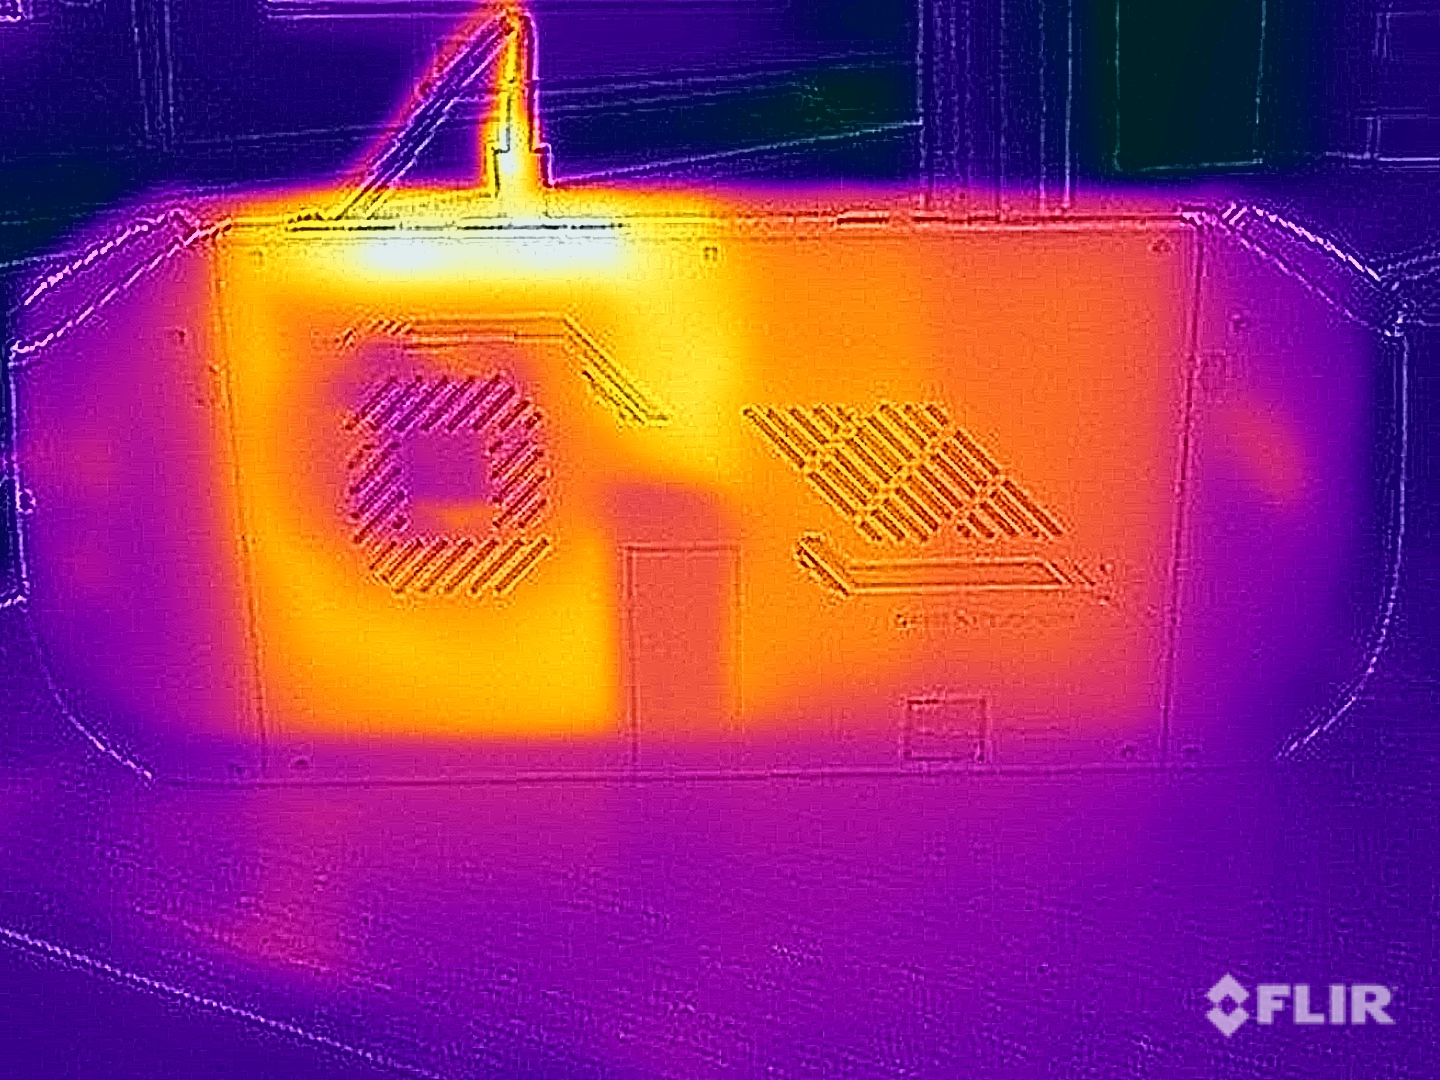
(+) The bottom heats up to a maximum of 39.6 °C / 103 F, compared to the average of 39.1 °C / 102 F
(+) In idle usage, the average temperature for the upper side is 29.2 °C / 85 F, compared to the device average of 31.3 °C / 88 F.
(-) Playing The Witcher 3, the average temperature for the upper side is 38.2 °C / 101 F, compared to the device average of 31.3 °C / 88 F.
(-) The palmrests and touchpad can get very hot to the touch with a maximum of 41 °C / 105.8 F.
(-) The average temperature of the palmrest area of similar devices was 28.7 °C / 83.7 F (-12.3 °C / -22.1 F).
| One Netbook XPlayer 2 AMD Ryzen 7 6800U, AMD Radeon 680M | Asus ROG Ally Z1 Extreme AMD Ryzen Z1 Extreme, AMD Radeon 780M | GPD Win 4 AMD Ryzen 7 6800U, AMD Radeon 680M | GPD Win Max 2 Intel Core i7-1260P, Intel Iris Xe Graphics G7 96EUs | GPD Pocket 3 Intel Core i7-1195G7, Intel Iris Xe Graphics G7 96EUs | |
|---|---|---|---|---|---|
| Heat | 6% | 22% | 24% | 1% | |
| Maximum Upper Side * (°C) | 42.6 | 44.4 -4% | 35 18% | 28.6 33% | 40.4 5% |
| Maximum Bottom * (°C) | 39.6 | 37.9 4% | 26.8 32% | 33 17% | 39.4 1% |
| Idle Upper Side * (°C) | 32.4 | 29.9 8% | 28.4 12% | 24.6 24% | 32.6 -1% |
| Idle Bottom * (°C) | 34.3 | 28.3 17% | 25 27% | 27.6 20% | 34.4 -0% |
* ... smaller is better
One Netbook XPlayer 2 audio analysis
(+) | speakers can play relatively loud (87.2 dB)
Bass 100 - 315 Hz
(-) | nearly no bass - on average 25.2% lower than median
(±) | linearity of bass is average (8.5% delta to prev. frequency)
Mids 400 - 2000 Hz
(+) | balanced mids - only 3.4% away from median
(+) | mids are linear (5.9% delta to prev. frequency)
Highs 2 - 16 kHz
(+) | balanced highs - only 1.9% away from median
(+) | highs are linear (2.2% delta to prev. frequency)
Overall 100 - 16.000 Hz
(+) | overall sound is linear (14.8% difference to median)
Compared to same class
» 35% of all tested devices in this class were better, 4% similar, 61% worse
» The best had a delta of 5%, average was 17%, worst was 45%
Compared to all devices tested
» 20% of all tested devices were better, 4% similar, 76% worse
» The best had a delta of 4%, average was 23%, worst was 134%
Asus ROG Ally Z1 Extreme audio analysis
(+) | speakers can play relatively loud (82.1 dB)
Bass 100 - 315 Hz
(-) | nearly no bass - on average 15.5% lower than median
(±) | linearity of bass is average (8.4% delta to prev. frequency)
Mids 400 - 2000 Hz
(+) | balanced mids - only 3.1% away from median
(+) | mids are linear (3% delta to prev. frequency)
Highs 2 - 16 kHz
(+) | balanced highs - only 1.9% away from median
(+) | highs are linear (2.3% delta to prev. frequency)
Overall 100 - 16.000 Hz
(+) | overall sound is linear (13.5% difference to median)
Compared to same class
» 29% of all tested devices in this class were better, 4% similar, 67% worse
» The best had a delta of 5%, average was 17%, worst was 45%
Compared to all devices tested
» 14% of all tested devices were better, 4% similar, 82% worse
» The best had a delta of 4%, average was 23%, worst was 134%
| Off / Standby | |
| Idle | |
| Load |
|
Key:
min: | |
Power consumption Witcher 3 / Stress test
| One Netbook XPlayer 2 R7 6800U, Radeon 680M, 65.5 Wh | Asus ROG Ally Z1 Extreme Z1 Extreme, Radeon 780M, 40 Wh | GPD Win 4 R7 6800U, Radeon 680M, 46 Wh | GPD Win Max 2 i7-1260P, Iris Xe G7 96EUs, 70 Wh | GPD Pocket 3 i7-1195G7, Iris Xe G7 96EUs, 39 Wh | Average of class Multimedia | |
|---|---|---|---|---|---|---|
| Battery runtime | -32% | -29% | -17% | -43% | 17% | |
| WiFi v1.3 (h) | 10.5 | 7.8 -26% | 7.5 -29% | 8.7 -17% | 6 -43% | 12.3 ? 17% |
| Witcher 3 ultra (h) | 1.6 | 1 -37% |
Pros
Cons
评语--有趣的掌上电脑,但缺乏优化

OneXPlayer 2实际上是一个带有触摸屏和可附加控制器的小型迷你PC,因此与其他手持设备如Steam Deck或华硕ROG Ally不同。这带来了一些优势,例如在手柄的温度或应用的可能性方面。例如,控制器可以像任天堂的Switch一样被拆下,单独使用,例如作为沙发上的控制器。然而,这里的情况并没有完全考虑清楚,因为控制器不提供电池,需要单独购买一个适配器。
该设备看起来也相对笨重和厚实,但这反过来也使大电池和包括USB-C 4.0在内的大量端口成为可能。因此,OneXPlayer 2也可以用外部GPU操作,例如在家里的桌子上。性能产量的 AMD Ryzen 7 6800U和手持设备的性能不必在永久负载或电池模式下节流。电池寿命主要取决于所选设置和游戏时的TDP。附带的控制软件提供了最重要的设置,但我们缺少进一步的优化,缺少一个用于游戏库的中央软件,或者仅仅是一个覆盖,你也可以在游戏时改变设置。根据设置,我们可以合理地玩大约1.5-2.5小时,这并不是一个糟糕的表现。在WLAN或视频模式下,在调整亮度的情况下,这款掌上电脑也很容易持续10小时以上。
性能不错,但在操作上有弱点,而且显示效果不是特别好:OneXPlayer 2是一款令人兴奋的游戏掌上电脑,具有广泛的应用可能性,但并非所有的功能都被充分考虑。此外,该设备非常昂贵,超过1,000欧元。
除了缺乏软件优化,包括不良校准在内的显示屏也有些令人失望,因为它既没有提供更高的频率,也没有快速的响应时间。价格当然也是一个很大的障碍,因为虽然你可以购买较小的 ROG Ally你已经可以用800欧元买到包括120赫兹显示屏的新Zen4处理器,但你必须为我们的测试设备支付约1100欧元,而拥有更多内存的版本很快就会达到1500欧元。
价格和可用性
OneXPlayer2目前在各零售商处有售。我们的测试设备配有16GB内存/1TB,在美国亚马逊上的售价约为1480美元。
One Netbook XPlayer 2
- 07/06/2023 v7 (old)
Andreas Osthoff
Transparency
The selection of devices to be reviewed is made by our editorial team. The test sample was provided to the author as a loan by the manufacturer or retailer for the purpose of this review. The lender had no influence on this review, nor did the manufacturer receive a copy of this review before publication. There was no obligation to publish this review. As an independent media company, Notebookcheck is not subjected to the authority of manufacturers, retailers or publishers.
This is how Notebookcheck is testing
Every year, Notebookcheck independently reviews hundreds of laptops and smartphones using standardized procedures to ensure that all results are comparable. We have continuously developed our test methods for around 20 years and set industry standards in the process. In our test labs, high-quality measuring equipment is utilized by experienced technicians and editors. These tests involve a multi-stage validation process. Our complex rating system is based on hundreds of well-founded measurements and benchmarks, which maintains objectivity. Further information on our test methods can be found here.
Price comparison
