Nokia 5.3智能手机评测:简版安卓手机
Vergleichsgeräte
Bewertung | Rating Version | Datum | Modell | Gewicht | Laufwerk | Groesse | Aufloesung | Preis ab |
|---|---|---|---|---|---|---|---|---|
| 75.7 % v7 (old) | v7 (old) | 07 / 2020 | Nokia 5.3 SD 665, Adreno 610 | 185 g | 64 GB eMMC Flash | 6.55" | 1600x720 | |
| 80.7 % v7 (old) | v7 (old) | 06 / 2020 | Xiaomi Redmi Note 9S SD 720G, Adreno 618 | 209 g | 128 GB UFS 2.0 Flash | 6.67" | 2400x1080 | |
| 76.7 % v7 (old) | v7 (old) | 08 / 2020 | Huawei P smart Pro Kirin 710, Mali-G51 MP4 | 206 g | 128 GB UFS 2.1 Flash | 6.59" | 2340x1080 | |
| 78.4 % v7 (old) | v7 (old) | 11 / 2019 | Motorola Moto G8 Plus SD 665, Adreno 610 | 188 g | 64 GB eMMC Flash | 6.30" | 2280x1080 |


| Networking | |
| iperf3 transmit AX12 | |
| Xiaomi Redmi Note 9S | |
| Nokia 5.3 | |
| Motorola Moto G8 Plus | |
| Huawei P smart Pro | |
| iperf3 receive AX12 | |
| Xiaomi Redmi Note 9S | |
| Motorola Moto G8 Plus | |
| Nokia 5.3 | |
| Huawei P smart Pro | |


| |||||||||||||||||||||||||
Brightness Distribution: 86 %
Center on Battery: 523 cd/m²
Contrast: 1137:1 (Black: 0.46 cd/m²)
ΔE ColorChecker Calman: 6.22 | ∀{0.5-29.43 Ø4.71}
ΔE Greyscale Calman: 8 | ∀{0.09-98 Ø4.96}
94.4% sRGB (Calman 2D)
Gamma: 2.226
CCT: 8856 K
| Nokia 5.3 IPS, 1600x720, 6.6" | Xiaomi Redmi Note 9S IPS, 2400x1080, 6.7" | Huawei P smart Pro TFT-LCD (LTPS), 2340x1080, 6.6" | Motorola Moto G8 Plus IPS, 2280x1080, 6.3" | |
|---|---|---|---|---|
| Response Times | 21% | 8% | 28% | |
| Response Time Grey 50% / Grey 80% * (ms) | 56 ? | 44 ? 21% | 51.2 ? 9% | 36 ? 36% |
| Response Time Black / White * (ms) | 30 ? | 24 ? 20% | 28 ? 7% | 24 ? 20% |
| PWM Frequency (Hz) | 463 ? | |||
| Screen | 18% | -3% | 11% | |
| Brightness middle (cd/m²) | 523 | 622 19% | 480 -8% | 597 14% |
| Brightness (cd/m²) | 482 | 612 27% | 459 -5% | 596 24% |
| Brightness Distribution (%) | 86 | 94 9% | 87 1% | 93 8% |
| Black Level * (cd/m²) | 0.46 | 0.56 -22% | 0.47 -2% | 0.52 -13% |
| Contrast (:1) | 1137 | 1111 -2% | 1021 -10% | 1148 1% |
| Colorchecker dE 2000 * | 6.22 | 3.98 36% | 5.7 8% | 5.93 5% |
| Colorchecker dE 2000 max. * | 10.56 | 7.33 31% | 11.3 -7% | 9.42 11% |
| Greyscale dE 2000 * | 8 | 4.5 44% | 7.8 2% | 5.3 34% |
| Gamma | 2.226 99% | 2.206 100% | 2.27 97% | 2.232 99% |
| CCT | 8856 73% | 7361 88% | 8813 74% | 7632 85% |
| Color Space (Percent of sRGB) (%) | 114.9 | |||
| Total Average (Program / Settings) | 20% /
18% | 3% /
-1% | 20% /
14% |
* ... smaller is better
Display Response Times
| ↔ Response Time Black to White | ||
|---|---|---|
| 30 ms ... rise ↗ and fall ↘ combined | ↗ 15 ms rise | 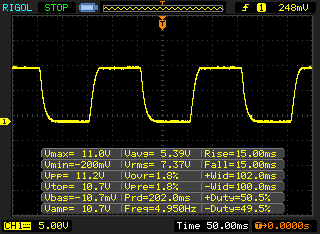 |
| ↘ 15 ms fall | ||
| The screen shows slow response rates in our tests and will be unsatisfactory for gamers. In comparison, all tested devices range from 0.1 (minimum) to 240 (maximum) ms. » 80 % of all devices are better. This means that the measured response time is worse than the average of all tested devices (19.8 ms). | ||
| ↔ Response Time 50% Grey to 80% Grey | ||
| 56 ms ... rise ↗ and fall ↘ combined | ↗ 28 ms rise | 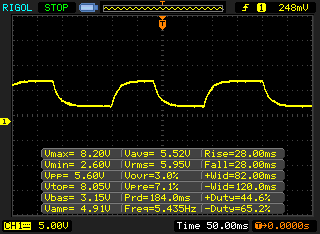 |
| ↘ 28 ms fall | ||
| The screen shows slow response rates in our tests and will be unsatisfactory for gamers. In comparison, all tested devices range from 0.165 (minimum) to 636 (maximum) ms. » 93 % of all devices are better. This means that the measured response time is worse than the average of all tested devices (30.9 ms). | ||
Screen Flickering / PWM (Pulse-Width Modulation)
| Screen flickering / PWM not detected | 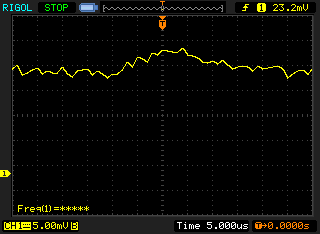 | ||
In comparison: 52 % of all tested devices do not use PWM to dim the display. If PWM was detected, an average of 7748 (minimum: 5 - maximum: 343500) Hz was measured. | |||
| PCMark for Android | |
| Work performance score (sort by value) | |
| Nokia 5.3 | |
| Xiaomi Redmi Note 9S | |
| Huawei P smart Pro | |
| Motorola Moto G8 Plus | |
| Average Qualcomm Snapdragon 665 (7437 - 9051, n=10) | |
| Work 2.0 performance score (sort by value) | |
| Nokia 5.3 | |
| Xiaomi Redmi Note 9S | |
| Huawei P smart Pro | |
| Motorola Moto G8 Plus | |
| Average Qualcomm Snapdragon 665 (6189 - 11432, n=12) | |
| GFXBench | |
| on screen Aztec Ruins Normal Tier Onscreen (sort by value) | |
| Nokia 5.3 | |
| Xiaomi Redmi Note 9S | |
| Huawei P smart Pro | |
| Motorola Moto G8 Plus | |
| Average Qualcomm Snapdragon 665 (6.2 - 15, n=12) | |
| Average of class Smartphone (6.2 - 166, n=178, last 2 years) | |
| 1920x1080 Aztec Ruins Normal Tier Offscreen (sort by value) | |
| Nokia 5.3 | |
| Huawei P smart Pro | |
| Motorola Moto G8 Plus | |
| Average Qualcomm Snapdragon 665 (7.8 - 8.4, n=12) | |
| Average of class Smartphone (3.4 - 378, n=178, last 2 years) | |
| on screen Aztec Ruins High Tier Onscreen (sort by value) | |
| Nokia 5.3 | |
| Xiaomi Redmi Note 9S | |
| Huawei P smart Pro | |
| Motorola Moto G8 Plus | |
| Average Qualcomm Snapdragon 665 (3.9 - 9.1, n=12) | |
| Average of class Smartphone (3.7 - 144, n=179, last 2 years) | |
| 2560x1440 Aztec Ruins High Tier Offscreen (sort by value) | |
| Nokia 5.3 | |
| Xiaomi Redmi Note 9S | |
| Huawei P smart Pro | |
| Motorola Moto G8 Plus | |
| Average Qualcomm Snapdragon 665 (2.7 - 2.8, n=12) | |
| Average of class Smartphone (1.2 - 151, n=178, last 2 years) | |
| Nokia 5.3 | Xiaomi Redmi Note 9S | Huawei P smart Pro | Motorola Moto G8 Plus | Average 64 GB eMMC Flash | Average of class Smartphone | |
|---|---|---|---|---|---|---|
| AndroBench 3-5 | 40% | 76% | 17% | -18% | 554% | |
| Sequential Read 256KB (MB/s) | 299.5 | 496.6 66% | 822 174% | 302.5 1% | 278 ? -7% | 2236 ? 647% |
| Sequential Write 256KB (MB/s) | 243.2 | 214.8 -12% | 195.4 -20% | 217.4 -11% | 178.6 ? -27% | 1918 ? 689% |
| Random Read 4KB (MB/s) | 109.1 | 137 26% | 154.3 41% | 59.9 -45% | 60.9 ? -44% | 312 ? 186% |
| Random Write 4KB (MB/s) | 45.2 | 123.6 173% | 156.3 246% | 124.9 176% | 34.2 ? -24% | 359 ? 694% |
| Sequential Read 256KB SDCard (MB/s) | 77.3 ? | 74.5 ? -4% | 76.5 ? -1% | 72.6 ? -6% | 77.4 ? 0% | |
| Sequential Write 256KB SDCard (MB/s) | 60.7 ? | 54.9 ? -10% | 69 ? 14% | 52.2 ? -14% | 58.3 ? -4% |
(-) The maximum temperature on the upper side is 51.7 °C / 125 F, compared to the average of 35.3 °C / 96 F, ranging from 21.9 to 247 °C for the class Smartphone.
(-) The bottom heats up to a maximum of 51.1 °C / 124 F, compared to the average of 34 °C / 93 F
(±) In idle usage, the average temperature for the upper side is 33.5 °C / 92 F, compared to the device average of 33 °C / 91 F.
Nokia 5.3 audio analysis
(±) | speaker loudness is average but good (76.1 dB)
Bass 100 - 315 Hz
(-) | nearly no bass - on average 26.7% lower than median
(±) | linearity of bass is average (8.3% delta to prev. frequency)
Mids 400 - 2000 Hz
(±) | higher mids - on average 7% higher than median
(±) | linearity of mids is average (9.8% delta to prev. frequency)
Highs 2 - 16 kHz
(+) | balanced highs - only 4.9% away from median
(±) | linearity of highs is average (7.3% delta to prev. frequency)
Overall 100 - 16.000 Hz
(-) | overall sound is not linear (30.2% difference to median)
Compared to same class
» 79% of all tested devices in this class were better, 4% similar, 17% worse
» The best had a delta of 11%, average was 34%, worst was 134%
Compared to all devices tested
» 88% of all tested devices were better, 3% similar, 9% worse
» The best had a delta of 4%, average was 23%, worst was 134%
Xiaomi Redmi Note 9S audio analysis
(±) | speaker loudness is average but good (81 dB)
Bass 100 - 315 Hz
(-) | nearly no bass - on average 64.7% lower than median
(+) | bass is linear (0% delta to prev. frequency)
Mids 400 - 2000 Hz
(-) | nearly no mids - on average 64.7% lower than median
(+) | mids are linear (0% delta to prev. frequency)
Highs 2 - 16 kHz
(-) | nearly no highs - on average 64.7% lower than median
(+) | highs are linear (0% delta to prev. frequency)
Overall 100 - 16.000 Hz
(-) | overall sound is not linear (119.7% difference to median)
Compared to same class
» 89% of all tested devices in this class were better, 8% similar, 3% worse
» The best had a delta of 11%, average was 34%, worst was 134%
Compared to all devices tested
» 97% of all tested devices were better, 2% similar, 1% worse
» The best had a delta of 4%, average was 23%, worst was 134%
| Nokia 5.3 4000 mAh | Xiaomi Redmi Note 9S 5020 mAh | Huawei P smart Pro 4000 mAh | Motorola Moto G8 Plus 4000 mAh | Average of class Smartphone | |
|---|---|---|---|---|---|
| Battery Runtime | |||||
| WiFi Websurfing (h) | 14.6 | 19.8 36% | 12.6 -14% | 16.3 12% | 20.8 ? 42% |
Pros
Cons
总结——给的太少:
诺基亚5.3看起来有点过时了。放在去年,相对较大的电池,灵活的摄像头系统和同等水平的性能还能一战。然而,在2020年,在这个价位,与竞争对手相比,这太少了,并甚至有些落后,即使只卖200欧元,我们也很难原谅:
即使在室温下,在较长的负载下温度也太高。 WLAN数据速率不断变化,LTE速度缓慢。到2020年,屏幕上仍然有很严重的蓝光。
诺基亚5.3有一些缺点,因此大大落后于价格昂贵的竞争对手。
当然,诺基亚5.3相当轻薄,它提供合理的续航时间,并且功能强大,足以满足日常使用的需求。安卓是最新版本,在接下来的两年中,借助Android One,您可以安全地进行更新。但是,由于相机整体上很难让人信服,而且其他制造商提供了这么多更好的产品,因此我们很难为诺基亚手机提出推荐。
充其量,如果它以低得多的价格在去年上市,那么这款手机可能适合于需求不高的用户。
Nokia 5.3
- 07/02/2020 v7 (old)
Florian Schmitt
Price comparison
