联想IdeaPad 730S-13IWL(i5-8265U,FHD)笔记本电脑评测
| |||||||||||||||||||||||||
Brightness Distribution: 83 %
Center on Battery: 355.1 cd/m²
Contrast: 1110:1 (Black: 0.32 cd/m²)
ΔE ColorChecker Calman: 2.93 | ∀{0.5-29.43 Ø4.73}
calibrated: 1.83
ΔE Greyscale Calman: 3.6 | ∀{0.09-98 Ø4.97}
95% sRGB (Argyll 1.6.3 3D)
61% AdobeRGB 1998 (Argyll 1.6.3 3D)
66.7% AdobeRGB 1998 (Argyll 3D)
95.5% sRGB (Argyll 3D)
65.6% Display P3 (Argyll 3D)
Gamma: 2.071
CCT: 7161 K
| Lenovo IdeaPad 730S-13IWL 81JB0004US B133HAN05.1, IPS, 13.3", 1920x1080 | Dell XPS 13 9380 2019 ID: AUO 282B B133ZAN Dell: 90NTH, IPS, 13.3", 3840x2160 | HP Spectre Folio 13t-ak000 AU Optronics AUO572D, IPS, 13.3", 1920x1080 | Apple MacBook Air 2018 APPA039, IPS, 13.3", 2560x1600 | Microsoft Surface Laptop 2-LQN-00004 VVX14T092N00, IPS, 13.5", 2256x1504 | Lenovo Ideapad 720S-13IKB LG Philips LGD04EF, IPS, 13.3", 1920x1080 | |
|---|---|---|---|---|---|---|
| Display | -2% | 2% | 3% | 2% | -9% | |
| Display P3 Coverage (%) | 65.6 | 64.7 -1% | 66.2 1% | 67.8 3% | 68 4% | 64.3 -2% |
| sRGB Coverage (%) | 95.5 | 93.1 -3% | 97.4 2% | 96.1 1% | 94.7 -1% | 82.3 -14% |
| AdobeRGB 1998 Coverage (%) | 66.7 | 65.3 -2% | 68.1 2% | 69.8 5% | 69.2 4% | 60.2 -10% |
| Response Times | 14% | 17% | 37% | -7% | 44% | |
| Response Time Grey 50% / Grey 80% * (ms) | 75.2 ? | 58 ? 23% | 52 ? 31% | 39.6 ? 47% | 69.2 ? 8% | 35 ? 53% |
| Response Time Black / White * (ms) | 38 ? | 36 ? 5% | 37.2 ? 2% | 28 ? 26% | 46.4 ? -22% | 25 ? 34% |
| PWM Frequency (Hz) | 544 | 113600 ? | 131000 ? | |||
| Screen | -11% | 7% | 22% | 5% | -35% | |
| Brightness middle (cd/m²) | 355.1 | 404 14% | 389.8 10% | 320 -10% | 392 10% | 335 -6% |
| Brightness (cd/m²) | 336 | 389 16% | 396 18% | 315 -6% | 390 16% | 303 -10% |
| Brightness Distribution (%) | 83 | 85 2% | 88 6% | 95 14% | 89 7% | 85 2% |
| Black Level * (cd/m²) | 0.32 | 0.37 -16% | 0.27 16% | 0.29 9% | 0.24 25% | 0.46 -44% |
| Contrast (:1) | 1110 | 1092 -2% | 1444 30% | 1103 -1% | 1633 47% | 728 -34% |
| Colorchecker dE 2000 * | 2.93 | 3.72 -27% | 2.72 7% | 1.2 59% | 3.2 -9% | 5.09 -74% |
| Colorchecker dE 2000 max. * | 4.39 | 7.38 -68% | 5.49 -25% | 3.2 27% | 6.3 -44% | 11.92 -172% |
| Colorchecker dE 2000 calibrated * | 1.83 | 2.06 -13% | 1.25 32% | 0.5 73% | 1.4 23% | |
| Greyscale dE 2000 * | 3.6 | 4.44 -23% | 4.2 -17% | 0.8 78% | 4.5 -25% | 3.23 10% |
| Gamma | 2.071 106% | 2.34 94% | 2.1 105% | 2.2 100% | 2.2 100% | 2.18 101% |
| CCT | 7161 91% | 7095 92% | 7470 87% | 6548 99% | 7556 86% | 6214 105% |
| Color Space (Percent of AdobeRGB 1998) (%) | 61 | 60 -2% | 62.2 2% | 62.1 2% | 63.9 5% | 54 -11% |
| Color Space (Percent of sRGB) (%) | 95 | 93 -2% | 98.2 3% | 96 1% | 95 0% | 82 -14% |
| Total Average (Program / Settings) | 0% /
-6% | 9% /
8% | 21% /
21% | 0% /
3% | 0% /
-19% |
* ... smaller is better
Display Response Times
| ↔ Response Time Black to White | ||
|---|---|---|
| 38 ms ... rise ↗ and fall ↘ combined | ↗ 22 ms rise | 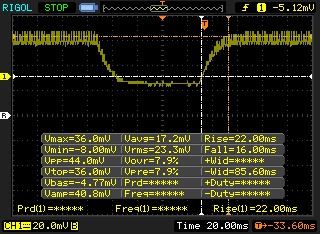 |
| ↘ 16 ms fall | ||
| The screen shows slow response rates in our tests and will be unsatisfactory for gamers. In comparison, all tested devices range from 0.1 (minimum) to 240 (maximum) ms. » 96 % of all devices are better. This means that the measured response time is worse than the average of all tested devices (19.9 ms). | ||
| ↔ Response Time 50% Grey to 80% Grey | ||
| 75.2 ms ... rise ↗ and fall ↘ combined | ↗ 32.8 ms rise | 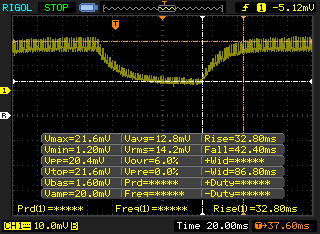 |
| ↘ 42.4 ms fall | ||
| The screen shows slow response rates in our tests and will be unsatisfactory for gamers. In comparison, all tested devices range from 0.165 (minimum) to 636 (maximum) ms. » 99 % of all devices are better. This means that the measured response time is worse than the average of all tested devices (31.1 ms). | ||
Screen Flickering / PWM (Pulse-Width Modulation)
| Screen flickering / PWM detected | 544 Hz | 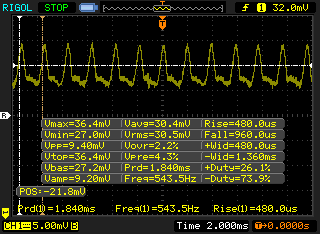 | |
The display backlight flickers at 544 Hz (worst case, e.g., utilizing PWM) . The frequency of 544 Hz is quite high, so most users sensitive to PWM should not notice any flickering. In comparison: 52 % of all tested devices do not use PWM to dim the display. If PWM was detected, an average of 7784 (minimum: 5 - maximum: 343500) Hz was measured. | |||
| PCMark 8 Home Score Accelerated v2 | 3443 points | |
| PCMark 8 Work Score Accelerated v2 | 4857 points | |
| PCMark 10 Score | 3869 points | |
Help | ||
| Lenovo IdeaPad 730S-13IWL 81JB0004US Samsung SSD PM981 MZVLB256HAHQ | Dell XPS 13 9380 2019 SK hynix PC401 HFS256GD9TNG | HP Spectre Folio 13t-ak000 Samsung PM961 MZVLW256HEHP | Asus ZenBook 13 UX333FA WDC PC SN520 SDAPNUW-256G | Microsoft Surface Laptop 2-LQN-00004 SK Hynix BC501 NVMe 256 GB | |
|---|---|---|---|---|---|
| AS SSD | -13% | 47% | 7% | -18% | |
| Seq Read (MB/s) | 2323 | 2035 -12% | 1693 -27% | 1186 -49% | 826 -64% |
| Seq Write (MB/s) | 1395 | 658 -53% | 1214 -13% | 809 -42% | 555 -60% |
| 4K Read (MB/s) | 49.31 | 39.74 -19% | 42.69 -13% | 39.69 -20% | 33.39 -32% |
| 4K Write (MB/s) | 100.7 | 105.7 5% | 95.9 -5% | 114 13% | 95.3 -5% |
| 4K-64 Read (MB/s) | 765 | 461 -40% | 1621 112% | 618 -19% | 447 -42% |
| 4K-64 Write (MB/s) | 981 | 300.1 -69% | 605 -38% | 510 -48% | 370.4 -62% |
| Access Time Read * (ms) | 0.058 | 0.061 -5% | 0.051 12% | 0.068 -17% | 0.048 17% |
| Access Time Write * (ms) | 0.037 | 0.051 -38% | 0.037 -0% | 0.032 14% | 0.048 -30% |
| Score Read (Points) | 1047 | 704 -33% | 1833 75% | 776 -26% | 563 -46% |
| Score Write (Points) | 1221 | 471 -61% | 823 -33% | 705 -42% | 521 -57% |
| Score Total (Points) | 2770 | 1479 -47% | 3569 29% | 1870 -32% | 1369 -51% |
| Copy ISO MB/s (MB/s) | 898 | 893 -1% | 1374 53% | 1090 21% | 755 -16% |
| Copy Program MB/s (MB/s) | 181.4 | 287.9 59% | 631 248% | 714 294% | 325.1 79% |
| Copy Game MB/s (MB/s) | 270.5 | 618 128% | 971 259% | 413 53% | 577 113% |
| CrystalDiskMark 5.2 / 6 | -17% | -5% | -10% | -22% | |
| Write 4K (MB/s) | 117 | 84.6 -28% | 140 20% | 113.7 -3% | 87.3 -25% |
| Read 4K (MB/s) | 40.65 | 38.52 -5% | 52.4 29% | 43.18 6% | 36.52 -10% |
| Write Seq (MB/s) | 1456 | 557 -62% | 948 -35% | 970 -33% | 716 -51% |
| Read Seq (MB/s) | 1181 | 1393 18% | 922 -22% | 1085 -8% | 1009 -15% |
| Write 4K Q32T1 (MB/s) | 232.3 | 339.5 46% | 227.8 -2% | 396.8 71% | 324.1 40% |
| Read 4K Q32T1 (MB/s) | 311.3 | 255.4 -18% | 299.2 -4% | 317.8 2% | 249 -20% |
| Write Seq Q32T1 (MB/s) | 1463 | 558 -62% | 1259 -14% | 518 -65% | 811 -45% |
| Read Seq Q32T1 (MB/s) | 3480 | 2541 -27% | 3112 -11% | 1741 -50% | 1631 -53% |
| Total Average (Program / Settings) | -15% /
-15% | 21% /
28% | -2% /
1% | -20% /
-20% |
* ... smaller is better

| 3DMark 06 Standard Score | 11535 points | |
| 3DMark 11 Performance | 1992 points | |
| 3DMark Cloud Gate Standard Score | 8507 points | |
| 3DMark Fire Strike Score | 1140 points | |
Help | ||
| The Witcher 3 - 1024x768 Low Graphics & Postprocessing | |
| Average of class Subnotebook (38.8 - 176, n=13, last 2 years) | |
| Microsoft Surface Laptop 2-LQN-00004 | |
| Average Intel UHD Graphics 620 (8.8 - 50.9, n=64) | |
| low | med. | high | ultra | |
|---|---|---|---|---|
| BioShock Infinite (2013) | 69 | 37 | 32 | 16 |
| Thief (2014) | 26 | 18 | 14 | 6 |
| Rise of the Tomb Raider (2016) | 21 | 12 | 6 | 4 |
Noise level
| Idle |
| 28.2 / 28.2 / 28.2 dB(A) |
| Load |
| 33.4 / 39.5 dB(A) |
 | ||
30 dB silent 40 dB(A) audible 50 dB(A) loud |
||
min: | ||
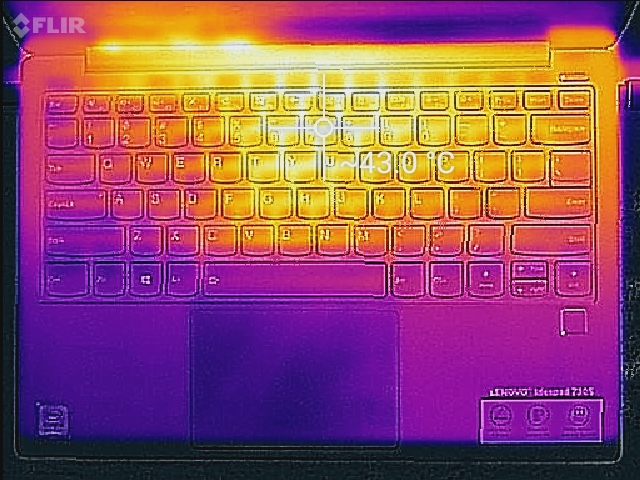
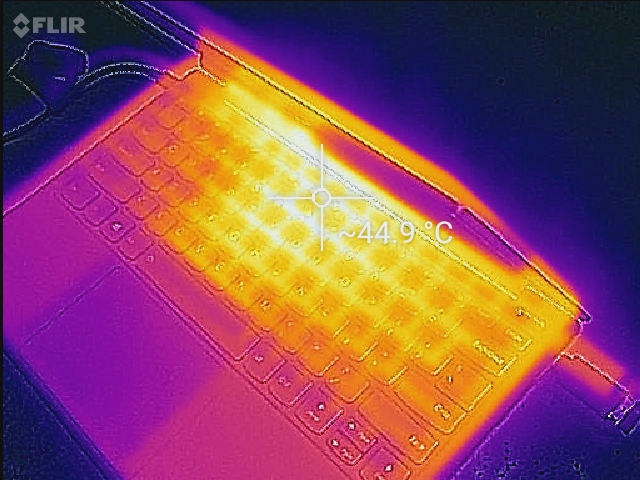
(±) The maximum temperature on the upper side is 43 °C / 109 F, compared to the average of 35.9 °C / 97 F, ranging from 21.4 to 59 °C for the class Subnotebook.
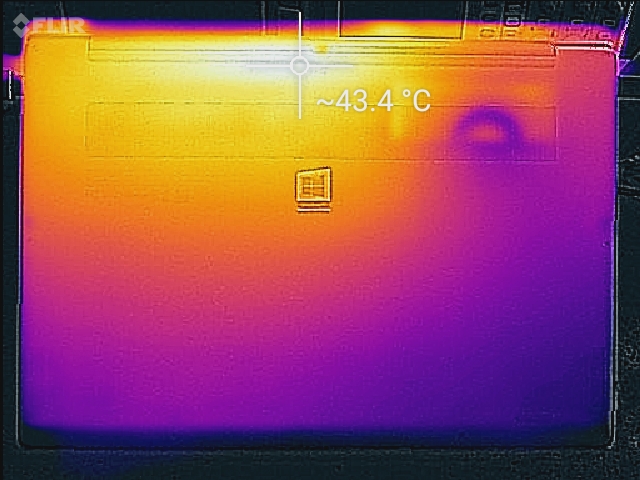
(±) The bottom heats up to a maximum of 43.4 °C / 110 F, compared to the average of 39.2 °C / 103 F
(+) In idle usage, the average temperature for the upper side is 26.8 °C / 80 F, compared to the device average of 30.8 °C / 87 F.
(+) The palmrests and touchpad are cooler than skin temperature with a maximum of 28.4 °C / 83.1 F and are therefore cool to the touch.
(±) The average temperature of the palmrest area of similar devices was 28.2 °C / 82.8 F (-0.2 °C / -0.3 F).
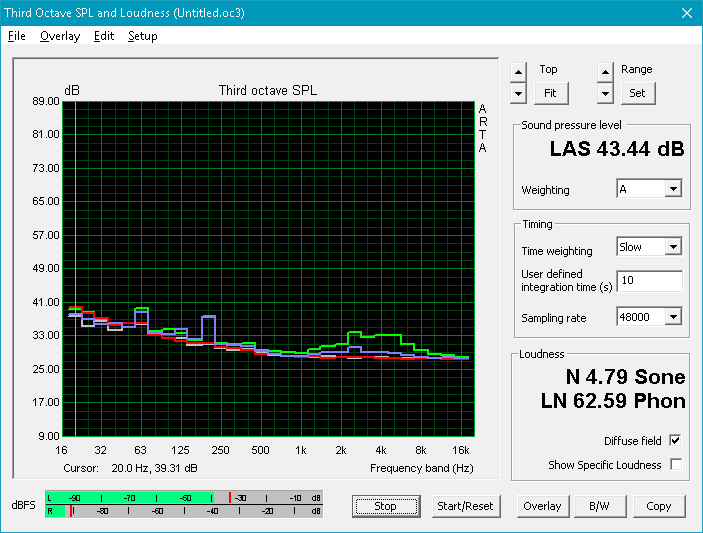
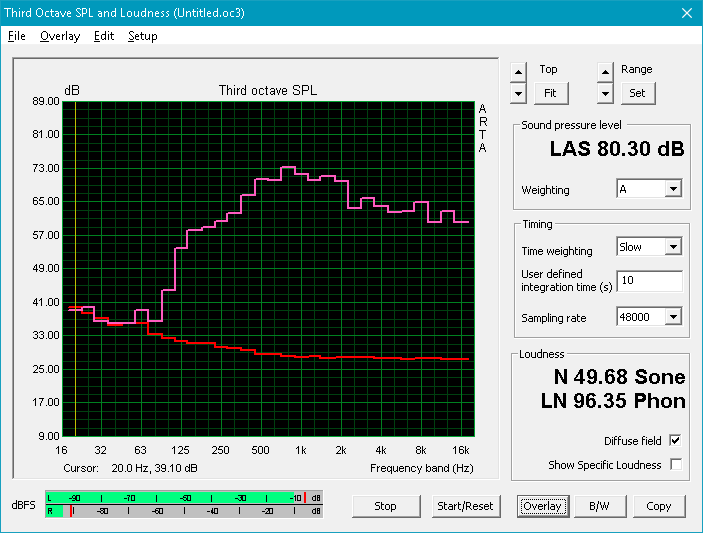
Lenovo IdeaPad 730S-13IWL 81JB0004US audio analysis
(±) | speaker loudness is average but good (80.3 dB)
Bass 100 - 315 Hz
(±) | reduced bass - on average 7.1% lower than median
(±) | linearity of bass is average (12.2% delta to prev. frequency)
Mids 400 - 2000 Hz
(±) | higher mids - on average 7% higher than median
(+) | mids are linear (5.6% delta to prev. frequency)
Highs 2 - 16 kHz
(+) | balanced highs - only 1.3% away from median
(±) | linearity of highs is average (7.9% delta to prev. frequency)
Overall 100 - 16.000 Hz
(±) | linearity of overall sound is average (16.1% difference to median)
Compared to same class
» 39% of all tested devices in this class were better, 4% similar, 57% worse
» The best had a delta of 5%, average was 18%, worst was 53%
Compared to all devices tested
» 26% of all tested devices were better, 5% similar, 69% worse
» The best had a delta of 4%, average was 24%, worst was 134%
Apple MacBook Air 2018 audio analysis
(±) | speaker loudness is average but good (75 dB)
Bass 100 - 315 Hz
(±) | reduced bass - on average 8.1% lower than median
(±) | linearity of bass is average (10% delta to prev. frequency)
Mids 400 - 2000 Hz
(+) | balanced mids - only 2.9% away from median
(+) | mids are linear (5.6% delta to prev. frequency)
Highs 2 - 16 kHz
(+) | balanced highs - only 2.2% away from median
(+) | highs are linear (4.5% delta to prev. frequency)
Overall 100 - 16.000 Hz
(+) | overall sound is linear (12.3% difference to median)
Compared to same class
» 16% of all tested devices in this class were better, 5% similar, 80% worse
» The best had a delta of 5%, average was 18%, worst was 53%
Compared to all devices tested
» 10% of all tested devices were better, 3% similar, 87% worse
» The best had a delta of 4%, average was 24%, worst was 134%
| Off / Standby | |
| Idle | |
| Load |
|
Key:
min: | |
| Lenovo IdeaPad 730S-13IWL 81JB0004US i5-8265U, UHD Graphics 620, Samsung SSD PM981 MZVLB256HAHQ, IPS, 1920x1080, 13.3" | Dell XPS 13 9380 2019 i5-8265U, UHD Graphics 620, SK hynix PC401 HFS256GD9TNG, IPS, 3840x2160, 13.3" | HP Spectre Folio 13t-ak000 i7-8500Y, UHD Graphics 615, Samsung PM961 MZVLW256HEHP, IPS, 1920x1080, 13.3" | Apple MacBook Air 2018 i5-8210Y, UHD Graphics 617, Apple SSD AP0256, IPS, 2560x1600, 13.3" | Asus ZenBook 13 UX333FA i5-8265U, UHD Graphics 620, WDC PC SN520 SDAPNUW-256G, IPS, 1920x1080, 13.3" | Microsoft Surface Laptop 2-LQN-00004 i5-8250U, UHD Graphics 620, SK Hynix BC501 NVMe 256 GB, IPS, 2256x1504, 13.5" | |
|---|---|---|---|---|---|---|
| Power Consumption | -29% | 26% | 12% | 17% | -2% | |
| Idle Minimum * (Watt) | 2.8 | 4.8 -71% | 1.8 36% | 2.2 21% | 1.6 43% | 3 -7% |
| Idle Average * (Watt) | 5.5 | 8.6 -56% | 3.8 31% | 5.7 -4% | 4.6 16% | 6.8 -24% |
| Idle Maximum * (Watt) | 7.7 | 10.4 -35% | 7.7 -0% | 10.3 -34% | 7.3 5% | 8.76 -14% |
| Load Average * (Watt) | 39.9 | 37.9 5% | 26.9 33% | 25.6 36% | 37.9 5% | 35.1 12% |
| Load Maximum * (Watt) | 54.1 | 48.5 10% | 38.5 29% | 30.6 43% | 44.8 17% | 42.6 21% |
* ... smaller is better
| Lenovo IdeaPad 730S-13IWL 81JB0004US i5-8265U, UHD Graphics 620, 42 Wh | Dell XPS 13 9380 2019 i5-8265U, UHD Graphics 620, 52 Wh | HP Spectre Folio 13t-ak000 i7-8500Y, UHD Graphics 615, 54.28 Wh | Apple MacBook Air 2018 i5-8210Y, UHD Graphics 617, 50.3 Wh | Asus ZenBook 13 UX333FA i5-8265U, UHD Graphics 620, 50 Wh | Microsoft Surface Laptop 2-LQN-00004 i5-8250U, UHD Graphics 620, 45 Wh | |
|---|---|---|---|---|---|---|
| Battery runtime | -25% | 28% | 0% | -11% | -18% | |
| WiFi v1.3 (h) | 11.1 | 8.3 -25% | 14.2 28% | 11.1 0% | 9.9 -11% | 9.1 -18% |
| Reader / Idle (h) | 17.2 | 31.4 | 27.8 | 20.8 | ||
| Load (h) | 2.4 | 3.5 | 2.2 | 2.2 | 1.6 |
Pros
Cons
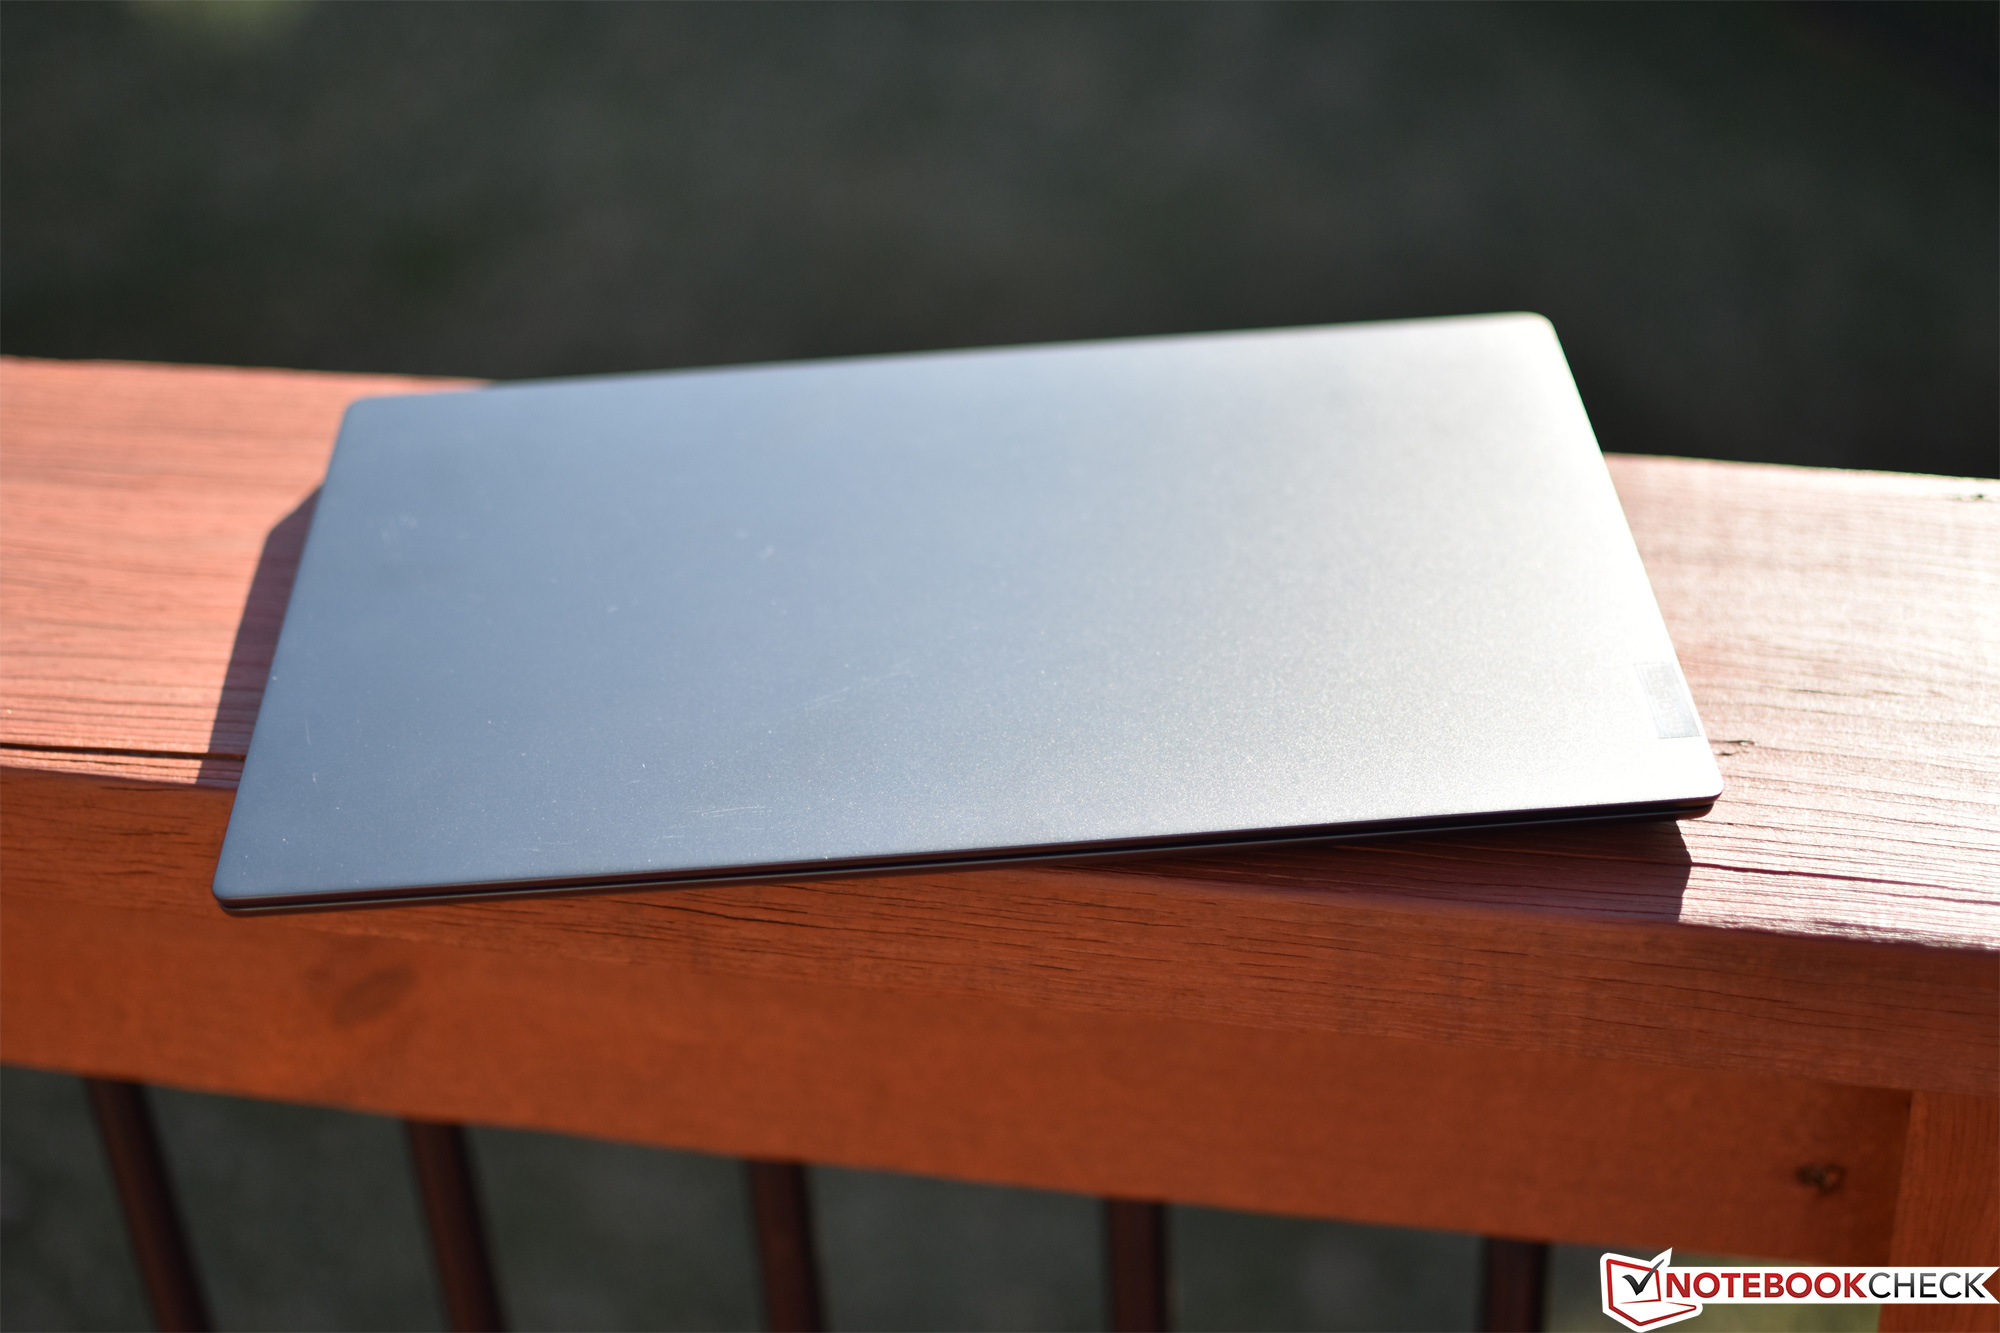
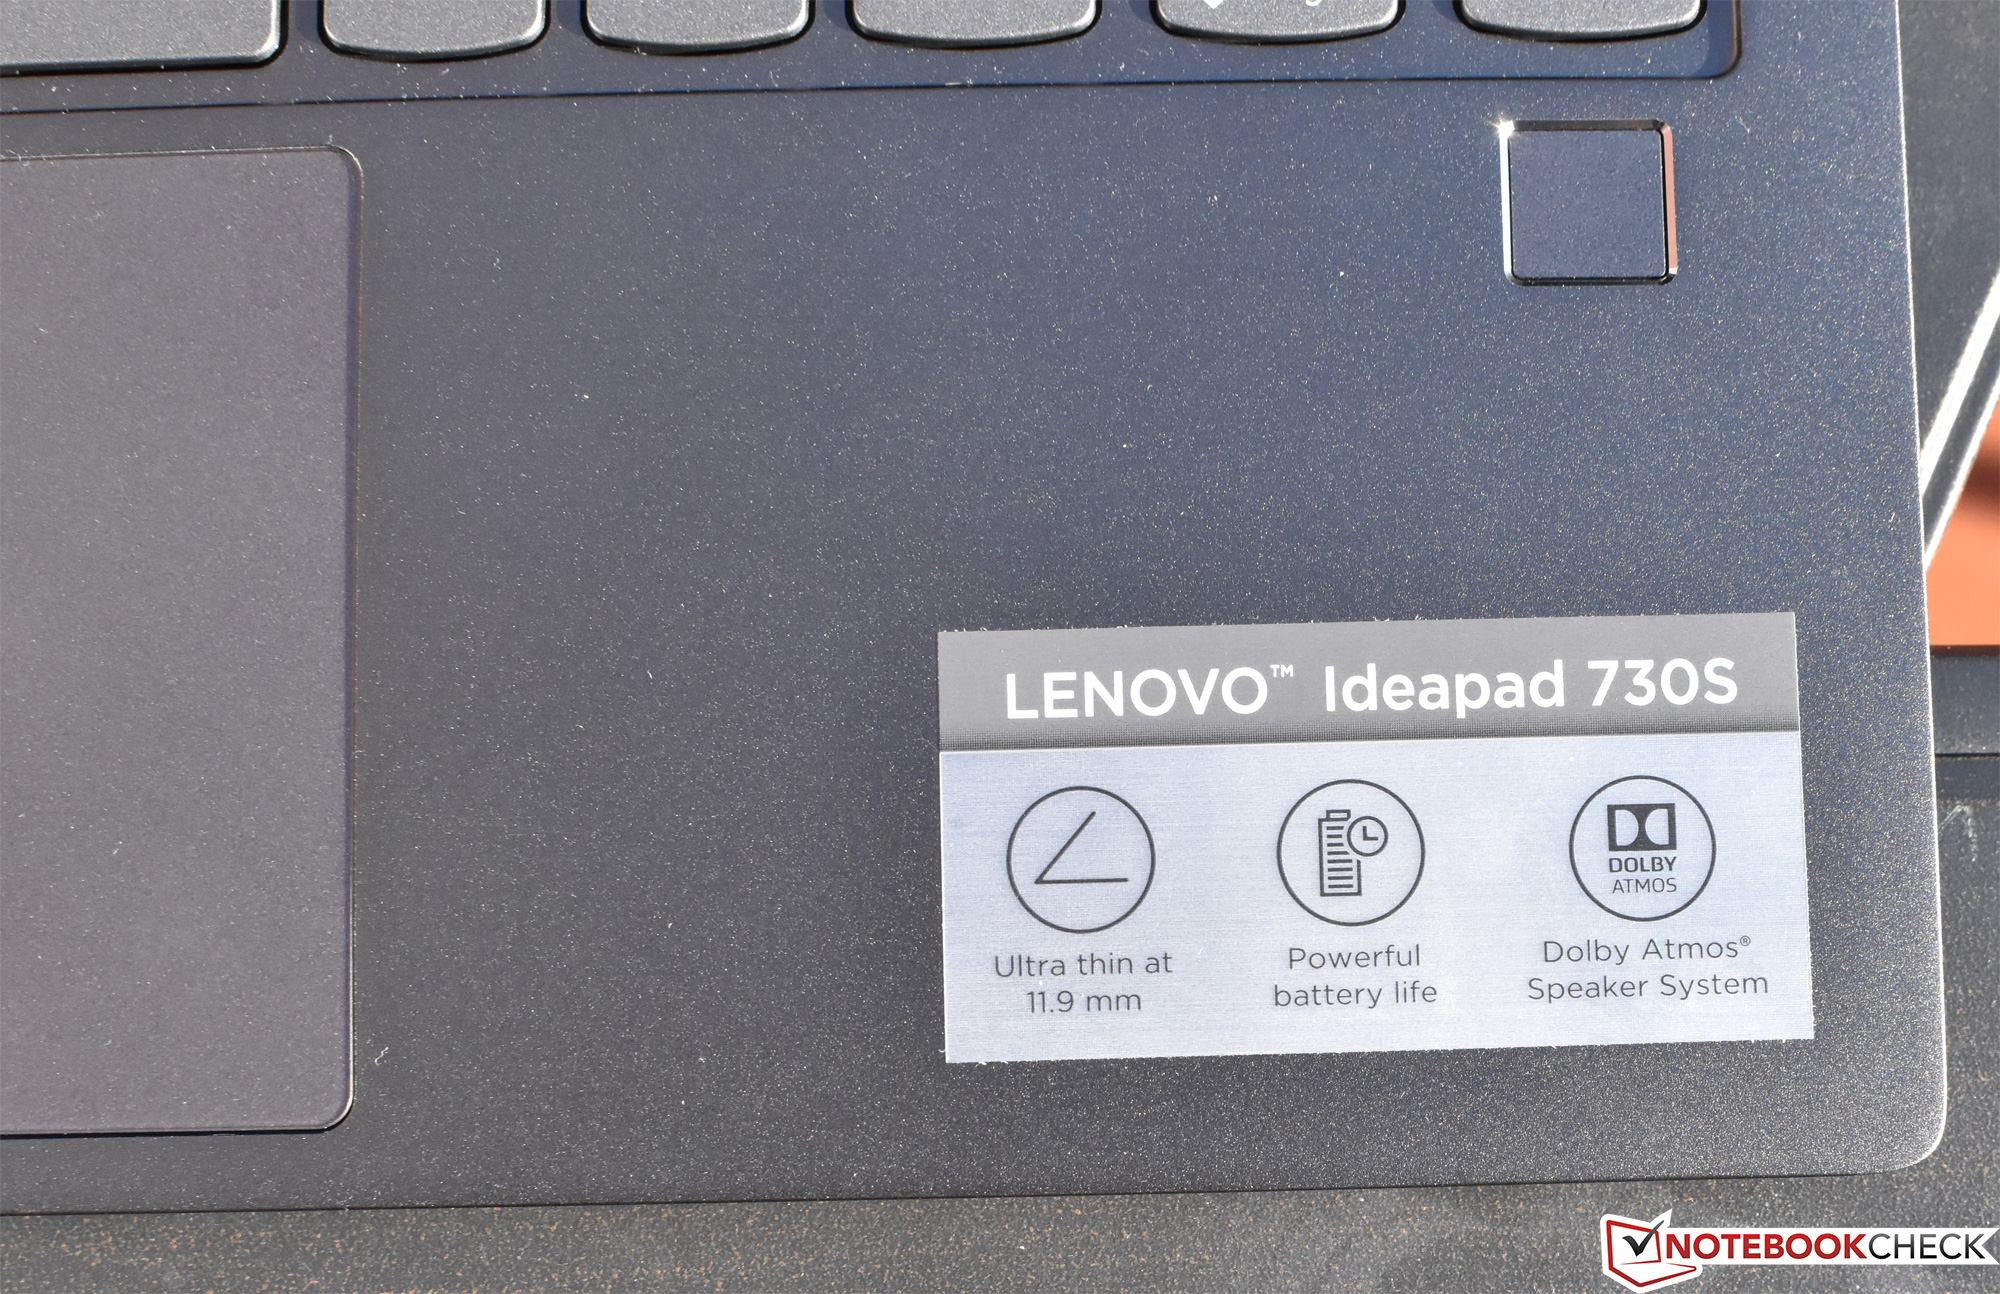
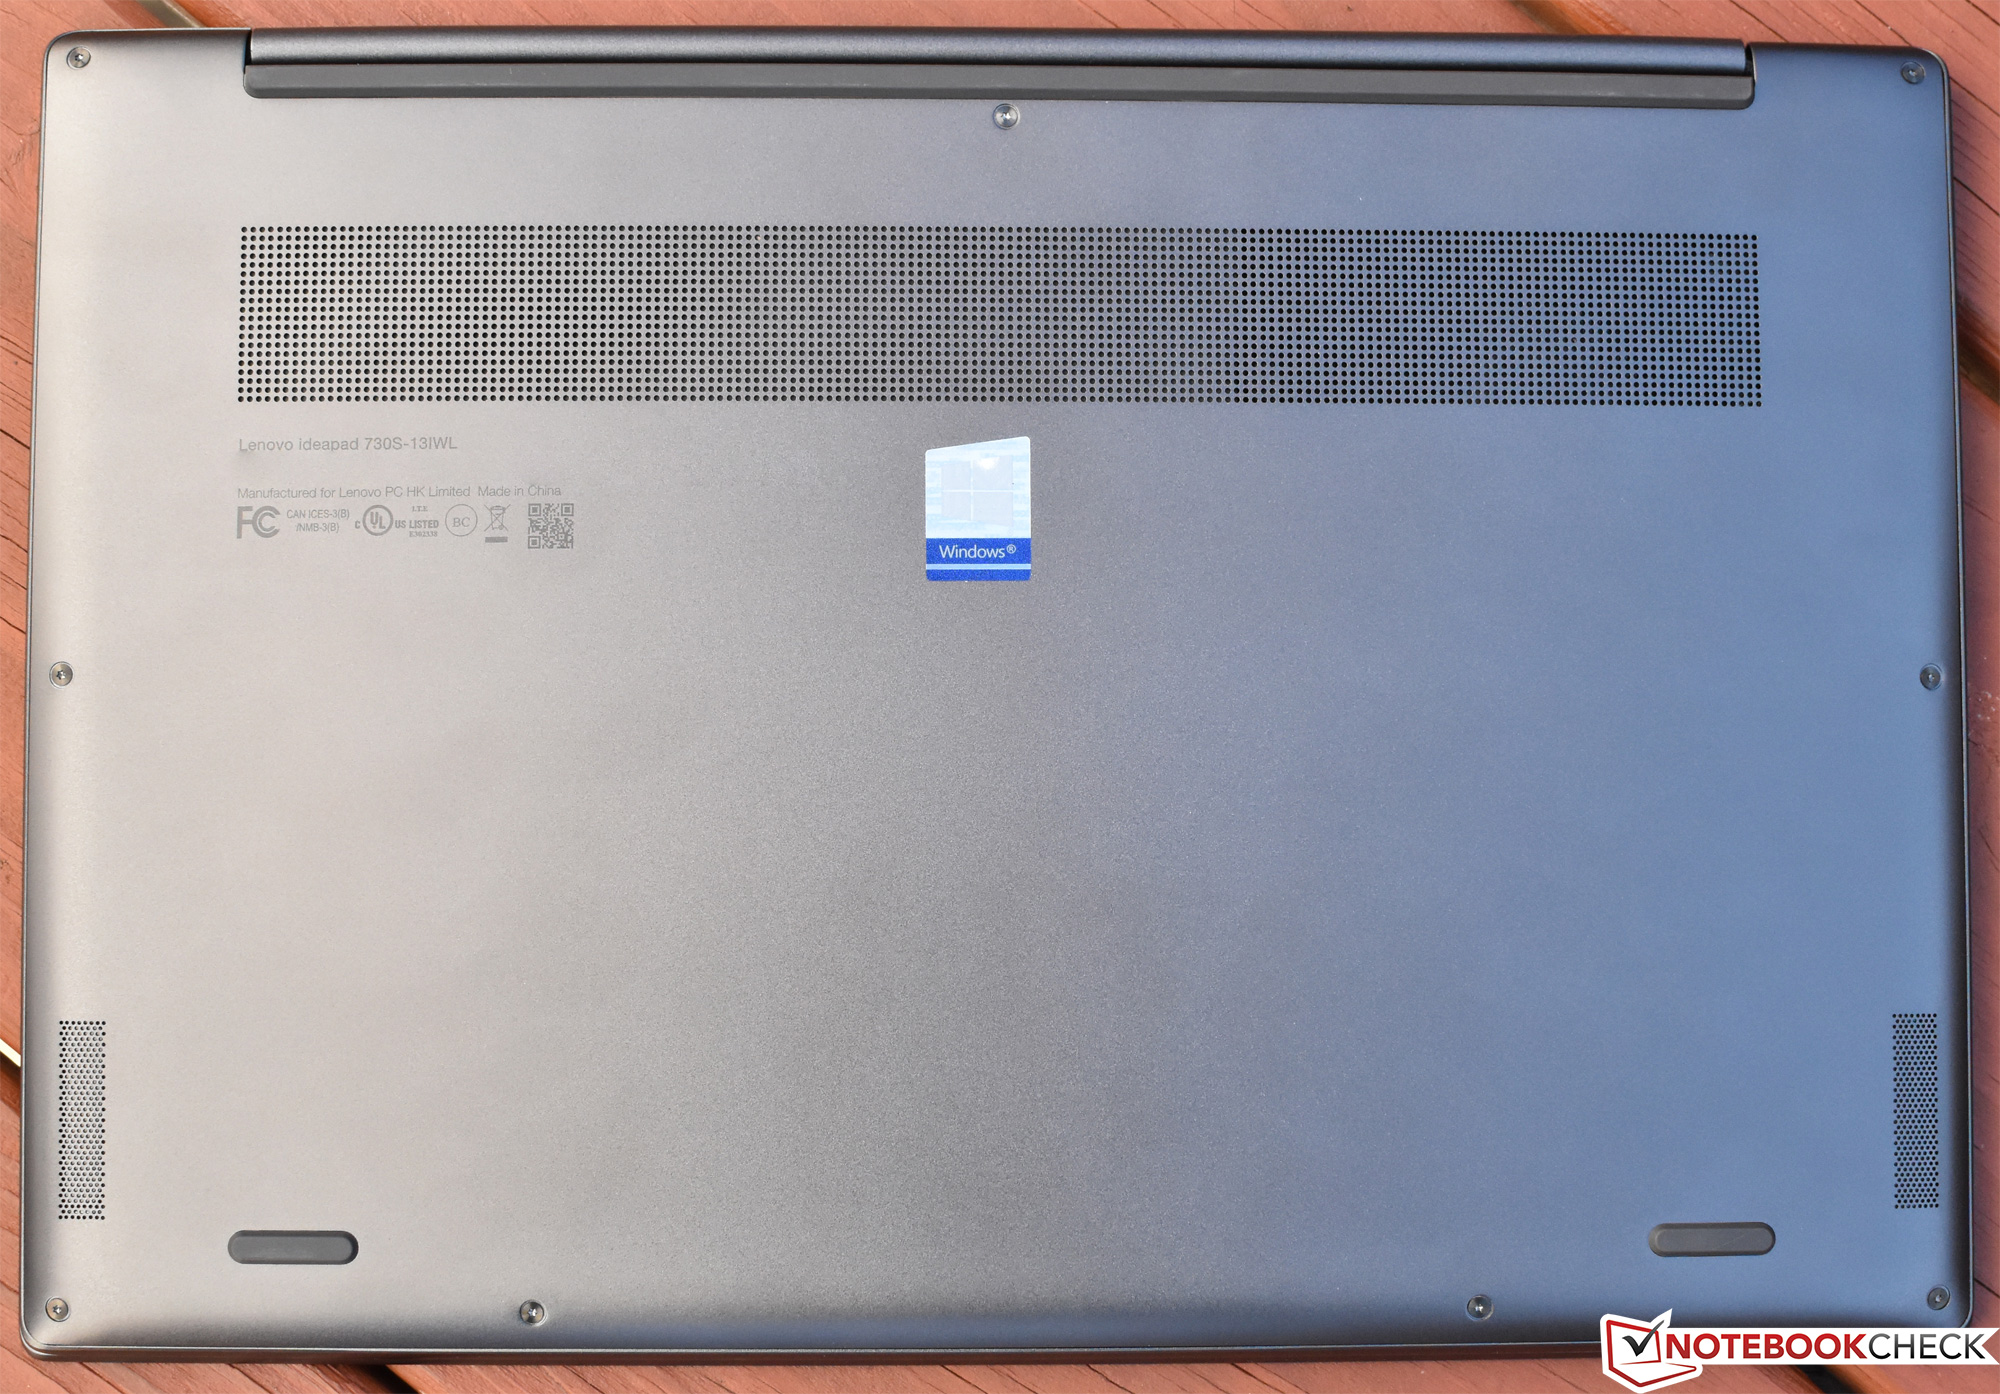
轻薄是IdeaPad 730S的拿手好戏,联想在这方面肯定有竞争优势。它占地面积小,重量轻(仅1.094千克),厚度仅为11.9毫米,是目前市场上最薄的超便携笔记本之一。由于铝制外壳和玻璃覆盖的显示屏保证了良好的稳定性,尽管后者比我们想象的更容易扭曲。
尽管CPU性能和连接性令人失望,870美元的IdeaPad 730S是超便携笔记本类别中的一台合理且经济实惠的替代品。
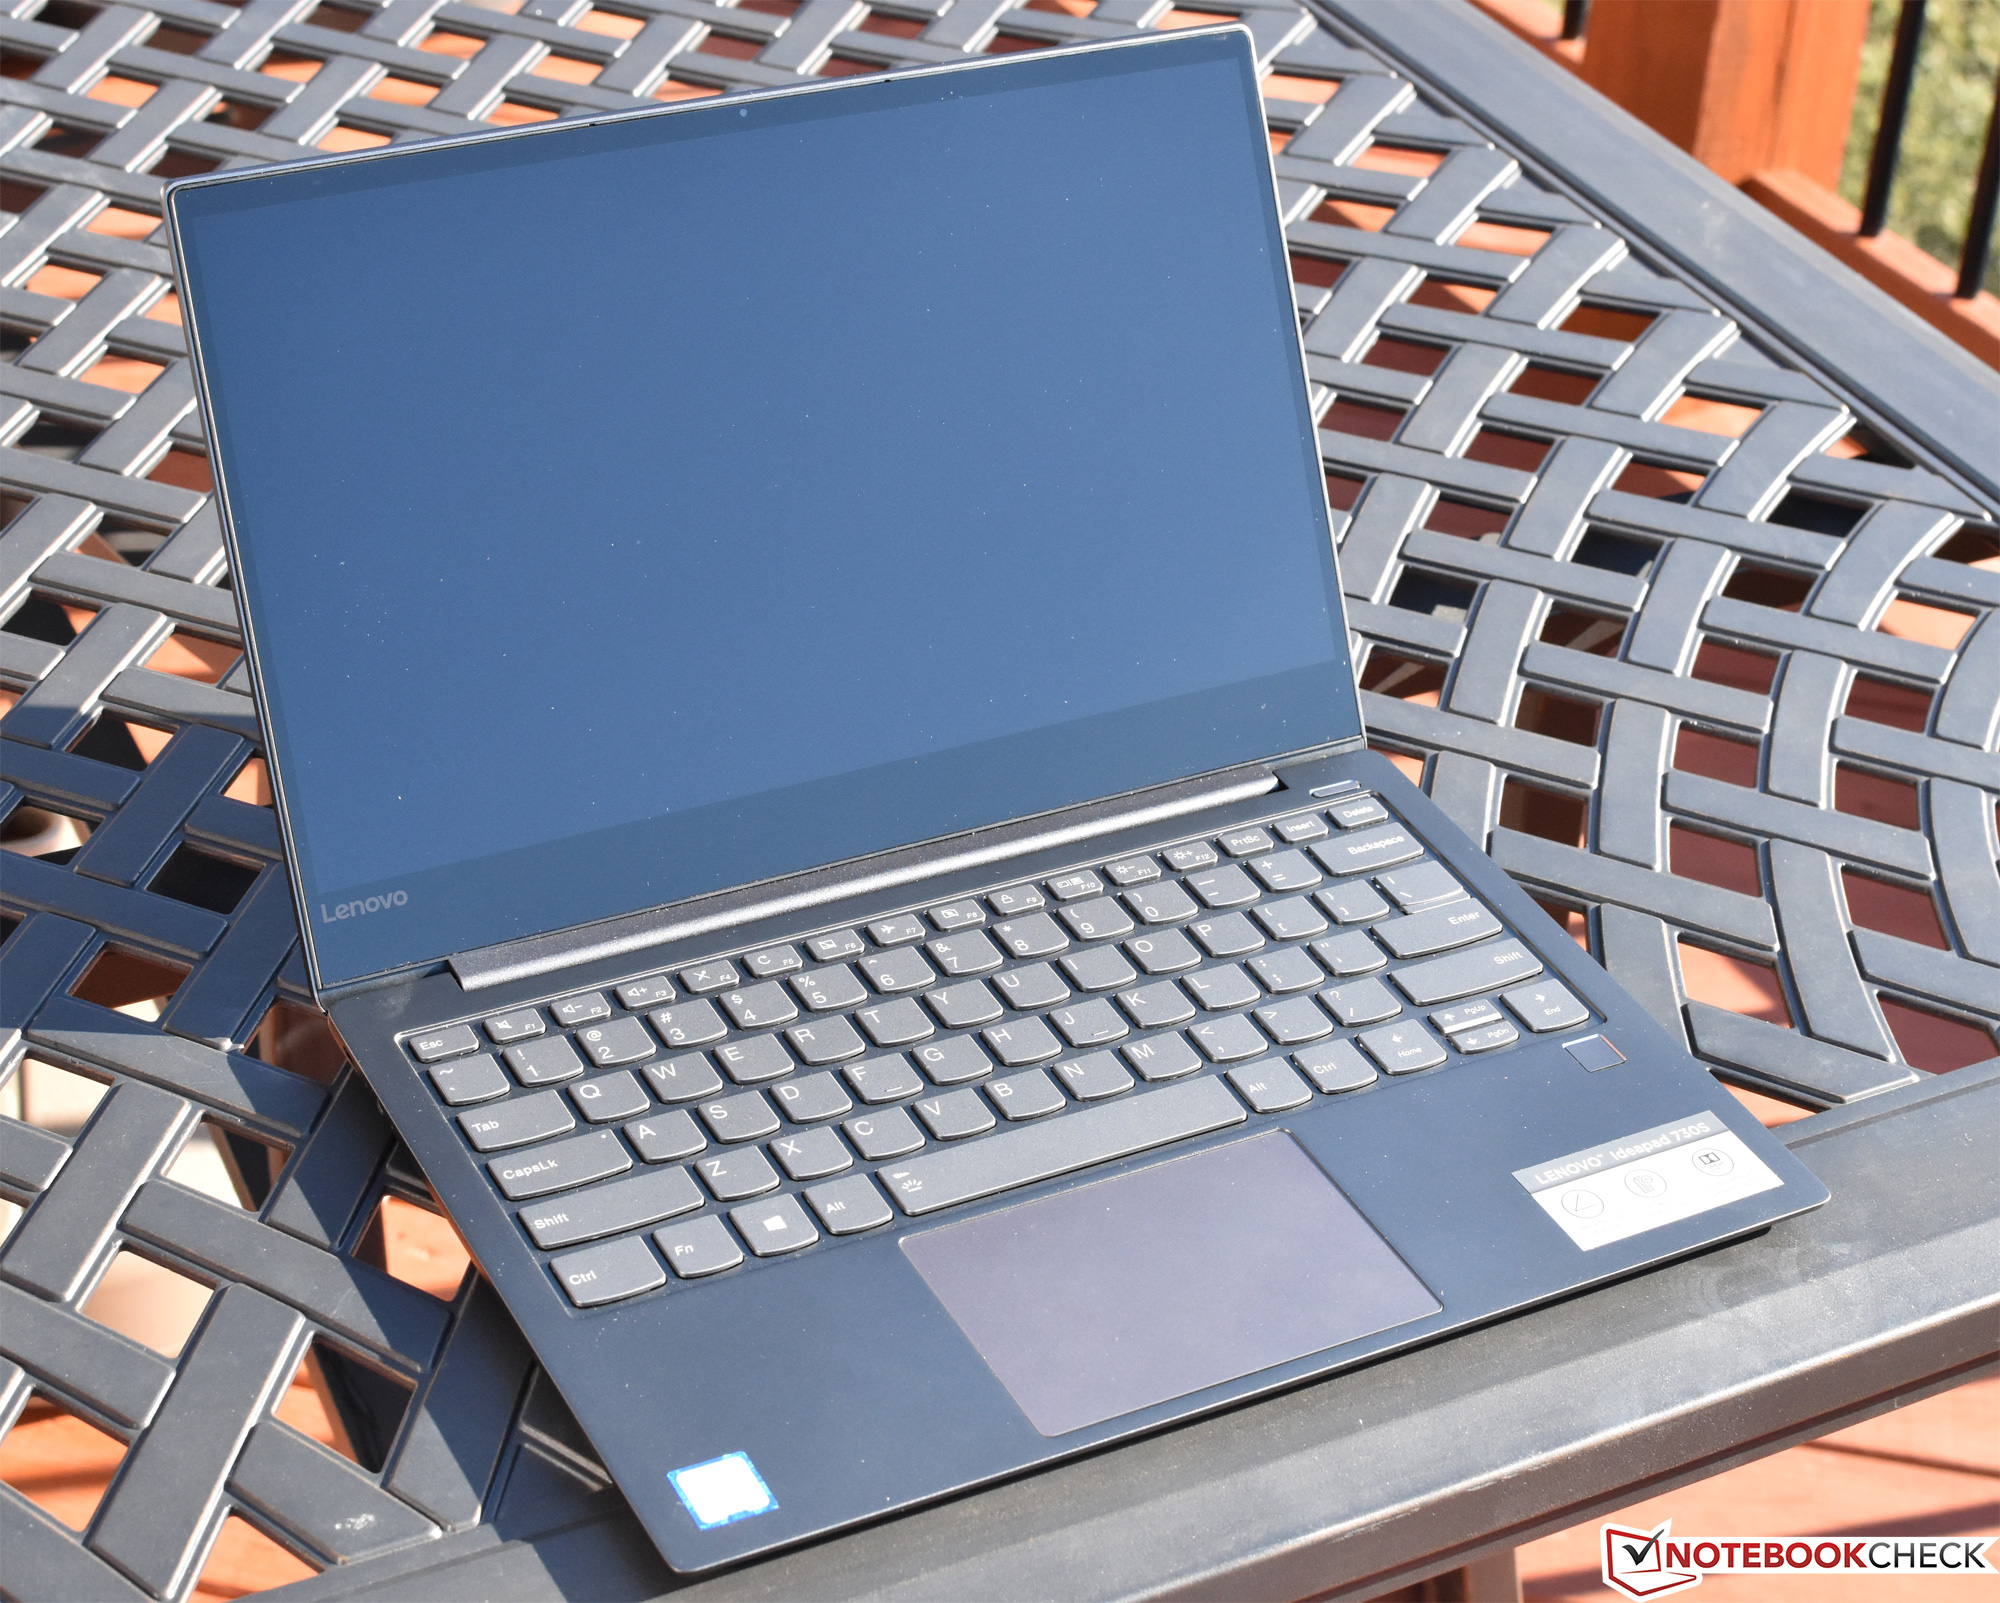
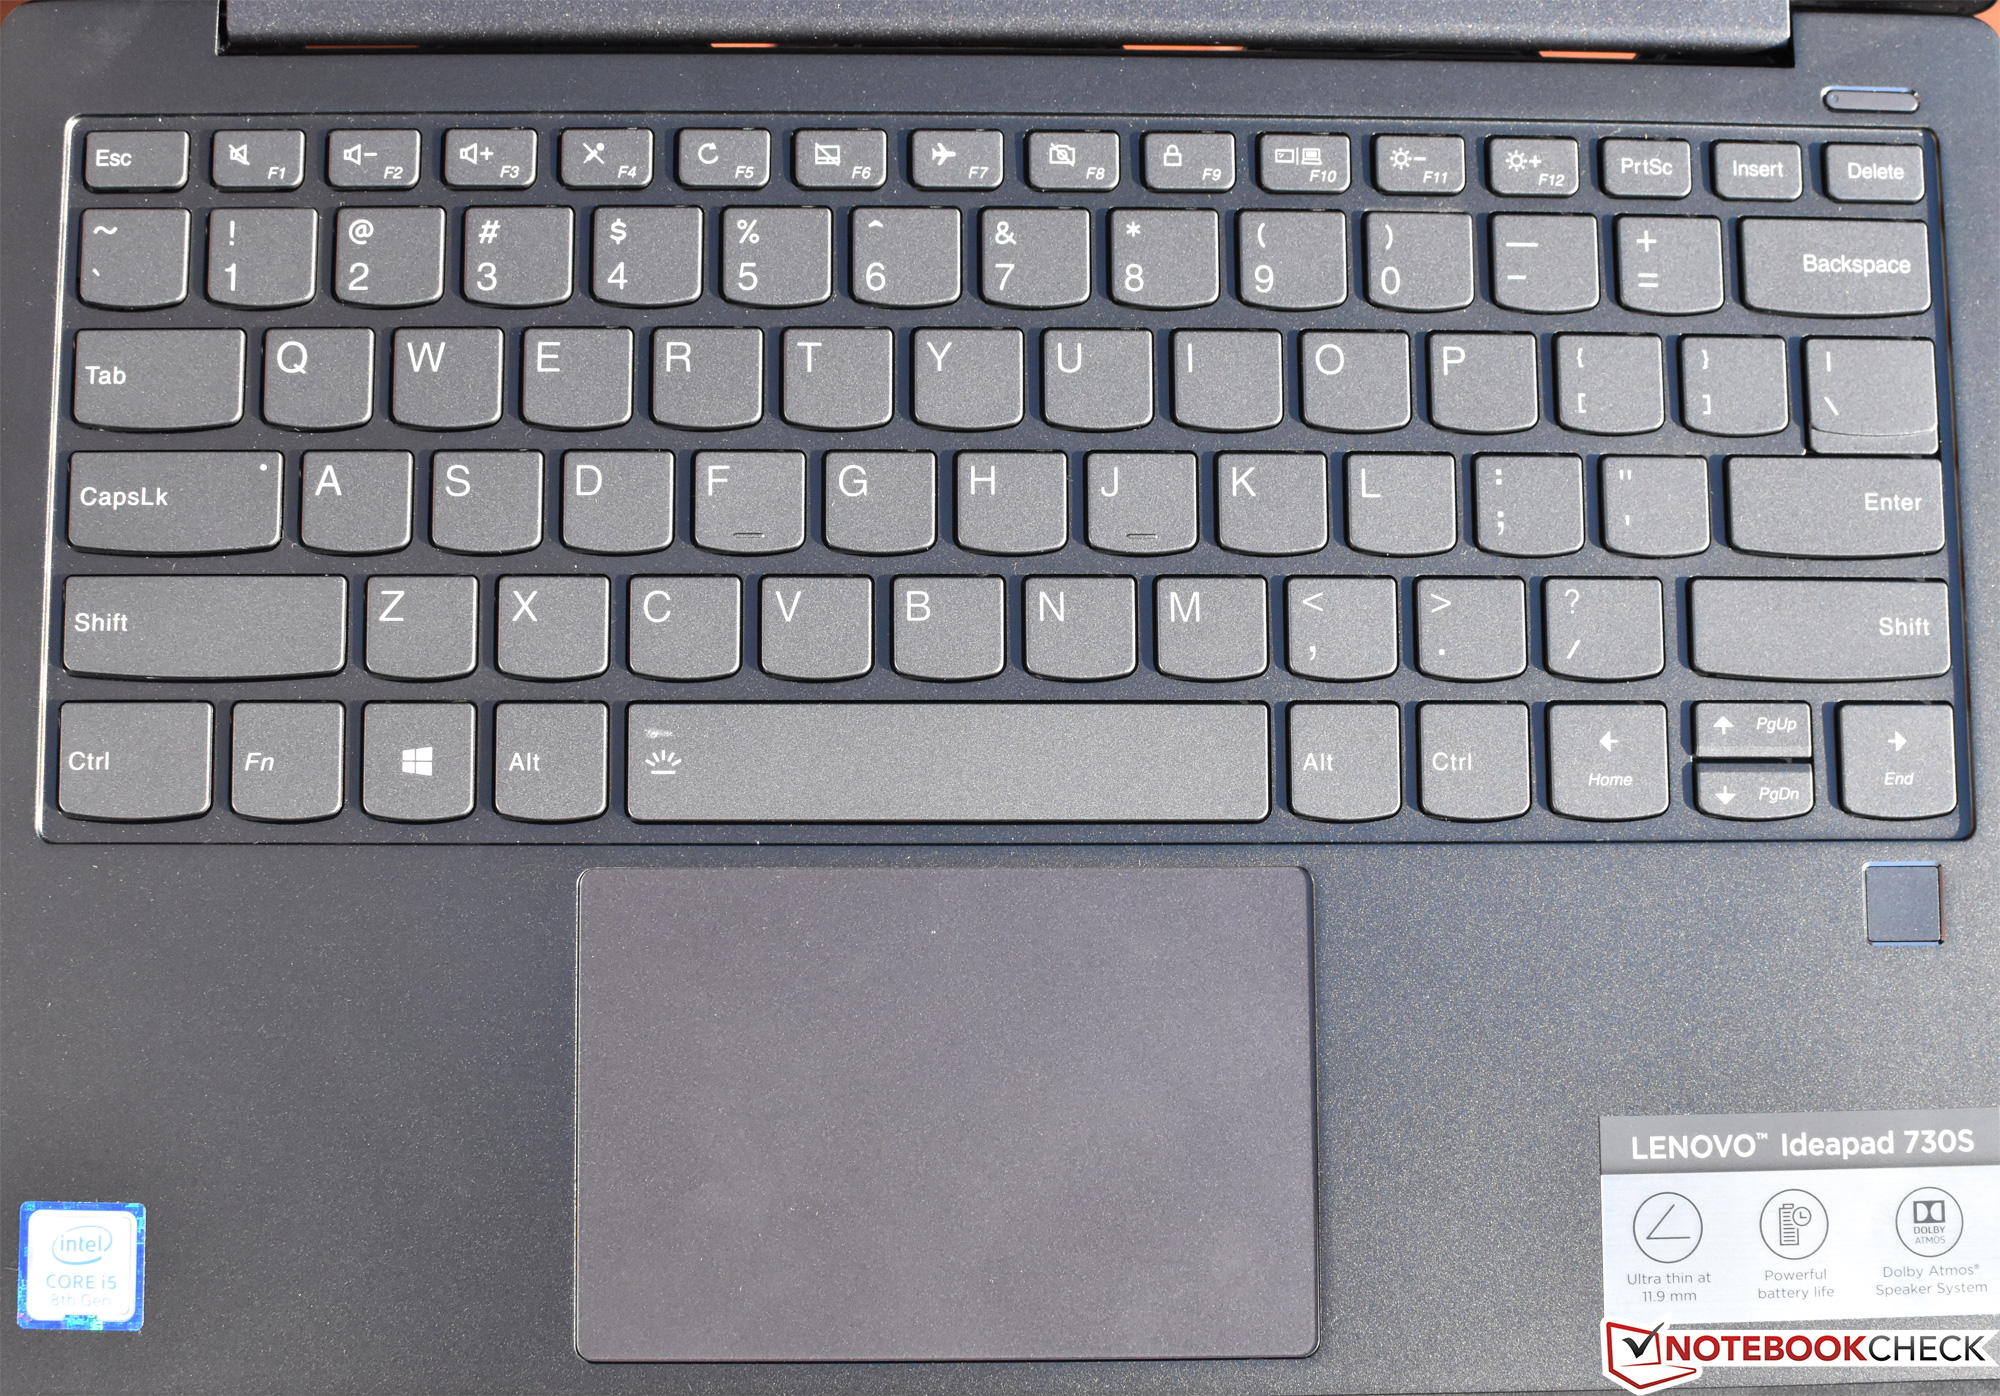
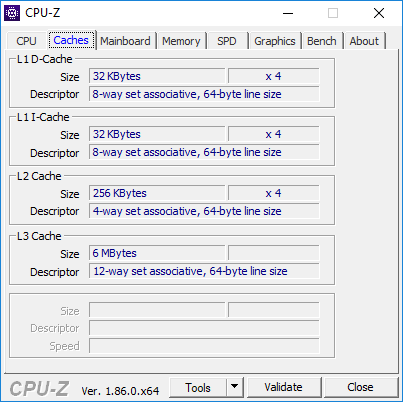
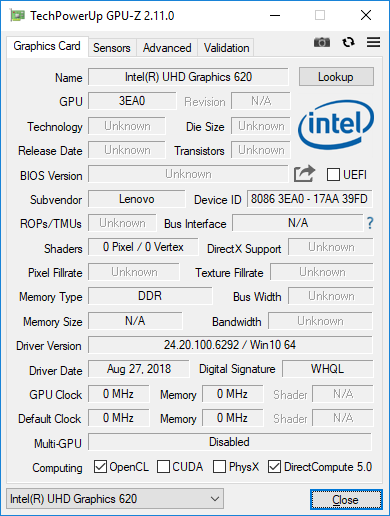
730S还具有极具吸引力的FHD显示屏,具有良好的亮度和对比度以及令人惊讶的色准渲染(尽管色域仅为AdobeRGB的61%)。输入设备对于这种尺寸的机器来说质量极高。由于高速的NVMe SSD以及其他地方普遍没有重大瓶颈,系统性能很是强劲。机器在大多数情况下安静,很少会有发热现象。我们对扬声器感到惊喜,扬声器非常响亮并且在大多数频谱中都表现良好。
这次评测中最大的失望来源于远低于同级的CPU性能,并受到热量的严重限制。联想集成的新型冷却方法(通过键盘腔和底部进风口进入)与单个小风扇相结合,似乎无法满足Core i5在今天的评测中的需求——所以我们对于升级到Core i7有强烈的的保留意见,因为Core i7的价格相当高,但性能可能与大多数配备Core i5的机器差不多。从一开始,CPU性能就低于同类的竞争对手,但在长期压力测试下它进一步的下降,直到比某些竞争对手低20%至30%(见:Microsoft Surface Laptop 2,戴尔XPS 13 9380)。
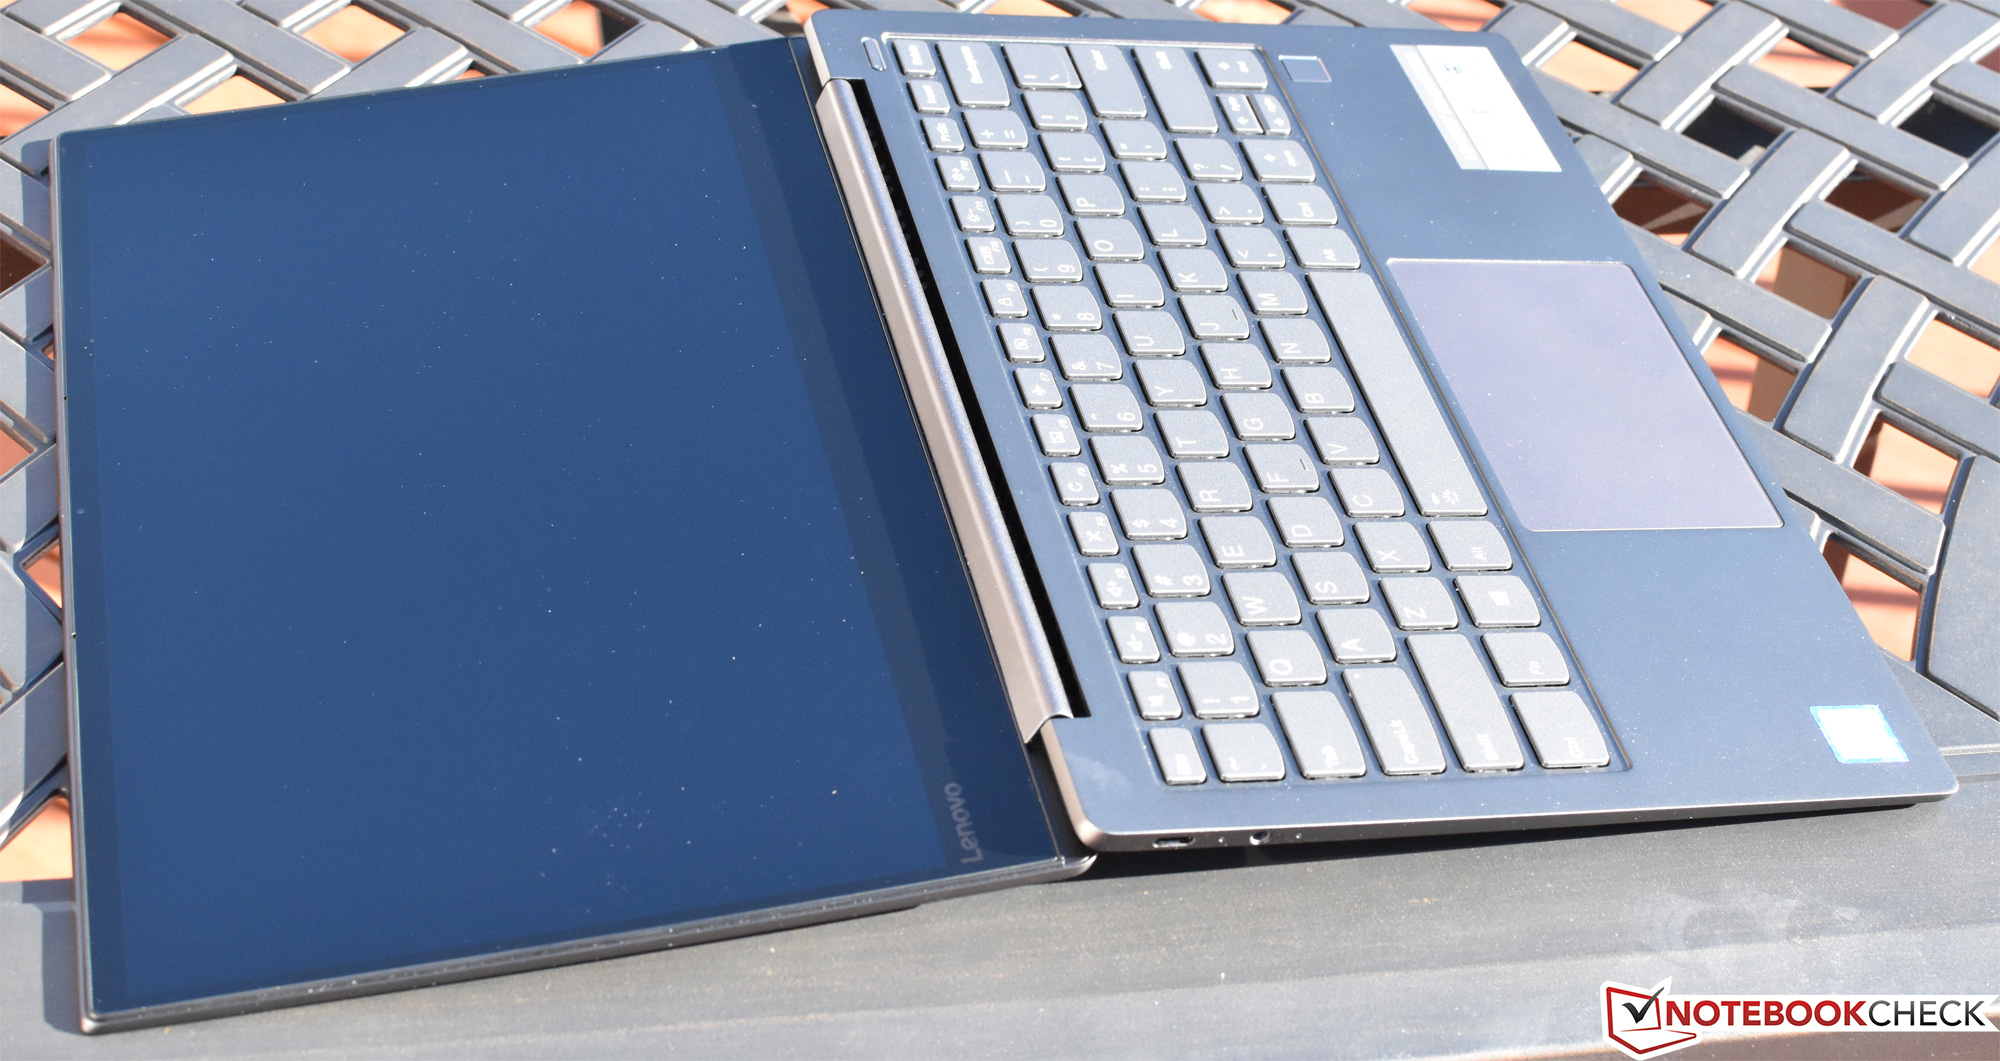
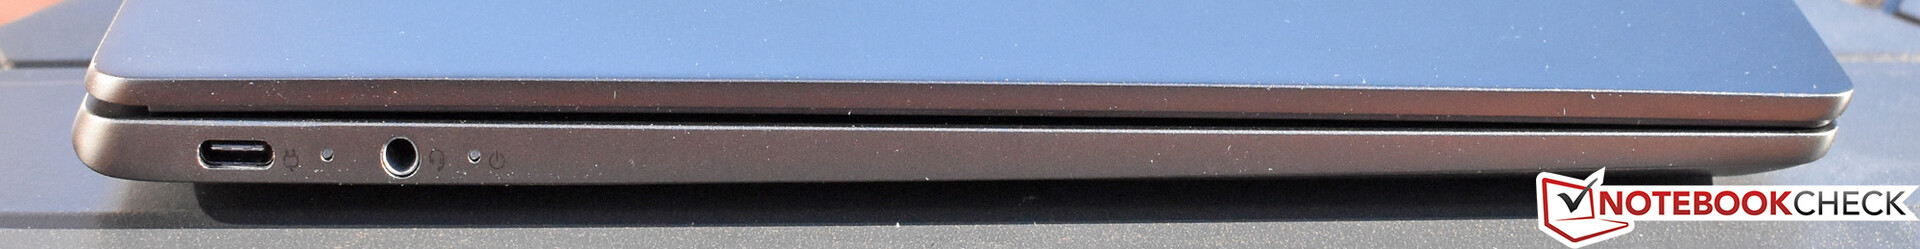
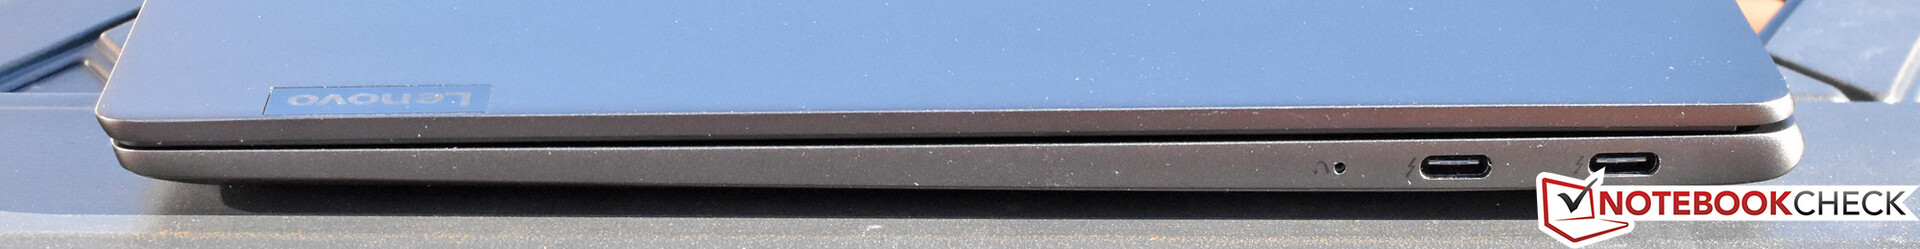
端口选择也有点令人失望,除了几个公认的多功能Thunderbolt 3端口,USB Type-C Gen 1端口和组合音频端口之外,没有任何空间。除此之外,我们还希望看到防眩光屏幕选项,虽然显示器盖的稳定性可能受限(由于玻璃的刚性较强,而这在防眩光屏版本上是不存在的)。
尽管如此,如果便携性的优先级很高,而CPU性能并不是关键,并且屏幕反射率/连接性限制不是一个交重要的缺点,IdeaPad 730S是一个很好的,价格实惠的旗舰级超极轻薄本的替代品。
Lenovo IdeaPad 730S-13IWL 81JB0004US
- 09/26/2019 v7 (old)
Steve Schardein
Price comparison

