微软Surface Laptop 2 (Core i5, 256 GB) 笔记本电脑评测

| |||||||||||||||||||||||||
Brightness Distribution: 89 %
Center on Battery: 392 cd/m²
Contrast: 1633:1 (Black: 0.24 cd/m²)
ΔE ColorChecker Calman: 3.2 | ∀{0.5-29.43 Ø4.72}
calibrated: 1.4
ΔE Greyscale Calman: 4.5 | ∀{0.09-98 Ø4.97}
95% sRGB (Argyll 1.6.3 3D)
63.9% AdobeRGB 1998 (Argyll 1.6.3 3D)
69.2% AdobeRGB 1998 (Argyll 3D)
94.7% sRGB (Argyll 3D)
68% Display P3 (Argyll 3D)
Gamma: 2.2
CCT: 7556 K
| Microsoft Surface Laptop 2-LQN-00004 VVX14T092N00, , 2256x1504, 13.5" | Microsoft Surface Laptop i5 ID: MEI96A2, Name: Panasonic VVX14T092N00, , 2256x1504, 13.5" | Microsoft Surface Pro 6, Core i7, 512 GB LGPhilips LP123WQ112604, , 2736x1824, 12.3" | Dell XPS 13 9370 i5 UHD ID: Sharp SHP148B, Name: LQ133D1, Dell P/N: 8XDHY, , 3840x2160, 13.3" | Apple MacBook Air 2018 APPA039, , 2560x1600, 13.3" | Asus ZenBook S UX391U AUO B133HAN04.9, , 1920x1080, 13.3" | |
|---|---|---|---|---|---|---|
| Display | 0% | -1% | 2% | 1% | -5% | |
| Display P3 Coverage (%) | 68 | 67.8 0% | 67.1 -1% | 68.9 1% | 67.8 0% | 64.4 -5% |
| sRGB Coverage (%) | 94.7 | 94.3 0% | 95.5 1% | 98.4 4% | 96.1 1% | 90.5 -4% |
| AdobeRGB 1998 Coverage (%) | 69.2 | 69.5 0% | 67.9 -2% | 69.5 0% | 69.8 1% | 65.2 -6% |
| Response Times | 24% | 42% | 7% | 42% | 36% | |
| Response Time Grey 50% / Grey 80% * (ms) | 69.2 ? | 50.8 ? 27% | 43 ? 38% | 67.2 ? 3% | 39.6 ? 43% | 44.8 ? 35% |
| Response Time Black / White * (ms) | 46.4 ? | 37.2 ? 20% | 25 ? 46% | 41.6 ? 10% | 28 ? 40% | 29.2 ? 37% |
| PWM Frequency (Hz) | 22000 ? | 2500 ? | 113600 ? | |||
| Screen | 6% | -3% | -6% | 16% | -29% | |
| Brightness middle (cd/m²) | 392 | 384.2 -2% | 484 23% | 496.4 27% | 320 -18% | 299 -24% |
| Brightness (cd/m²) | 390 | 378 -3% | 473 21% | 469 20% | 315 -19% | 300 -23% |
| Brightness Distribution (%) | 89 | 90 1% | 91 2% | 84 -6% | 95 7% | 92 3% |
| Black Level * (cd/m²) | 0.24 | 0.36 -50% | 0.33 -38% | 0.5 -108% | 0.29 -21% | 0.26 -8% |
| Contrast (:1) | 1633 | 1067 -35% | 1467 -10% | 993 -39% | 1103 -32% | 1150 -30% |
| Colorchecker dE 2000 * | 3.2 | 1.8 44% | 4.29 -34% | 2.9 9% | 1.2 63% | 5.6 -75% |
| Colorchecker dE 2000 max. * | 6.3 | 4.2 33% | 6.46 -3% | 5.26 17% | 3.2 49% | 9.1 -44% |
| Colorchecker dE 2000 calibrated * | 1.4 | 1.34 4% | 0.5 64% | 2.6 -86% | ||
| Greyscale dE 2000 * | 4.5 | 1.2 73% | 4.3 4% | 3.9 13% | 0.8 82% | 5.5 -22% |
| Gamma | 2.2 100% | 2.21 100% | 2.51 88% | 2.066 106% | 2.2 100% | 2.47 89% |
| CCT | 7556 86% | 6708 97% | 7315 89% | 7169 91% | 6548 99% | 7533 86% |
| Color Space (Percent of AdobeRGB 1998) (%) | 63.9 | 63.7 0% | 62 -3% | 63.9 0% | 62.1 -3% | 58.9 -8% |
| Color Space (Percent of sRGB) (%) | 95 | 94.2 -1% | 95 0% | 98.2 3% | 96 1% | 90.3 -5% |
| Total Average (Program / Settings) | 10% /
7% | 13% /
3% | 1% /
-3% | 20% /
16% | 1% /
-17% |
* ... smaller is better
Display Response Times
| ↔ Response Time Black to White | ||
|---|---|---|
| 46.4 ms ... rise ↗ and fall ↘ combined | ↗ 26 ms rise | 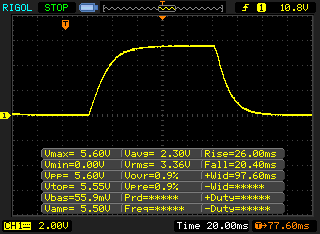 |
| ↘ 20.4 ms fall | ||
| The screen shows slow response rates in our tests and will be unsatisfactory for gamers. In comparison, all tested devices range from 0.1 (minimum) to 240 (maximum) ms. » 99 % of all devices are better. This means that the measured response time is worse than the average of all tested devices (19.8 ms). | ||
| ↔ Response Time 50% Grey to 80% Grey | ||
| 69.2 ms ... rise ↗ and fall ↘ combined | ↗ 34.8 ms rise | 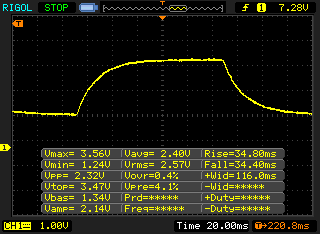 |
| ↘ 34.4 ms fall | ||
| The screen shows slow response rates in our tests and will be unsatisfactory for gamers. In comparison, all tested devices range from 0.165 (minimum) to 636 (maximum) ms. » 99 % of all devices are better. This means that the measured response time is worse than the average of all tested devices (31 ms). | ||
Screen Flickering / PWM (Pulse-Width Modulation)
| Screen flickering / PWM not detected | 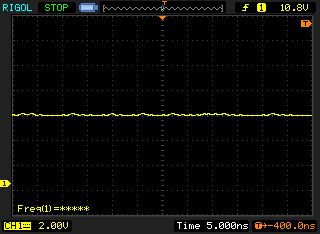 | ||
In comparison: 52 % of all tested devices do not use PWM to dim the display. If PWM was detected, an average of 7775 (minimum: 5 - maximum: 343500) Hz was measured. | |||

| PCMark 8 Home Score Accelerated v2 | 3153 points | |
| PCMark 8 Creative Score Accelerated v2 | 3927 points | |
| PCMark 8 Work Score Accelerated v2 | 4923 points | |
| PCMark 10 Score | 0 points | |
Help | ||
| Microsoft Surface Laptop 2-LQN-00004 SK Hynix BC501 NVMe 256 GB | Microsoft Surface Pro 6, Core i7, 512 GB Toshiba KBG30ZPZ512G | Dell XPS 13 9370 i5 UHD Toshiba XG5 KXG50ZNV256G | Apple MacBook Air 2018 Apple SSD AP0256 | Asus ZenBook S UX391U Samsung PM961 NVMe MZVLW512HMJP | Average SK Hynix BC501 NVMe 256 GB | |
|---|---|---|---|---|---|---|
| CrystalDiskMark 5.2 / 6 | -5% | 29% | 17% | 41% | 10% | |
| Write 4K (MB/s) | 87.3 | 83.2 -5% | 121.4 39% | 118 35% | 98.9 13% | 110 ? 26% |
| Read 4K (MB/s) | 36.52 | 43.84 20% | 33.42 -8% | 29.97 -18% | 38.33 5% | 36.6 ? 0% |
| Write Seq (MB/s) | 716 | 636 -11% | 385.3 -46% | 1000 40% | 1414 97% | 699 ? -2% |
| Read Seq (MB/s) | 1009 | 900 -11% | 1958 94% | 1218 21% | 1051 4% | 1057 ? 5% |
| Write 4K Q32T1 (MB/s) | 324.1 | 192.9 -40% | 375.7 16% | 232.1 -28% | 370.7 14% | 359 ? 11% |
| Read 4K Q32T1 (MB/s) | 249 | 247.4 -1% | 364.1 46% | 254 2% | 251.4 1% | 339 ? 36% |
| Write Seq Q32T1 (MB/s) | 811 | 861 6% | 1069 32% | 1001 23% | 1606 98% | 813 ? 0% |
| Read Seq Q32T1 (MB/s) | 1631 | 1615 -1% | 2564 57% | 2555 57% | 3218 97% | 1670 ? 2% |

| 3DMark 11 Performance | 2065 points | |
| 3DMark Cloud Gate Standard Score | 8910 points | |
| 3DMark Fire Strike Score | 1162 points | |
| 3DMark Time Spy Score | 446 points | |
Help | ||
| low | med. | high | ultra | |
|---|---|---|---|---|
| BioShock Infinite (2013) | 55.6 | 34.1 | 29.5 | 9.2 |
| The Witcher 3 (2015) | 16.6 | |||
| Rocket League (2017) | 93.9 | 34.8 | 21.6 |
Noise level
| Idle |
| 28.7 / 28.7 / 28.7 dB(A) |
| Load |
| 30 / 32.9 dB(A) |
 | ||
30 dB silent 40 dB(A) audible 50 dB(A) loud |
||
min: | ||
| Microsoft Surface Laptop 2-LQN-00004 UHD Graphics 620, i5-8250U, SK Hynix BC501 NVMe 256 GB | Microsoft Surface Laptop i5 HD Graphics 620, i5-7200U, Toshiba THNSN0128GTYA | Microsoft Surface Pro 6, Core i7, 512 GB UHD Graphics 620, i7-8650U, Toshiba KBG30ZPZ512G | Dell XPS 13 9370 i5 UHD UHD Graphics 620, i5-8250U, Toshiba XG5 KXG50ZNV256G | Apple MacBook Air 2018 UHD Graphics 617, i5-8210Y, Apple SSD AP0256 | Asus ZenBook S UX391U UHD Graphics 620, i5-8550U, Samsung PM961 NVMe MZVLW512HMJP | |
|---|---|---|---|---|---|---|
| Noise | -3% | -6% | -6% | -4% | -8% | |
| off / environment * (dB) | 28.7 | 28.2 2% | 30.3 -6% | 29 -1% | 28.5 1% | 29.7 -3% |
| Idle Minimum * (dB) | 28.7 | 28.2 2% | 30.3 -6% | 29 -1% | 28.5 1% | 29.7 -3% |
| Idle Average * (dB) | 28.7 | 28.2 2% | 30.3 -6% | 29 -1% | 28.5 1% | 29.7 -3% |
| Idle Maximum * (dB) | 28.7 | 29 -1% | 30.3 -6% | 29 -1% | 28.5 1% | 30.1 -5% |
| Load Average * (dB) | 30 | 30.3 -1% | 33.5 -12% | 32 -7% | 30 -0% | 36.8 -23% |
| Load Maximum * (dB) | 32.9 | 39.3 -19% | 33.5 -2% | 40.1 -22% | 41.8 -27% | 36.8 -12% |
* ... smaller is better
(+) The maximum temperature on the upper side is 39.3 °C / 103 F, compared to the average of 35.9 °C / 97 F, ranging from 21.4 to 59 °C for the class Subnotebook.
(±) The bottom heats up to a maximum of 42 °C / 108 F, compared to the average of 39.2 °C / 103 F
(+) In idle usage, the average temperature for the upper side is 23 °C / 73 F, compared to the device average of 30.8 °C / 87 F.
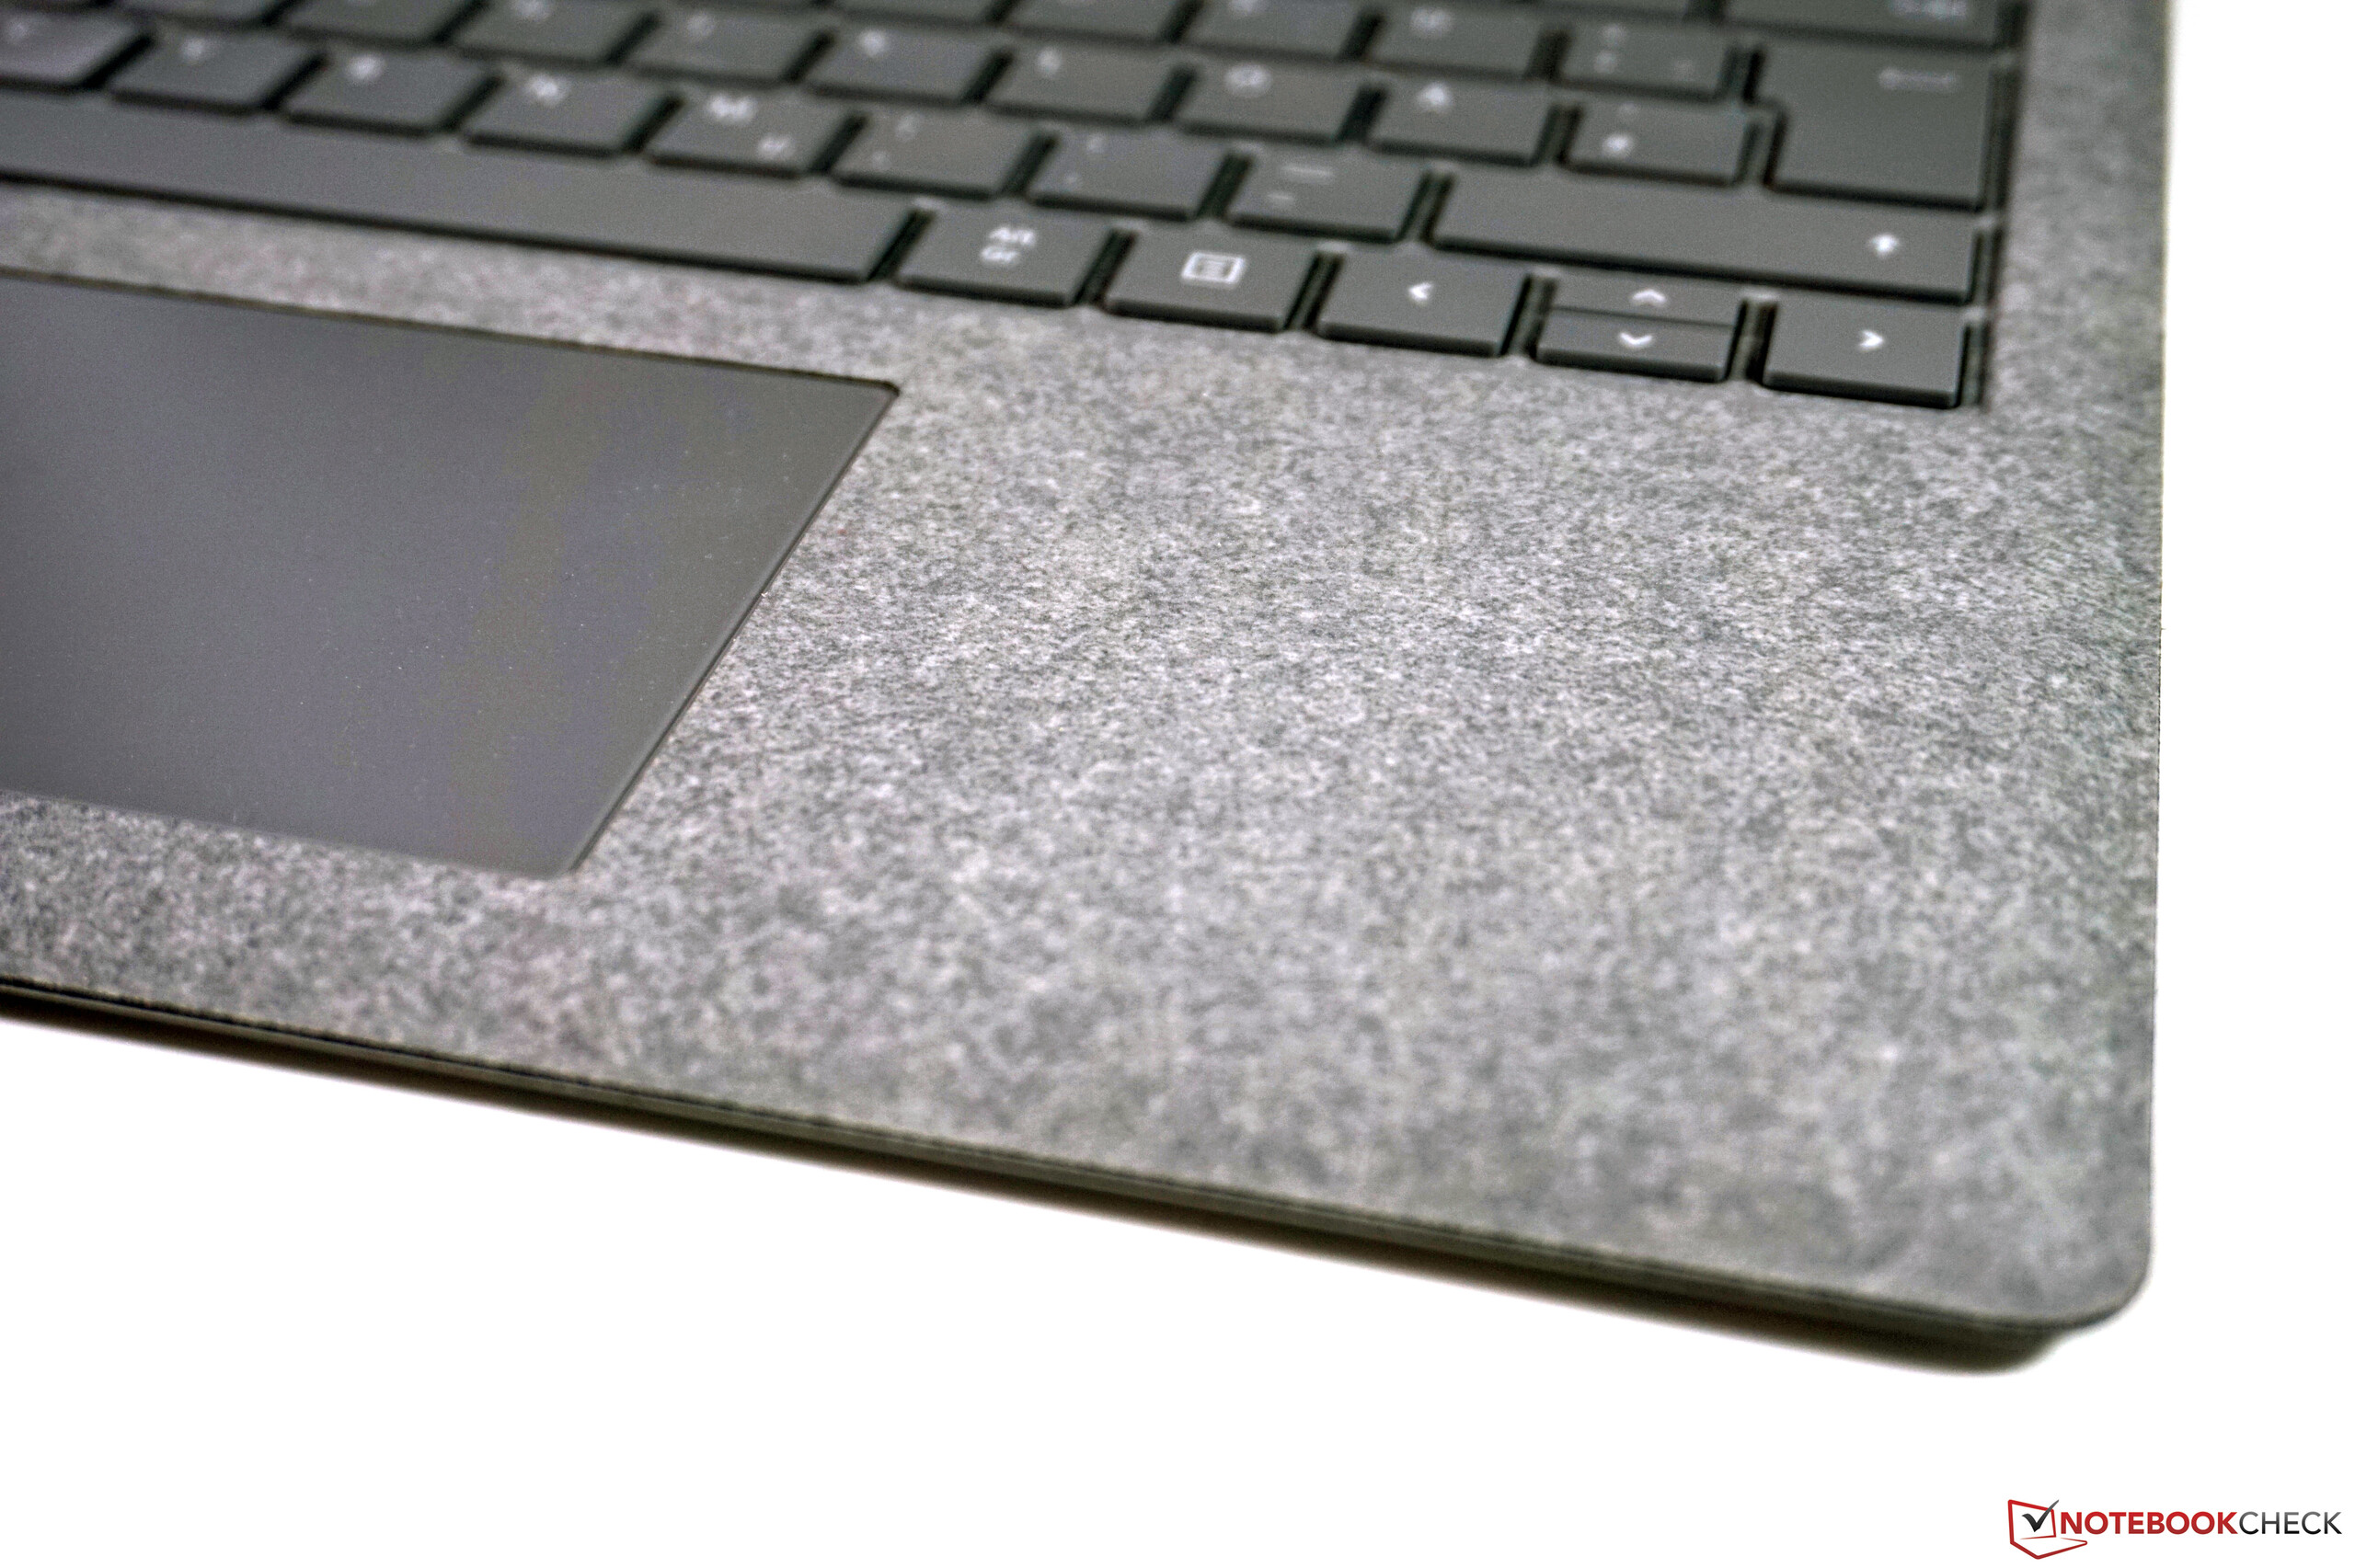
(+) The palmrests and touchpad are cooler than skin temperature with a maximum of 29.2 °C / 84.6 F and are therefore cool to the touch.
(±) The average temperature of the palmrest area of similar devices was 28.2 °C / 82.8 F (-1 °C / -1.8 F).
Microsoft Surface Laptop 2-LQN-00004 audio analysis
(±) | speaker loudness is average but good (72 dB)
Bass 100 - 315 Hz
(±) | reduced bass - on average 10.5% lower than median
(±) | linearity of bass is average (12.2% delta to prev. frequency)
Mids 400 - 2000 Hz
(+) | balanced mids - only 2.7% away from median
(+) | mids are linear (4.2% delta to prev. frequency)
Highs 2 - 16 kHz
(+) | balanced highs - only 1.4% away from median
(+) | highs are linear (4.7% delta to prev. frequency)
Overall 100 - 16.000 Hz
(+) | overall sound is linear (14.5% difference to median)
Compared to same class
» 29% of all tested devices in this class were better, 6% similar, 65% worse
» The best had a delta of 5%, average was 18%, worst was 53%
Compared to all devices tested
» 18% of all tested devices were better, 4% similar, 78% worse
» The best had a delta of 4%, average was 24%, worst was 134%
Apple MacBook Air 2018 audio analysis
(±) | speaker loudness is average but good (75 dB)
Bass 100 - 315 Hz
(±) | reduced bass - on average 8.1% lower than median
(±) | linearity of bass is average (10% delta to prev. frequency)
Mids 400 - 2000 Hz
(+) | balanced mids - only 2.9% away from median
(+) | mids are linear (5.6% delta to prev. frequency)
Highs 2 - 16 kHz
(+) | balanced highs - only 2.2% away from median
(+) | highs are linear (4.5% delta to prev. frequency)
Overall 100 - 16.000 Hz
(+) | overall sound is linear (12.3% difference to median)
Compared to same class
» 16% of all tested devices in this class were better, 5% similar, 80% worse
» The best had a delta of 5%, average was 18%, worst was 53%
Compared to all devices tested
» 10% of all tested devices were better, 3% similar, 87% worse
» The best had a delta of 4%, average was 24%, worst was 134%
| Off / Standby | |
| Idle | |
| Load |
|
Key:
min: | |
| Microsoft Surface Laptop 2-LQN-00004 i5-8250U, UHD Graphics 620, SK Hynix BC501 NVMe 256 GB, IPS, 2256x1504, 13.5" | Microsoft Surface Laptop i5 i5-7200U, HD Graphics 620, Toshiba THNSN0128GTYA, IPS, 2256x1504, 13.5" | Microsoft Surface Pro 6, Core i7, 512 GB i7-8650U, UHD Graphics 620, Toshiba KBG30ZPZ512G, IPS, 2736x1824, 12.3" | Dell XPS 13 9370 i5 UHD i5-8250U, UHD Graphics 620, Toshiba XG5 KXG50ZNV256G, IPS, 3840x2160, 13.3" | Apple MacBook Air 2018 i5-8210Y, UHD Graphics 617, Apple SSD AP0256, IPS, 2560x1600, 13.3" | Asus ZenBook S UX391U i5-8550U, UHD Graphics 620, Samsung PM961 NVMe MZVLW512HMJP, IPS, 1920x1080, 13.3" | Average Intel UHD Graphics 620 | Average of class Subnotebook | |
|---|---|---|---|---|---|---|---|---|
| Power Consumption | 11% | -7% | -21% | 16% | -7% | -8% | -18% | |
| Idle Minimum * (Watt) | 3 | 3.2 -7% | 3.2 -7% | 4.3 -43% | 2.2 27% | 3.24 -8% | 3.81 ? -27% | 3.86 ? -29% |
| Idle Average * (Watt) | 6.8 | 6.5 4% | 8.7 -28% | 8 -18% | 5.7 16% | 6.1 10% | 6.94 ? -2% | 6.61 ? 3% |
| Idle Maximum * (Watt) | 8.76 | 6.8 22% | 10.4 -19% | 8.1 8% | 10.3 -18% | 9.2 -5% | 8.75 ? -0% | 8 ? 9% |
| Load Average * (Watt) | 35.1 | 28.2 20% | 29.2 17% | 46.6 -33% | 25.6 27% | 38.8 -11% | 35 ? -0% | 42.2 ? -20% |
| Load Maximum * (Watt) | 42.6 | 36 15% | 40.8 4% | 49.8 -17% | 30.6 28% | 52.6 -23% | 47.5 ? -12% | 64.5 ? -51% |
* ... smaller is better
| Microsoft Surface Laptop 2-LQN-00004 i5-8250U, UHD Graphics 620, 45 Wh | Microsoft Surface Laptop i5 i5-7200U, HD Graphics 620, 45 Wh | Microsoft Surface Pro 6, Core i7, 512 GB i7-8650U, UHD Graphics 620, 45 Wh | Dell XPS 13 9370 i5 UHD i5-8250U, UHD Graphics 620, 52 Wh | Apple MacBook Air 2018 i5-8210Y, UHD Graphics 617, 50.3 Wh | Asus ZenBook S UX391U i5-8550U, UHD Graphics 620, 50 Wh | Average of class Subnotebook | |
|---|---|---|---|---|---|---|---|
| Battery runtime | 16% | 6% | -14% | 17% | -2% | 32% | |
| Reader / Idle (h) | 20.8 | 22.5 8% | 18.1 -13% | 14.5 -30% | 22.3 7% | 28.6 ? 38% | |
| H.264 (h) | 13.6 | 12.3 -10% | 10.4 -24% | 15.4 ? 13% | |||
| WiFi v1.3 (h) | 9.1 | 10 10% | 8.5 -7% | 6.8 -25% | 11.1 22% | 8.2 -10% | 14 ? 54% |
| Load (h) | 1.6 | 2.1 31% | 2.2 38% | 1.8 13% | 2.2 38% | 1.9 19% | 1.969 ? 23% |
Pros
Cons
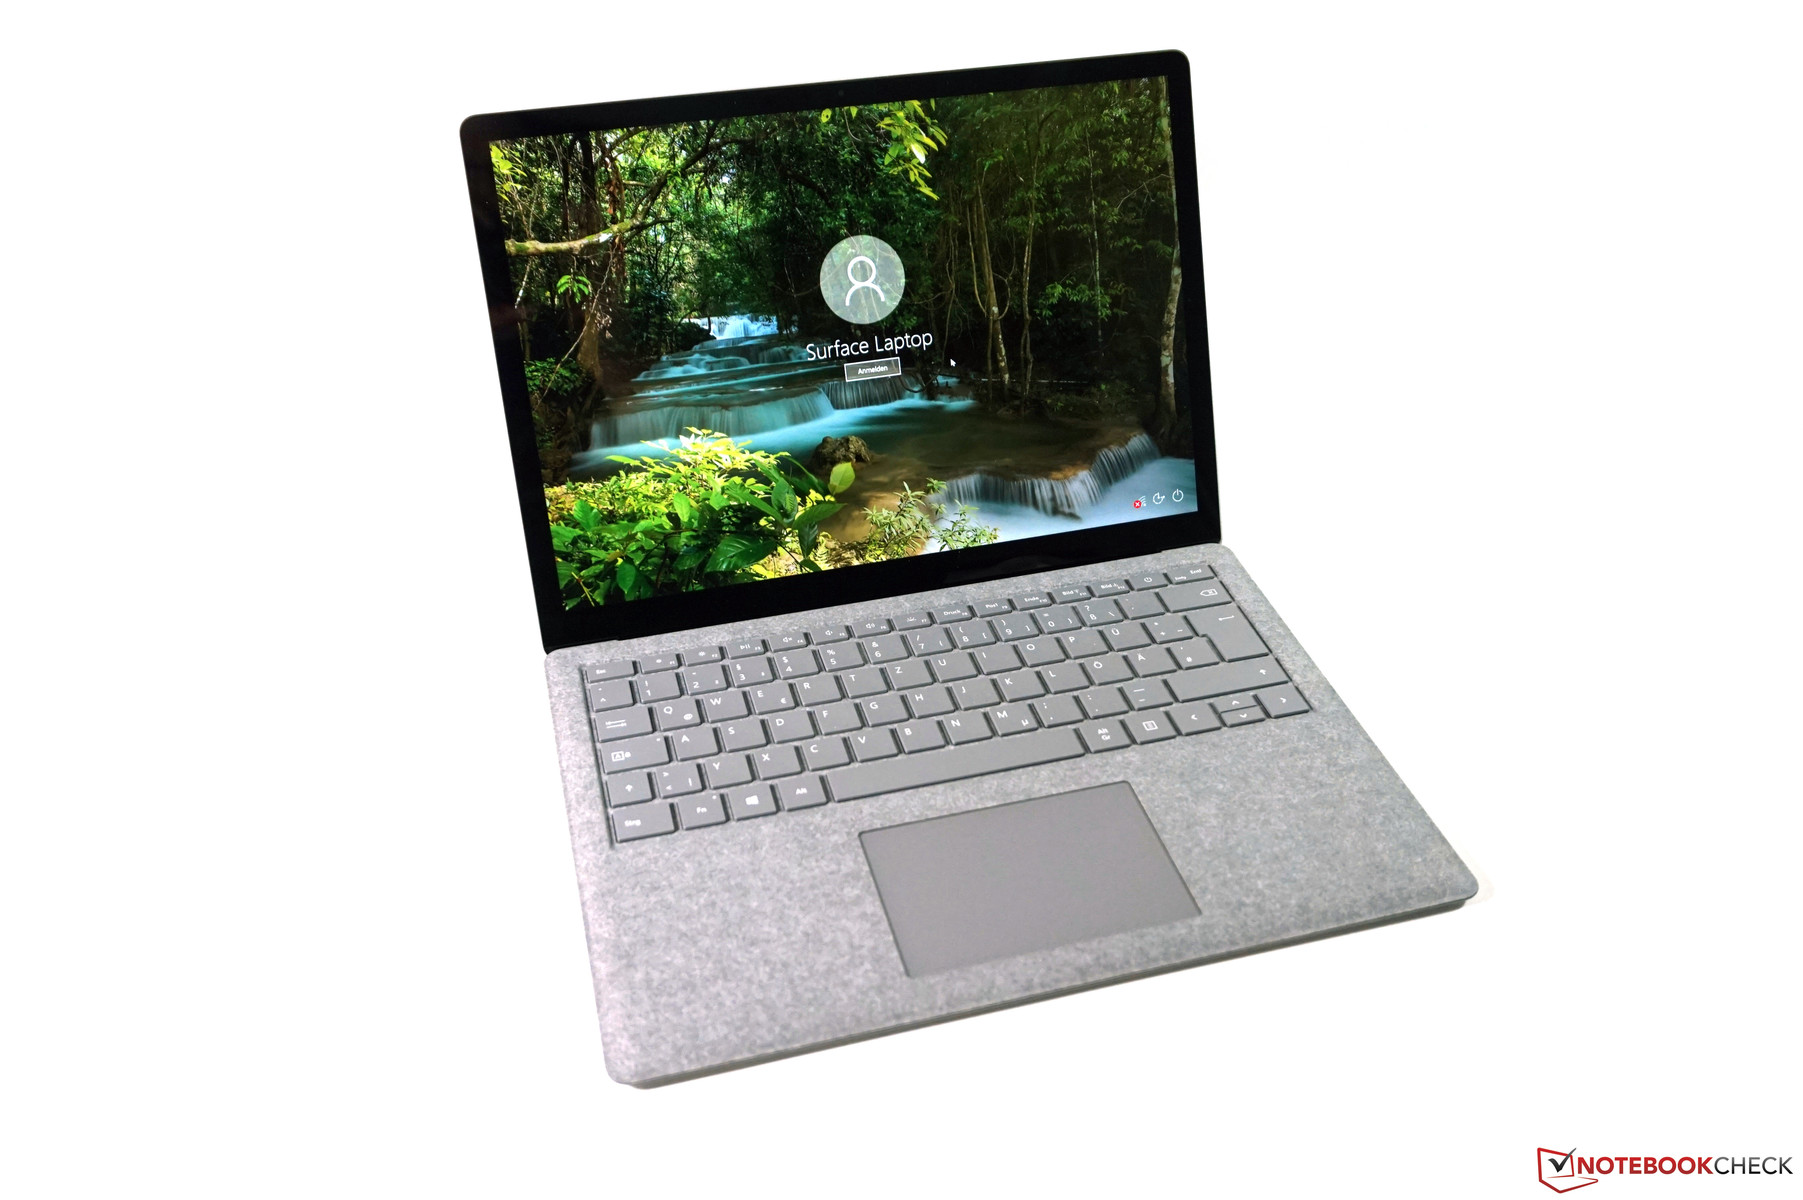
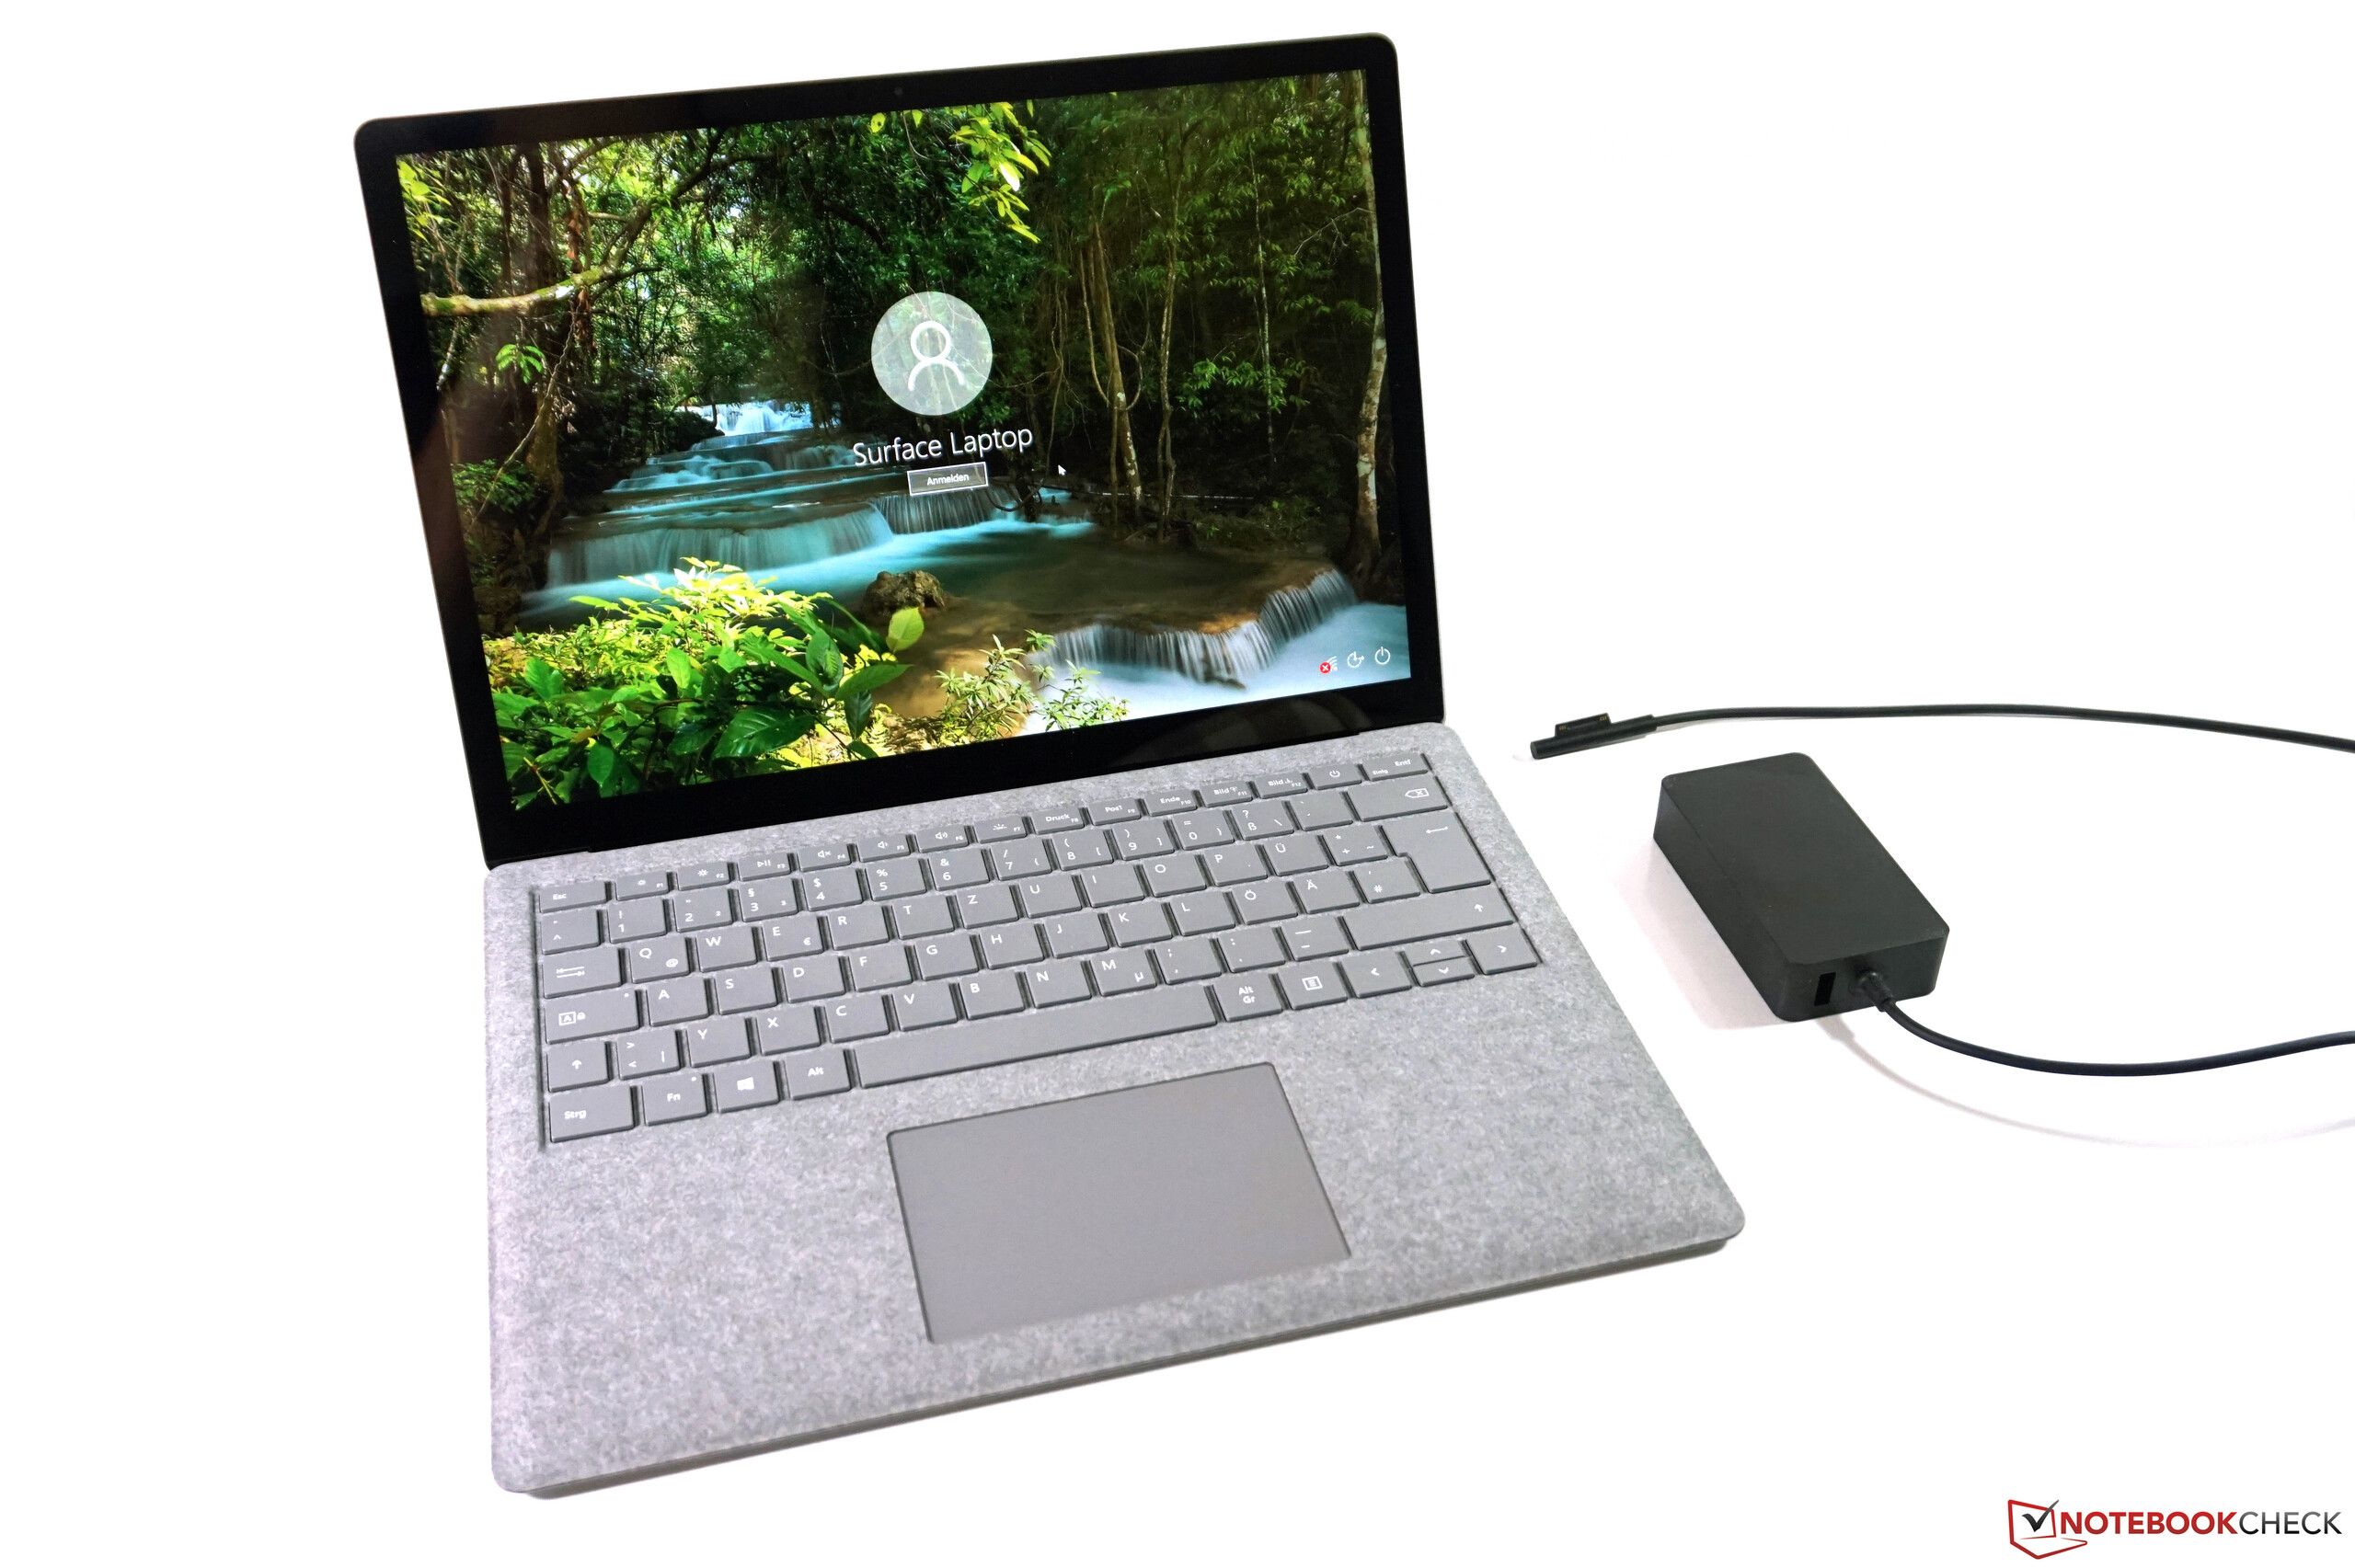
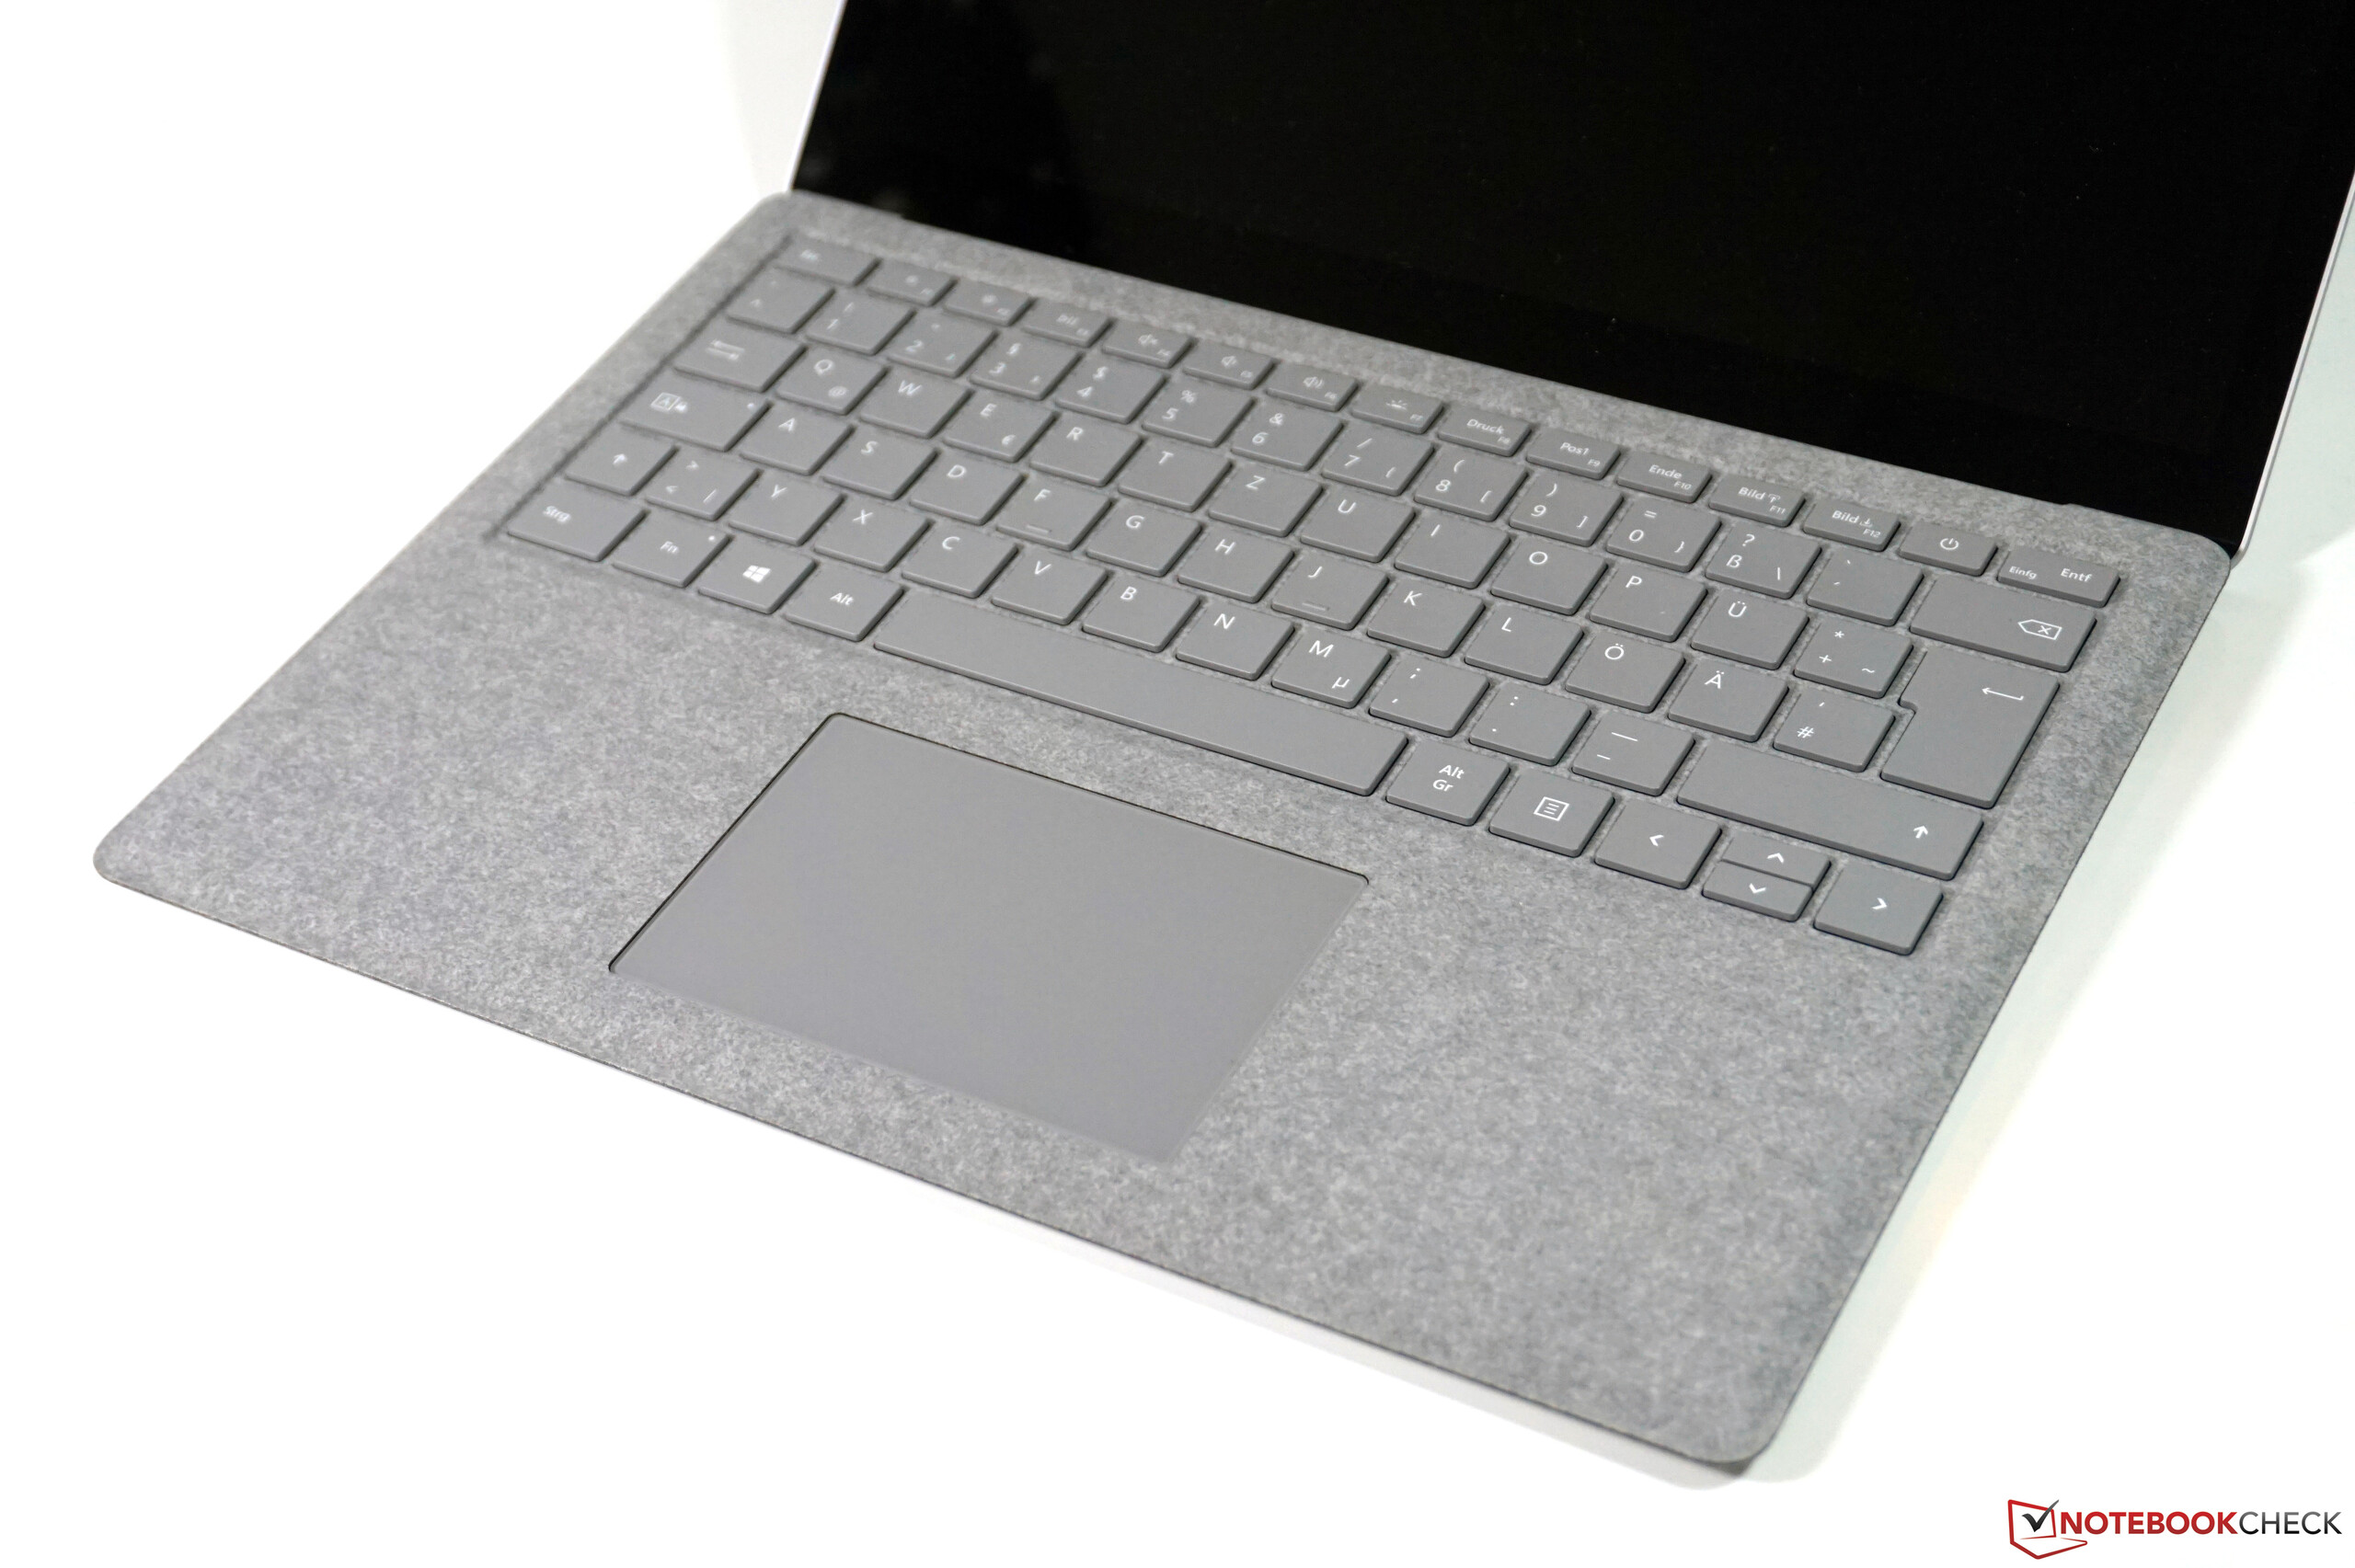
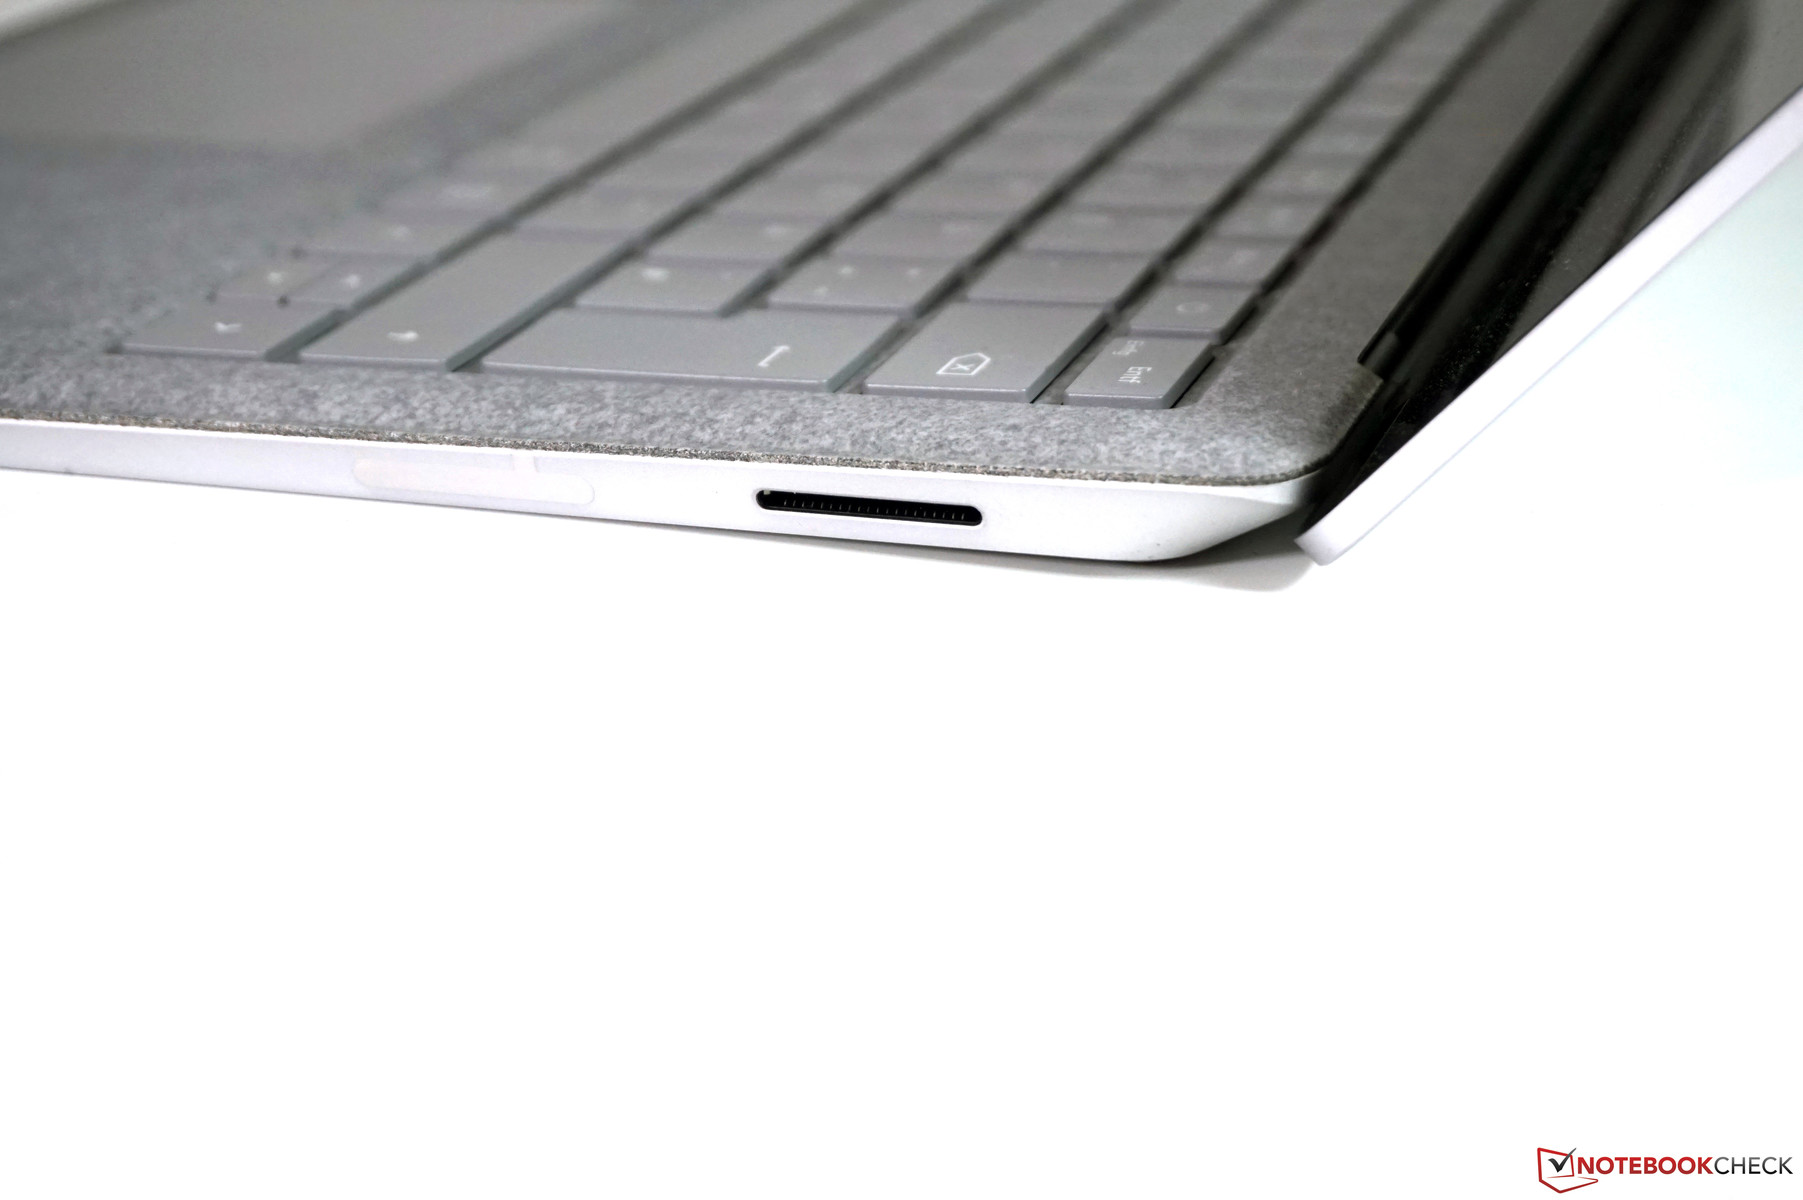
正如开头所提到的,微软所做的主要是更新了旧的Surface。 Surface Laptop 2提供最新的处理器,具有四个核心,更安静的冷却系统,略微改进的扬声器和新的颜色选项。屏幕继续作为该设备的亮点,并以其精确的彩色显示结合良好的亮度和高对比度给我们留下深刻印象。虽然4K显示器能提供更高的分辨率,但Surface Laptop 2的图像还是非常逼真,我们非常喜欢它。 3:2显示屏在使用生产力应用程序时具有优势。如果用户主要对观看视频感兴趣,那么使用16:9面板可能会更好。输入设备也非常有说服力,考虑到设备的纤薄程度,键盘的行程相对较长,因此打字很舒服。
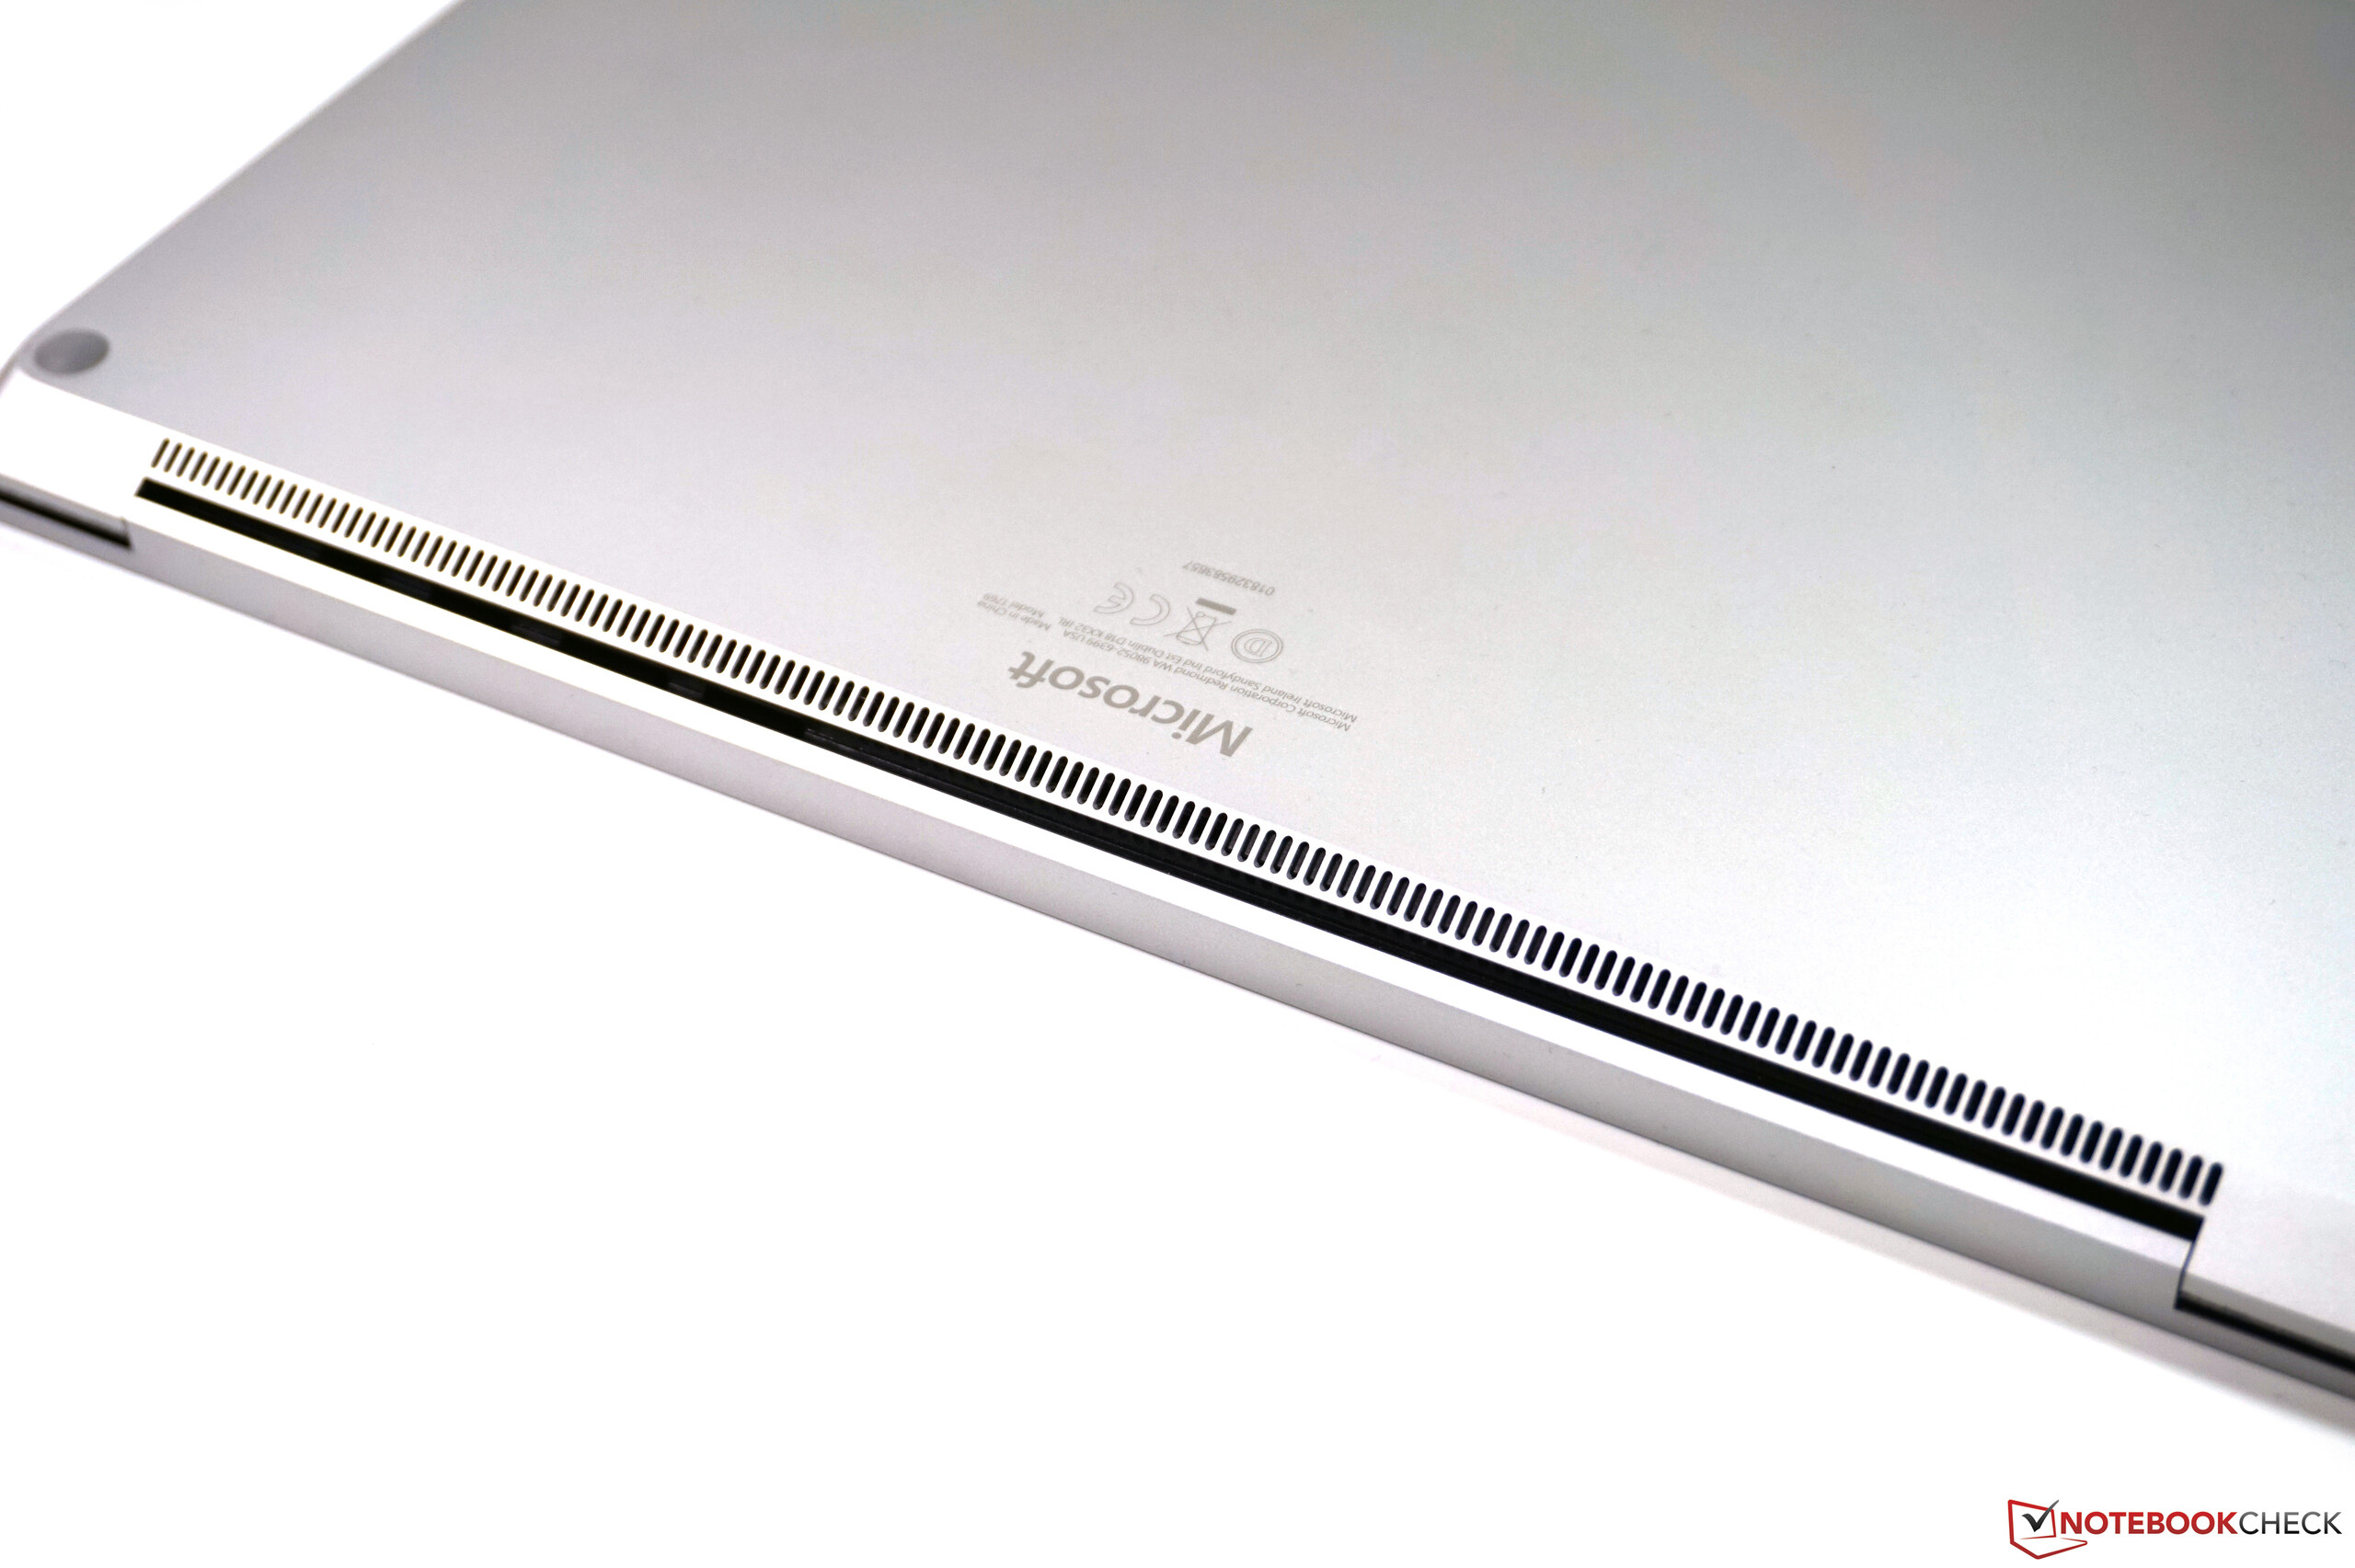
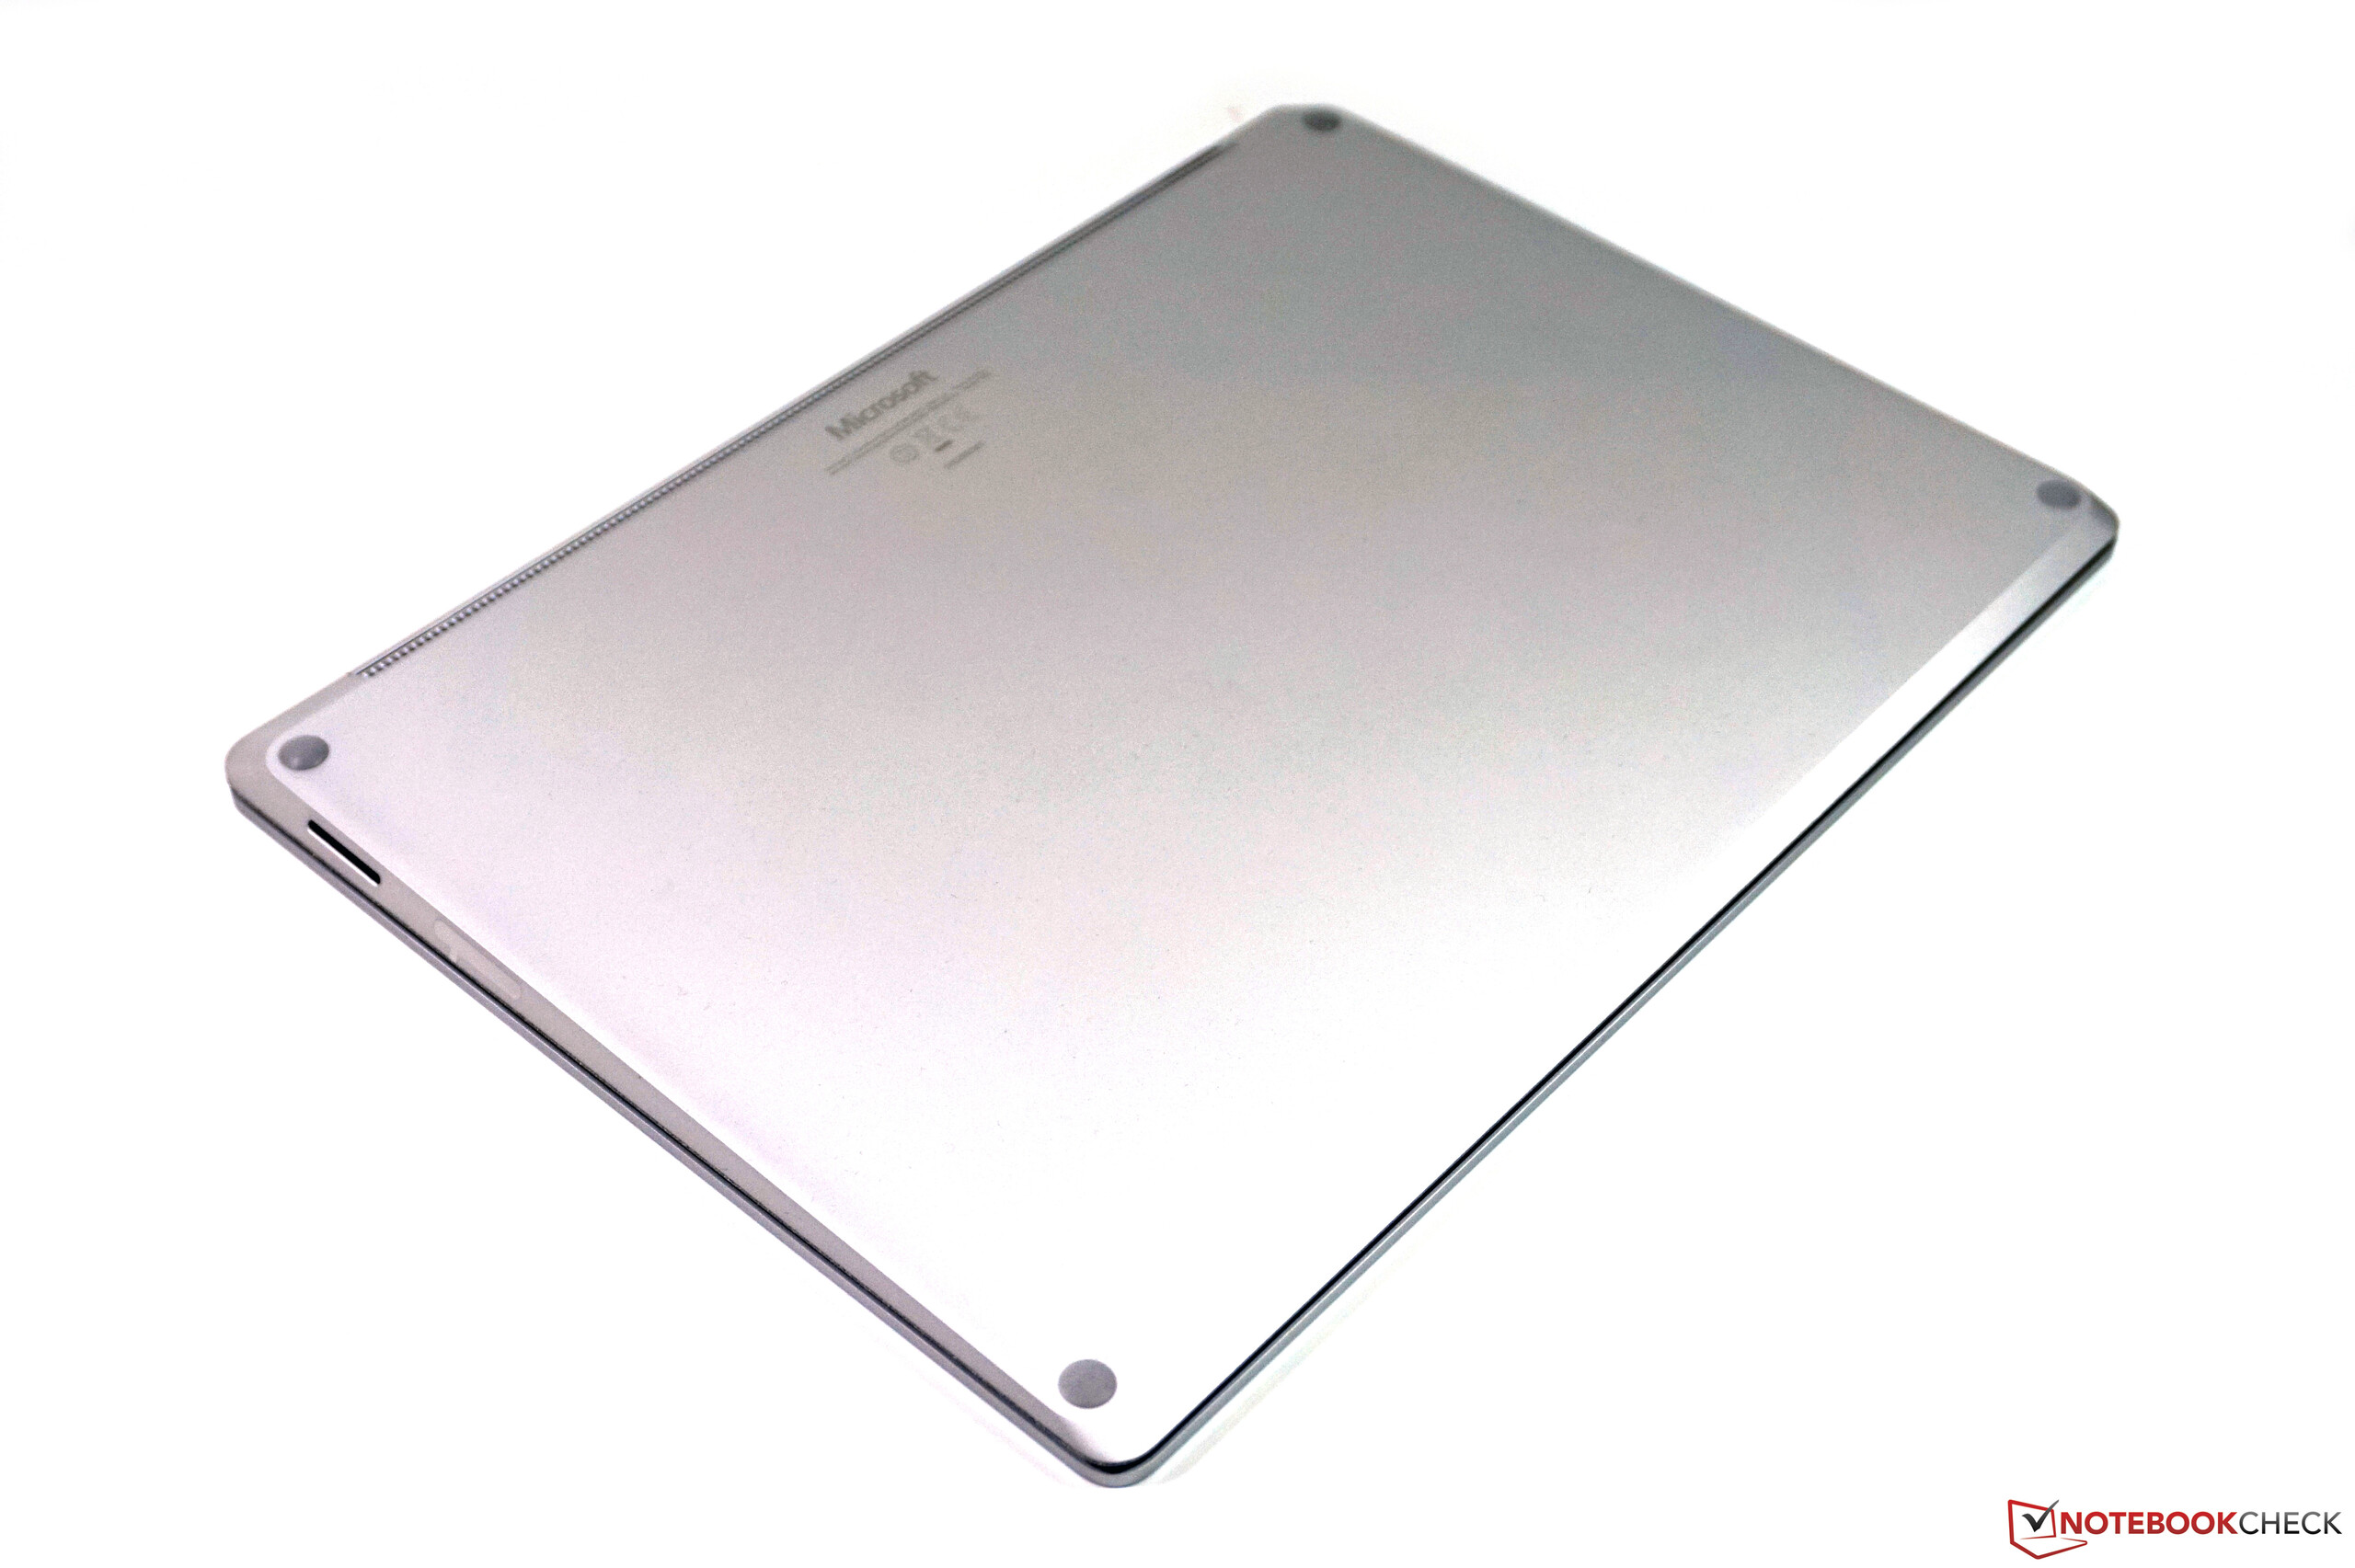
我们发现了有关此设备的两个主要缺点。第一个是机子本身,虽然它具有高质量和高稳定性,但基本上不可能打开。这意味着用户甚至无法清洁风扇。第二个问题是缺少雷电3端口。该设备只提供了Surface连接端口,并提供一系列的连接设备。当然,微软希望保留这种连接器是有道理的;但是,微软应该包含雷电3而不是留下mini-DisplayPort接口。这将使该设备缺少战未来的能力,且并不能连接到eGPU。另一个缺点是缺少SD卡读卡器-特别是因为这台设备非常适合图像处理。
“如果您正在寻找具有良好显示效果,安静的操作和良好输入设备的高品质笔记本电脑,那么微软的Surface Laptop 2应该是一个不错的选择。虽然没有雷电3端口这一事实令人失望且难以理解,但目前这并不影响日常使用。”
尽管如此,Surface Laptop 2提供了非常好的软件,特别是考虑到其目标群体,其中包括临时用户和需要良好显示和触摸屏的人。价格与性能之比很好,但不幸的是,微软已经为更多的RAM和SSD存储设置了非常高的溢价,配置限制(取决于颜色,RAM等)使事情变得不必要地复杂化。 Surface Laptop 2在我们的比较中击败了新的MacBook Air,Surface Laptop在不考虑操作系统的前提下对于大多数用户来说可能是更好(和更便宜)的选择。寻找更紧凑设备的用户应该考虑考虑XPS 13,它还提供更多硬件和服务选项。
Microsoft Surface Laptop 2-LQN-00004
- 10/22/2019 v7 (old)
Andreas Osthoff
Price comparison

