联想ThinkPad X390 Yoga (i7, FHD) 二合一笔记本电脑评测
| SD Card Reader | |
| average JPG Copy Test (av. of 3 runs) | |
| Lenovo ThinkPad X1 Yoga 2018-20LES01W00 (Toshiba Exceria Pro M501) | |
| Dell Latitude 7390 2-in-1 (Toshiba Exceria Pro M501 UHS-II) | |
| Lenovo ThinkPad X390 Yoga-20NQS05R00 (Toshiba Exceria Pro M501) | |
| Average of class Convertible (28.1 - 197, n=23, last 2 years) | |
| Lenovo ThinkPad X380 Yoga 20LJS02W00 (Toshiba Exceria Pro SDXC 64 GB UHS-II) | |
| maximum AS SSD Seq Read Test (1GB) | |
| Dell Latitude 7390 2-in-1 (Toshiba Exceria Pro M501 UHS-II) | |
| Lenovo ThinkPad X1 Yoga 2018-20LES01W00 (Toshiba Exceria Pro M501) | |
| Average of class Convertible (28.9 - 254, n=22, last 2 years) | |
| Lenovo ThinkPad X380 Yoga 20LJS02W00 (Toshiba Exceria Pro SDXC 64 GB UHS-II) | |
| Lenovo ThinkPad X390 Yoga-20NQS05R00 (Toshiba Exceria Pro M501) | |
| Networking | |
| iperf3 transmit AX12 | |
| Lenovo ThinkPad X390 Yoga-20NQS05R00 | |
| Lenovo ThinkPad X380 Yoga 20LJS02W00 | |
| Lenovo ThinkPad X1 Yoga 2018-20LES01W00 | |
| HP EliteBook x360 1030 G3 | |
| Dell Latitude 7390 2-in-1 | |
| iperf3 receive AX12 | |
| Lenovo ThinkPad X390 Yoga-20NQS05R00 | |
| Dell Latitude 7390 2-in-1 | |
| Lenovo ThinkPad X1 Yoga 2018-20LES01W00 | |
| HP EliteBook x360 1030 G3 | |
| Lenovo ThinkPad X380 Yoga 20LJS02W00 | |
| |||||||||||||||||||||||||
Brightness Distribution: 90 %
Center on Battery: 318 cd/m²
Contrast: 2127:1 (Black: 0.15 cd/m²)
ΔE ColorChecker Calman: 6.1 | ∀{0.5-29.43 Ø4.73}
calibrated: 1
ΔE Greyscale Calman: 8.6 | ∀{0.09-98 Ø4.97}
96.8% sRGB (Argyll 1.6.3 3D)
61.9% AdobeRGB 1998 (Argyll 1.6.3 3D)
67.3% AdobeRGB 1998 (Argyll 3D)
97% sRGB (Argyll 3D)
65.2% Display P3 (Argyll 3D)
Gamma: 2.62
CCT: 6613 K
| Lenovo ThinkPad X390 Yoga-20NQS05R00 LP133WF7-SPA1, , 1920x1080, 13.3" | Lenovo ThinkPad X380 Yoga 20LJS02W00 Lenovo M133NWF4 R3, , 1920x1080, 13.3" | HP EliteBook x360 1030 G3 Chi Mei CMN1380, , 1920x1080, 13.3" | Dell Latitude 7390 2-in-1 AUO462D, , 1920x1080, 13.3" | Lenovo ThinkPad X390-20Q1S02M00 LP133WF7-SPB1, , 1920x1080, 13.3" | Lenovo ThinkPad X1 Yoga 2018-20LD0015US Lenovo LEN40A9, , 1920x1080, 14" | |
|---|---|---|---|---|---|---|
| Display | 0% | 1% | -7% | -1% | -9% | |
| Display P3 Coverage (%) | 65.2 | 65.9 1% | 66.1 1% | 62.5 -4% | 65.3 0% | 60.9 -7% |
| sRGB Coverage (%) | 97 | 95.8 -1% | 97.8 1% | 86.1 -11% | 95.9 -1% | 86.4 -11% |
| AdobeRGB 1998 Coverage (%) | 67.3 | 67.8 1% | 67.8 1% | 62.9 -7% | 66.6 -1% | 61.9 -8% |
| Response Times | 11% | 26% | 10% | -4% | 19% | |
| Response Time Grey 50% / Grey 80% * (ms) | 59.2 ? | 50 ? 16% | 39.2 ? 34% | 48.8 ? 18% | 57.6 ? 3% | 40.4 ? 32% |
| Response Time Black / White * (ms) | 30.8 ? | 29 ? 6% | 25.6 ? 17% | 30.4 ? 1% | 34 ? -10% | 28.8 ? 6% |
| PWM Frequency (Hz) | 1000 ? | 26040 ? | ||||
| Screen | -2% | 0% | -37% | 12% | -30% | |
| Brightness middle (cd/m²) | 319 | 314 -2% | 470.1 47% | 318.2 0% | 356 12% | 267.2 -16% |
| Brightness (cd/m²) | 306 | 302 -1% | 443 45% | 312 2% | 336 10% | 239 -22% |
| Brightness Distribution (%) | 90 | 84 -7% | 88 -2% | 83 -8% | 88 -2% | 75 -17% |
| Black Level * (cd/m²) | 0.15 | 0.16 -7% | 0.38 -153% | 0.3 -100% | 0.16 -7% | 0.27 -80% |
| Contrast (:1) | 2127 | 1963 -8% | 1237 -42% | 1061 -50% | 2225 5% | 990 -53% |
| Colorchecker dE 2000 * | 6.1 | 5.73 6% | 2.47 60% | 4.25 30% | 3.6 41% | 3.5 43% |
| Colorchecker dE 2000 max. * | 9.7 | 10.43 -8% | 5.73 41% | 9.49 2% | 5.5 43% | 6.4 34% |
| Colorchecker dE 2000 calibrated * | 1 | 1.52 -52% | 4.38 -338% | 1.1 -10% | 3.81 -281% | |
| Greyscale dE 2000 * | 8.6 | 7.39 14% | 3.7 57% | 2.1 76% | 4.7 45% | 1.3 85% |
| Gamma | 2.62 84% | 2.14 103% | 2.35 94% | 2.311 95% | 2.48 89% | 2.146 103% |
| CCT | 6613 98% | 6351 102% | 7373 88% | 6588 99% | 6374 102% | 6523 100% |
| Color Space (Percent of AdobeRGB 1998) (%) | 61.9 | 61 -1% | 62 0% | 56 -10% | 61.3 -1% | 56 -10% |
| Color Space (Percent of sRGB) (%) | 96.8 | 96 -1% | 98.2 1% | 85 -12% | 95.7 -1% | 86 -11% |
| Total Average (Program / Settings) | 3% /
1% | 9% /
4% | -11% /
-26% | 2% /
8% | -7% /
-20% |
* ... smaller is better
Display Response Times
| ↔ Response Time Black to White | ||
|---|---|---|
| 30.8 ms ... rise ↗ and fall ↘ combined | ↗ 16.8 ms rise | 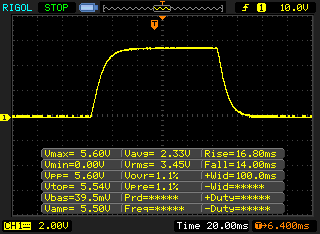 |
| ↘ 14 ms fall | ||
| The screen shows slow response rates in our tests and will be unsatisfactory for gamers. In comparison, all tested devices range from 0.1 (minimum) to 240 (maximum) ms. » 83 % of all devices are better. This means that the measured response time is worse than the average of all tested devices (19.9 ms). | ||
| ↔ Response Time 50% Grey to 80% Grey | ||
| 59.2 ms ... rise ↗ and fall ↘ combined | ↗ 30 ms rise | 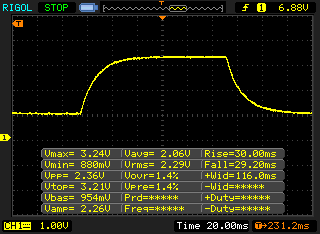 |
| ↘ 29.2 ms fall | ||
| The screen shows slow response rates in our tests and will be unsatisfactory for gamers. In comparison, all tested devices range from 0.165 (minimum) to 636 (maximum) ms. » 95 % of all devices are better. This means that the measured response time is worse than the average of all tested devices (31.1 ms). | ||
Screen Flickering / PWM (Pulse-Width Modulation)
| Screen flickering / PWM not detected | 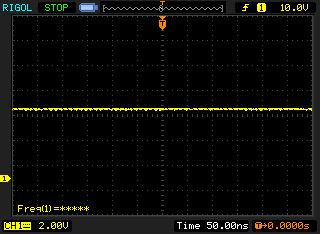 | ||
In comparison: 52 % of all tested devices do not use PWM to dim the display. If PWM was detected, an average of 7791 (minimum: 5 - maximum: 343500) Hz was measured. | |||
| PCMark 8 Home Score Accelerated v2 | 3668 points | |
| PCMark 8 Work Score Accelerated v2 | 5071 points | |
| PCMark 10 Score | 4134 points | |
Help | ||
| Lenovo ThinkPad X390 Yoga-20NQS05R00 Intel SSD Pro 7600p SSDPEKKF512G8L | Lenovo ThinkPad X380 Yoga 20LJS02W00 Samsung SSD PM981 MZVLB512HAJQ | HP EliteBook x360 1030 G3 Samsung PM871b MZNLN128HAHQ | Dell Latitude 7390 2-in-1 SK hynix PC401 NVMe 500 GB | Lenovo ThinkPad X1 Yoga 2018-20LES01W00 Samsung SSD PM981 MZVLB512HAJQ | Lenovo ThinkPad X390-20Q1S02M00 Intel SSD Pro 7600p SSDPEKKF512G8L | Lenovo ThinkPad X1 Yoga 2018-20LD0015US Samsung SSD PM981 MZVLB512HAJQ | Average Intel SSD Pro 7600p SSDPEKKF512G8L | |
|---|---|---|---|---|---|---|---|---|
| CrystalDiskMark 5.2 / 6 | 3% | -65% | -8% | 6% | -11% | -20% | -8% | |
| Write 4K (MB/s) | 144.1 | 135.9 -6% | 64.3 -55% | 131.7 -9% | 138.8 -4% | 120.7 -16% | 122.1 -15% | 133.9 ? -7% |
| Read 4K (MB/s) | 63.5 | 34.13 -46% | 46.01 -28% | 45.21 -29% | 58.5 -8% | 44.38 -30% | 59.1 ? -7% | |
| Write Seq (MB/s) | 1496 | 1683 13% | 466.4 -69% | 1256 -16% | 1896 27% | 1491 0% | 1253 -16% | 1378 ? -8% |
| Read Seq (MB/s) | 2677 | 2195 -18% | 498.3 -81% | 1852 -31% | 2070 -23% | 2760 3% | 1232 -54% | 2341 ? -13% |
| Write 4K Q32T1 (MB/s) | 357.4 | 437.3 22% | 193.3 -46% | 600 68% | 483.3 35% | 237.5 -34% | 198.2 -45% | 355 ? -1% |
| Read 4K Q32T1 (MB/s) | 482.3 | 338.8 -30% | 179.7 -63% | 387.7 -20% | 451.8 -6% | 336.1 -30% | 288.8 -40% | 429 ? -11% |
| Write Seq Q32T1 (MB/s) | 1558 | 1994 28% | 396.8 -75% | 1374 -12% | 2066 33% | 1512 -3% | 2007 29% | 1514 ? -3% |
| Read Seq Q32T1 (MB/s) | 3021 | 3407 13% | 547 -82% | 2585 -14% | 3423 13% | 3154 4% | 3409 13% | 2677 ? -11% |

| 3DMark 11 - 1280x720 Performance GPU | |
| Average of class Convertible (1505 - 40732, n=49, last 2 years) | |
| Lenovo ThinkPad X1 Yoga 2018-20LES01W00 | |
| Lenovo ThinkPad X390-20Q1S02M00 | |
| Lenovo ThinkPad X1 Yoga 2018-20LD0015US | |
| Lenovo ThinkPad X390 Yoga-20NQS05R00 | |
| Average Intel UHD Graphics 620 (1144 - 3432, n=244) | |
| HP EliteBook x360 1030 G3 | |
| Lenovo ThinkPad X380 Yoga 20LJS02W00 | |
| Dell Latitude 7390 2-in-1 | |
| 3DMark | |
| 1280x720 Cloud Gate Standard Graphics | |
| Average of class Convertible (7885 - 57566, n=33, last 2 years) | |
| Lenovo ThinkPad X1 Yoga 2018-20LES01W00 | |
| Lenovo ThinkPad X390 Yoga-20NQS05R00 | |
| Lenovo ThinkPad X390-20Q1S02M00 | |
| Lenovo ThinkPad X1 Yoga 2018-20LD0015US | |
| HP EliteBook x360 1030 G3 | |
| Average Intel UHD Graphics 620 (6205 - 16400, n=225) | |
| Dell Latitude 7390 2-in-1 | |
| Lenovo ThinkPad X380 Yoga 20LJS02W00 | |
| 1920x1080 Fire Strike Graphics | |
| Average of class Convertible (1185 - 27447, n=49, last 2 years) | |
| Lenovo ThinkPad X1 Yoga 2018-20LES01W00 | |
| Lenovo ThinkPad X390 Yoga-20NQS05R00 | |
| Lenovo ThinkPad X390-20Q1S02M00 | |
| Lenovo ThinkPad X1 Yoga 2018-20LD0015US | |
| Average Intel UHD Graphics 620 (557 - 2608, n=213) | |
| Dell Latitude 7390 2-in-1 | |
| Lenovo ThinkPad X380 Yoga 20LJS02W00 | |
| 3DMark 11 Performance | 2020 points | |
| 3DMark Cloud Gate Standard Score | 8504 points | |
| 3DMark Fire Strike Score | 1152 points | |
Help | ||
| low | med. | high | ultra | |
|---|---|---|---|---|
| BioShock Infinite (2013) | 73.8 | 37.47 | 31.25 | 10.51 |
| The Witcher 3 (2015) | 17.7 | |||
| Dota 2 Reborn (2015) | 70 | 47.9 | 20.5 | 18.7 |
| Rise of the Tomb Raider (2016) | 23.3 | 14.2 | ||
| X-Plane 11.11 (2018) | 26.8 | 17.4 | 15.8 |
Noise level
| Idle |
| 29.2 / 29.2 / 29.2 dB(A) |
| Load |
| 35 / 35 dB(A) |
 | ||
30 dB silent 40 dB(A) audible 50 dB(A) loud |
||
min: | ||
(±) The maximum temperature on the upper side is 41.7 °C / 107 F, compared to the average of 35.4 °C / 96 F, ranging from 19.6 to 60 °C for the class Convertible.
(-) The bottom heats up to a maximum of 50.1 °C / 122 F, compared to the average of 36.9 °C / 98 F
(+) In idle usage, the average temperature for the upper side is 25.3 °C / 78 F, compared to the device average of 30.3 °C / 87 F.
(+) The palmrests and touchpad are cooler than skin temperature with a maximum of 26 °C / 78.8 F and are therefore cool to the touch.
(±) The average temperature of the palmrest area of similar devices was 28 °C / 82.4 F (+2 °C / 3.6 F).
Lenovo ThinkPad X390 Yoga-20NQS05R00 audio analysis
(±) | speaker loudness is average but good (74.1 dB)
Bass 100 - 315 Hz
(-) | nearly no bass - on average 15.8% lower than median
(±) | linearity of bass is average (10.6% delta to prev. frequency)
Mids 400 - 2000 Hz
(±) | higher mids - on average 6.5% higher than median
(±) | linearity of mids is average (10.3% delta to prev. frequency)
Highs 2 - 16 kHz
(+) | balanced highs - only 2.8% away from median
(±) | linearity of highs is average (11% delta to prev. frequency)
Overall 100 - 16.000 Hz
(±) | linearity of overall sound is average (24% difference to median)
Compared to same class
» 73% of all tested devices in this class were better, 5% similar, 22% worse
» The best had a delta of 6%, average was 20%, worst was 57%
Compared to all devices tested
» 72% of all tested devices were better, 6% similar, 22% worse
» The best had a delta of 4%, average was 24%, worst was 134%
HP EliteBook x360 1030 G3 audio analysis
(±) | speaker loudness is average but good (80.4 dB)
Bass 100 - 315 Hz
(±) | reduced bass - on average 9.6% lower than median
(-) | bass is not linear (15% delta to prev. frequency)
Mids 400 - 2000 Hz
(+) | balanced mids - only 1.8% away from median
(+) | mids are linear (4.8% delta to prev. frequency)
Highs 2 - 16 kHz
(±) | higher highs - on average 6% higher than median
(±) | linearity of highs is average (11.7% delta to prev. frequency)
Overall 100 - 16.000 Hz
(+) | overall sound is linear (12.6% difference to median)
Compared to same class
» 15% of all tested devices in this class were better, 2% similar, 83% worse
» The best had a delta of 6%, average was 20%, worst was 57%
Compared to all devices tested
» 11% of all tested devices were better, 2% similar, 86% worse
» The best had a delta of 4%, average was 24%, worst was 134%
| Off / Standby | |
| Idle | |
| Load |
|
Key:
min: | |
| Lenovo ThinkPad X390 Yoga-20NQS05R00 i7-8565U, UHD Graphics 620, Intel SSD Pro 7600p SSDPEKKF512G8L, IPS LED, 1920x1080, 13.3" | Lenovo ThinkPad X380 Yoga 20LJS02W00 i5-8550U, UHD Graphics 620, Samsung SSD PM981 MZVLB512HAJQ, IPS, 1920x1080, 13.3" | HP EliteBook x360 1030 G3 i5-8250U, UHD Graphics 620, Samsung PM871b MZNLN128HAHQ, IPS, 1920x1080, 13.3" | Dell Latitude 7390 2-in-1 i7-8650U, UHD Graphics 620, SK hynix PC401 NVMe 500 GB, IPS, 1920x1080, 13.3" | Lenovo ThinkPad X390-20Q1S02M00 i5-8265U, UHD Graphics 620, Intel SSD Pro 7600p SSDPEKKF512G8L, IPS LED, 1920x1080, 13.3" | Lenovo ThinkPad X1 Yoga 2018-20LD0015US i5-8250U, UHD Graphics 620, Samsung SSD PM981 MZVLB512HAJQ, IPS, 1920x1080, 14" | Average Intel UHD Graphics 620 | Average of class Convertible | |
|---|---|---|---|---|---|---|---|---|
| Power Consumption | 19% | 9% | 28% | 3% | 13% | 5% | -7% | |
| Idle Minimum * (Watt) | 3.46 | 4 -16% | 3.8 -10% | 2.6 25% | 3.4 2% | 3 13% | 3.81 ? -10% | 4.24 ? -23% |
| Idle Average * (Watt) | 5.88 | 4.9 17% | 7.5 -28% | 5.7 3% | 5.6 5% | 5.4 8% | 6.94 ? -18% | 7.03 ? -20% |
| Idle Maximum * (Watt) | 9.12 | 6.9 24% | 8.6 6% | 6 34% | 8.7 5% | 7.5 18% | 8.75 ? 4% | 8.61 ? 6% |
| Load Average * (Watt) | 45.6 | 36 21% | 33.1 27% | 29.2 36% | 43.6 4% | 40.1 12% | 35 ? 23% | 43.9 ? 4% |
| Load Maximum * (Watt) | 65.9 | 34.4 48% | 31.8 52% | 38.8 41% | 65 1% | 57.1 13% | 47.5 ? 28% | 67.2 ? -2% |
* ... smaller is better
| Lenovo ThinkPad X390 Yoga-20NQS05R00 i7-8565U, UHD Graphics 620, 50 Wh | Lenovo ThinkPad X380 Yoga 20LJS02W00 i5-8550U, UHD Graphics 620, 51 Wh | HP EliteBook x360 1030 G3 i5-8250U, UHD Graphics 620, 56.2 Wh | Dell Latitude 7390 2-in-1 i7-8650U, UHD Graphics 620, 60 Wh | Lenovo ThinkPad X390-20Q1S02M00 i5-8265U, UHD Graphics 620, 48 Wh | Lenovo ThinkPad X1 Yoga 2018-20LD0015US i5-8250U, UHD Graphics 620, 54 Wh | Average of class Convertible | |
|---|---|---|---|---|---|---|---|
| Battery runtime | 16% | 68% | 33% | 12% | 43% | 40% | |
| H.264 (h) | 10 | 9.2 -8% | 12.7 27% | 15.3 ? 53% | |||
| WiFi v1.3 (h) | 8.2 | 8.5 4% | 10 22% | 9.2 12% | 8.3 1% | 10.9 33% | 12.1 ? 48% |
| Load (h) | 1.5 | 2.3 53% | 3.2 113% | 2.3 53% | 1.6 7% | 2.3 53% | 1.779 ? 19% |
| Reader / Idle (h) | 20.8 | 23 | 20.3 | 27.7 ? |
Pros
Cons

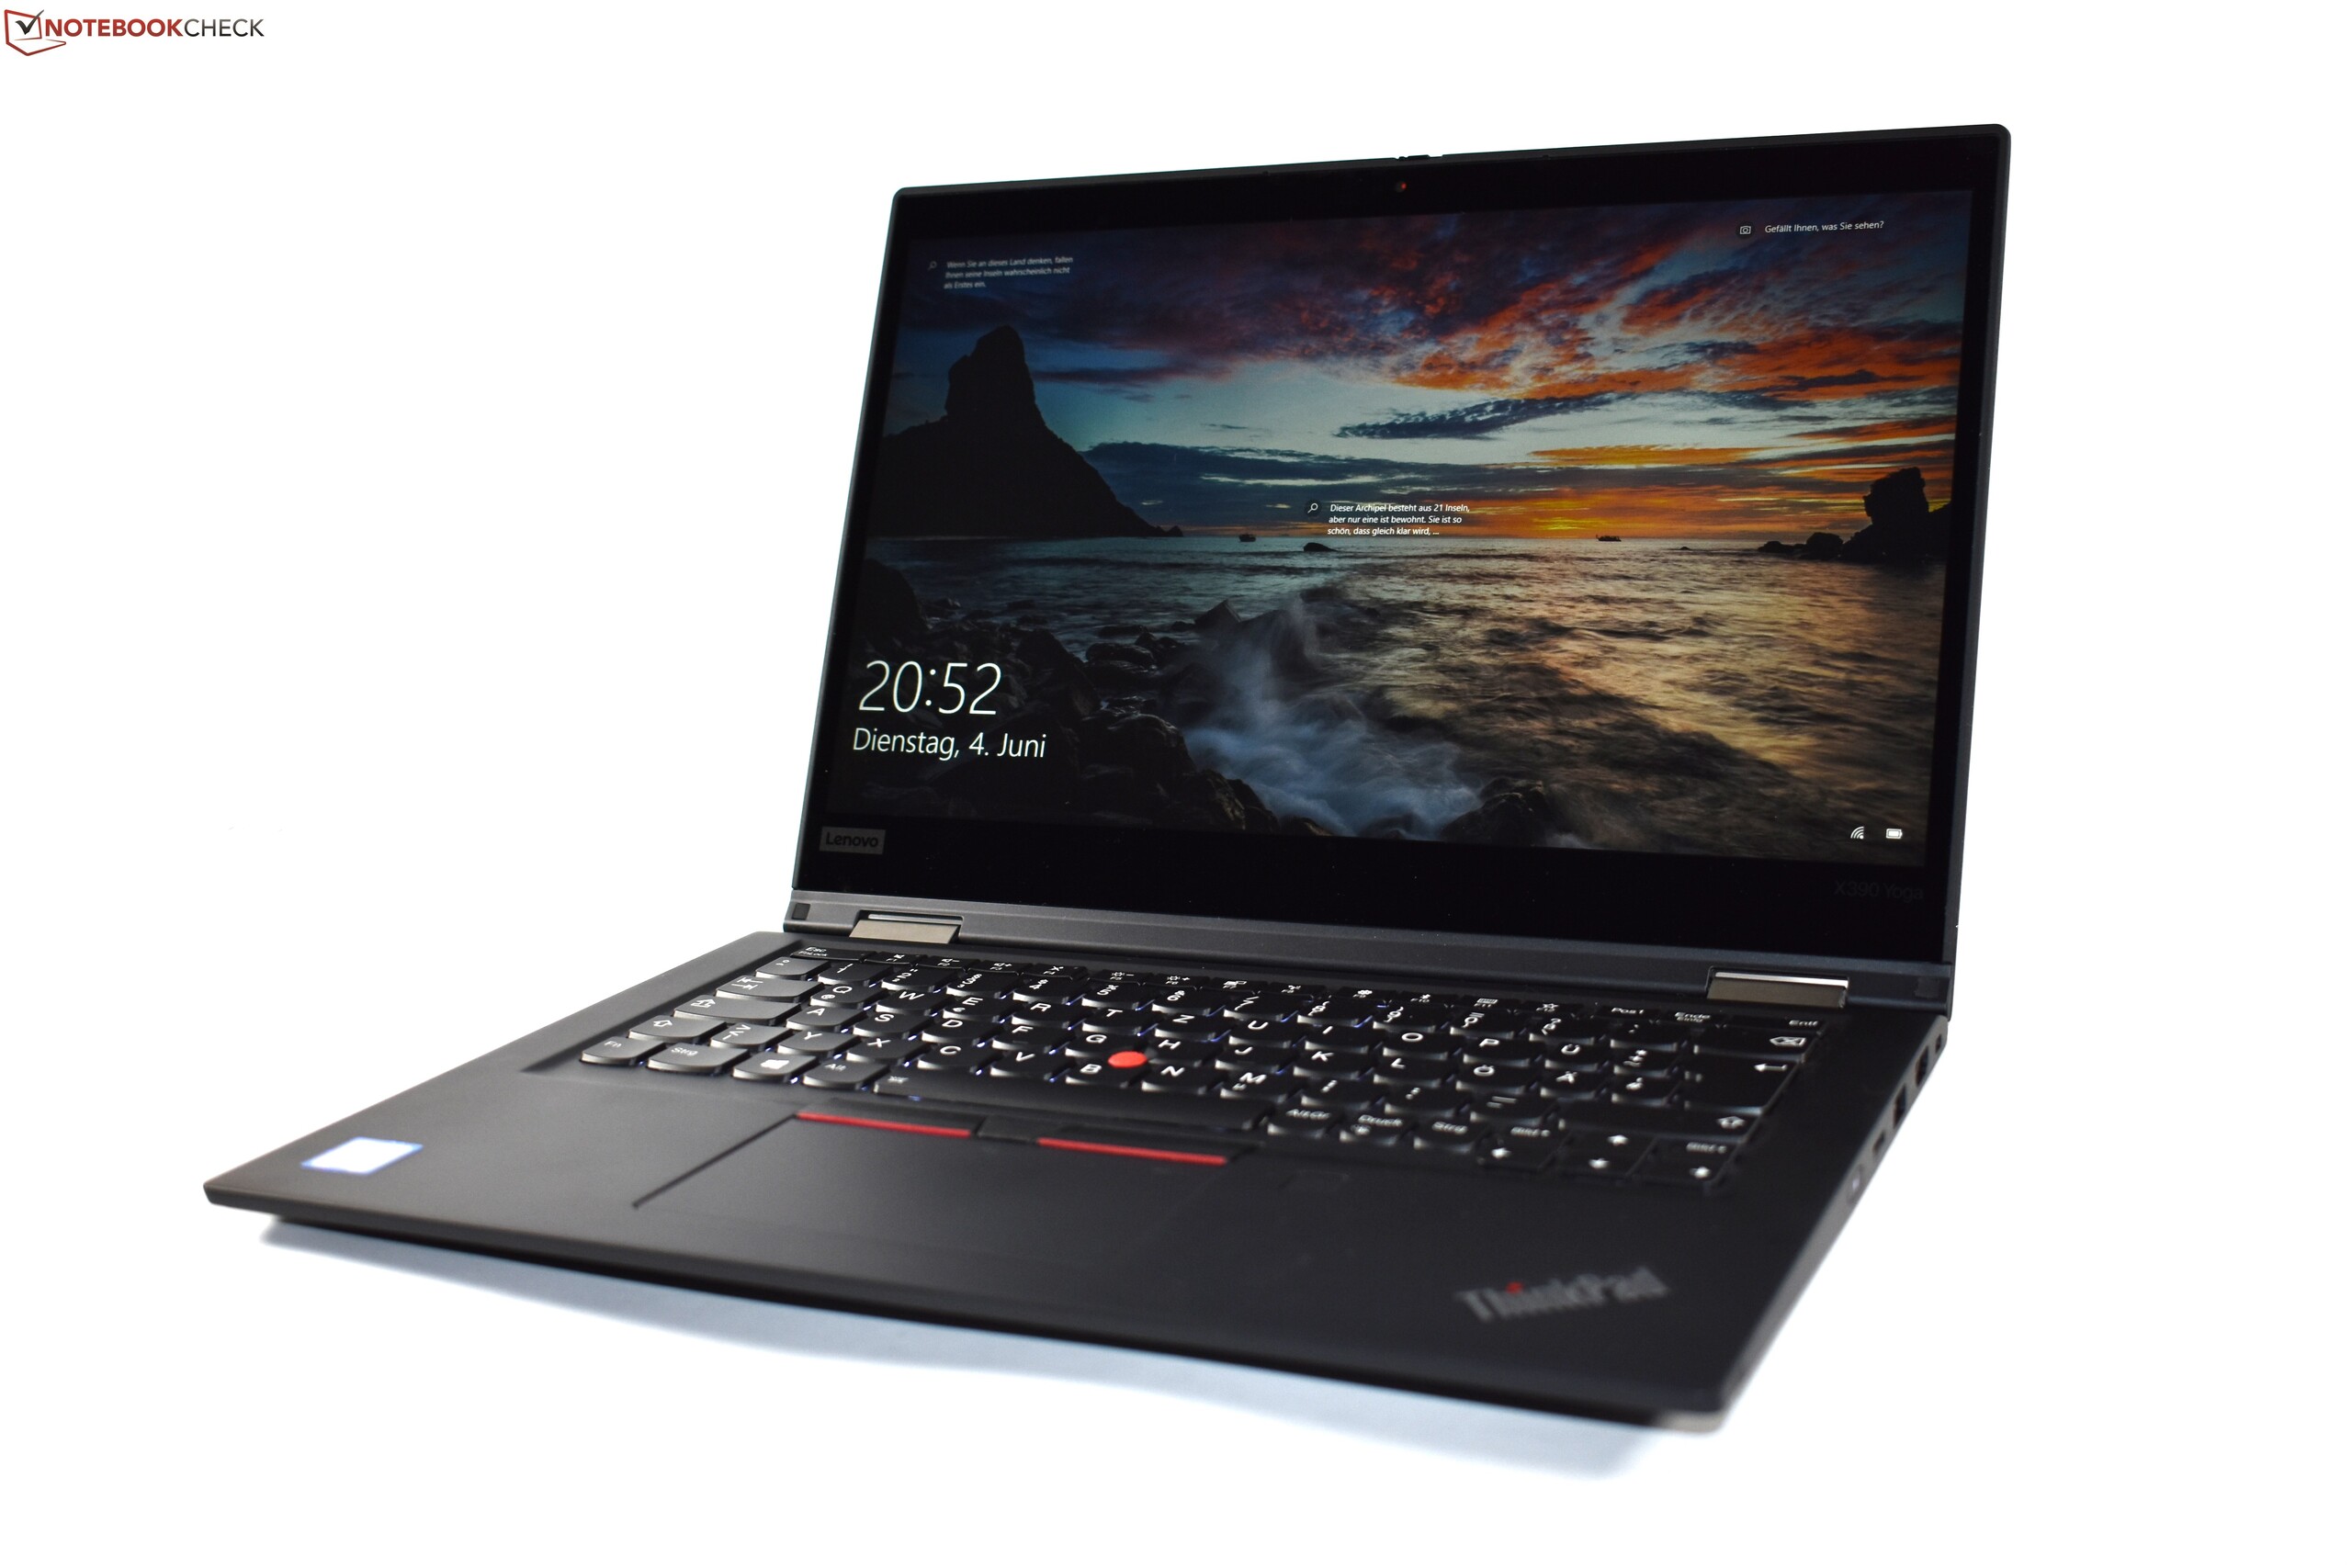
ThinkPad X390 Yoga延续了ThinkPad翻转本的传统。这台13.3英寸超极本有很多东西可供选择。但是,我们还是必须要提到一些弱点。
例如,缺少用于在平板电脑模式下保护按键的“Lift&Lock”键盘。这很致命,因为大多数翻转本都有这一功能。WWAN也不再可选。我们还注意到一个恼人的电流噪音,屏幕亮度也不佳——特别是考虑到它是块亮面屏。显然,与普通的ThinkPad X390不同,没有32 GB RAM的选项。而且RAM是焊死的,不能被扩展或替换。 LCD面板的响应时间也令人失望。
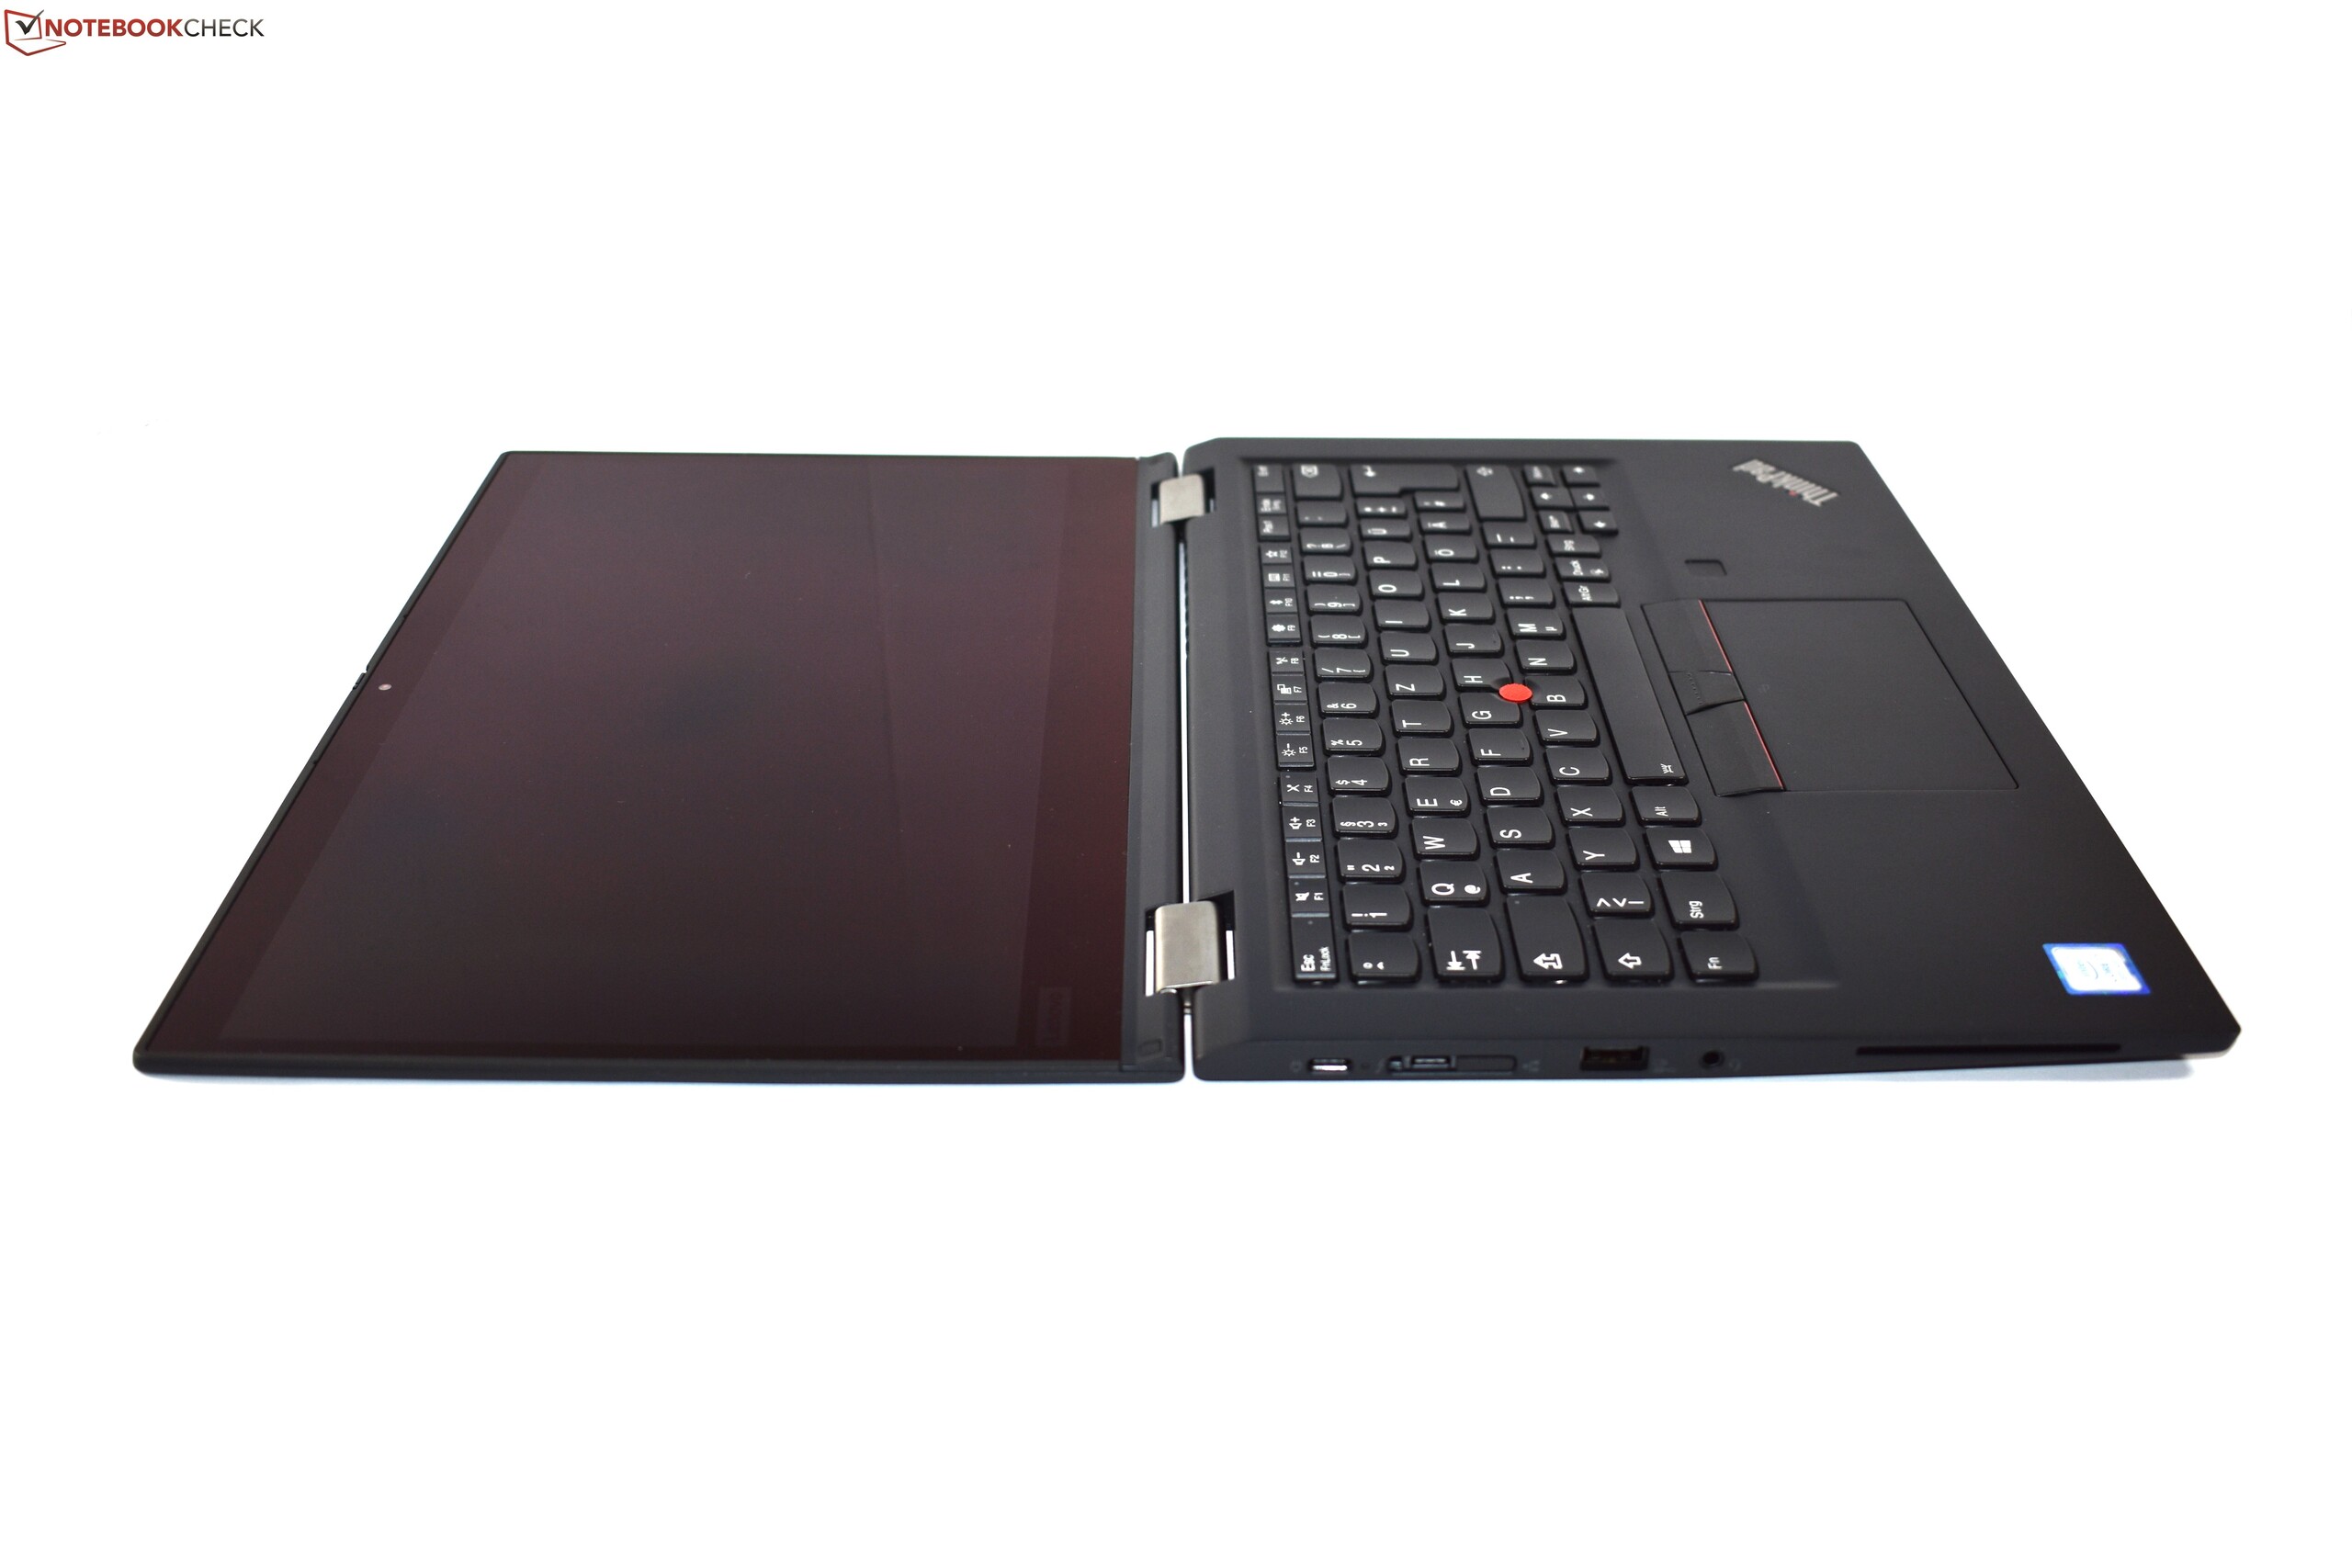
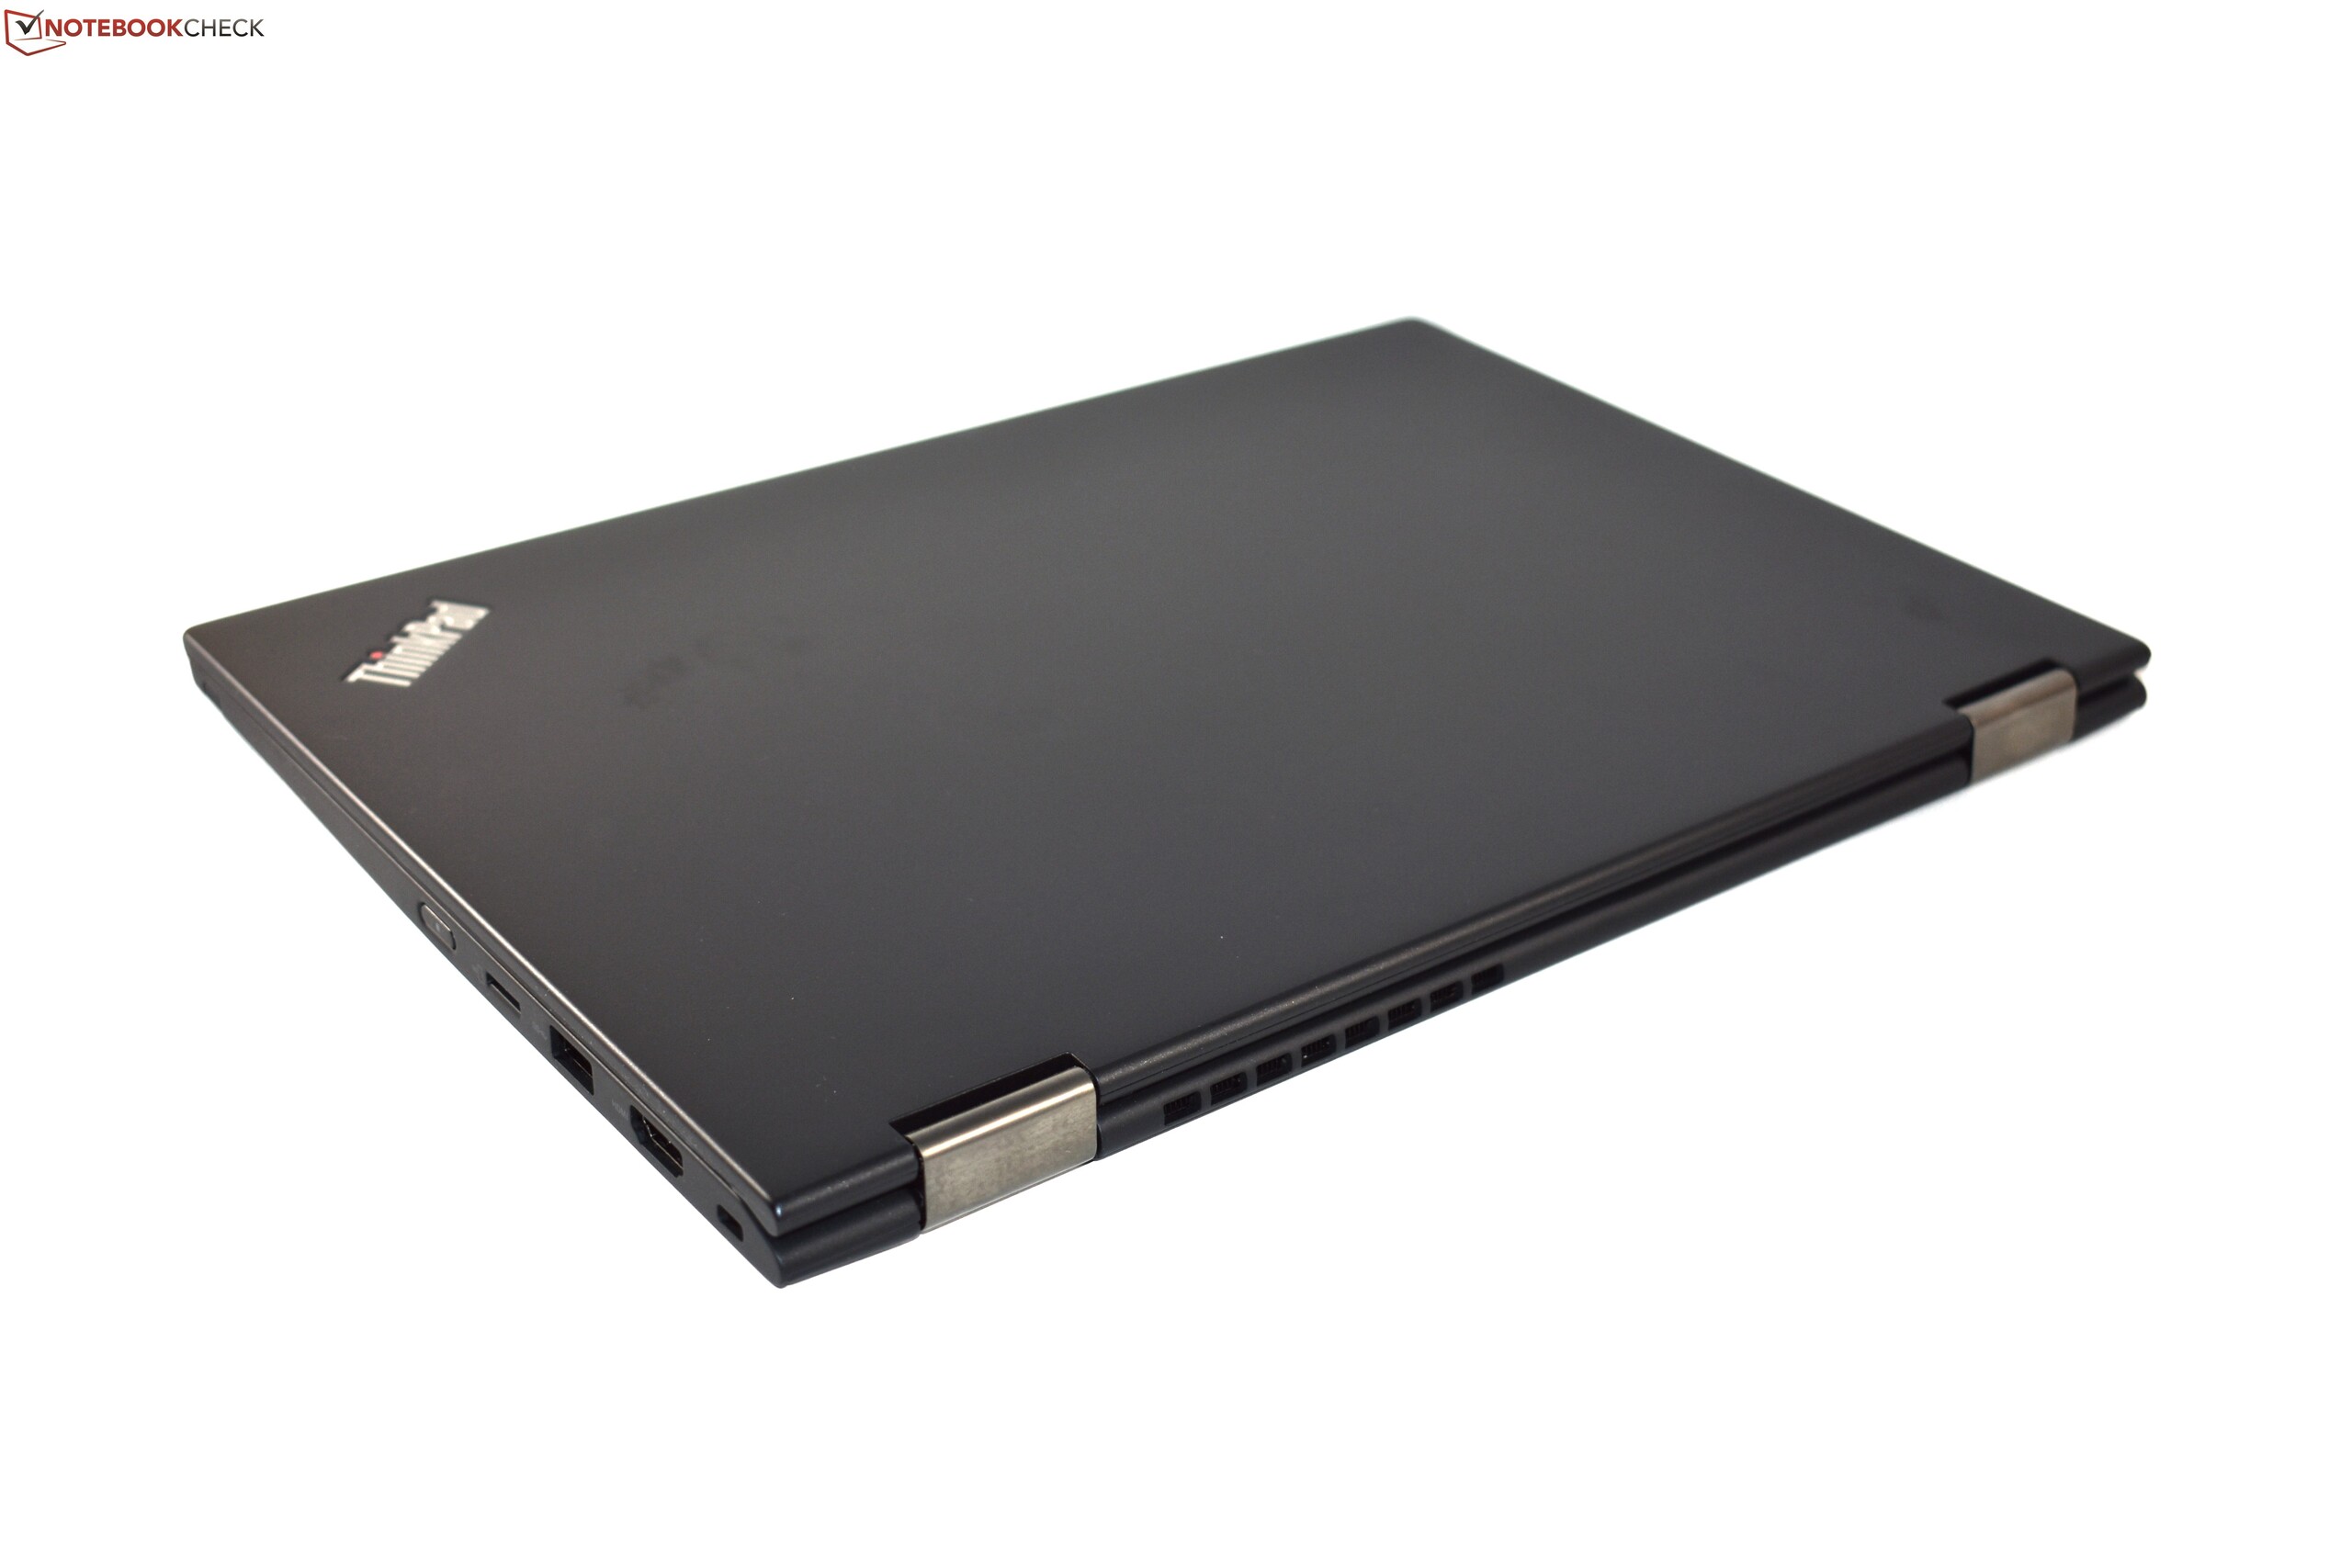
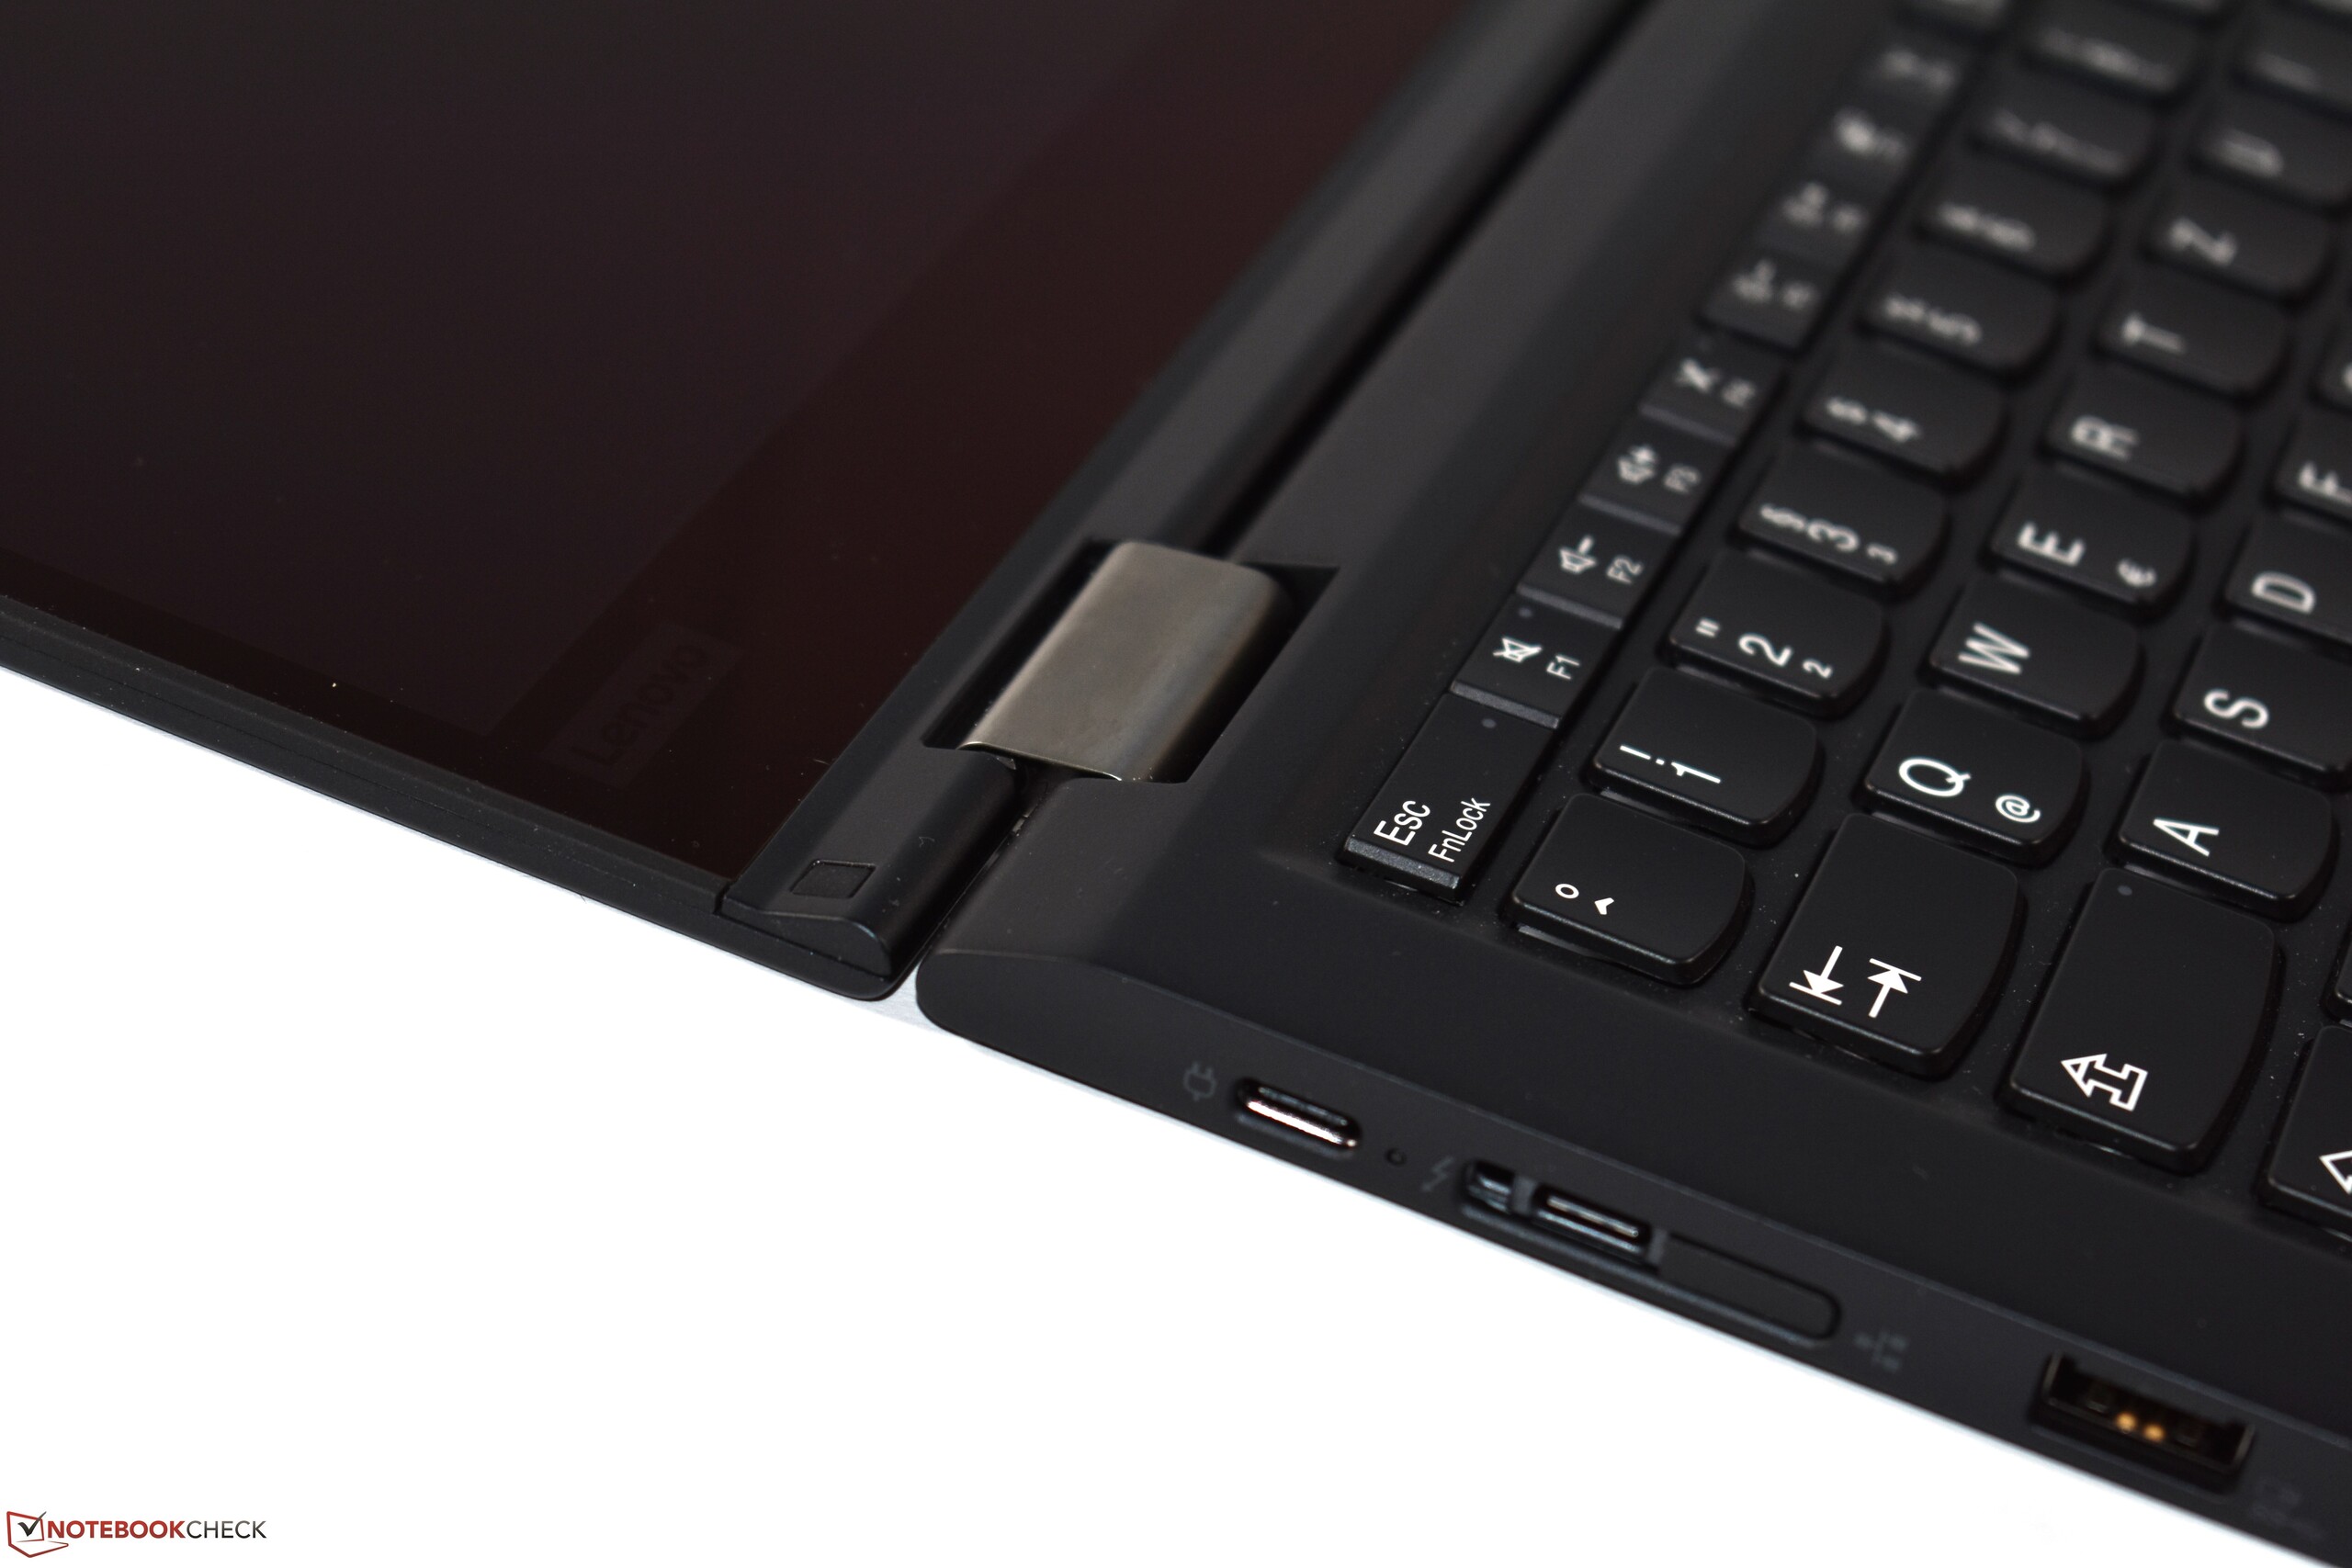
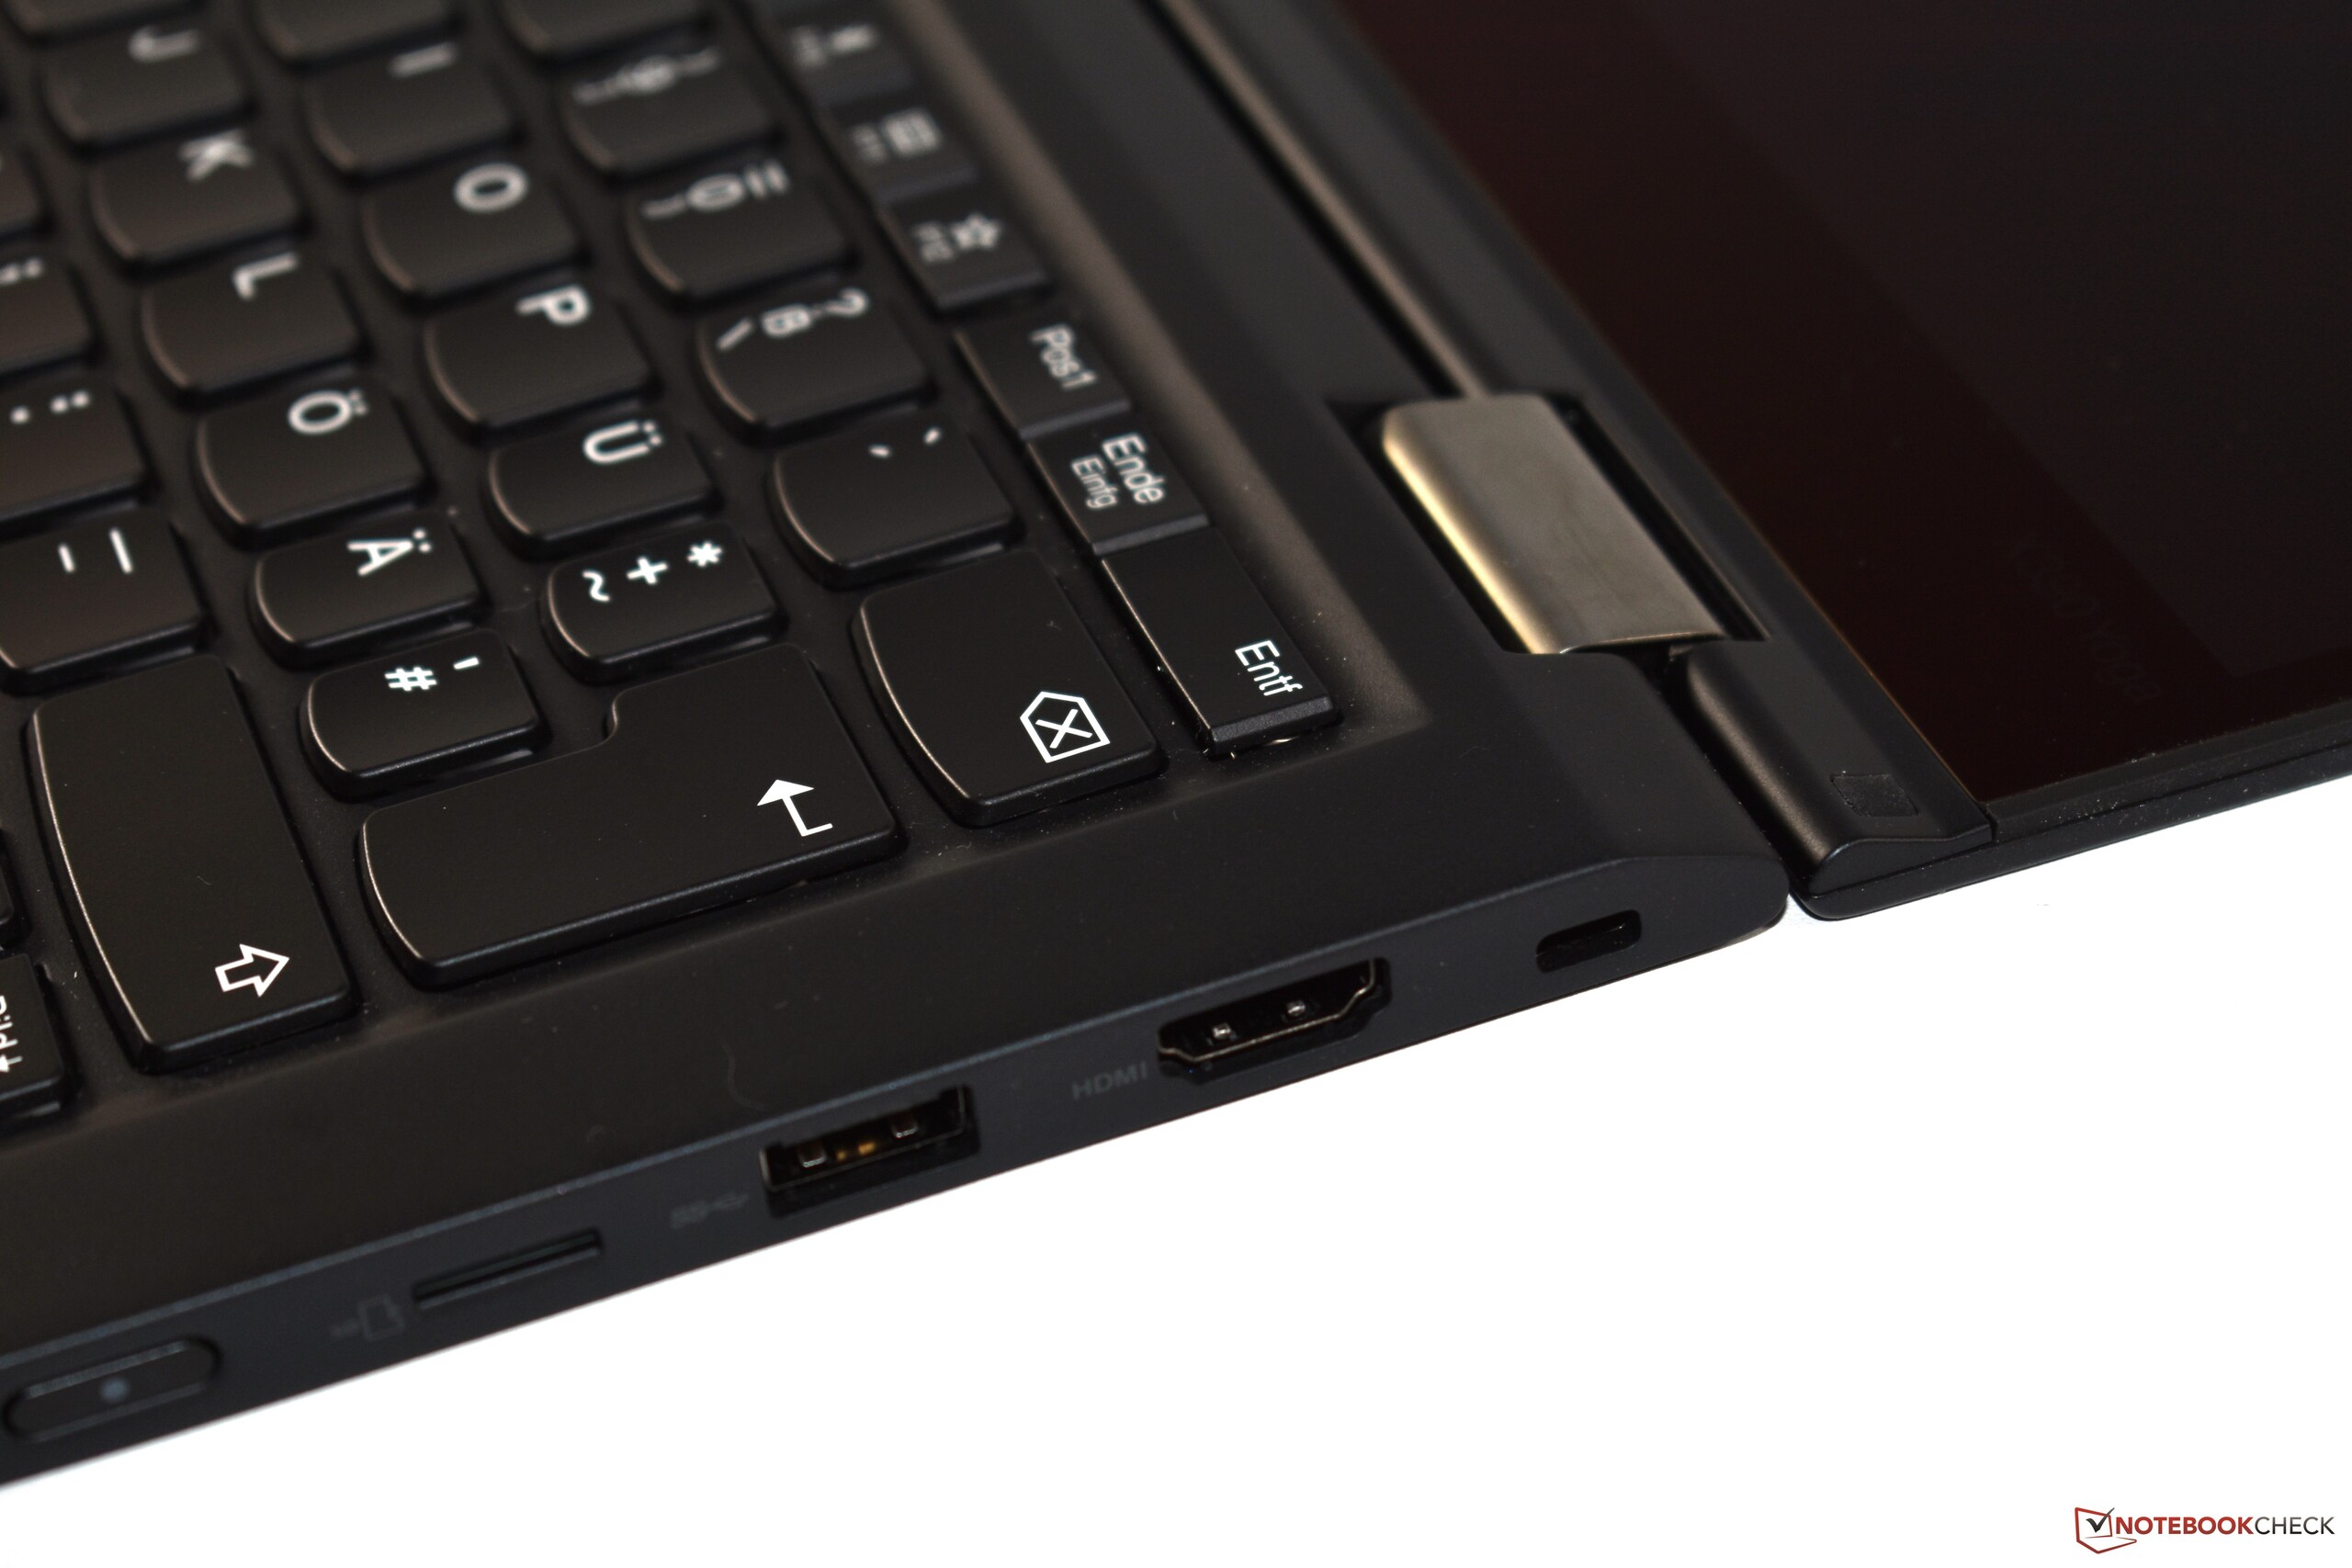
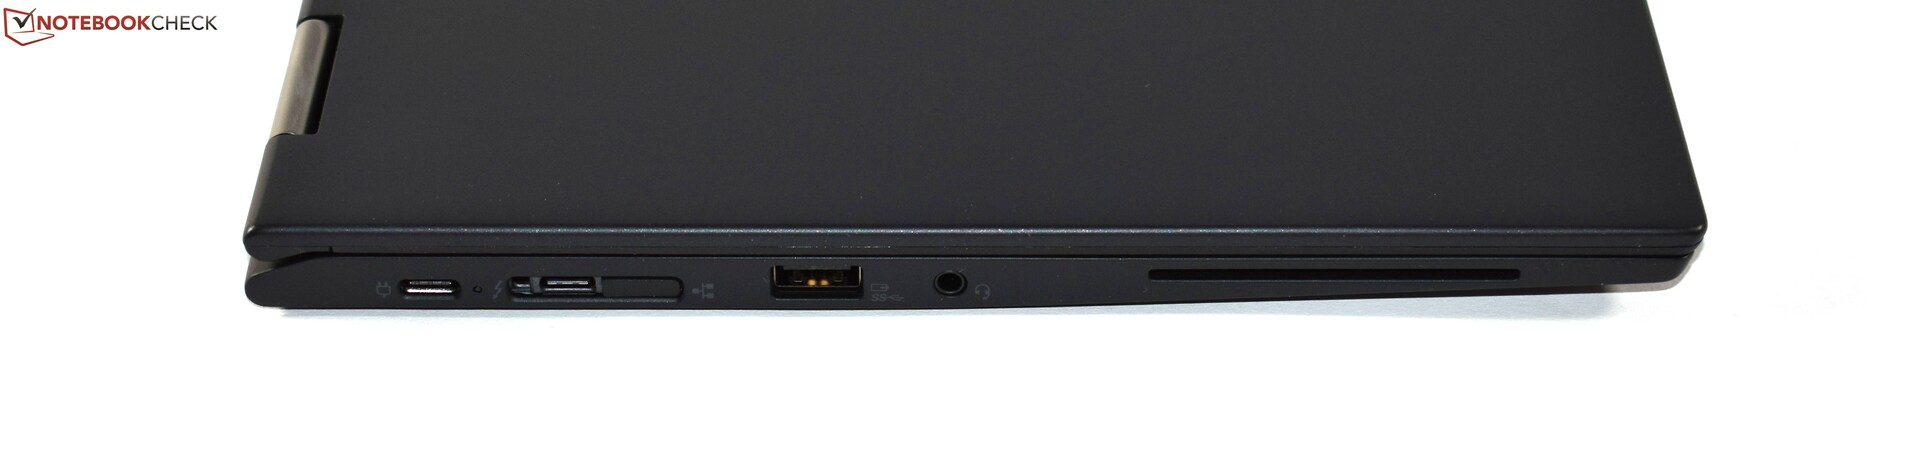
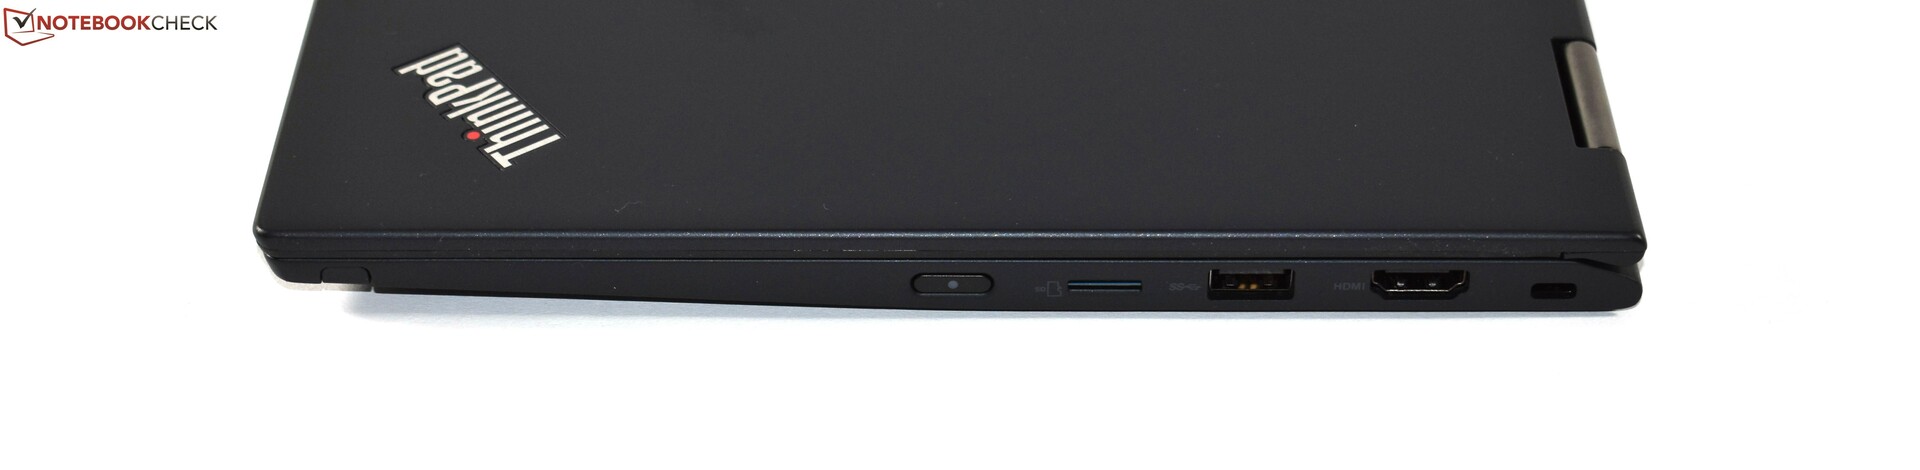
从更积极的方面来说,我们有更新的,一如既往稳定和坚固的机身,同时比其前身更轻薄。虽然键盘缺少其“Lift&Lock”机制,但毫无疑问它的手感非常好——至少如果你忽略了它比正常尺寸略小的事实。各种输入选项(触摸板,TrackPoint,触摸屏和手写笔)都非常易于使用。 ThinkPad翻转本的另一个灵活的方面是它的接口选择。与其前代产品相比,它现在具有额外的USB-C端口。这使用户能够连接与其他ThinkPad兼容的机械扩展坞——这是面向大型企业的一个重要卖点。除了亮面屏,X390 Yoga的屏幕可以提供高对比度和良好的色域覆盖。 CPU性能也得到了提升。它仍然不是特别令人印象深刻,无法与其他ThinkPad保持一样的水平,但它现在可以比其前代产品承担更长时间的负载。X390 Yoga的其他优点是安静的冷却风扇和慷慨的保修计划。
ThinkPad X390 Yoga是一款适合商业环境的高品质翻转本。其特别好的输入设备非常有吸引力。
总的来说,联想ThinkPad X390 Yoga的积极方面明显超过了它的缺点,这使得我们可以推荐它。其竞争对手戴尔Latitude 7390二合一和HP EliteBook x360 1030 G3也提供了相当多的产品,甚至可以在某些领域超越ThinkPad。例如,HP EliteBook具有更亮的屏幕和更好的续航时间。 ThinkPad Yoga在输入设备方面占据优势,并且还提供智能卡插槽或机械对接端口等功能,这应该使其对企业用户很有帮助。
Lenovo ThinkPad X390 Yoga-20NQS05R00
- 06/11/2019 v6 (old)
Benjamin Herzig
Price comparison

