亚马逊Fire HD 8(2018款)平板电脑评测
| Networking | |
| iperf3 transmit AX12 | |
| Xiaomi Mi Pad 4 | |
| Huawei MediaPad M5 8.4 | |
| Amazon Fire HD 8 2018 | |
| Amazon Fire HD 8 2017 | |
| iperf3 receive AX12 | |
| Xiaomi Mi Pad 4 | |
| Huawei MediaPad M5 8.4 | |
| Amazon Fire HD 8 2018 | |
| Amazon Fire HD 8 2017 | |


| |||||||||||||||||||||||||
Brightness Distribution: 89 %
Center on Battery: 359 cd/m²
Contrast: 422:1 (Black: 0.85 cd/m²)
ΔE ColorChecker Calman: 6.8 | ∀{0.5-29.43 Ø4.71}
ΔE Greyscale Calman: 7.6 | ∀{0.09-98 Ø4.96}
78.3% sRGB (Calman 2D)
Gamma: 2.19
CCT: 7160 K
| Amazon Fire HD 8 2018 IPS, 1280x800, 8" | Amazon Fire HD 8 2017 IPS, 1280x800, 8" | Huawei MediaPad M5 8.4 IPS, 2560x1600, 8.4" | Lenovo Tab 4 8 IPS, 1280x800, 8" | Samsung Galaxy Tab Active 2 TFT LCD, 1280x800, 8" | Xiaomi Mi Pad 4 IPS LCD, 1920x1200, 8" | |
|---|---|---|---|---|---|---|
| Screen | 25% | 19% | 33% | 54% | 26% | |
| Brightness middle (cd/m²) | 359 | 419 17% | 405 13% | 455 27% | 509 42% | 454 26% |
| Brightness (cd/m²) | 358 | 412 15% | 392 9% | 446 25% | 477 33% | 411 15% |
| Brightness Distribution (%) | 89 | 91 2% | 92 3% | 91 2% | 91 2% | 83 -7% |
| Black Level * (cd/m²) | 0.85 | 0.39 54% | 0.67 21% | 0.51 40% | 0.48 44% | 0.73 14% |
| Contrast (:1) | 422 | 1074 155% | 604 43% | 892 111% | 1060 151% | 622 47% |
| Colorchecker dE 2000 * | 6.8 | 8.5 -25% | 5.78 15% | 5.5 19% | 3.45 49% | 5.2 24% |
| Colorchecker dE 2000 max. * | 17.3 | 13.8 20% | 9.82 43% | 14.8 14% | 5.17 70% | 8.36 52% |
| Greyscale dE 2000 * | 7.6 | 10.3 -36% | 7.2 5% | 5.5 28% | 4.5 41% | 4.7 38% |
| Gamma | 2.19 100% | 2.6 85% | 2.278 97% | 2.23 99% | 2.11 104% | 2.271 97% |
| CCT | 7160 91% | 6216 105% | 8405 77% | 7852 83% | 7171 91% | 7361 88% |
* ... smaller is better
Screen Flickering / PWM (Pulse-Width Modulation)
| Screen flickering / PWM not detected | 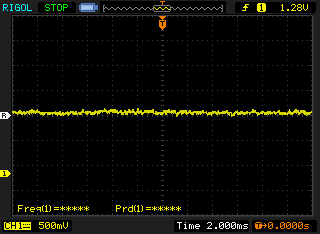 | ||
In comparison: 52 % of all tested devices do not use PWM to dim the display. If PWM was detected, an average of 7754 (minimum: 5 - maximum: 343500) Hz was measured. | |||
Display Response Times
| ↔ Response Time Black to White | ||
|---|---|---|
| 38 ms ... rise ↗ and fall ↘ combined | ↗ 20.8 ms rise | 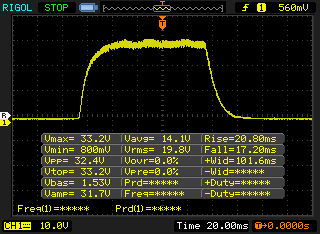 |
| ↘ 17.2 ms fall | ||
| The screen shows slow response rates in our tests and will be unsatisfactory for gamers. In comparison, all tested devices range from 0.1 (minimum) to 240 (maximum) ms. » 96 % of all devices are better. This means that the measured response time is worse than the average of all tested devices (19.8 ms). | ||
| ↔ Response Time 50% Grey to 80% Grey | ||
| 48 ms ... rise ↗ and fall ↘ combined | ↗ 26.8 ms rise | 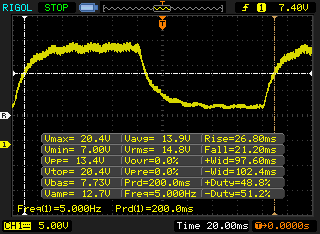 |
| ↘ 21.2 ms fall | ||
| The screen shows slow response rates in our tests and will be unsatisfactory for gamers. In comparison, all tested devices range from 0.165 (minimum) to 636 (maximum) ms. » 82 % of all devices are better. This means that the measured response time is worse than the average of all tested devices (31 ms). | ||
| GFXBench | |
| on screen Car Chase Onscreen | |
| Average of class Tablet (3.8 - 110, n=57, last 2 years) | |
| Huawei MediaPad M5 8.4 | |
| Xiaomi Mi Pad 4 | |
| Samsung Galaxy Tab Active 2 | |
| Amazon Fire HD 8 2018 | |
| 1920x1080 Car Chase Offscreen | |
| Average of class Tablet (4 - 256, n=57, last 2 years) | |
| Huawei MediaPad M5 8.4 | |
| Xiaomi Mi Pad 4 | |
| Samsung Galaxy Tab Active 2 | |
| Amazon Fire HD 8 2018 | |
| AnTuTu v7 - Total Score | |
| Huawei MediaPad M5 8.4 | |
| Xiaomi Mi Pad 4 | |
| Amazon Fire HD 8 2018 | |
| Average MediaTek MT8163 V/B 1.3 GHz (n=1) | |
| JetStream 1.1 - 1.1 Total | |
| Huawei MediaPad M5 8.4 (Chrome 66) | |
| Xiaomi Mi Pad 4 (Chrome 68) | |
| Samsung Galaxy Tab Active 2 | |
| Amazon Fire HD 8 2017 (Amazon Silk 58.2.3029.83.10) | |
| Lenovo Tab 4 8 (Chrome 61) | |
| Average MediaTek MT8163 V/B 1.3 GHz (13.3 - 21.2, n=6) | |
| Amazon Fire HD 8 2018 (Silk Browser 66.2.10.3359.126.10) | |
| Octane V2 - Total Score | |
| Average of class Tablet (1633 - 138481, n=71, last 2 years) | |
| Huawei MediaPad M5 8.4 (Chrome 66) | |
| Xiaomi Mi Pad 4 (Chrome 68) | |
| Samsung Galaxy Tab Active 2 | |
| Average MediaTek MT8163 V/B 1.3 GHz (2821 - 3320, n=6) | |
| Lenovo Tab 4 8 (Chrome 61) | |
| Amazon Fire HD 8 2018 (Silk Browser 66.2.10.3359.126.10) | |
| Amazon Fire HD 8 2017 (Amazon Silk 58.2.3029.83.10) | |
| Mozilla Kraken 1.1 - Total | |
| Amazon Fire HD 8 2018 (Silk Browser 66.2.10.3359.126.10) | |
| Average MediaTek MT8163 V/B 1.3 GHz (11818 - 14321, n=6) | |
| Lenovo Tab 4 8 (Chrome 61) | |
| Amazon Fire HD 8 2017 (Amazon Silk 58.2.3029.83.10) | |
| Samsung Galaxy Tab Active 2 | |
| Xiaomi Mi Pad 4 (Chrome 68) | |
| Huawei MediaPad M5 8.4 (Chrome 66) | |
| Average of class Tablet (243 - 16233, n=65, last 2 years) | |
| WebXPRT 3 - Overall | |
| Average of class Tablet (168 - 520, n=10, last 2 years) | |
| Huawei MediaPad M5 8.4 (Chrome 66) | |
| Amazon Fire HD 8 2018 (Silk Browser 66.2.10.3359.126.10) | |
| Average MediaTek MT8163 V/B 1.3 GHz (23 - 25, n=3) | |
| WebXPRT 2015 - Overall | |
| Huawei MediaPad M5 8.4 (Chrome 66) | |
| Xiaomi Mi Pad 4 (Chrome 68) | |
| Amazon Fire HD 8 2018 (Silk Browser 66.2.10.3359.126.10) | |
| Lenovo Tab 4 8 (Chrome 61) | |
| Samsung Galaxy Tab Active 2 | |
| Average MediaTek MT8163 V/B 1.3 GHz (57 - 71, n=4) | |
| Amazon Fire HD 8 2017 (Amazon Silk 58.2.3029.83.10) | |
* ... smaller is better
| Amazon Fire HD 8 2018 | Amazon Fire HD 8 2017 | Huawei MediaPad M5 8.4 | Lenovo Tab 4 8 | Samsung Galaxy Tab Active 2 | Xiaomi Mi Pad 4 | Average 16 GB eMMC Flash | Average of class Tablet | |
|---|---|---|---|---|---|---|---|---|
| AndroBench 3-5 | -2% | 170% | 51% | 33% | 233% | -3% | 2138% | |
| Sequential Read 256KB (MB/s) | 158.5 | 159.1 0% | 268.6 69% | 265.1 67% | 218.1 38% | 277.6 75% | 164.5 ? 4% | 2073 ? 1208% |
| Sequential Write 256KB (MB/s) | 41.89 | 47.23 13% | 132.2 216% | 72.3 73% | 54 29% | 207.9 396% | 43 ? 3% | 1667 ? 3879% |
| Random Read 4KB (MB/s) | 26.98 | 21.55 -20% | 62.8 133% | 44 63% | 25.96 -4% | 94.2 249% | 21.7 ? -20% | 275 ? 919% |
| Random Write 4KB (MB/s) | 12.25 | 11.51 -6% | 65.1 431% | 7.1 -42% | 10.98 -10% | 77.9 536% | 8.08 ? -34% | 324 ? 2545% |
| Sequential Read 256KB SDCard (MB/s) | 51.4 ? | 51.1 -1% | 84.9 ? 65% | 84.8 65% | 78.6 53% | 84.2 ? 64% | 59.1 ? 15% | |
| Sequential Write 256KB SDCard (MB/s) | 34.03 ? | 34.15 0% | 70.7 ? 108% | 61.1 80% | 64.3 89% | 61.2 ? 80% | 39.8 ? 17% |
Dead Trigger 2
Asphalt 9
(+) The maximum temperature on the upper side is 31.4 °C / 89 F, compared to the average of 33.7 °C / 93 F, ranging from 20.7 to 53.2 °C for the class Tablet.
(+) The bottom heats up to a maximum of 34.2 °C / 94 F, compared to the average of 33.2 °C / 92 F
(+) In idle usage, the average temperature for the upper side is 21.9 °C / 71 F, compared to the device average of 30 °C / 86 F.
Amazon Fire HD 8 2018 audio analysis
(±) | speaker loudness is average but good (76.3 dB)
Bass 100 - 315 Hz
(-) | nearly no bass - on average 17.4% lower than median
(±) | linearity of bass is average (9.5% delta to prev. frequency)
Mids 400 - 2000 Hz
(+) | balanced mids - only 3.7% away from median
(+) | mids are linear (4.4% delta to prev. frequency)
Highs 2 - 16 kHz
(±) | higher highs - on average 5.2% higher than median
(+) | highs are linear (3.1% delta to prev. frequency)
Overall 100 - 16.000 Hz
(±) | linearity of overall sound is average (19.1% difference to median)
Compared to same class
» 53% of all tested devices in this class were better, 5% similar, 42% worse
» The best had a delta of 7%, average was 20%, worst was 129%
Compared to all devices tested
» 46% of all tested devices were better, 7% similar, 47% worse
» The best had a delta of 4%, average was 23%, worst was 134%
Huawei MediaPad M5 8.4 audio analysis
(+) | speakers can play relatively loud (85 dB)
Bass 100 - 315 Hz
(-) | nearly no bass - on average 19.2% lower than median
(±) | linearity of bass is average (12.5% delta to prev. frequency)
Mids 400 - 2000 Hz
(+) | balanced mids - only 3.6% away from median
(+) | mids are linear (2.7% delta to prev. frequency)
Highs 2 - 16 kHz
(+) | balanced highs - only 4.2% away from median
(+) | highs are linear (3.5% delta to prev. frequency)
Overall 100 - 16.000 Hz
(±) | linearity of overall sound is average (15.9% difference to median)
Compared to same class
» 36% of all tested devices in this class were better, 6% similar, 58% worse
» The best had a delta of 7%, average was 20%, worst was 129%
Compared to all devices tested
» 25% of all tested devices were better, 5% similar, 70% worse
» The best had a delta of 4%, average was 23%, worst was 134%
| Off / Standby | |
| Idle | |
| Load |
|
Key:
min: | |
| Amazon Fire HD 8 2018 4750 mAh | Amazon Fire HD 8 2017 mAh | Huawei MediaPad M5 8.4 5100 mAh | Lenovo Tab 4 8 4850 mAh | Samsung Galaxy Tab Active 2 4450 mAh | Xiaomi Mi Pad 4 6000 mAh | |
|---|---|---|---|---|---|---|
| Power Consumption | 12% | -43% | -6% | 11% | -31% | |
| Idle Minimum * (Watt) | 0.97 | 0.99 -2% | 2.1 -116% | 1.1 -13% | 0.89 8% | 1.2 -24% |
| Idle Average * (Watt) | 3.26 | 2.74 16% | 3.74 -15% | 3.51 -8% | 3.13 4% | 2.2 33% |
| Idle Maximum * (Watt) | 3.37 | 2.83 16% | 4.33 -28% | 4.14 -23% | 3.36 -0% | 4.1 -22% |
| Load Average * (Watt) | 5.68 | 4.51 21% | 6.32 -11% | 4.86 14% | 3.93 31% | 8.2 -44% |
| Load Maximum * (Watt) | 6.21 | 5.69 8% | 9.13 -47% | 6.13 1% | 5.45 12% | 12.2 -96% |
* ... smaller is better
| Amazon Fire HD 8 2018 4750 mAh | Amazon Fire HD 8 2017 mAh | Huawei MediaPad M5 8.4 5100 mAh | Lenovo Tab 4 8 4850 mAh | Samsung Galaxy Tab Active 2 4450 mAh | Xiaomi Mi Pad 4 6000 mAh | |
|---|---|---|---|---|---|---|
| Battery runtime | 51% | 15% | 1% | 31% | 34% | |
| Reader / Idle (h) | 19.5 | 33.9 74% | 19.2 -2% | 20.1 3% | 22.6 16% | 22.7 16% |
| H.264 (h) | 8.3 | 12.4 49% | 11.7 41% | 10.1 22% | 8.2 -1% | 15.2 83% |
| WiFi v1.3 (h) | 8.2 | 12.8 56% | 10.5 28% | 7.5 -9% | 14.9 82% | 13.8 68% |
| Load (h) | 5.3 | 6.6 25% | 5 -6% | 4.6 -13% | 6.6 25% | 3.7 -30% |
Pros
Cons
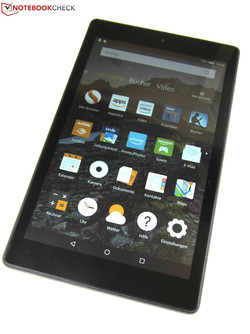
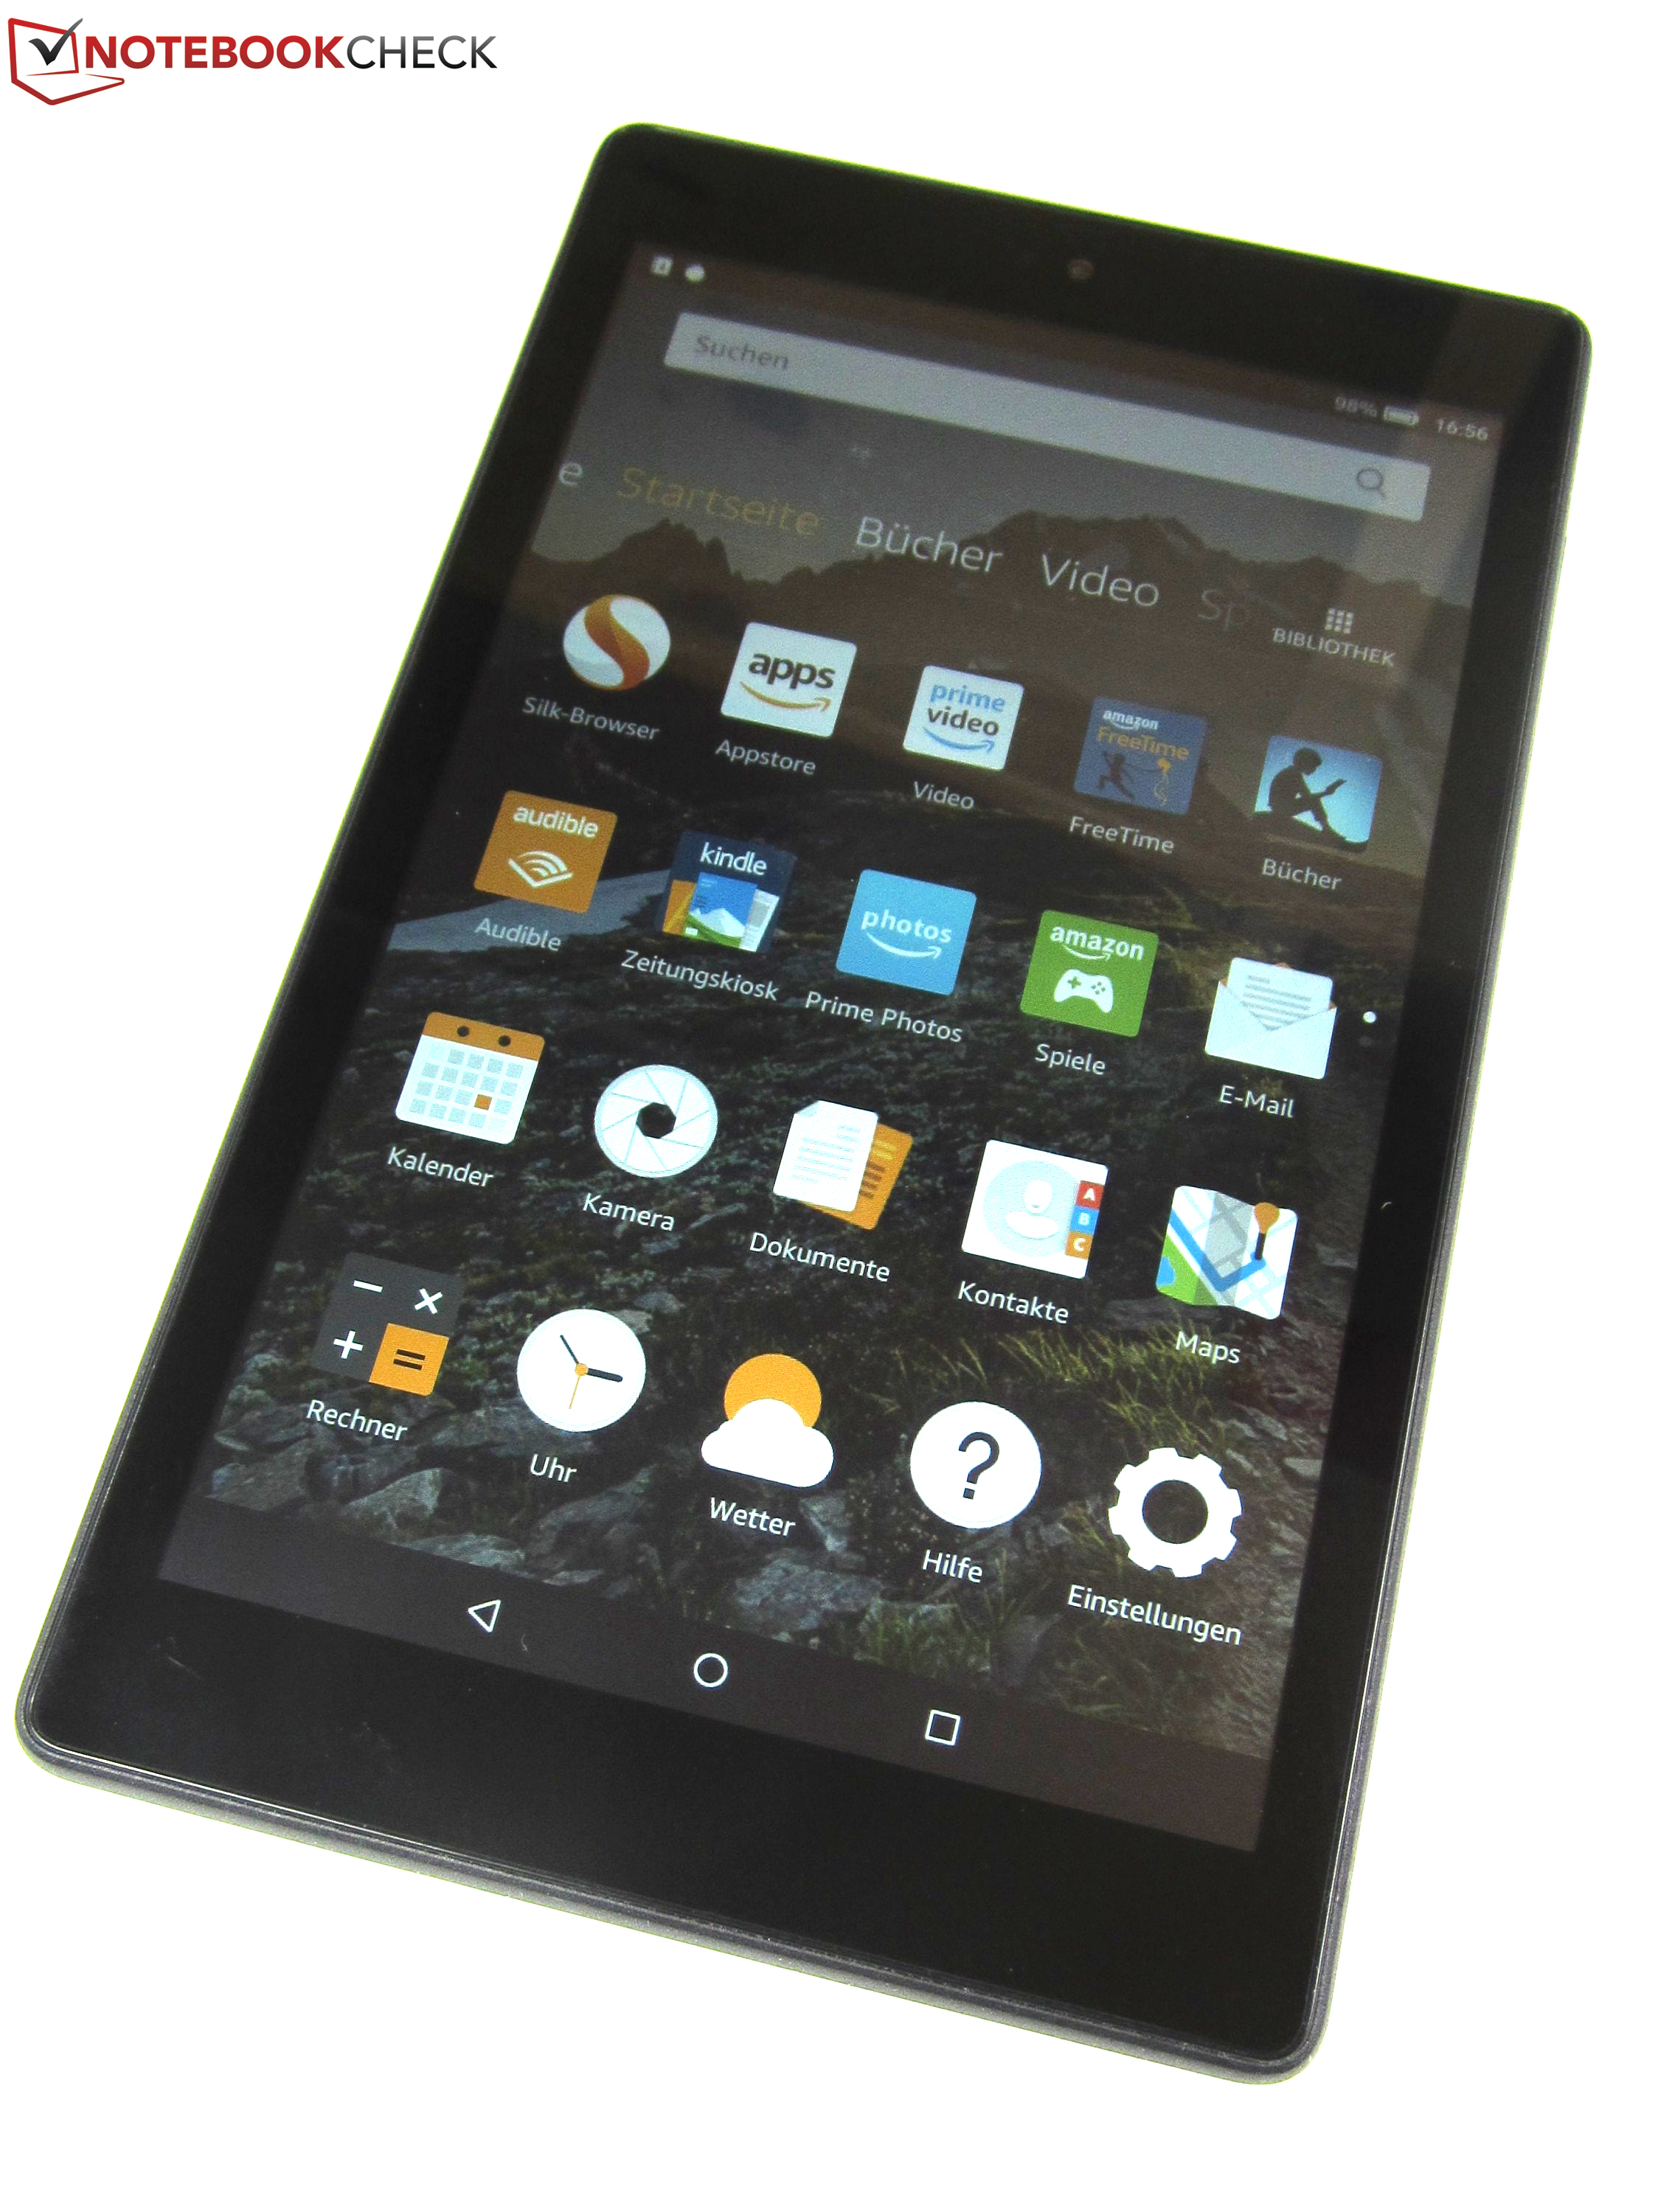
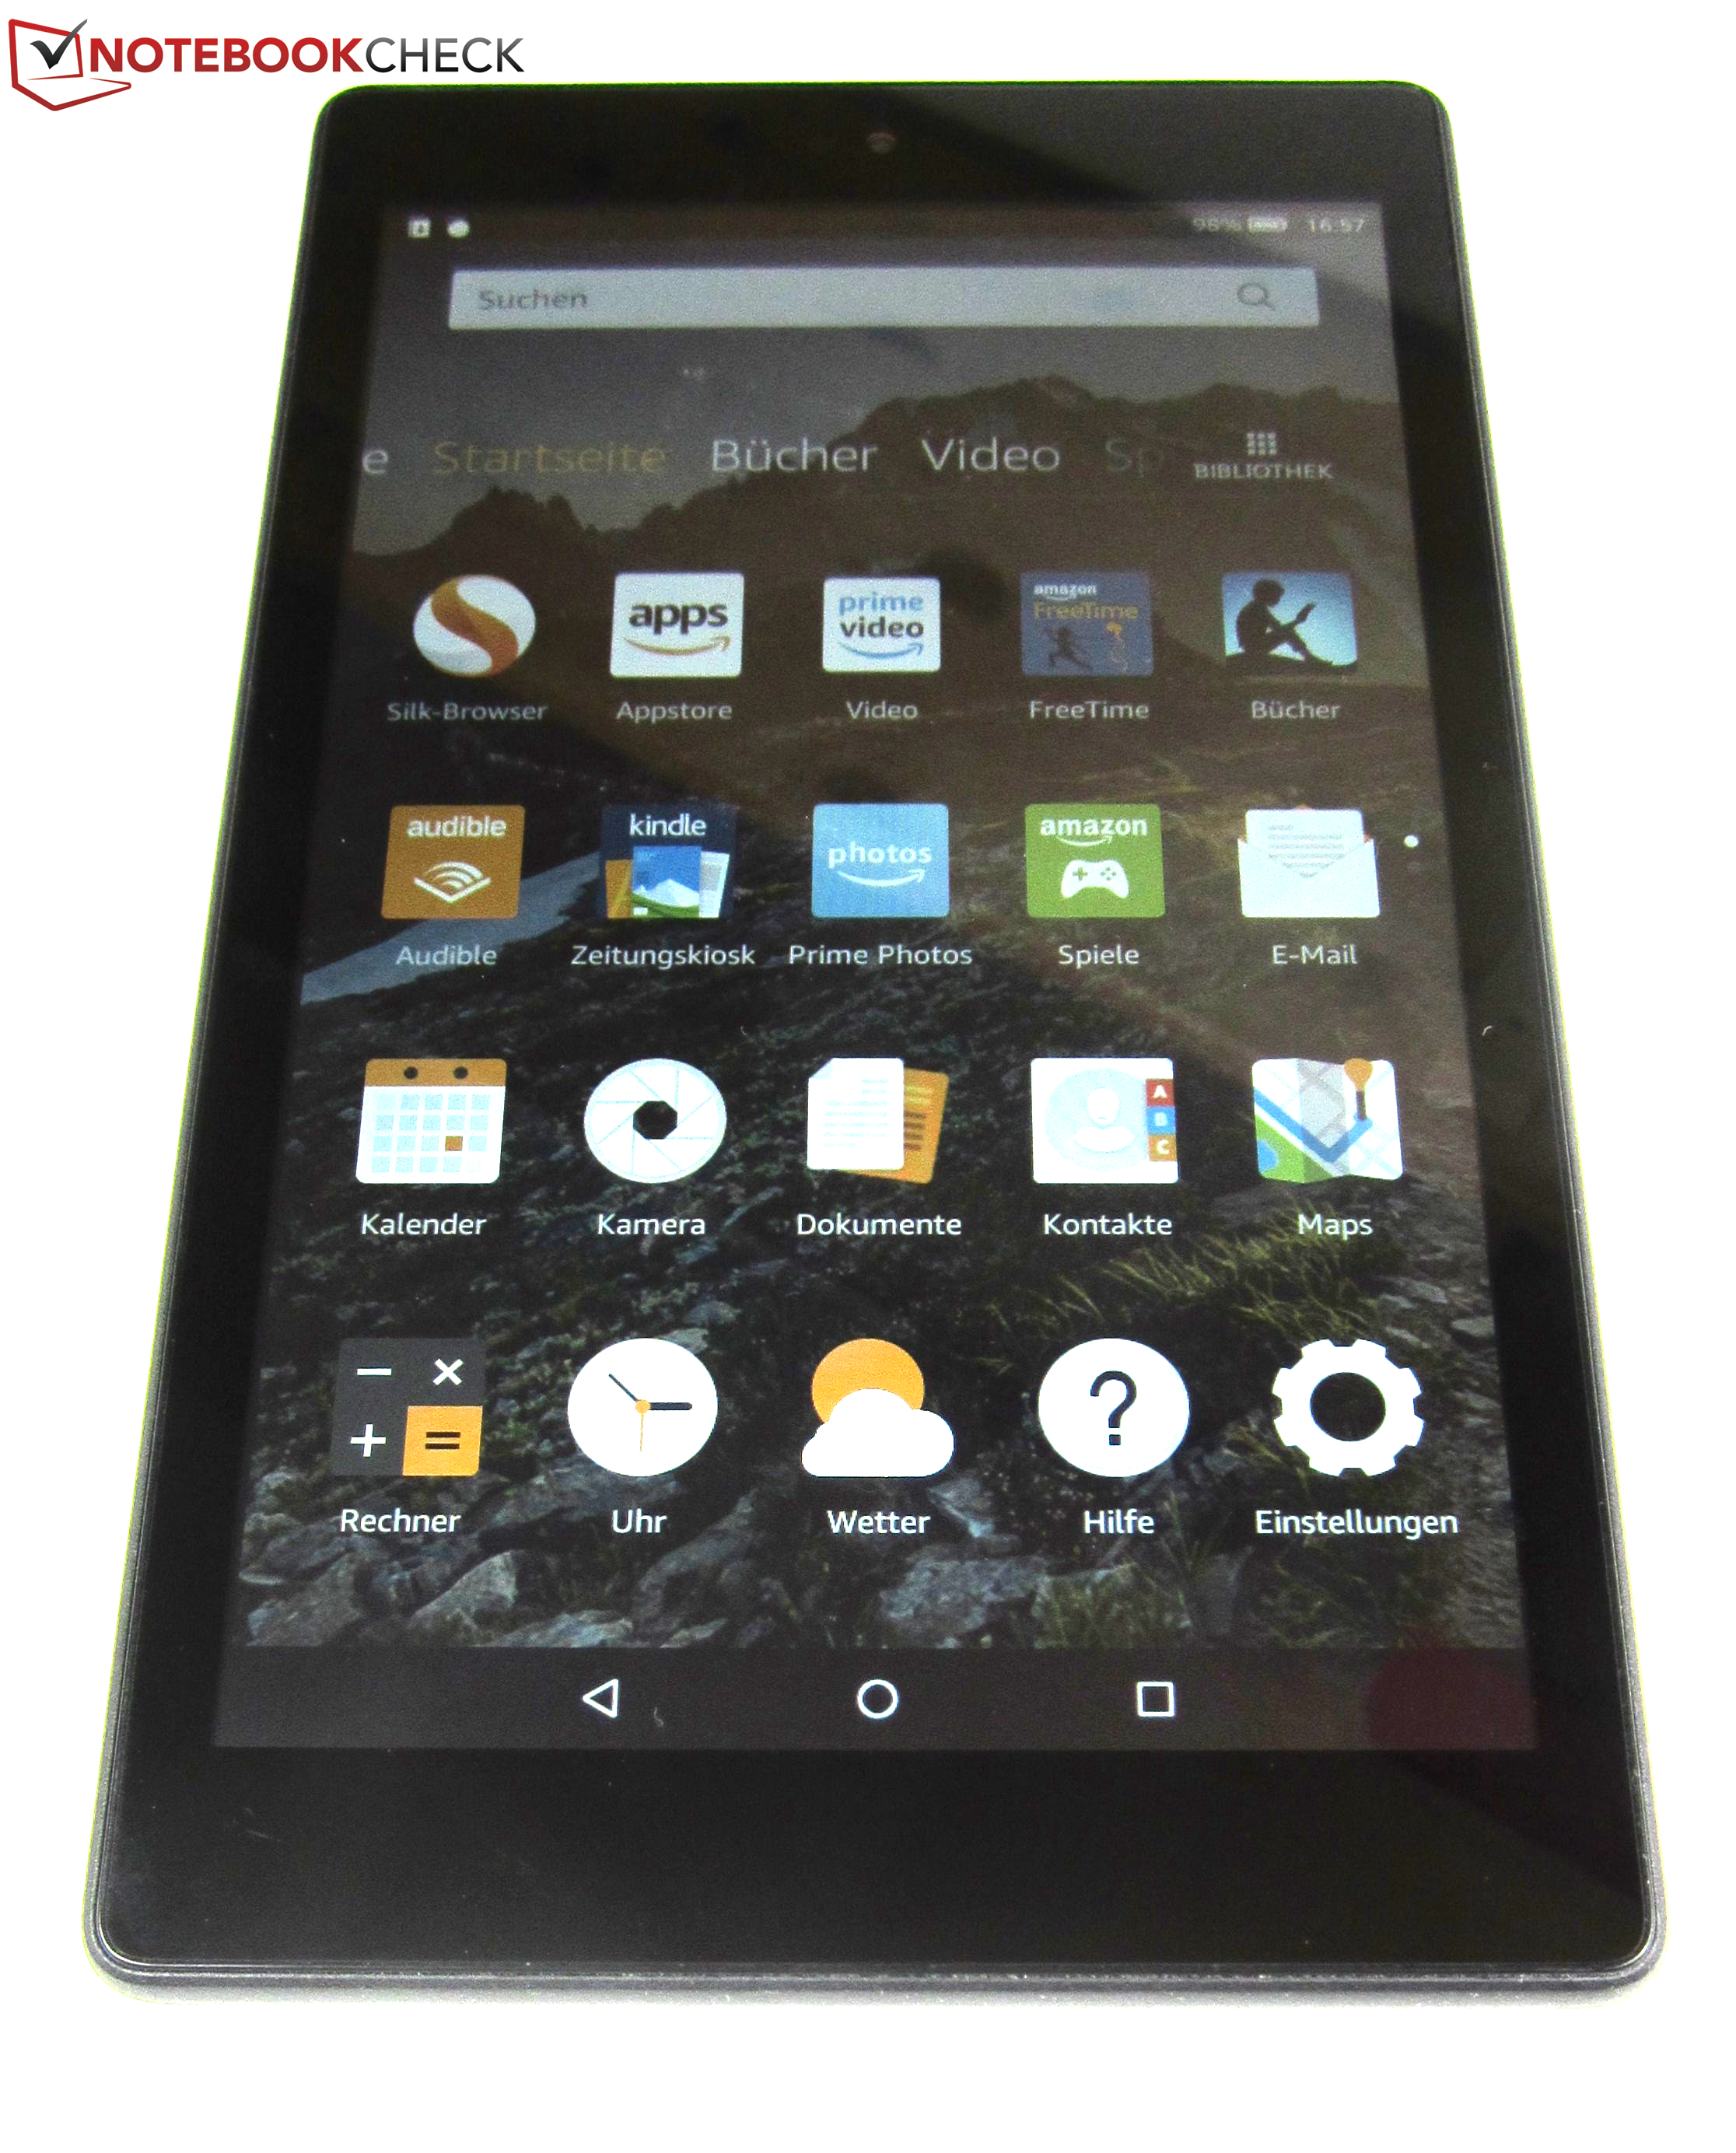
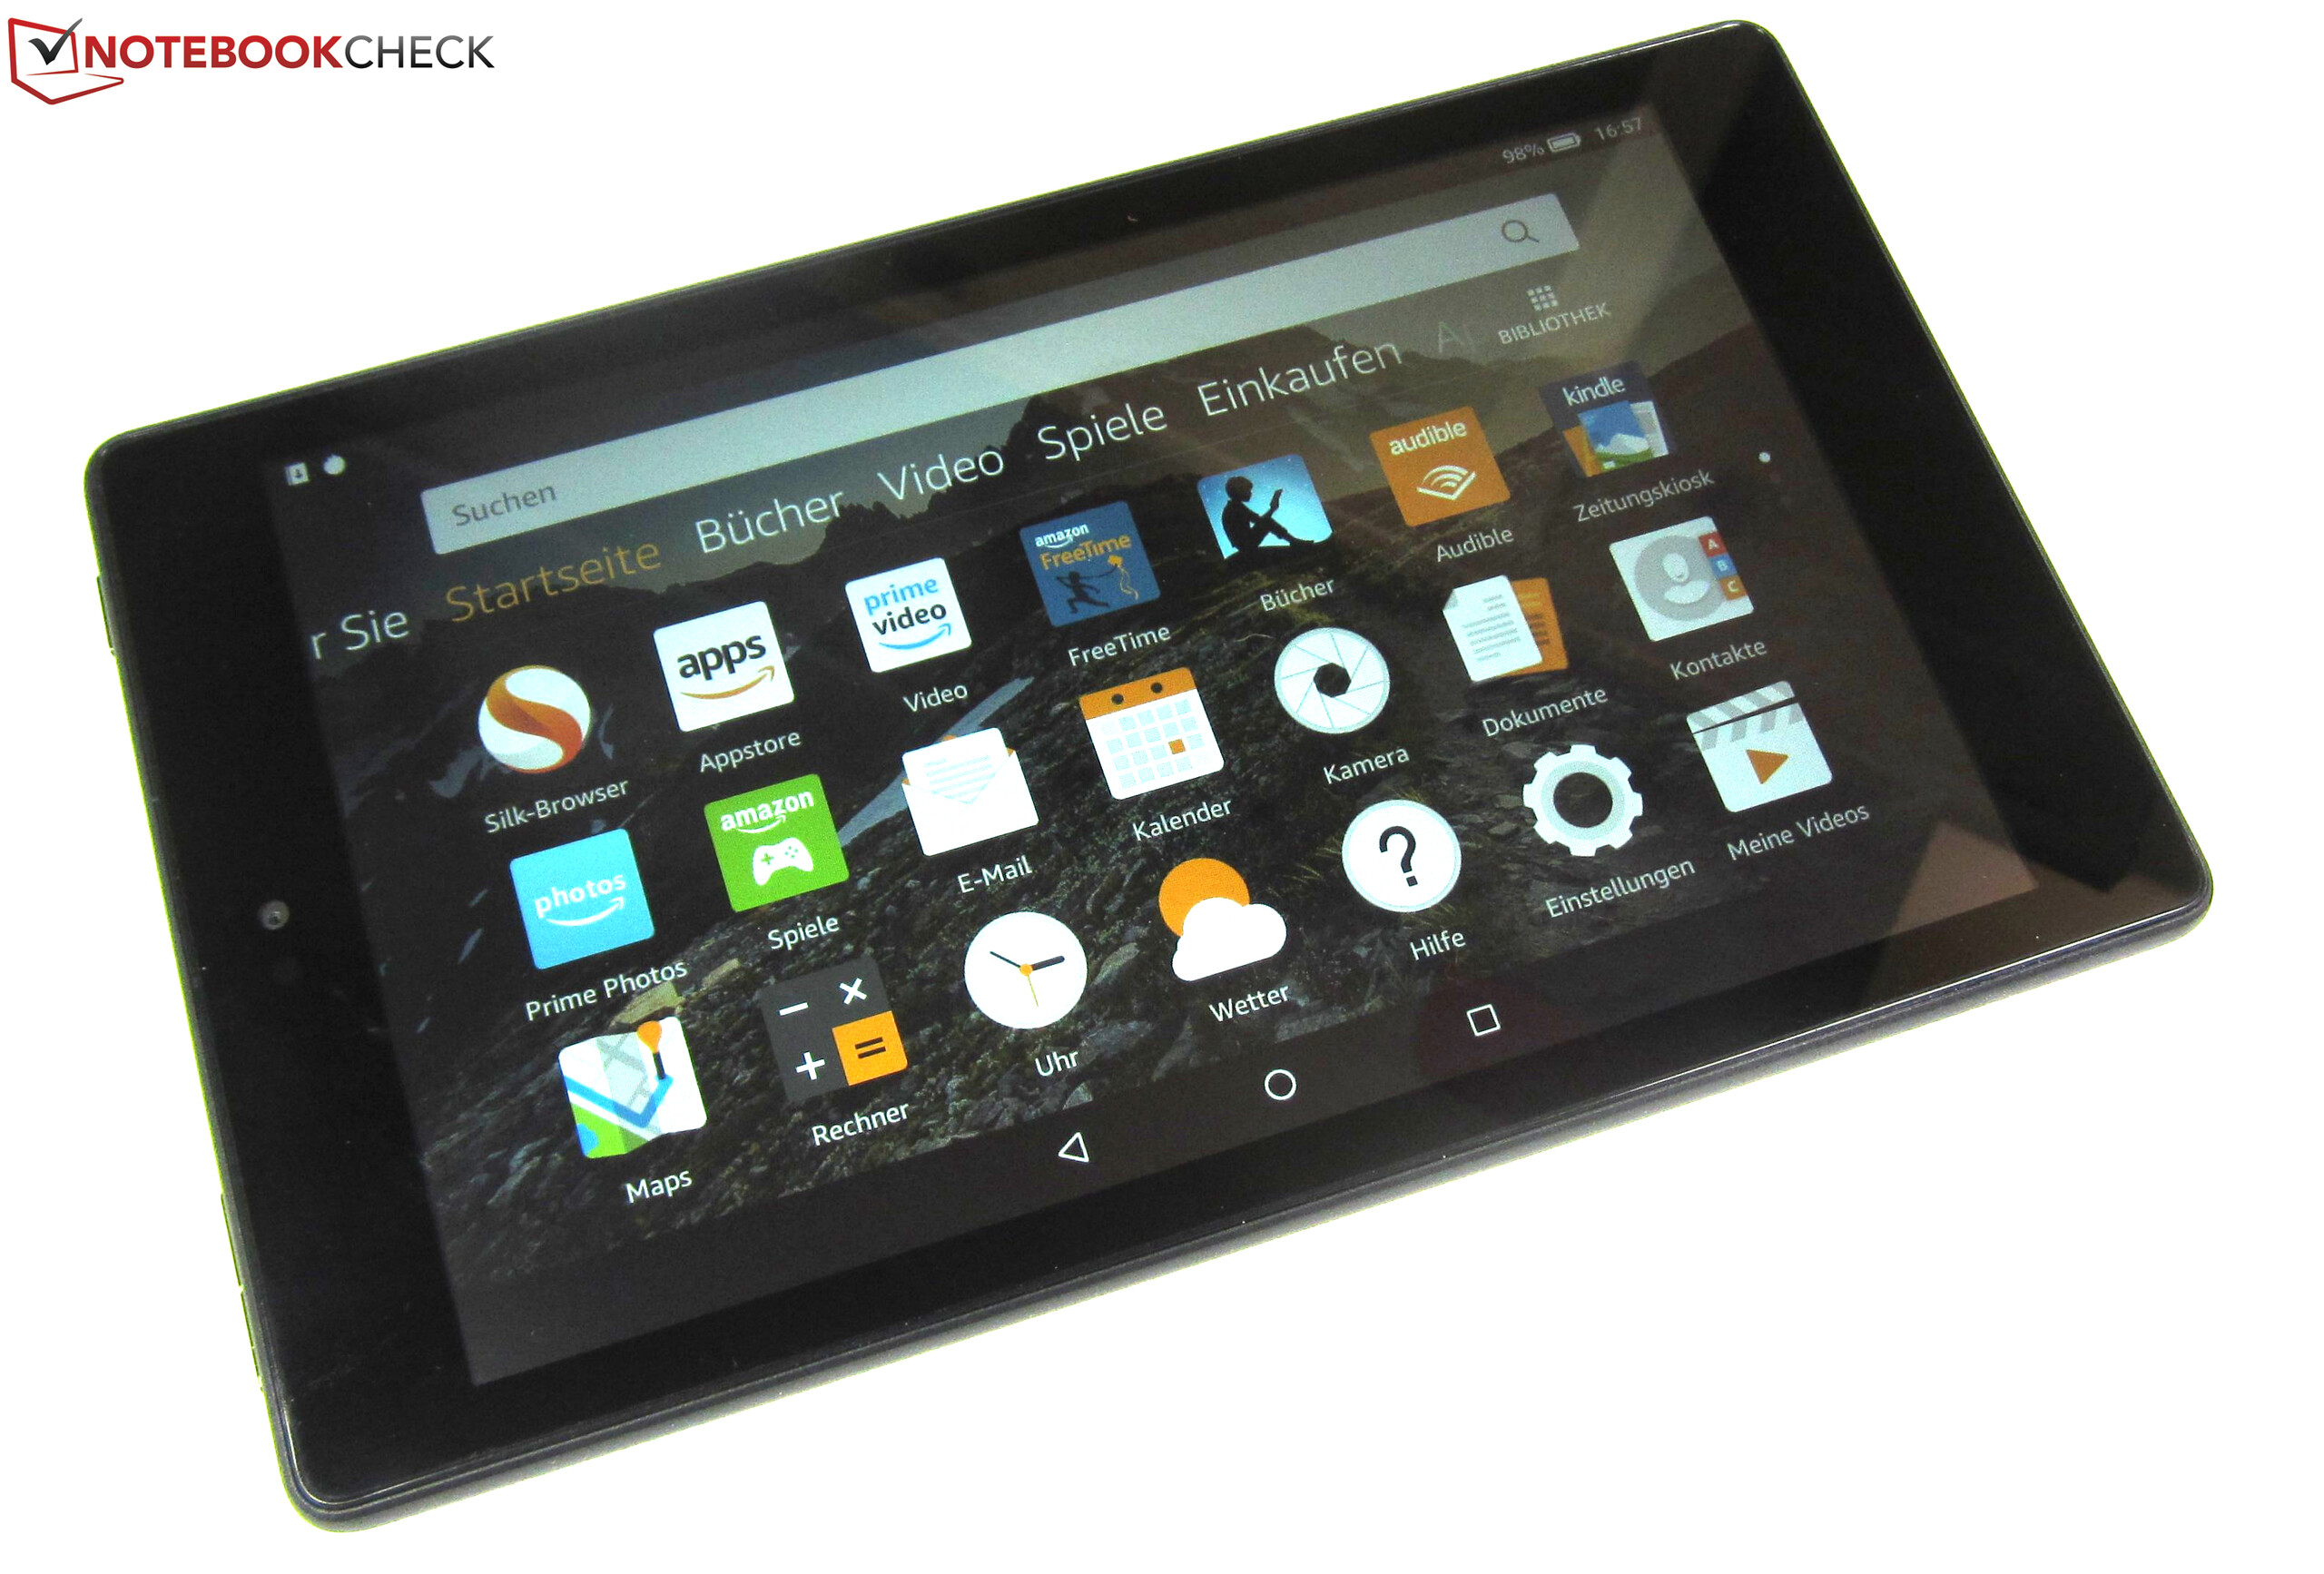
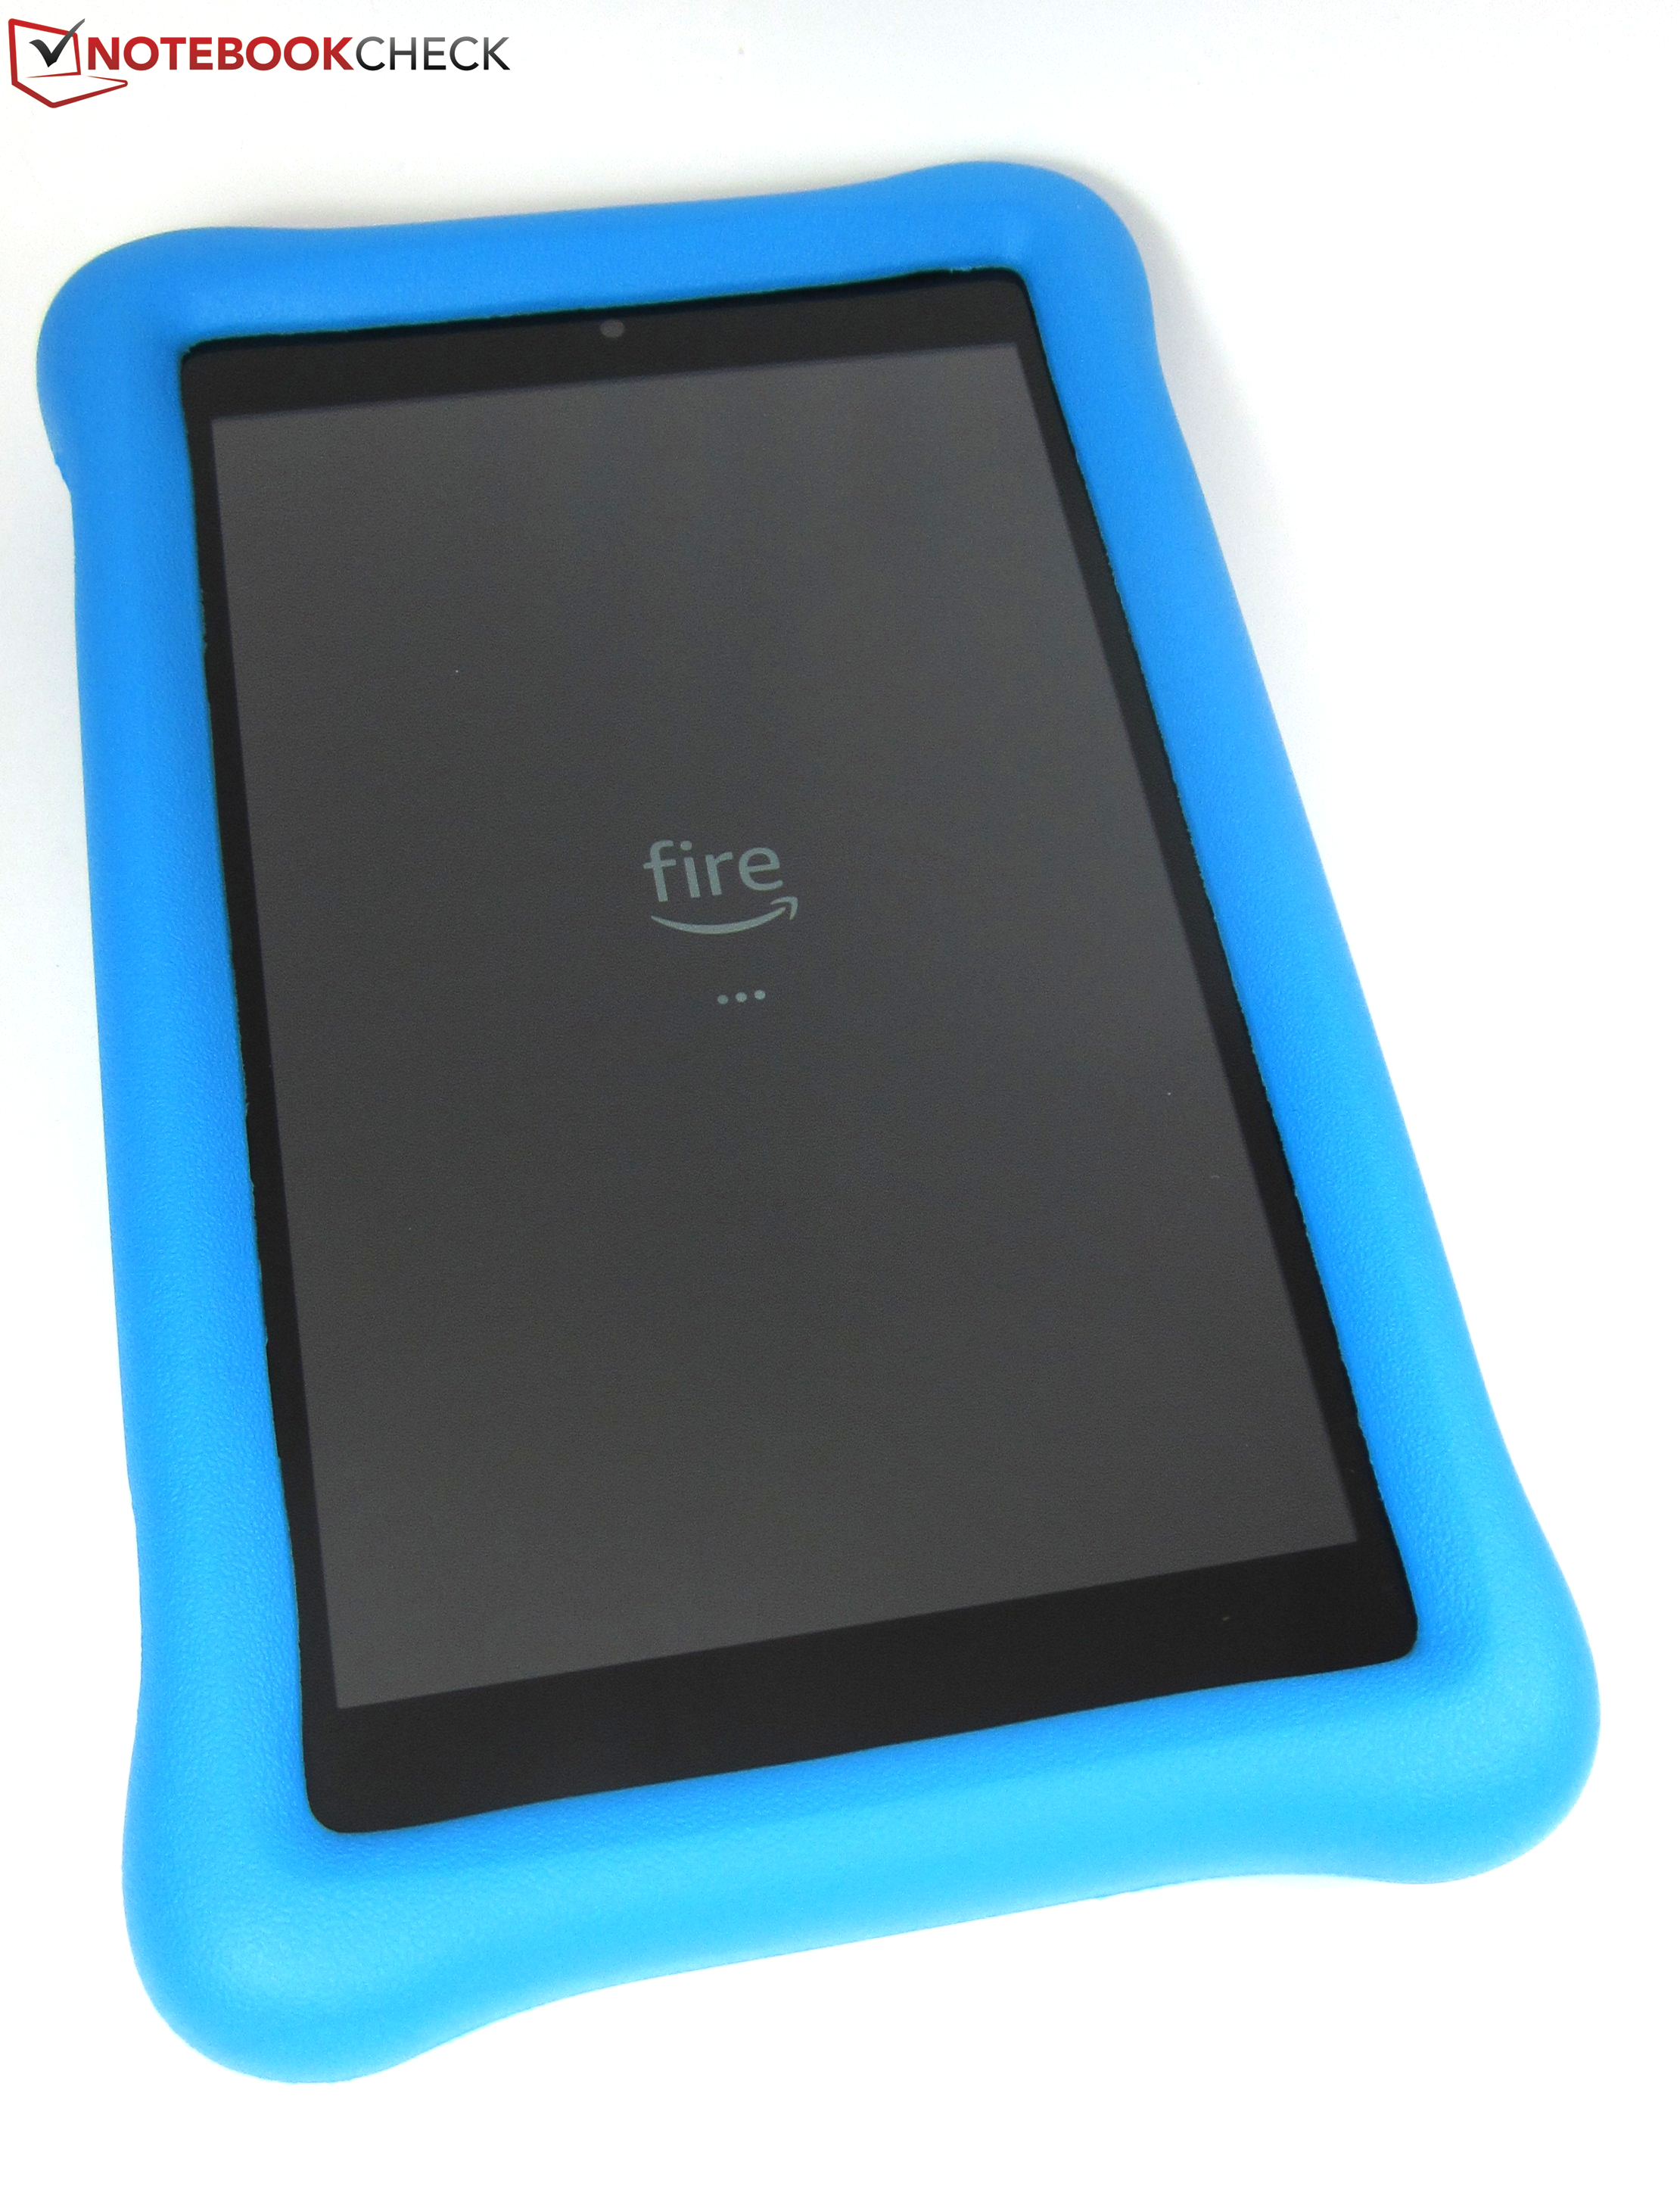
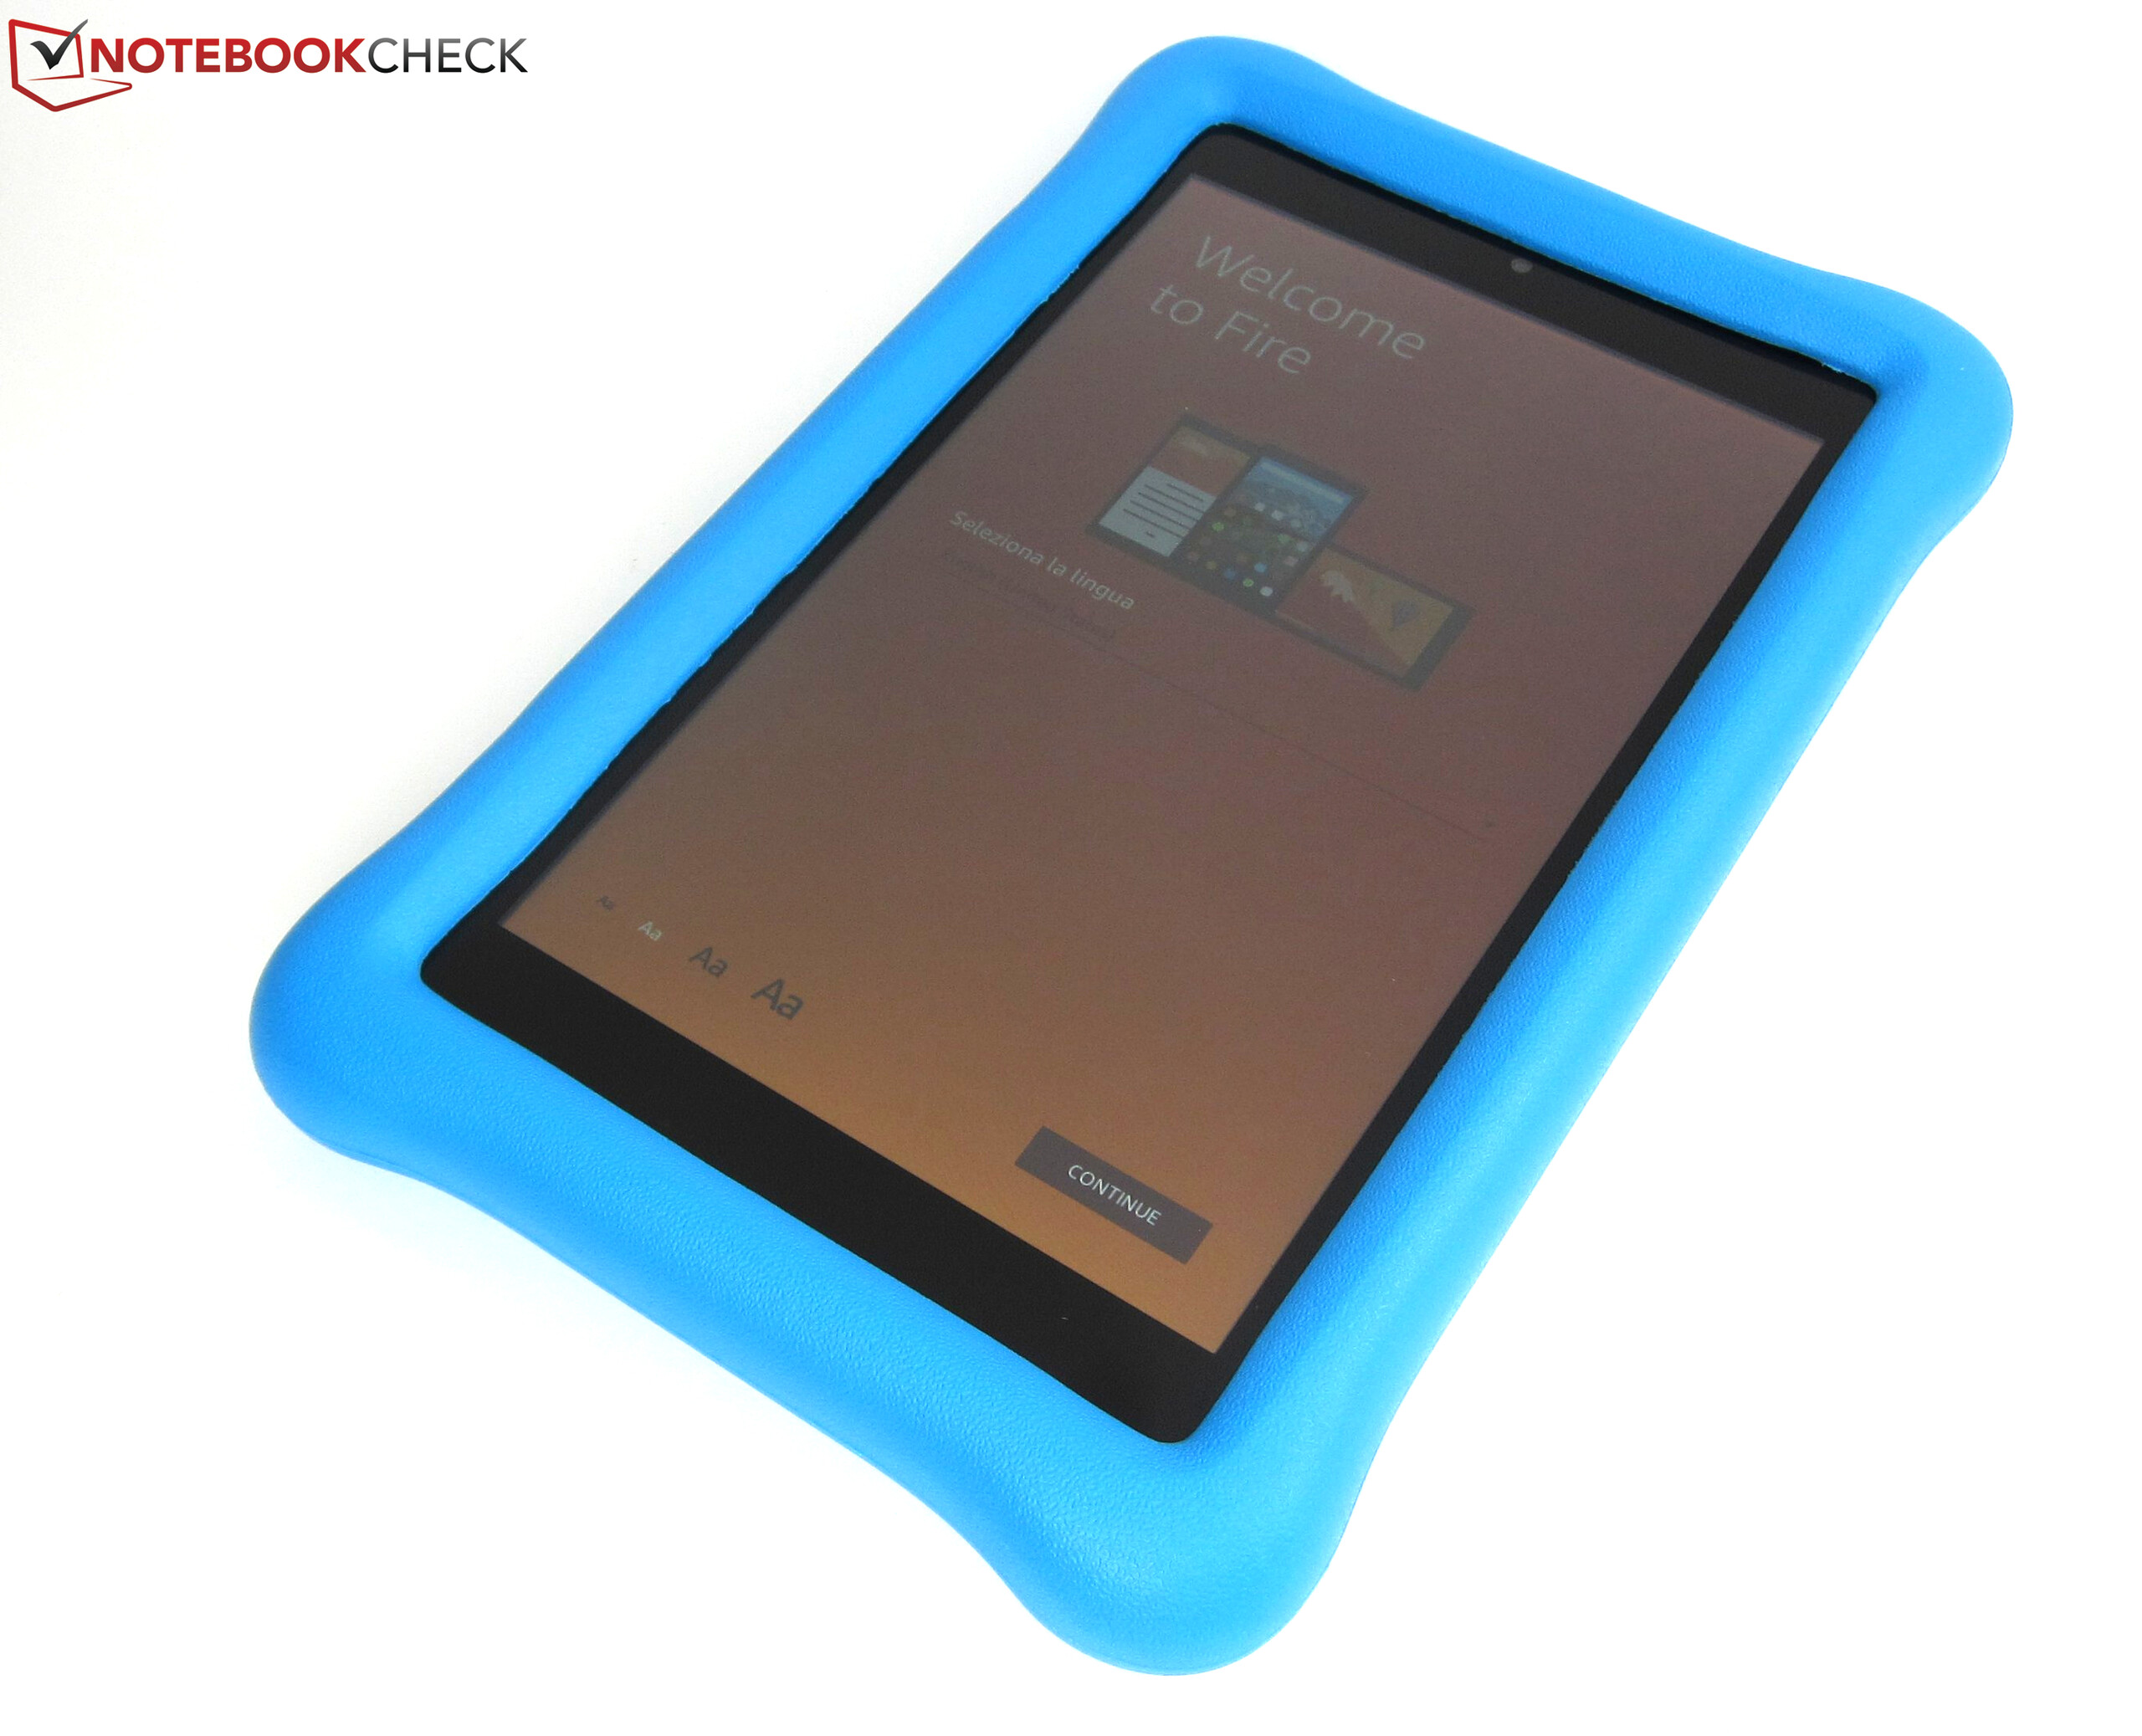
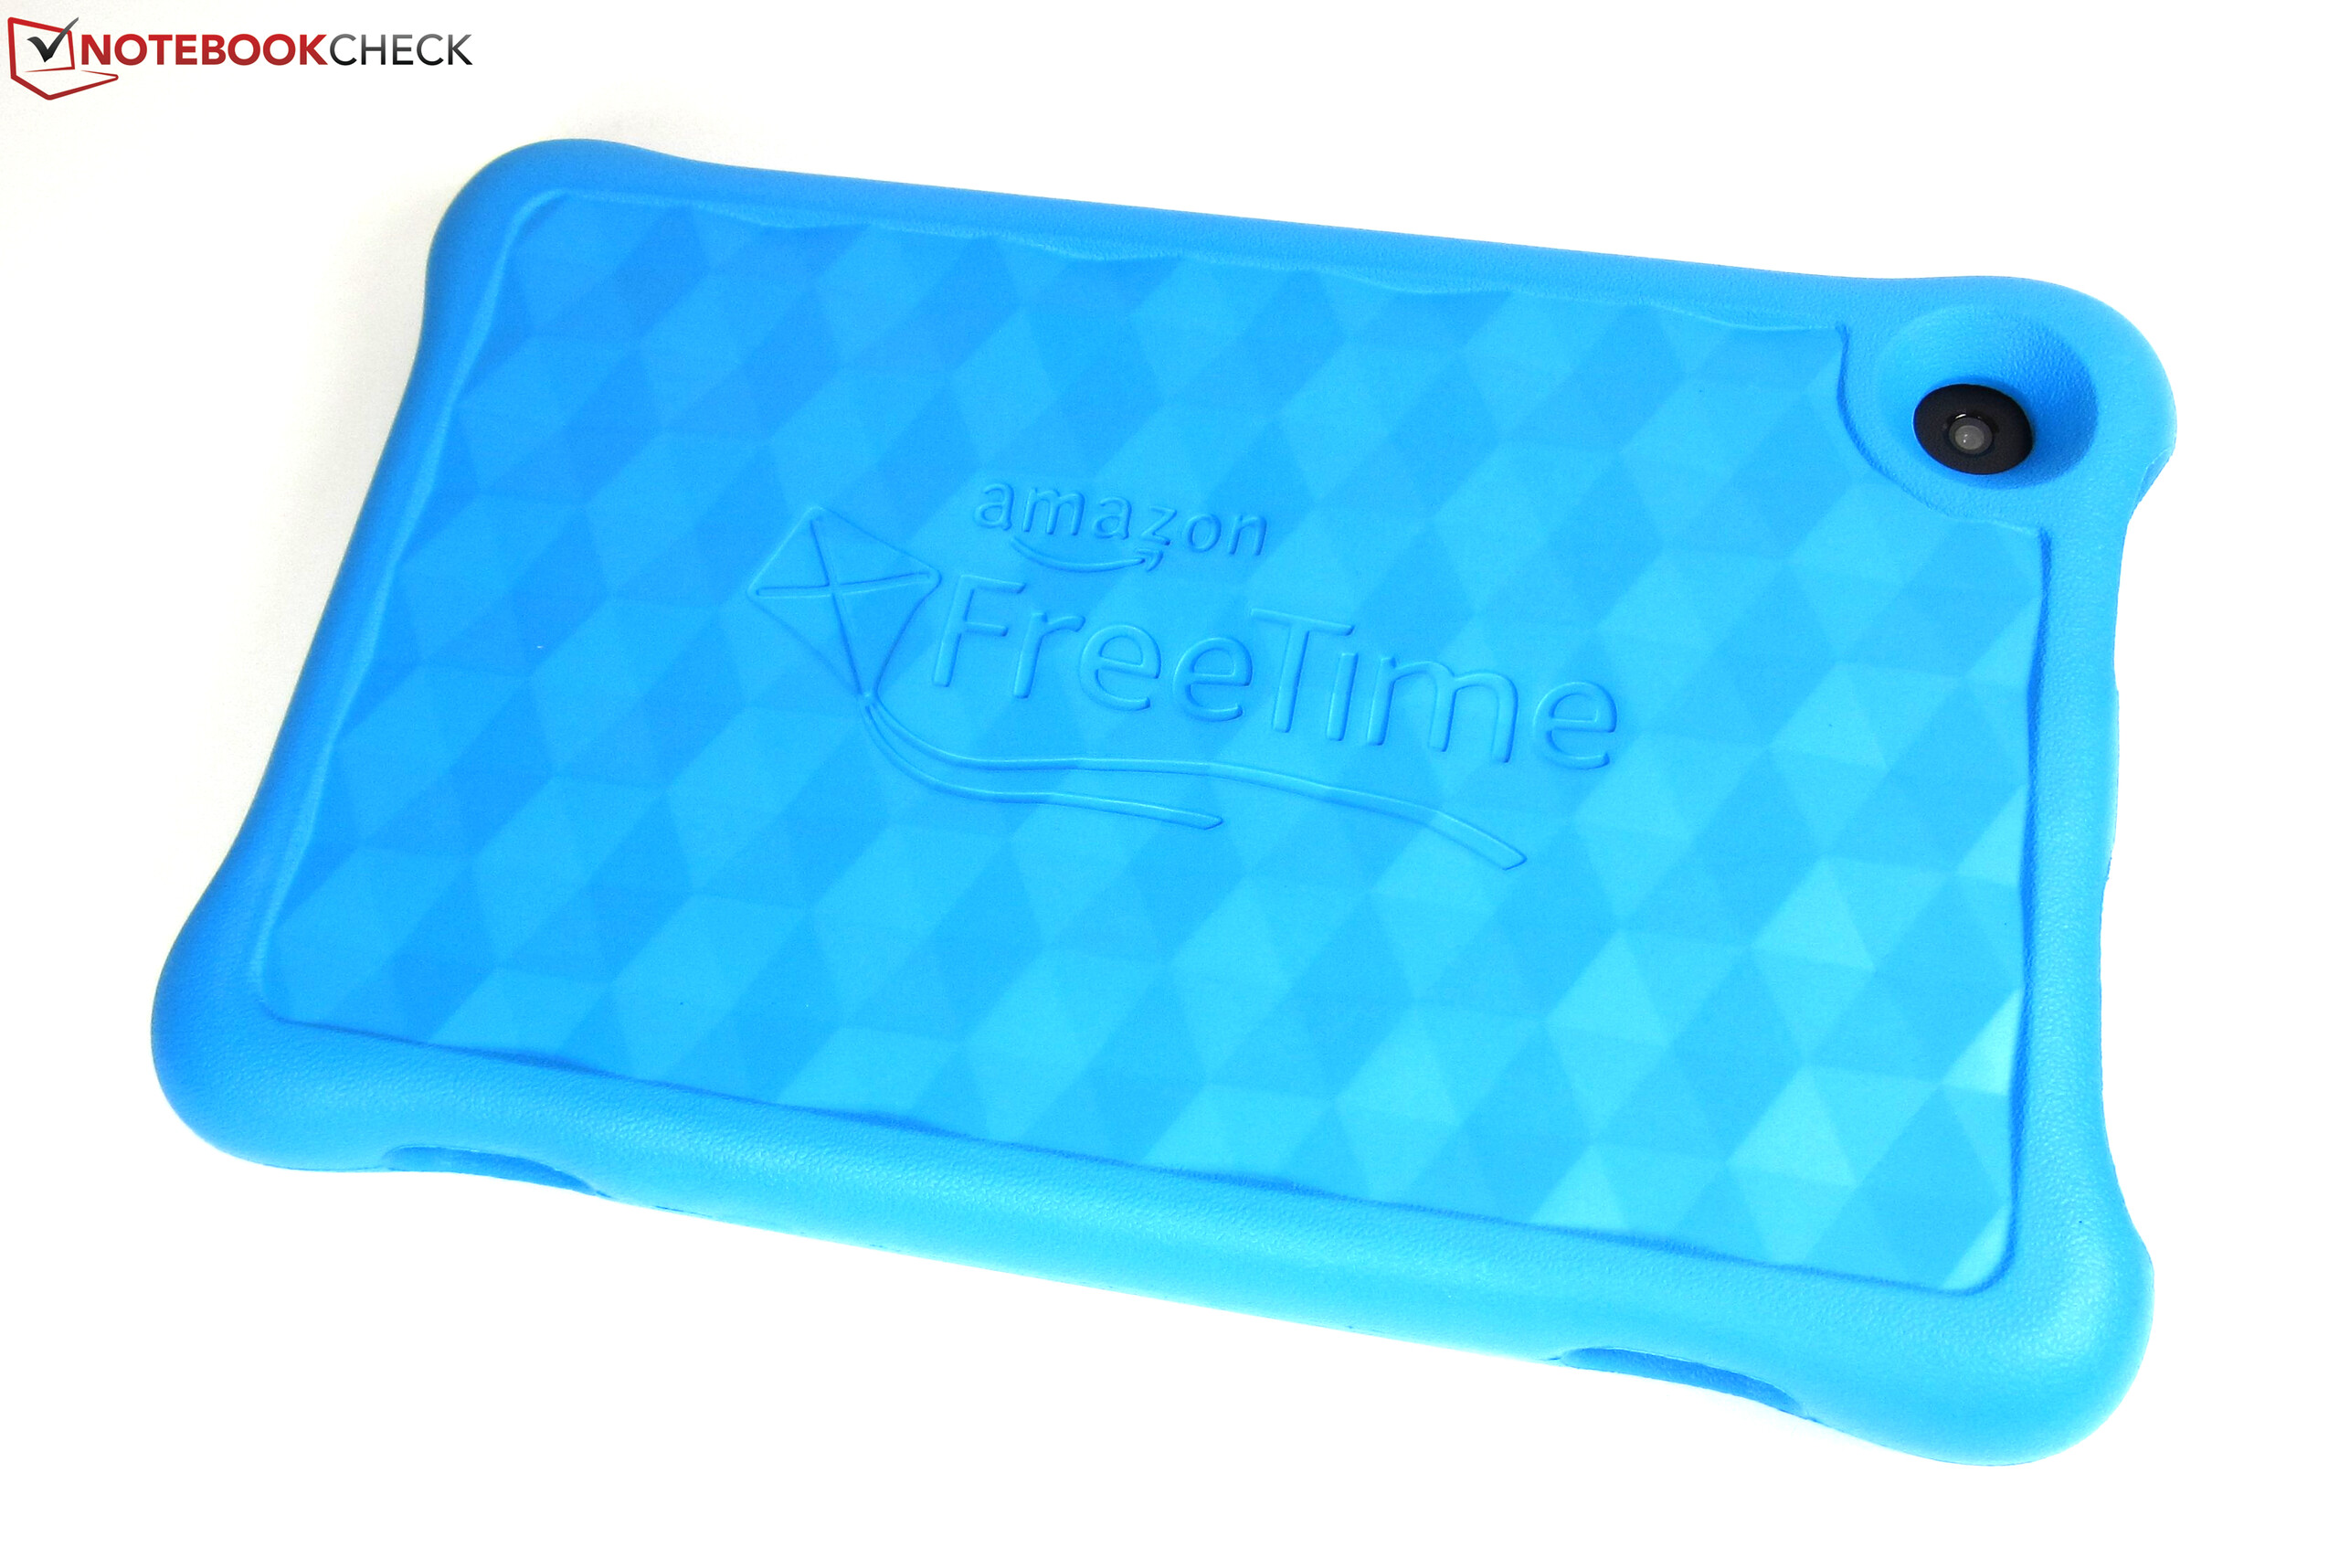
2018款亚马逊Fire HD 8是一款8英寸的平板电脑,它在性价比方面几乎没有对手。如果您正在寻找一款经济实惠的平板电脑来浏览网页,那么Fire HD 8绝对值得考虑。它的立体声扬声器非常不错,它的续航,整体做工质量和双频Wi-Fi也同样优秀。儿童版则具有非常坚固的保护壳,蓝色或粉红色颜色可选,以及适合儿童的内容。
“2018款Fire HD 8与其前身之间的差异几乎可以忽略不计。尽管如此,他们仍然非常受欢迎,并且考虑到相同的售价,新型号比2017款Fire HD 8更具有吸引力。”
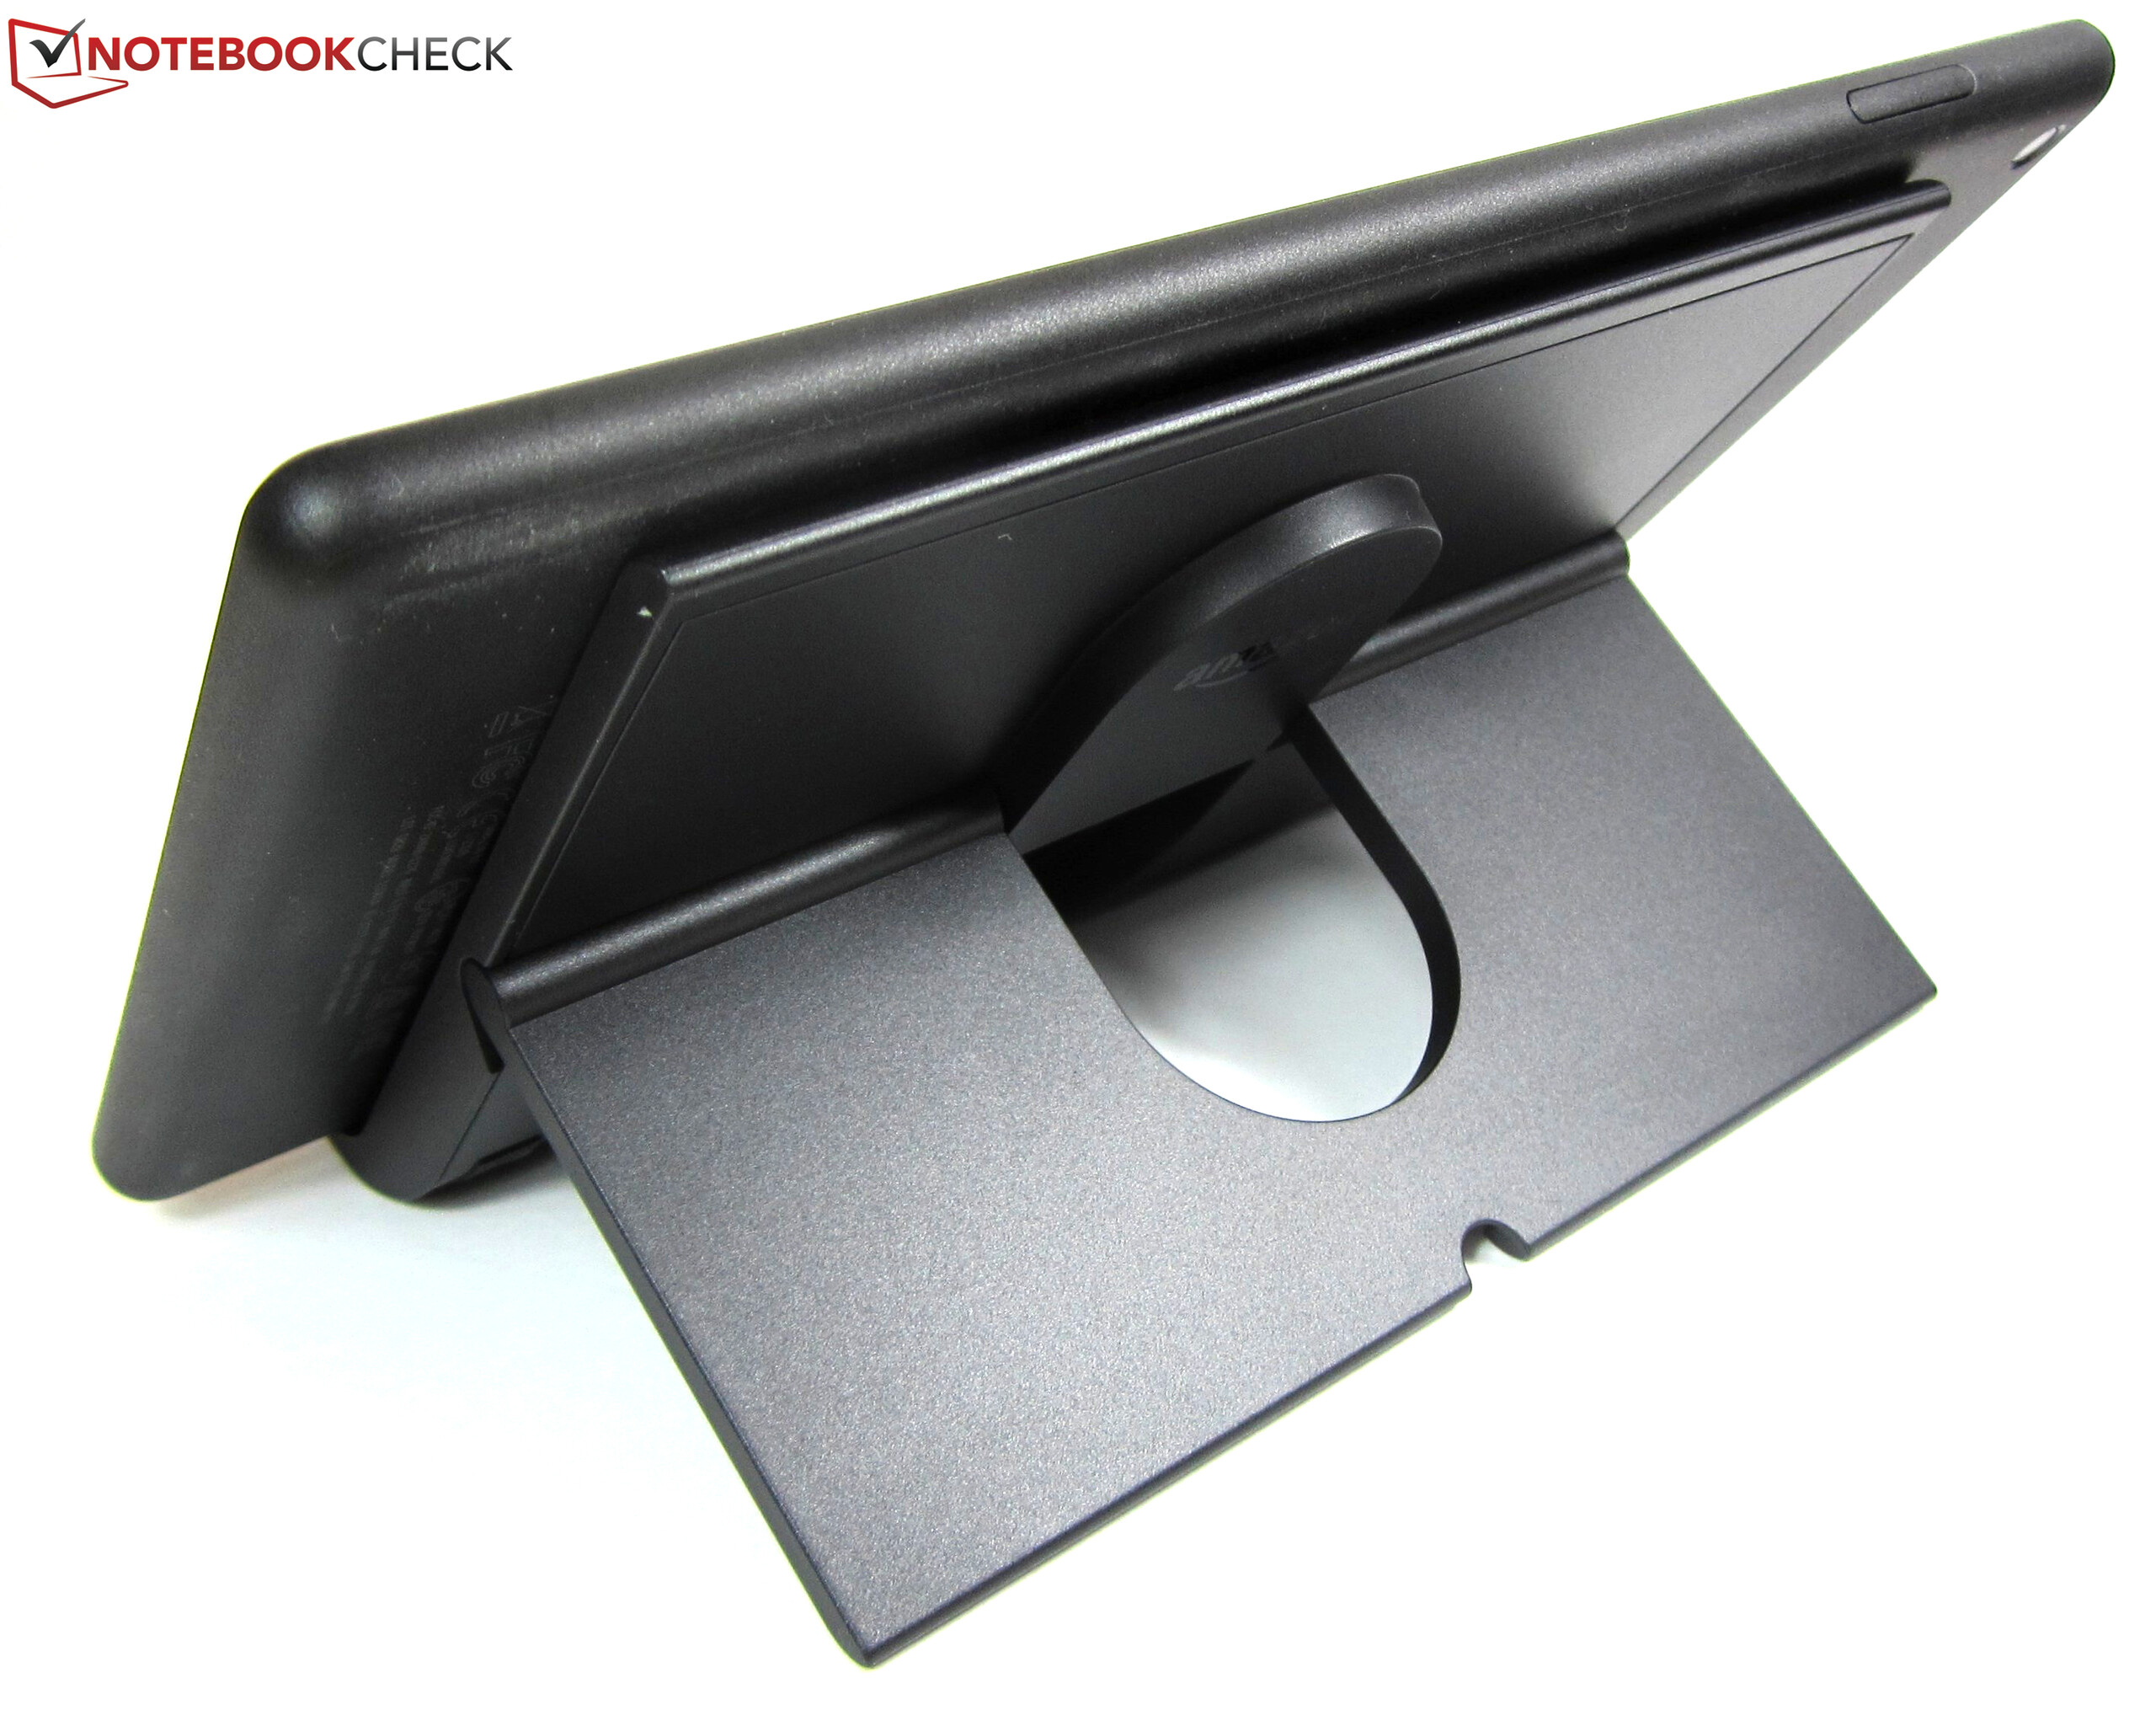
在与可选的显示模式扩展坞配对后,这台平板电脑以极低的价格提供了与亚马逊Echo Show相同的功能。在撰写本文时,第二代Echo Show售价超过200美元,而Fire HD 8 32 GB型号和Show Mode Dock捆绑包的售价仅为140美元。
尽管如此,HD 8还是有些缺点,例如慢得出奇的联发科MT8163四核SoC以及亮度极低的低分辨率(1280x800)显示屏。这款平板电脑还缺少GPS芯片,相机只能说能用,基于Android 7的Fire OS操作系统显然只适用于亚马逊的服务。Google的Play商店可以后续安装,但会使您的保修失效,这点需要注意。
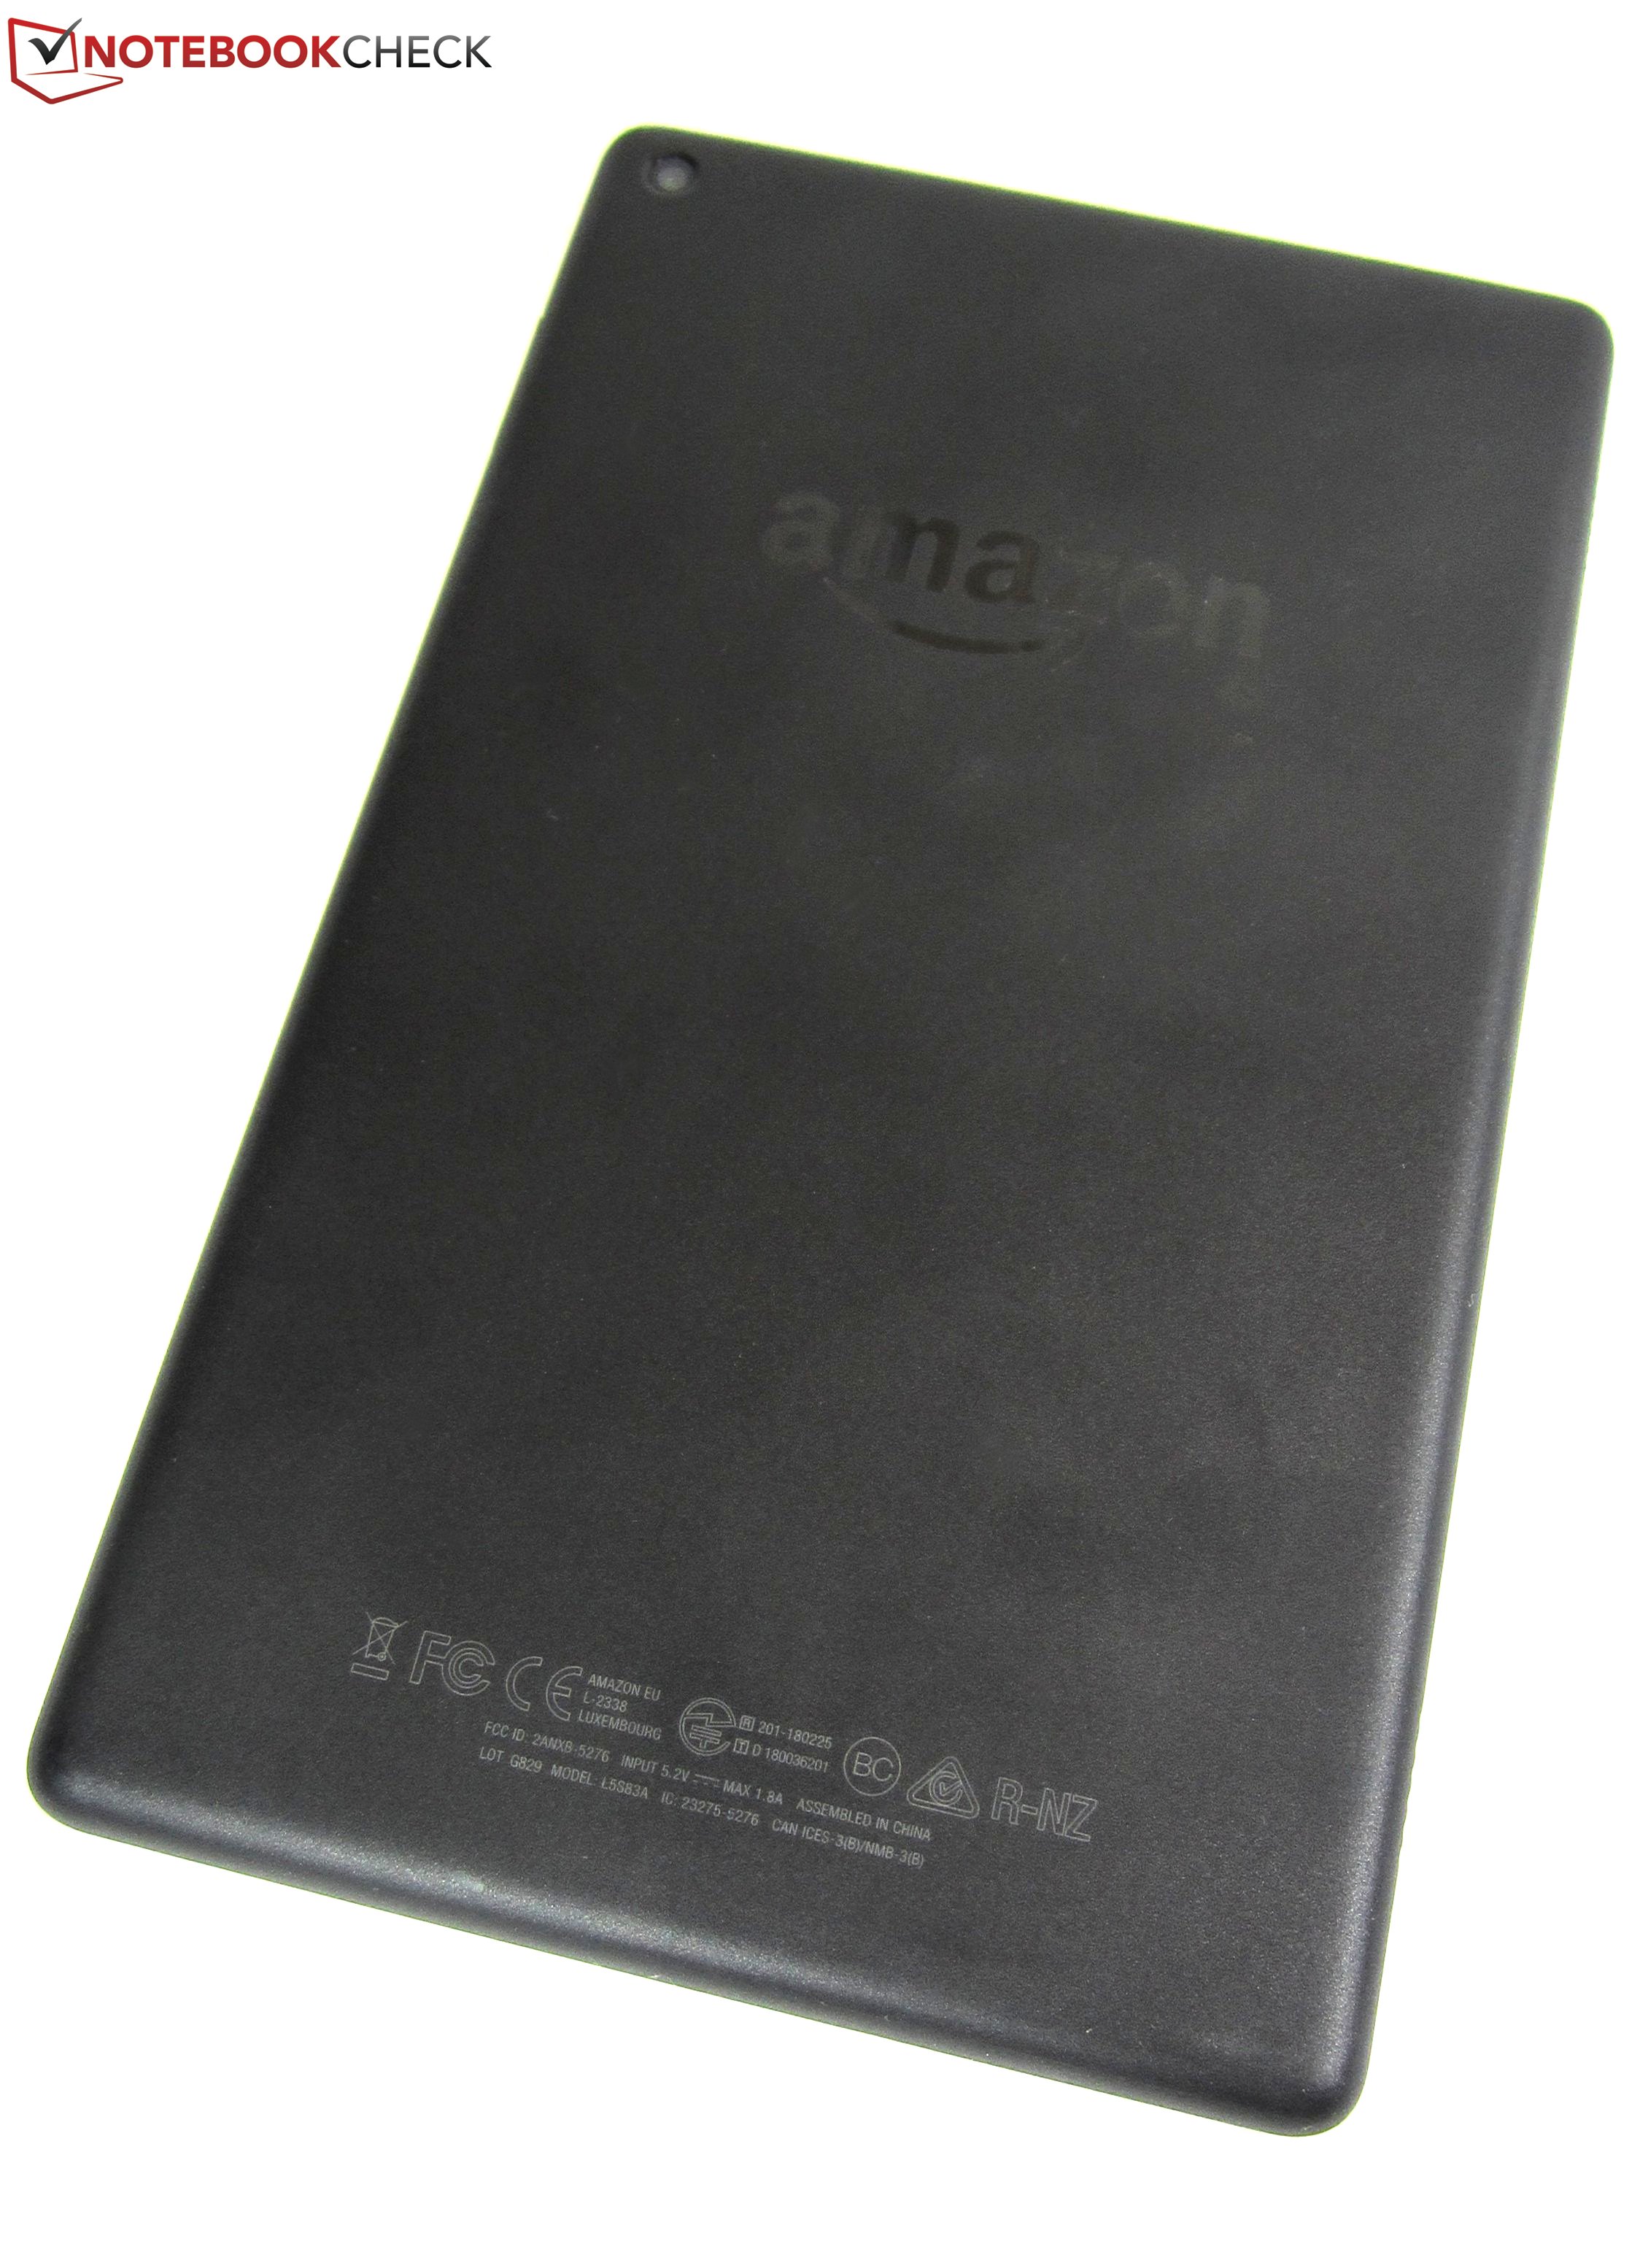
Amazon Fire HD 8 2018
- 11/05/2019 v7 (old)
Manuel Masiero
Price comparison

