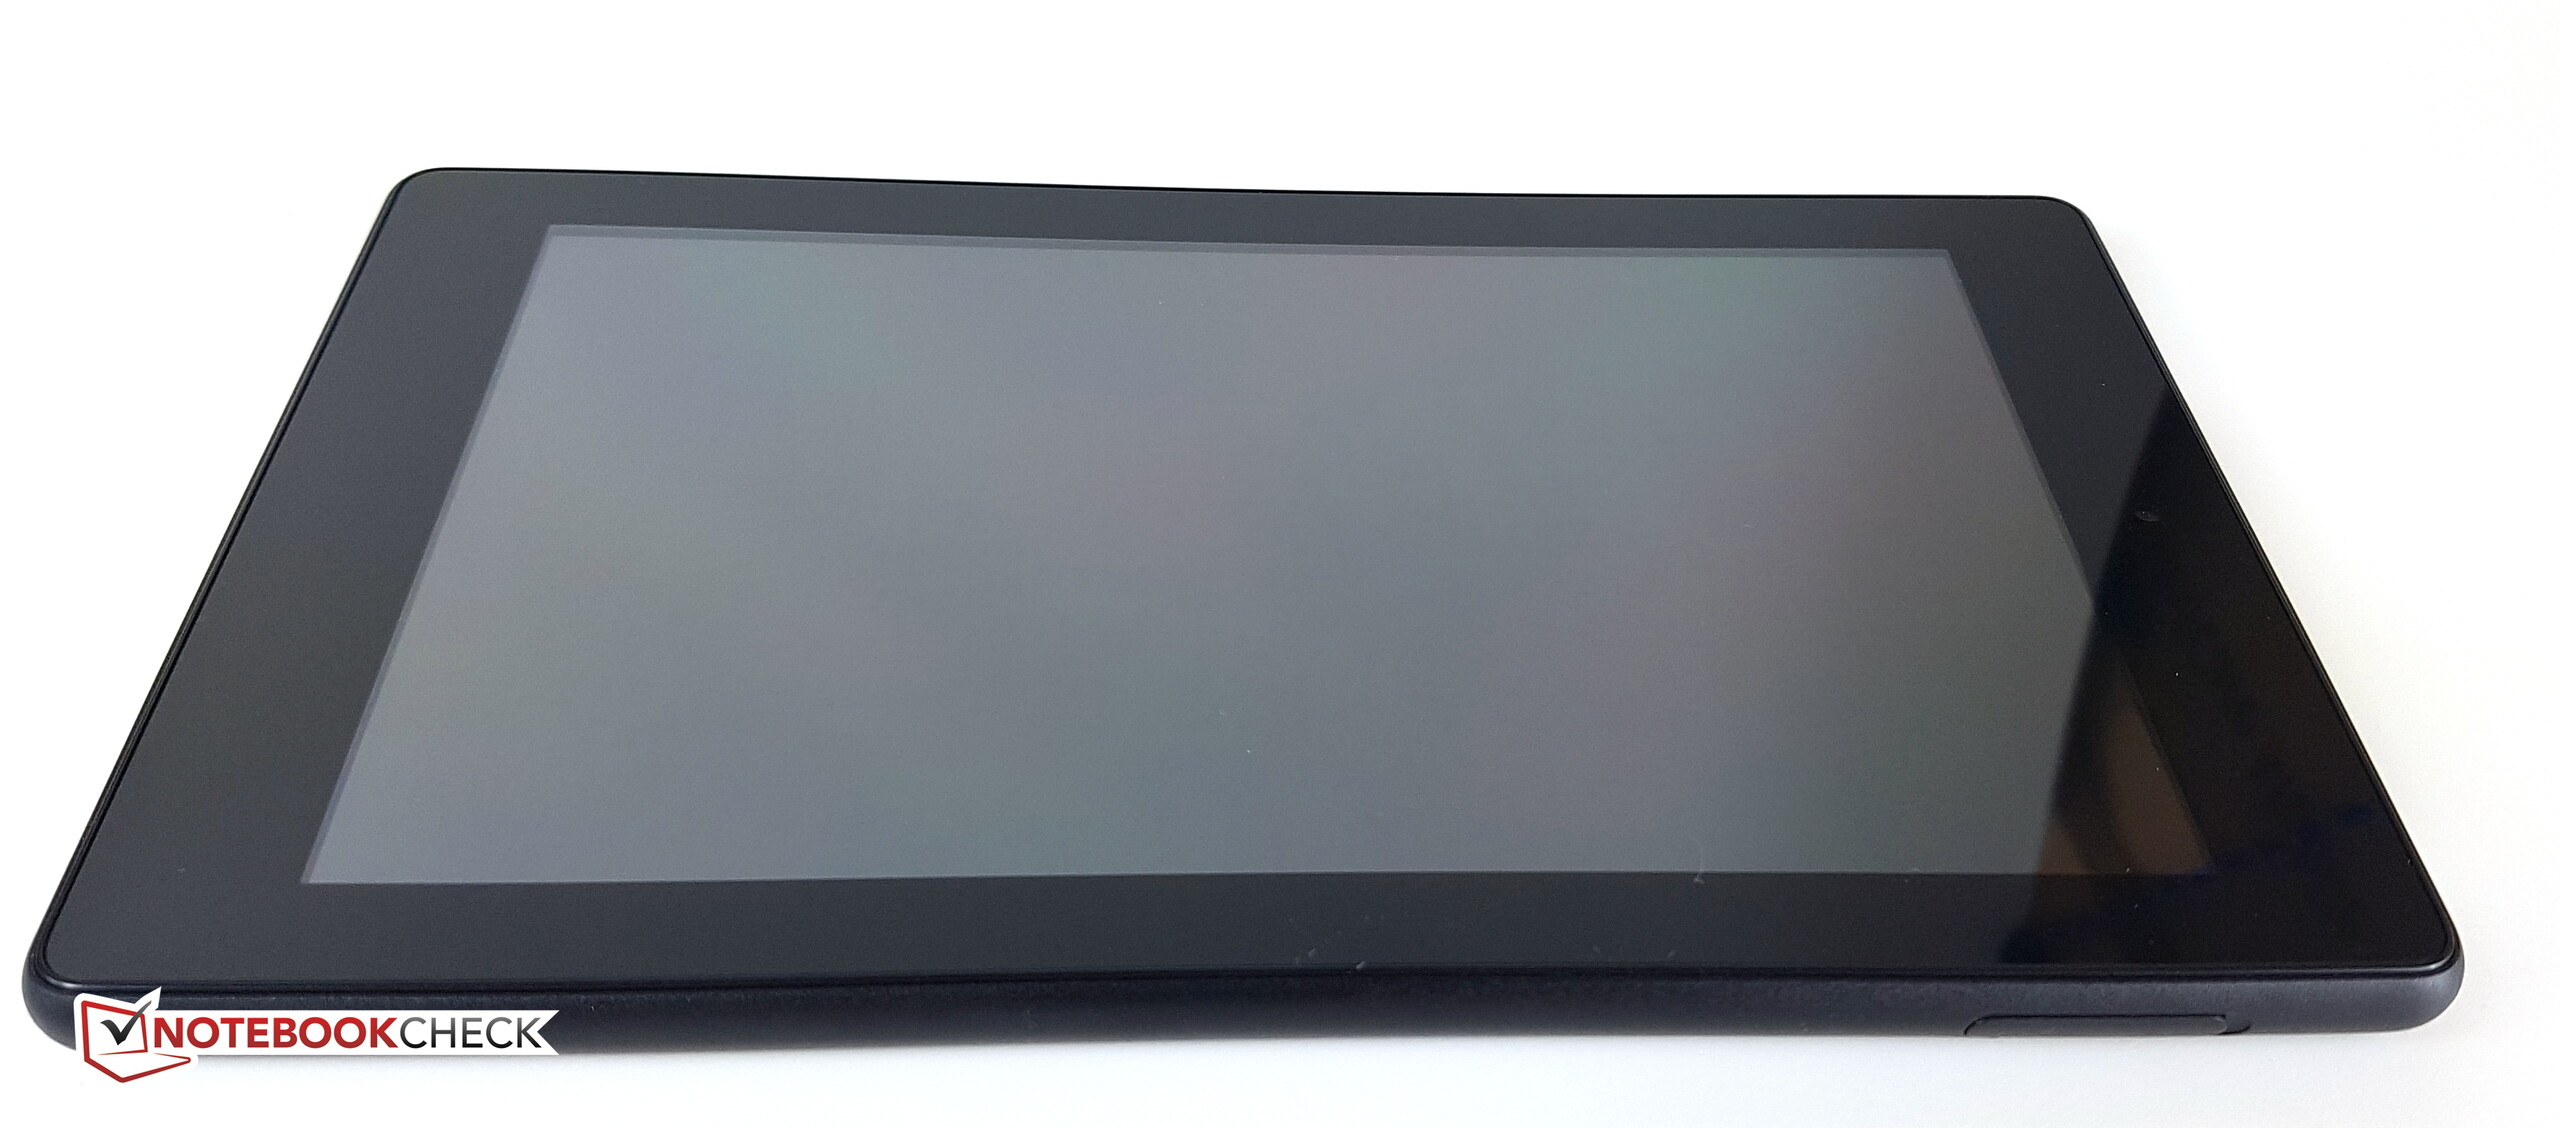
亚马逊 Fire 7 (2017) 平板电脑简短评测
| Networking | |
| iperf3 transmit AX12 | |
| Samsung Galaxy Tab S3 SM-T825 | |
| Amazon Fire 7 2017 | |
| Amazon Fire Tablet | |
| iperf3 receive AX12 | |
| Samsung Galaxy Tab S3 SM-T825 | |
| Amazon Fire 7 2017 | |
| Amazon Fire Tablet | |

| |||||||||||||||||||||||||
Brightness Distribution: 88 %
Center on Battery: 328 cd/m²
Contrast: 937:1 (Black: 0.35 cd/m²)
ΔE ColorChecker Calman: 4.6 | ∀{0.5-29.43 Ø4.71}
ΔE Greyscale Calman: 3.8 | ∀{0.09-98 Ø4.96}
Gamma: 2.25
CCT: 7338 K
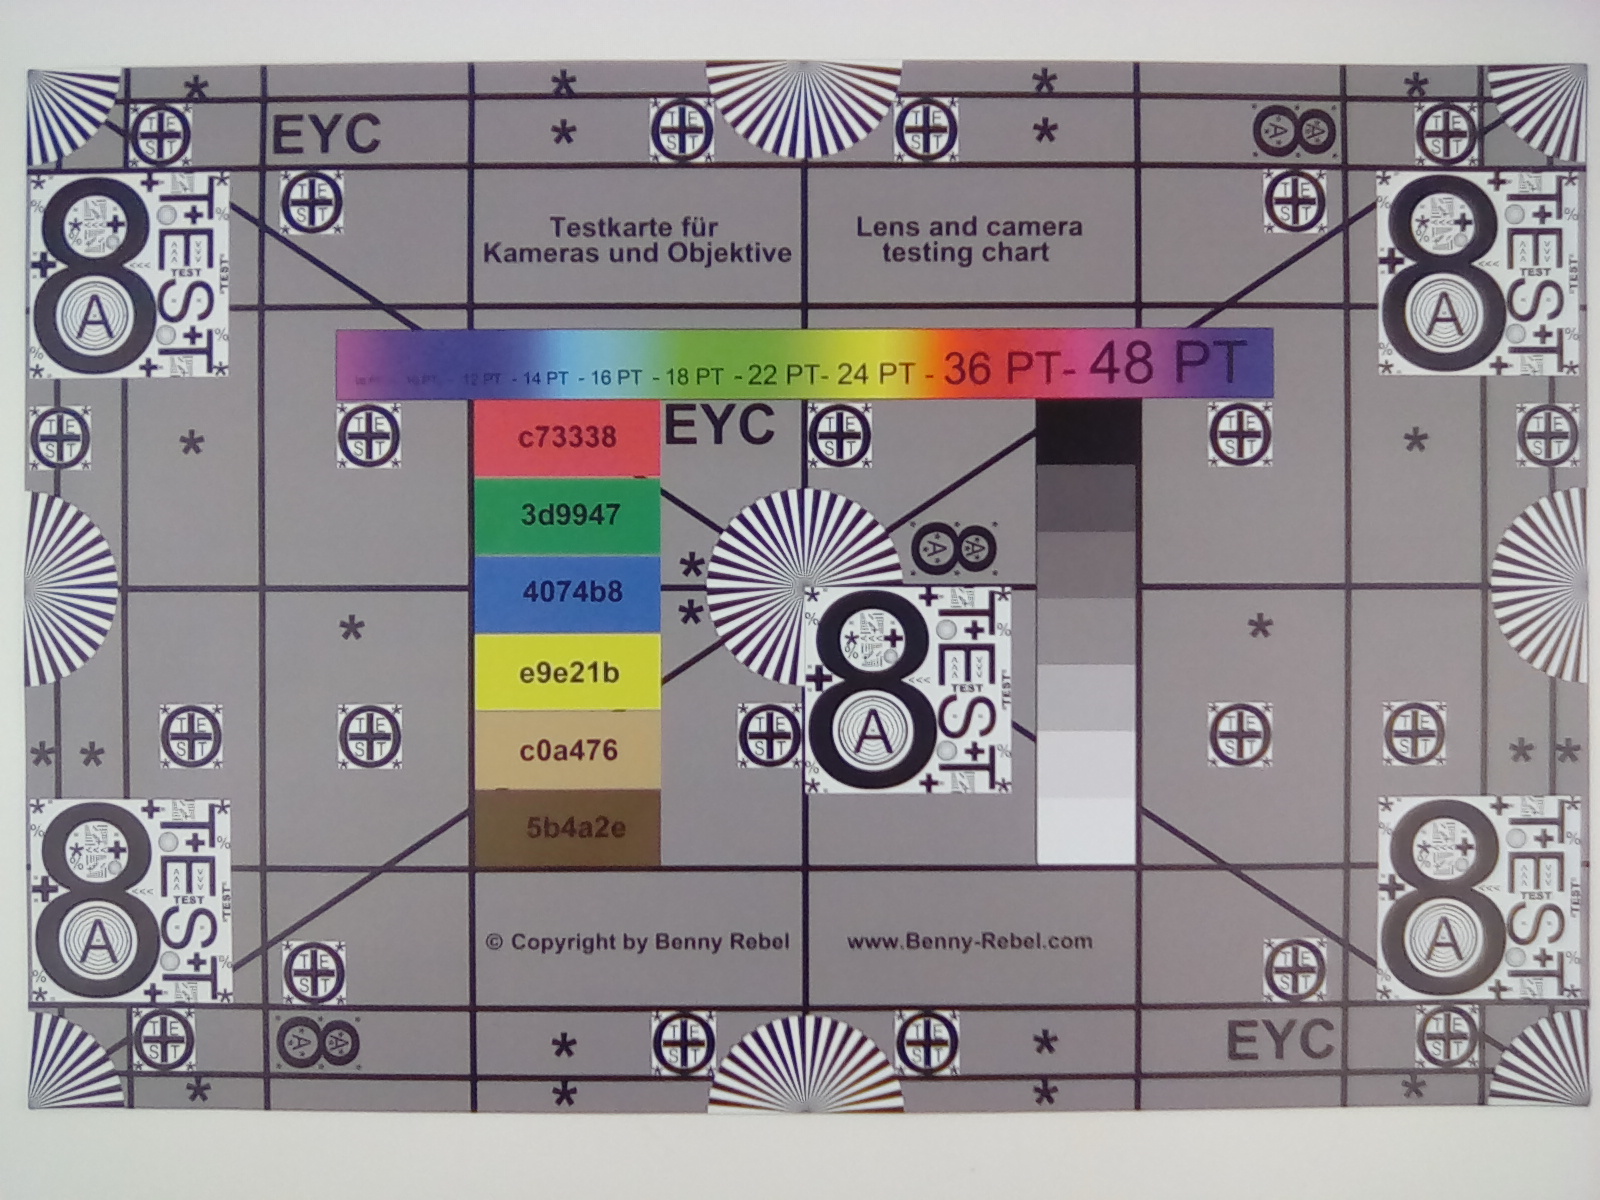
| Amazon Fire 7 2017 IPS, 1024x600, 7" | Amazon Fire Tablet IPS, 1024x600, 7" | Acer Iconia One 8 IPS, 1280x800, 8" | Samsung Galaxy Tab A7 2016 IPS, 1280x800, 7" | Xiaomi MiPad 2 IPS, 2048x1536, 7.9" | Samsung Galaxy Tab S3 SM-T825 Super AMOLED, 2048x1526, 9.7" | |
|---|---|---|---|---|---|---|
| Screen | -30% | 6% | -4% | 9% | 46% | |
| Brightness middle (cd/m²) | 328 | 323 -2% | 367 12% | 358 9% | 425 30% | 452 38% |
| Brightness (cd/m²) | 337 | 299 -11% | 338 0% | 344 2% | 402 19% | 468 39% |
| Brightness Distribution (%) | 88 | 83 -6% | 83 -6% | 92 5% | 91 3% | 82 -7% |
| Black Level * (cd/m²) | 0.35 | 0.38 -9% | 0.31 11% | 0.37 -6% | 0.4 -14% | |
| Contrast (:1) | 937 | 850 -9% | 1184 26% | 968 3% | 1063 13% | |
| Colorchecker dE 2000 * | 4.6 | 9.3 -102% | 4.1 11% | 5.3 -15% | 4.98 -8% | 1.8 61% |
| Colorchecker dE 2000 max. * | 18.6 | 17.6 5% | 20.2 -9% | 6.61 64% | 4 78% | |
| Greyscale dE 2000 * | 3.8 | 7.8 -105% | 4.38 -15% | 4.7 -24% | 5.2 -37% | 1.2 68% |
| Gamma | 2.25 98% | 1.99 111% | 2.33 94% | 2.44 90% | 2.65 83% | 2.11 104% |
| CCT | 7338 89% | 7736 84% | 6394 102% | 7222 90% | 7249 90% | 6500 100% |
| Color Space (Percent of AdobeRGB 1998) (%) | 82.32 | |||||
| Color Space (Percent of sRGB) (%) | 99.06 |
* ... smaller is better
Screen Flickering / PWM (Pulse-Width Modulation)
| Screen flickering / PWM detected | 12500 Hz | ≤ 17 % brightness setting | 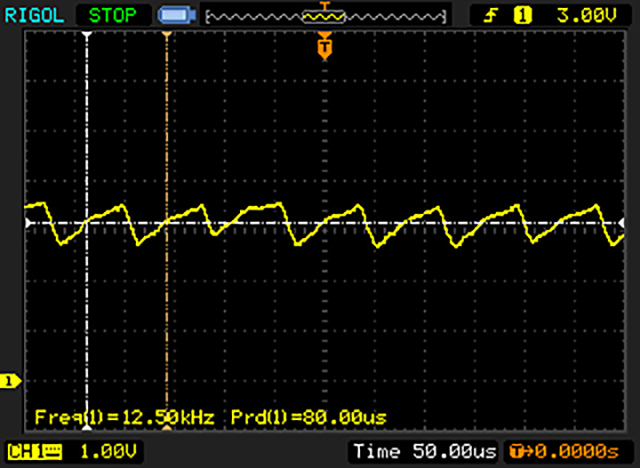 |
The display backlight flickers at 12500 Hz (worst case, e.g., utilizing PWM) Flickering detected at a brightness setting of 17 % and below. There should be no flickering or PWM above this brightness setting. The frequency of 12500 Hz is quite high, so most users sensitive to PWM should not notice any flickering. In comparison: 52 % of all tested devices do not use PWM to dim the display. If PWM was detected, an average of 7754 (minimum: 5 - maximum: 343500) Hz was measured. | |||
Display Response Times
| ↔ Response Time Black to White | ||
|---|---|---|
| 28.4 ms ... rise ↗ and fall ↘ combined | ↗ 16 ms rise | 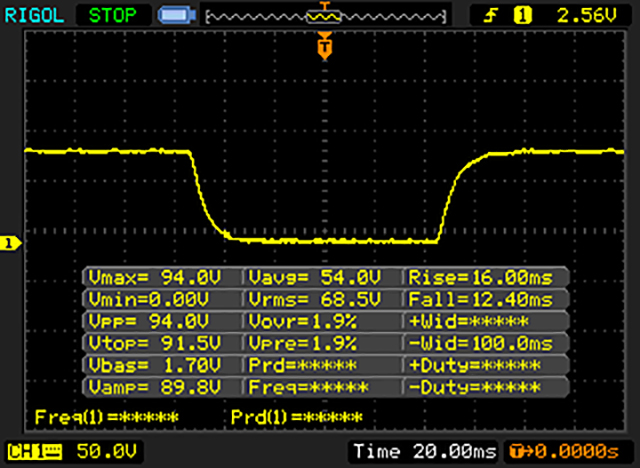 |
| ↘ 12.4 ms fall | ||
| The screen shows relatively slow response rates in our tests and may be too slow for gamers. In comparison, all tested devices range from 0.1 (minimum) to 240 (maximum) ms. » 75 % of all devices are better. This means that the measured response time is worse than the average of all tested devices (19.8 ms). | ||
| ↔ Response Time 50% Grey to 80% Grey | ||
| 39.2 ms ... rise ↗ and fall ↘ combined | ↗ 20.4 ms rise | 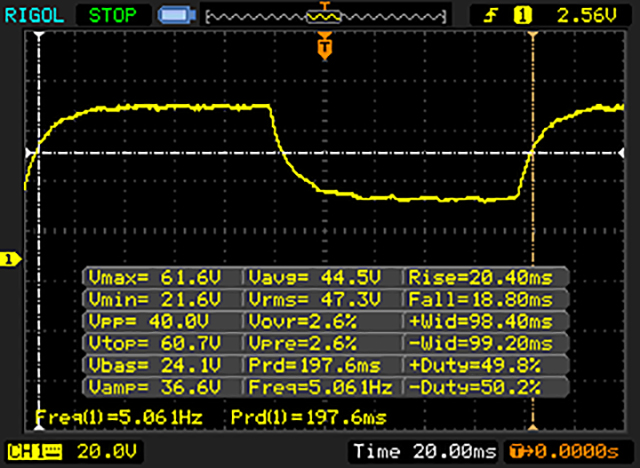 |
| ↘ 18.8 ms fall | ||
| The screen shows slow response rates in our tests and will be unsatisfactory for gamers. In comparison, all tested devices range from 0.165 (minimum) to 636 (maximum) ms. » 60 % of all devices are better. This means that the measured response time is worse than the average of all tested devices (31 ms). | ||
| AnTuTu v6 - Total Score | |
| Samsung Galaxy Tab S3 SM-T825 | |
| Xiaomi MiPad 2 | |
| Amazon Fire 7 2017 | |
| Amazon Fire Tablet | |
| Samsung Galaxy Tab A7 2016 | |
| PCMark for Android | |
| Work performance score | |
| Samsung Galaxy Tab S3 SM-T825 | |
| Xiaomi MiPad 2 | |
| Acer Iconia One 8 | |
| Amazon Fire 7 2017 | |
| Amazon Fire Tablet | |
| Samsung Galaxy Tab A7 2016 | |
| Work 2.0 performance score | |
| Samsung Galaxy Tab S3 SM-T825 | |
| Amazon Fire 7 2017 | |
| Geekbench 4.4 | |
| 64 Bit Single-Core Score | |
| Samsung Galaxy Tab S3 SM-T825 | |
| Amazon Fire 7 2017 | |
| 64 Bit Multi-Core Score | |
| Samsung Galaxy Tab S3 SM-T825 | |
| Amazon Fire 7 2017 | |
| Compute RenderScript Score | |
| Samsung Galaxy Tab S3 SM-T825 | |
| GFXBench (DX / GLBenchmark) 2.7 | |
| T-Rex Onscreen | |
| Samsung Galaxy Tab S3 SM-T825 | |
| Acer Iconia One 8 | |
| Amazon Fire Tablet | |
| Xiaomi MiPad 2 | |
| Amazon Fire 7 2017 | |
| Samsung Galaxy Tab A7 2016 | |
| 1920x1080 T-Rex Offscreen | |
| Samsung Galaxy Tab S3 SM-T825 | |
| Xiaomi MiPad 2 | |
| Amazon Fire Tablet | |
| Amazon Fire 7 2017 | |
| Acer Iconia One 8 | |
| Samsung Galaxy Tab A7 2016 | |
| Octane V2 - Total Score | |
| Samsung Galaxy Tab S3 SM-T825 | |
| Xiaomi MiPad 2 | |
| Acer Iconia One 8 | |
| Amazon Fire Tablet | |
| Samsung Galaxy Tab A7 2016 | |
| Amazon Fire 7 2017 | |
| WebXPRT 2015 - Overall | |
| Samsung Galaxy Tab S3 SM-T825 | |
| Acer Iconia One 8 | |
| Samsung Galaxy Tab A7 2016 | |
| Amazon Fire 7 2017 | |
| JetStream 1.1 - 1.1 Total | |
| Xiaomi MiPad 2 | |
| Samsung Galaxy Tab S3 SM-T825 | |
| Samsung Galaxy Tab A7 2016 | |
| Amazon Fire Tablet | |
| Amazon Fire 7 2017 | |
| Mozilla Kraken 1.1 - Total | |
| Amazon Fire 7 2017 | |
| Samsung Galaxy Tab A7 2016 | |
| Amazon Fire Tablet | |
| Acer Iconia One 8 | |
| Xiaomi MiPad 2 | |
| Samsung Galaxy Tab S3 SM-T825 | |
* ... smaller is better
| Amazon Fire 7 2017 | Amazon Fire Tablet | Acer Iconia One 8 | Samsung Galaxy Tab A7 2016 | Xiaomi MiPad 2 | Samsung Galaxy Tab S3 SM-T825 | |
|---|---|---|---|---|---|---|
| AndroBench 3-5 | 22% | -12% | -14% | 60% | 120% | |
| Sequential Read 256KB (MB/s) | 113.7 | 147 29% | 126 11% | 65.9 -42% | 147.9 30% | 288.6 154% |
| Sequential Write 256KB (MB/s) | 34.1 | 37 9% | 40 17% | 28.95 -15% | 56.4 65% | 87.6 157% |
| Random Read 4KB (MB/s) | 21.97 | 22 0% | 17 -23% | 21.95 0% | 24.42 11% | 45.82 109% |
| Random Write 4KB (MB/s) | 6.03 | 11 82% | 2.9 -52% | 9.55 58% | 13.96 132% | 13.13 118% |
| Sequential Read 256KB SDCard (MB/s) | 45.54 | 49.4 8% | 21.41 -53% | 76.4 68% | ||
| Sequential Write 256KB SDCard (MB/s) | 27.74 | 29.19 5% | 18.4 -34% | 58.6 111% |
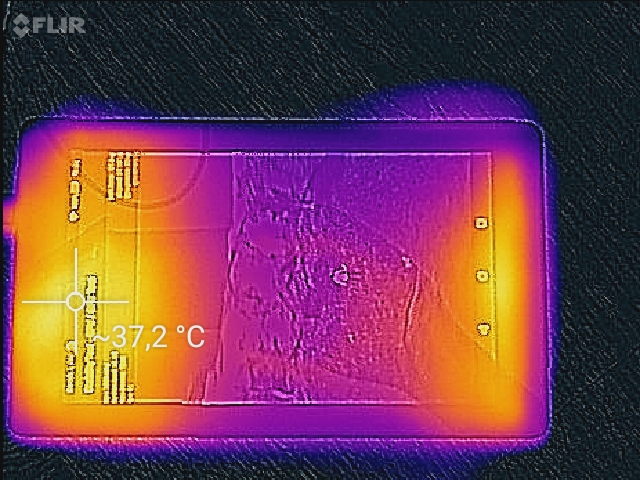
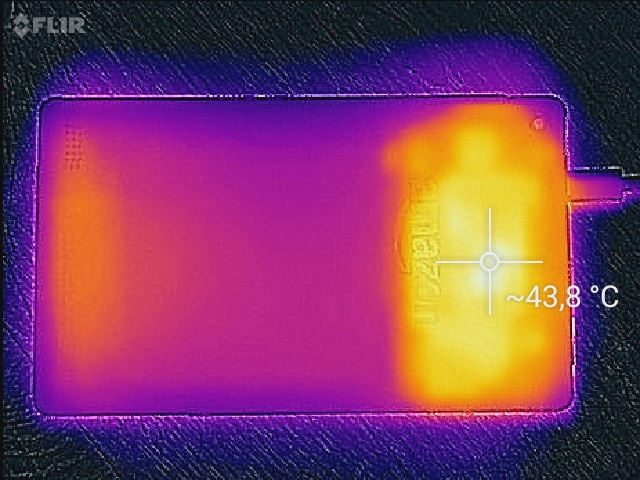
(+) The maximum temperature on the upper side is 39.3 °C / 103 F, compared to the average of 33.7 °C / 93 F, ranging from 20.7 to 53.2 °C for the class Tablet.
(±) The bottom heats up to a maximum of 43.3 °C / 110 F, compared to the average of 33.2 °C / 92 F
(+) In idle usage, the average temperature for the upper side is 30.6 °C / 87 F, compared to the device average of 30 °C / 86 F.
Amazon Fire 7 2017 audio analysis
(±) | speaker loudness is average but good (80 dB)
Bass 100 - 315 Hz
(-) | nearly no bass - on average 24.7% lower than median
(±) | linearity of bass is average (12.1% delta to prev. frequency)
Mids 400 - 2000 Hz
(±) | higher mids - on average 8.1% higher than median
(±) | linearity of mids is average (9.3% delta to prev. frequency)
Highs 2 - 16 kHz
(±) | higher highs - on average 5.7% higher than median
(+) | highs are linear (4.5% delta to prev. frequency)
Overall 100 - 16.000 Hz
(±) | linearity of overall sound is average (27.3% difference to median)
Compared to same class
» 84% of all tested devices in this class were better, 4% similar, 11% worse
» The best had a delta of 7%, average was 20%, worst was 129%
Compared to all devices tested
» 83% of all tested devices were better, 4% similar, 13% worse
» The best had a delta of 4%, average was 23%, worst was 134%
Samsung Galaxy Tab A7 2016 audio analysis
(+) | speakers can play relatively loud (87.8 dB)
Bass 100 - 315 Hz
(-) | nearly no bass - on average 35.9% lower than median
(±) | linearity of bass is average (10.6% delta to prev. frequency)
Mids 400 - 2000 Hz
(+) | balanced mids - only 4.6% away from median
(+) | mids are linear (5.2% delta to prev. frequency)
Highs 2 - 16 kHz
(+) | balanced highs - only 3.9% away from median
(+) | highs are linear (6.4% delta to prev. frequency)
Overall 100 - 16.000 Hz
(±) | linearity of overall sound is average (23.9% difference to median)
Compared to same class
» 75% of all tested devices in this class were better, 6% similar, 19% worse
» The best had a delta of 7%, average was 20%, worst was 129%
Compared to all devices tested
» 72% of all tested devices were better, 6% similar, 22% worse
» The best had a delta of 4%, average was 23%, worst was 134%
Xiaomi MiPad 2 audio analysis
(+) | speakers can play relatively loud (95.1 dB)
Bass 100 - 315 Hz
(-) | nearly no bass - on average 26.3% lower than median
(+) | bass is linear (5.4% delta to prev. frequency)
Mids 400 - 2000 Hz
(±) | reduced mids - on average 5% lower than median
(+) | mids are linear (4.2% delta to prev. frequency)
Highs 2 - 16 kHz
(+) | balanced highs - only 3.9% away from median
(+) | highs are linear (1.8% delta to prev. frequency)
Overall 100 - 16.000 Hz
(±) | linearity of overall sound is average (17.9% difference to median)
Compared to same class
» 45% of all tested devices in this class were better, 6% similar, 48% worse
» The best had a delta of 7%, average was 20%, worst was 129%
Compared to all devices tested
» 37% of all tested devices were better, 8% similar, 55% worse
» The best had a delta of 4%, average was 23%, worst was 134%
| Off / Standby | |
| Idle | |
| Load |
|
Key:
min: | |
| Amazon Fire 7 2017 2980 mAh | Amazon Fire Tablet 2980 mAh | Acer Iconia One 8 mAh | Samsung Galaxy Tab A7 2016 4000 mAh | Xiaomi MiPad 2 6190 mAh | |
|---|---|---|---|---|---|
| Power Consumption | -13% | -16% | -35% | -124% | |
| Idle Minimum * (Watt) | 0.97 | 1.12 -15% | 0.8 18% | 1.91 -97% | 3.33 -243% |
| Idle Average * (Watt) | 2.68 | 3.06 -14% | 3.1 -16% | 3.59 -34% | 5.01 -87% |
| Idle Maximum * (Watt) | 2.69 | 3.31 -23% | 3.3 -23% | 4.06 -51% | 5.19 -93% |
| Load Average * (Watt) | 4.26 | 4.44 -4% | 5.1 -20% | 4.29 -1% | 8.32 -95% |
| Load Maximum * (Watt) | 4.64 | 5.09 -10% | 6.5 -40% | 4.31 7% | 9.33 -101% |
* ... smaller is better
| Amazon Fire 7 2017 2980 mAh | Amazon Fire Tablet 2980 mAh | Acer Iconia One 8 mAh | Samsung Galaxy Tab A7 2016 4000 mAh | Xiaomi MiPad 2 6190 mAh | |
|---|---|---|---|---|---|
| Battery runtime | -17% | 31% | 36% | -19% | |
| Reader / Idle (h) | 15.7 | 21 34% | 22.6 44% | ||
| H.264 (h) | 8.5 | 13.3 56% | 8.6 1% | ||
| WiFi v1.3 (h) | 8.6 | 7.1 -17% | 12.4 44% | 10.3 20% | 7 -19% |
| Load (h) | 3.5 | 3.1 -11% | 6.3 80% |
Pros
Cons
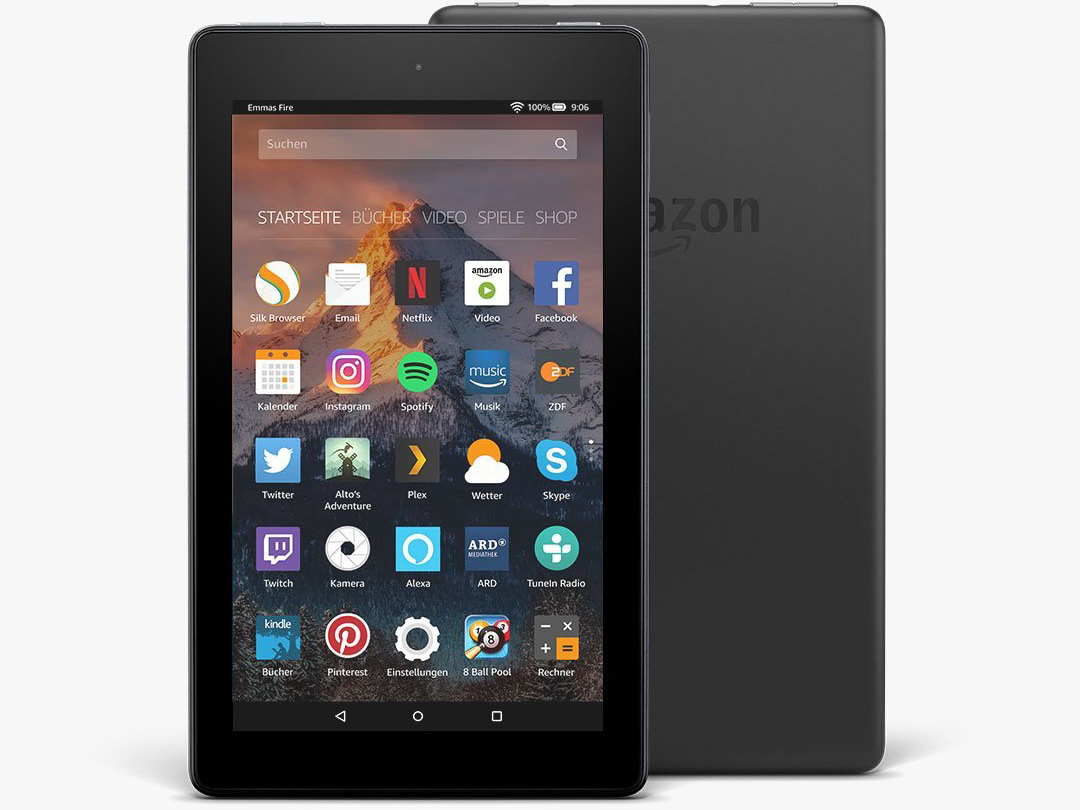
考虑到仅仅49美元的低售价,Fire 7 (2017)可以算是一台超值的全面产品。我们希望它能够得到更大程度上的更新,不过遗憾的是,它依然搭配的是迟缓的处理器和闪存、低分辨率屏幕和仅1GB的内存。因此,尽管它的电池续航和色彩准确度有所改进,但这台平板电脑的整体性能仍然较弱。
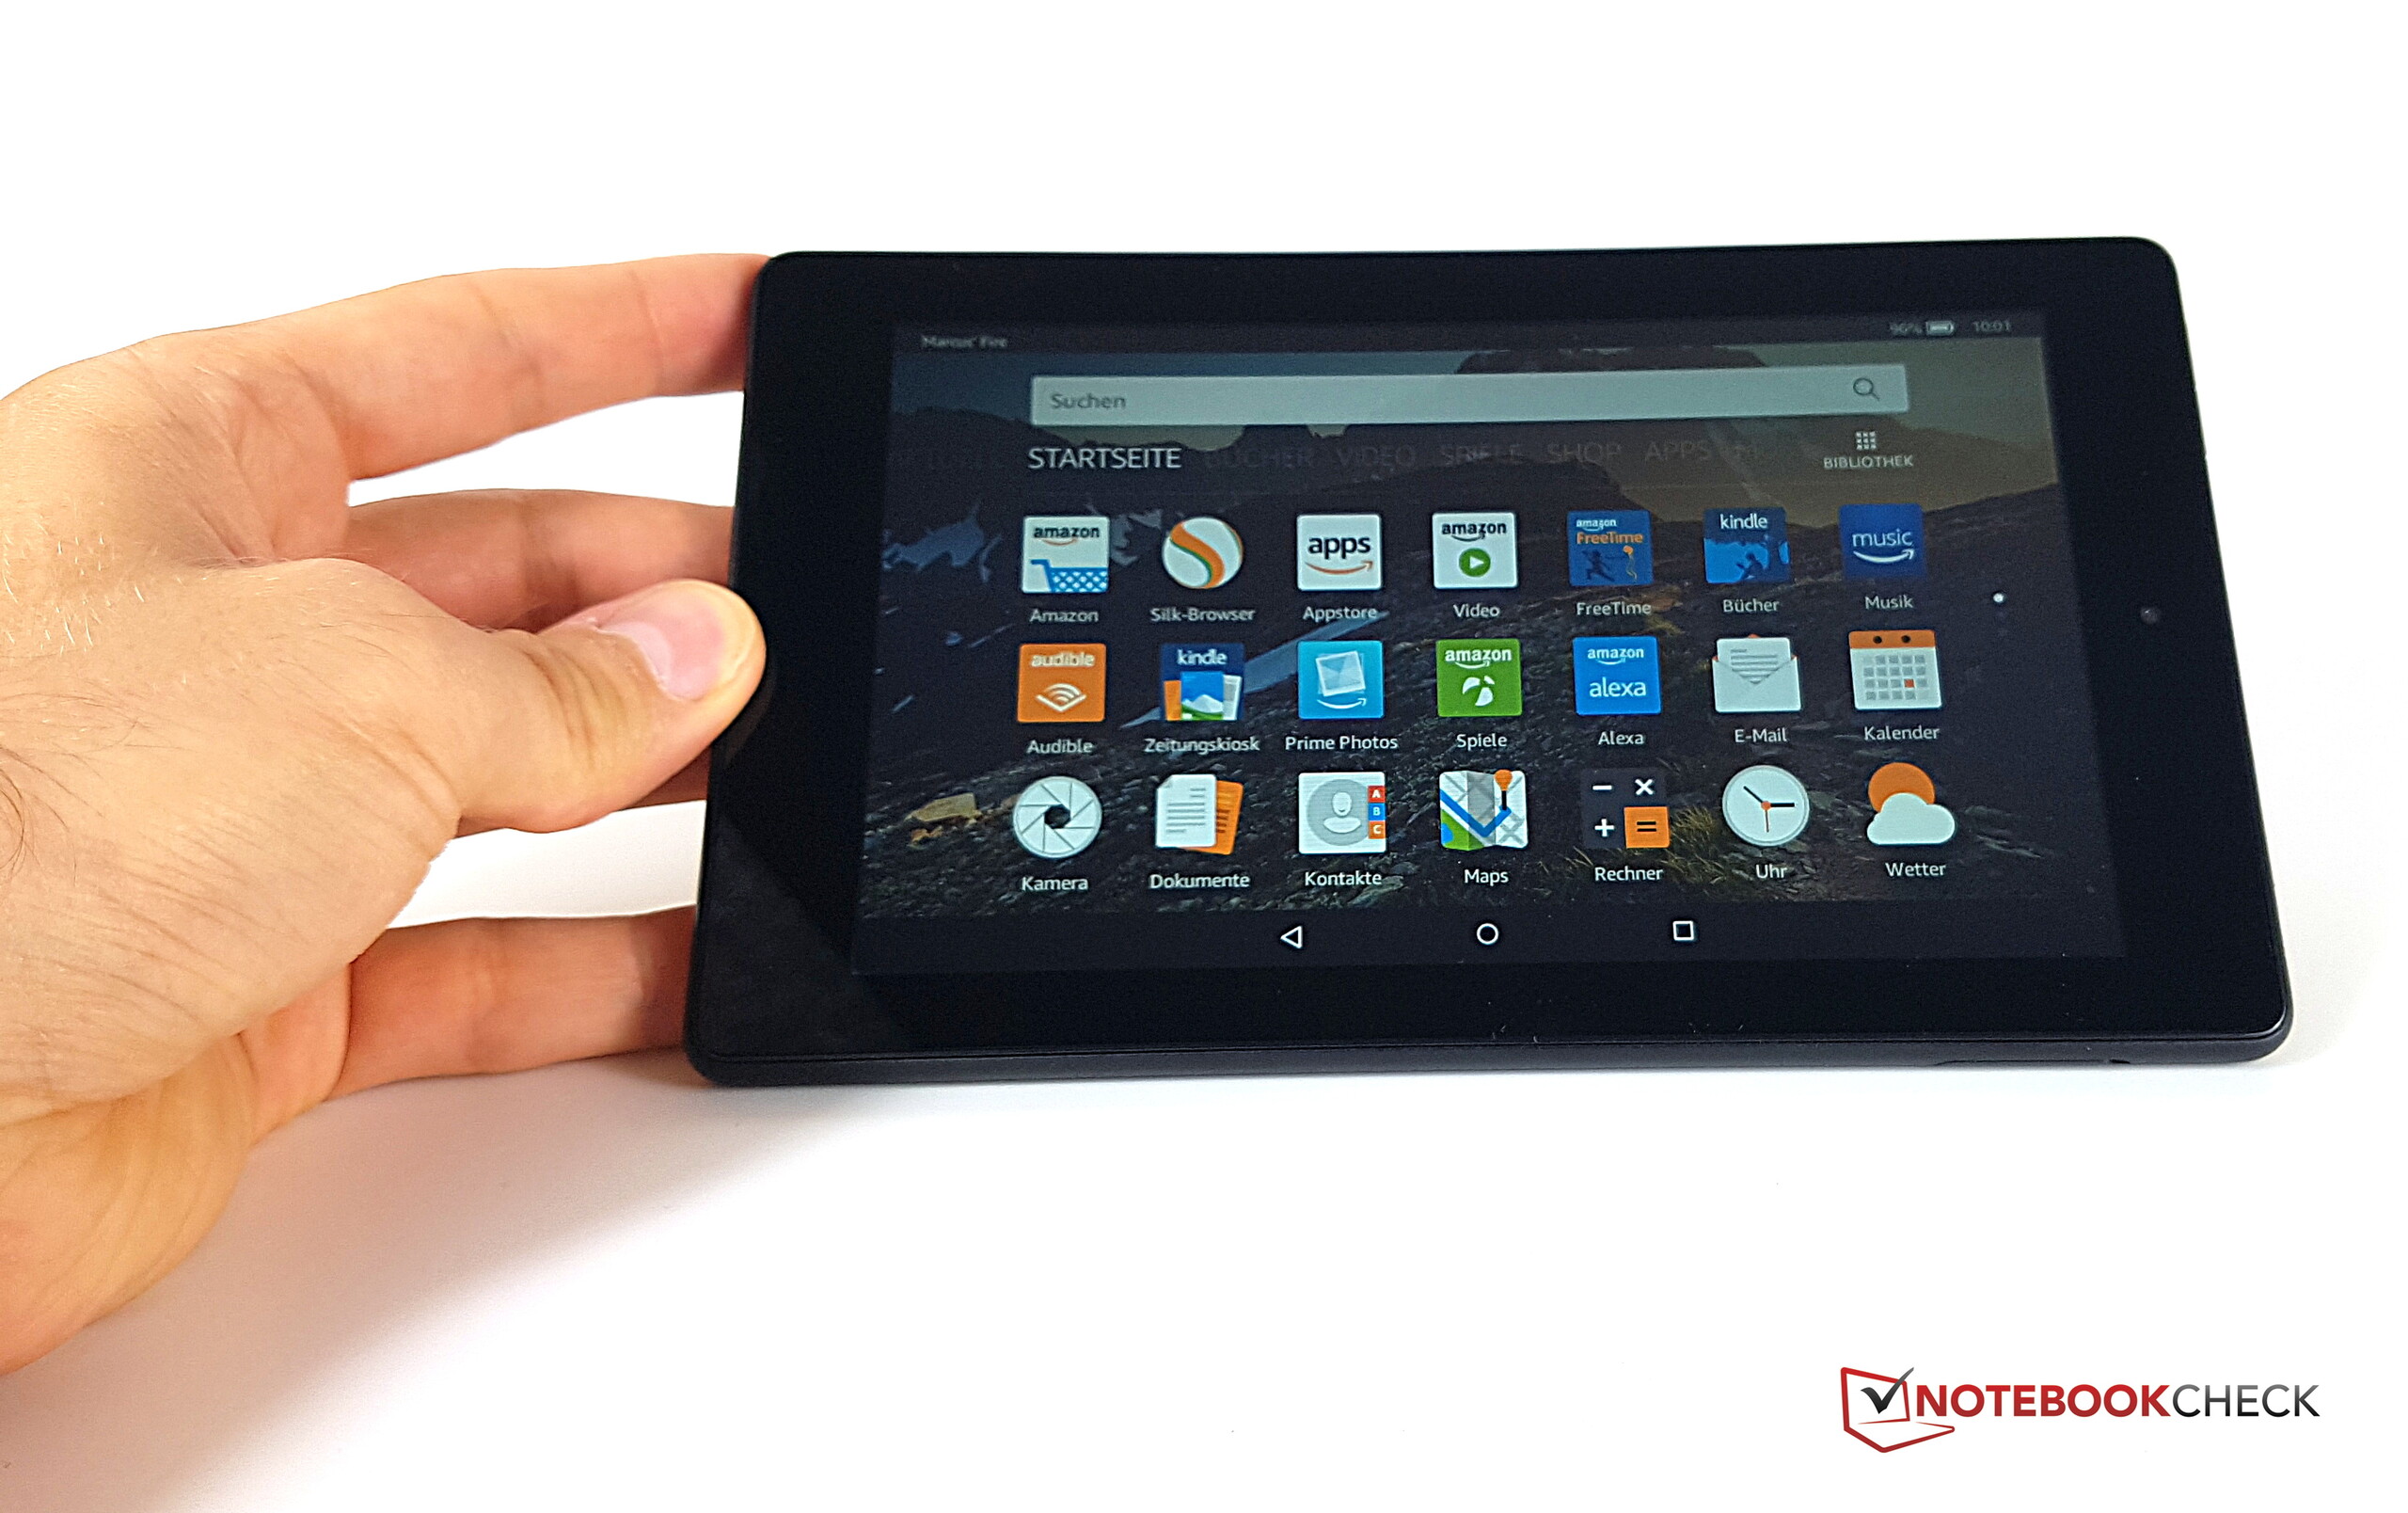
最终每个人心中的疑问将是:Fire 7 (2017)的优势在哪?它的170ppi低分辨率屏幕显然不适合长时间阅读。而缺少性能也将会让游戏和甚至是上网都变得不那么流畅。如果前置扬声器的音响效果不那么差的话用它观看电影也将带来更多享受。当然,之前提到的所有用途Fire 7 (2017)都可以实现,但都需要用户相应做出一些妥协。
最新的亚马逊Fire 7平板电脑仍然只适合要求最低的用户。遗憾的是,亚马逊没能为它带来硬件更新。因此,Fire 7 (2017)最大的卖点依然是超低的价位。
注:本文是基于完整评测的缩减版本,阅读完整的英文评测,请点击这里。
Amazon Fire 7 2017
- 07/10/2017 v6 (old)
Marcus Herbrich
Price comparison
