联想 Tab 4 8 平板电脑简短评测
| Networking | |
| iperf3 transmit AX12 | |
| Huawei MediaPad M3 8.4 inch | |
| Amazon Fire HD 8 2017 | |
| Lenovo Tab 4 10 | |
| Lenovo Tab 4 8 | |
| iperf3 receive AX12 | |
| Huawei MediaPad M3 8.4 inch | |
| Amazon Fire HD 8 2017 | |
| Lenovo Tab 4 10 | |
| Lenovo Tab 4 8 | |

| |||||||||||||||||||||||||
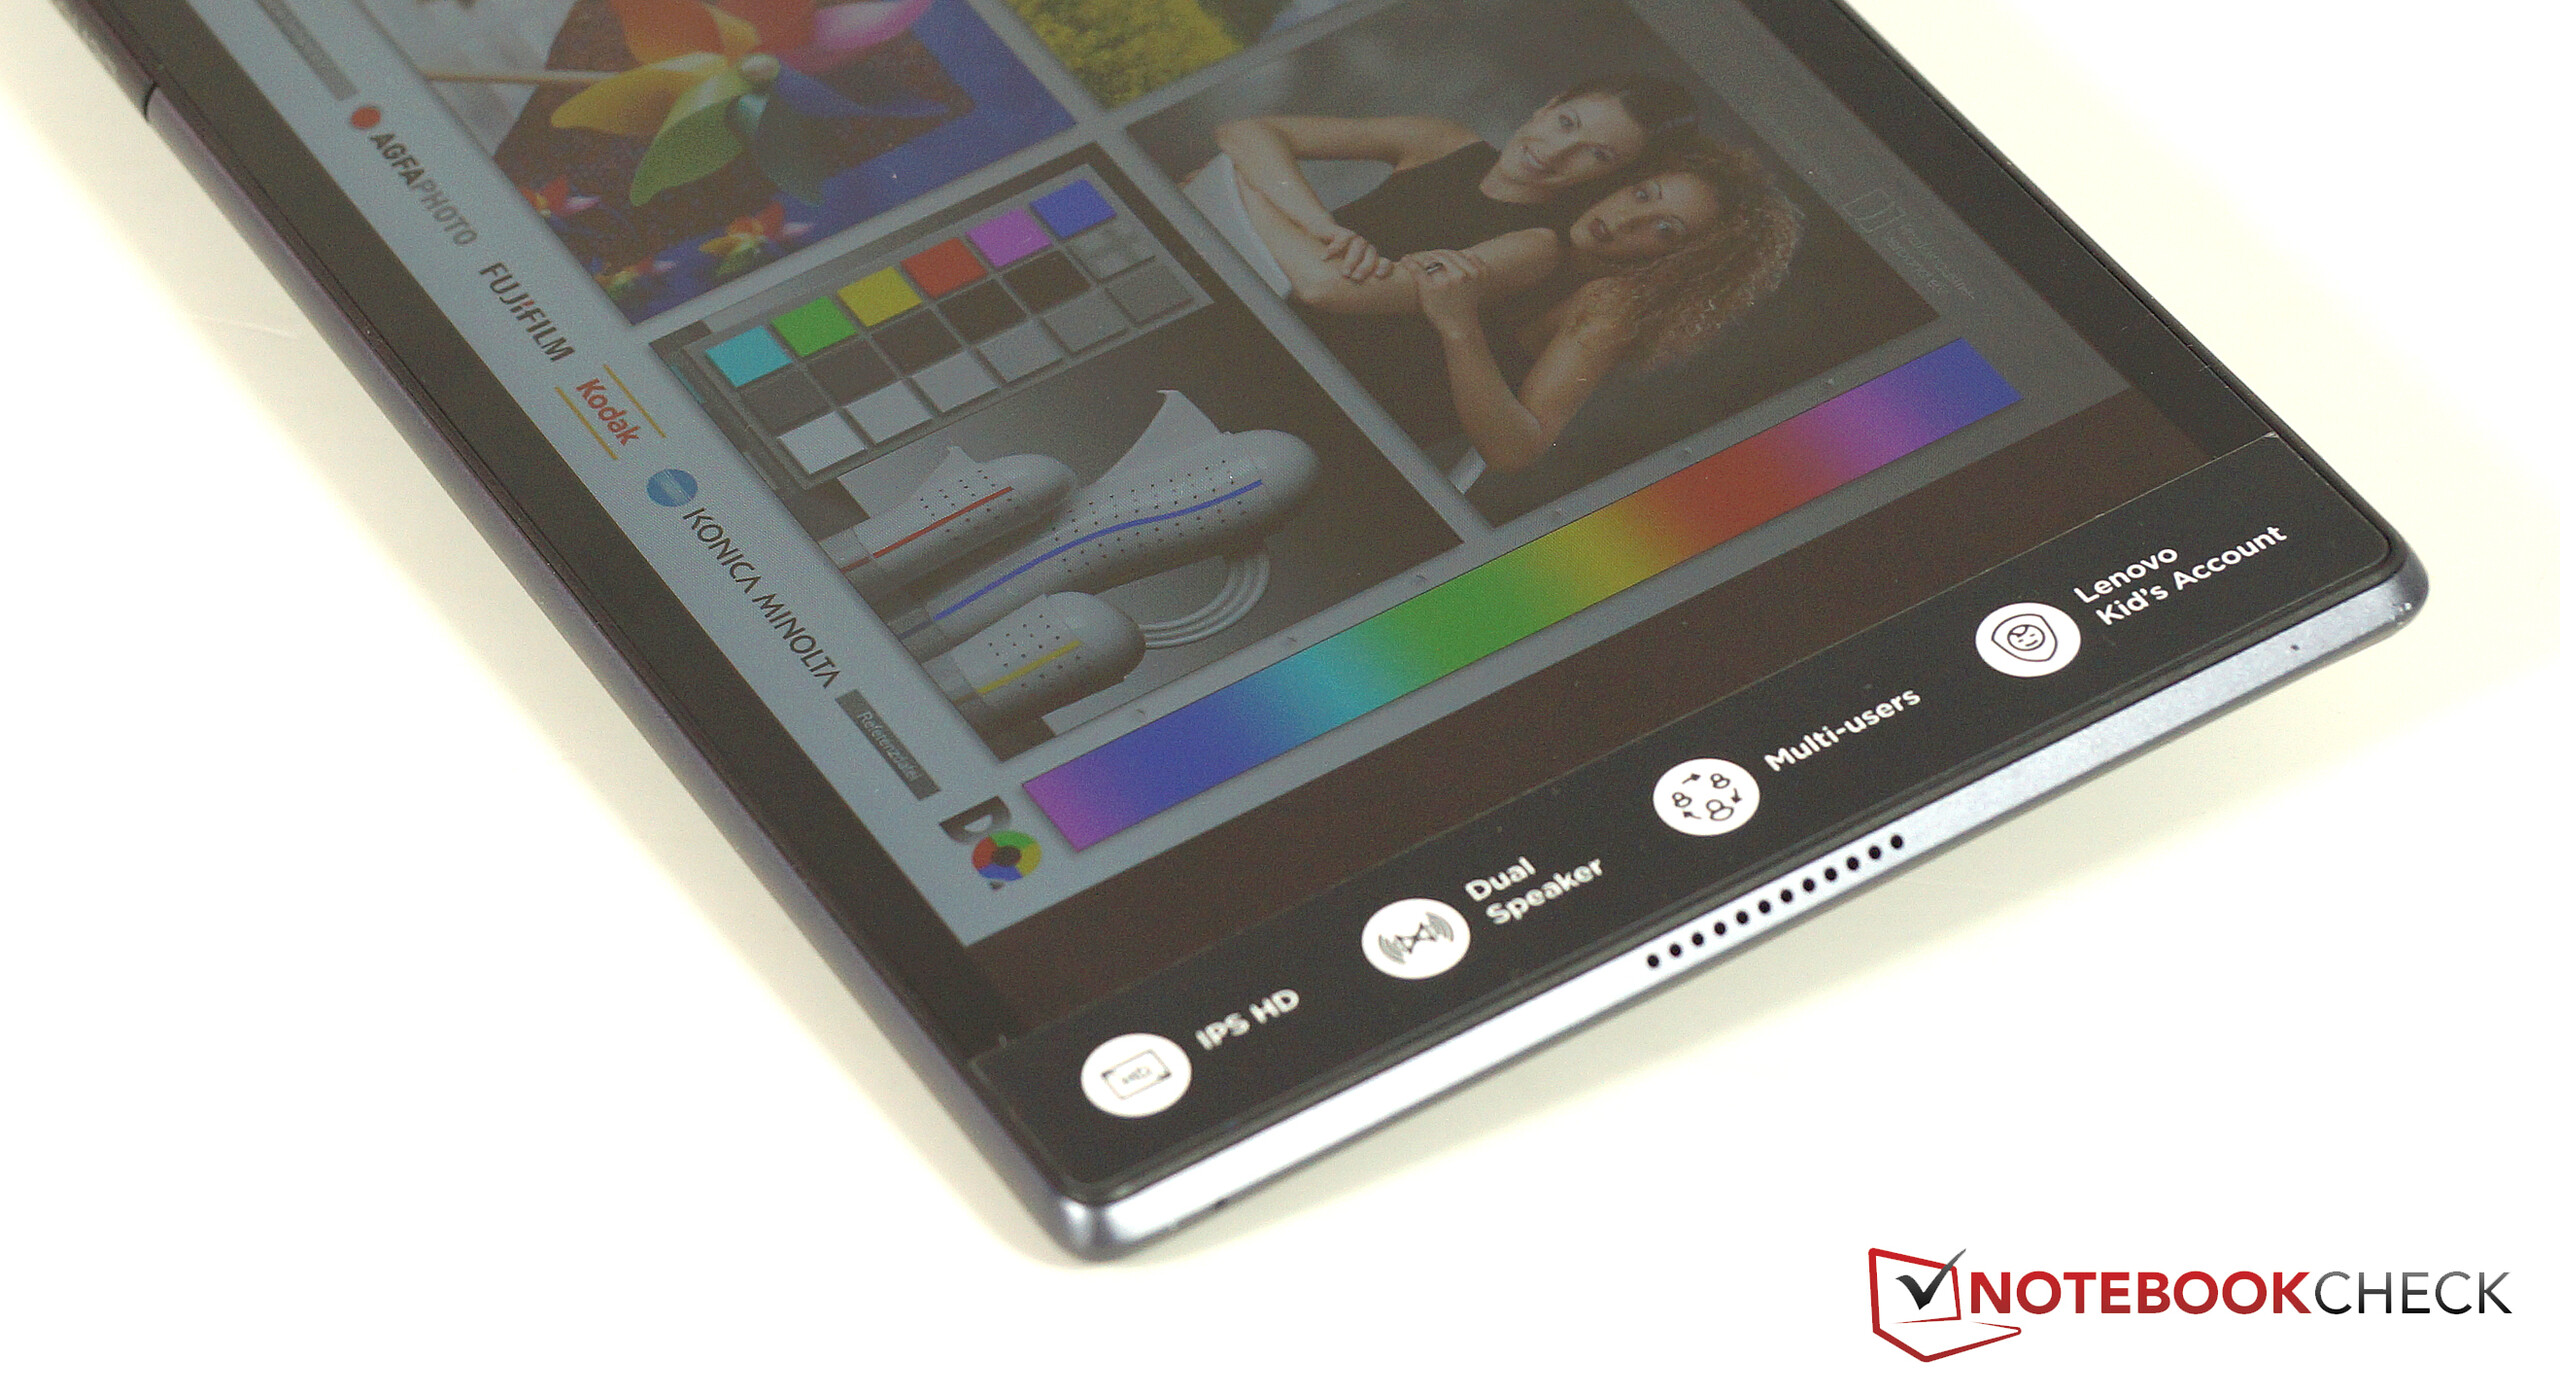
Brightness Distribution: 91 %
Center on Battery: 455 cd/m²
Contrast: 892:1 (Black: 0.51 cd/m²)
ΔE ColorChecker Calman: 5.5 | ∀{0.5-29.43 Ø4.71}
ΔE Greyscale Calman: 5.5 | ∀{0.09-98 Ø4.96}
80.4% sRGB (Calman 2D)
Gamma: 2.23
CCT: 7852 K
| Lenovo Tab 4 8 IPS, 1280x800, 8" | Amazon Fire HD 8 2017 IPS, 1280x800, 8" | Asus ZenPad 8.0 Z380M-6B026A IPS, 1280x800, 8" | Huawei MediaPad M3 8.4 inch IPS, 2560x1600, 8.4" | Lenovo Tab 4 10 IPS, 1280x800, 10.1" | |
|---|---|---|---|---|---|
| Screen | -13% | 5% | 3% | 15% | |
| Brightness middle (cd/m²) | 455 | 419 -8% | 363 -20% | 460 1% | 316 -31% |
| Brightness (cd/m²) | 446 | 412 -8% | 348 -22% | 445 0% | 305 -32% |
| Brightness Distribution (%) | 91 | 91 0% | 90 -1% | 90 -1% | 86 -5% |
| Black Level * (cd/m²) | 0.51 | 0.39 24% | 0.26 49% | 0.45 12% | 0.2 61% |
| Contrast (:1) | 892 | 1074 20% | 1396 57% | 1022 15% | 1580 77% |
| Colorchecker dE 2000 * | 5.5 | 8.5 -55% | 5.8 -5% | 6.2 -13% | 5 9% |
| Colorchecker dE 2000 max. * | 14.8 | 13.8 7% | 17.8 -20% | 10.5 29% | 8.7 41% |
| Greyscale dE 2000 * | 5.5 | 10.3 -87% | 5.5 -0% | 6.5 -18% | 5.7 -4% |
| Gamma | 2.23 99% | 2.6 85% | 2.24 98% | 2.33 94% | 2.25 98% |
| CCT | 7852 83% | 6216 105% | 7388 88% | 8056 81% | 7921 82% |
* ... smaller is better
Screen Flickering / PWM (Pulse-Width Modulation)
| Screen flickering / PWM not detected | 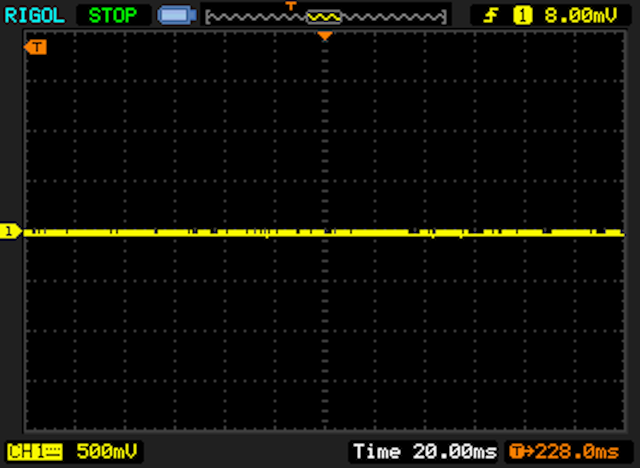 | ||
In comparison: 52 % of all tested devices do not use PWM to dim the display. If PWM was detected, an average of 7754 (minimum: 5 - maximum: 343500) Hz was measured. | |||
Display Response Times
| ↔ Response Time Black to White | ||
|---|---|---|
| 32 ms ... rise ↗ and fall ↘ combined | ↗ 17 ms rise | 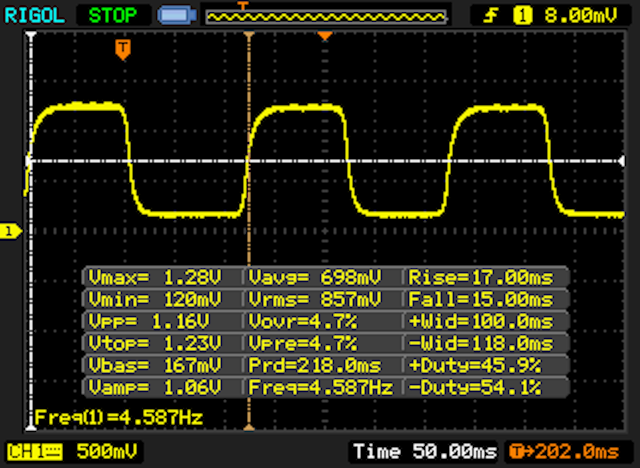 |
| ↘ 15 ms fall | ||
| The screen shows slow response rates in our tests and will be unsatisfactory for gamers. In comparison, all tested devices range from 0.1 (minimum) to 240 (maximum) ms. » 86 % of all devices are better. This means that the measured response time is worse than the average of all tested devices (19.8 ms). | ||
| ↔ Response Time 50% Grey to 80% Grey | ||
| 46 ms ... rise ↗ and fall ↘ combined | ↗ 25 ms rise | 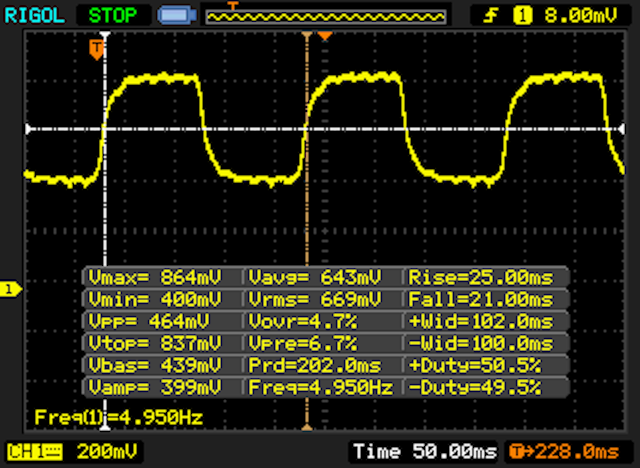 |
| ↘ 21 ms fall | ||
| The screen shows slow response rates in our tests and will be unsatisfactory for gamers. In comparison, all tested devices range from 0.165 (minimum) to 636 (maximum) ms. » 79 % of all devices are better. This means that the measured response time is worse than the average of all tested devices (31 ms). | ||
| AnTuTu v6 - Total Score | |
| Huawei MediaPad M3 8.4 inch | |
| Lenovo Tab 4 8 | |
| Lenovo Tab 4 10 | |
| Asus ZenPad 8.0 Z380M-6B026A | |
| Amazon Fire HD 8 2017 | |
| PCMark for Android | |
| Work performance score | |
| Huawei MediaPad M3 8.4 inch | |
| Lenovo Tab 4 10 | |
| Asus ZenPad 8.0 Z380M-6B026A | |
| Lenovo Tab 4 8 | |
| Amazon Fire HD 8 2017 | |
| Work 2.0 performance score | |
| Lenovo Tab 4 8 | |
| Lenovo Tab 4 10 | |
| Amazon Fire HD 8 2017 | |
| Geekbench 4.4 | |
| 64 Bit Single-Core Score | |
| Lenovo Tab 4 8 | |
| Lenovo Tab 4 10 | |
| Amazon Fire HD 8 2017 | |
| 64 Bit Multi-Core Score | |
| Lenovo Tab 4 8 | |
| Lenovo Tab 4 10 | |
| Amazon Fire HD 8 2017 | |
| Compute RenderScript Score | |
| Lenovo Tab 4 10 | |
| Lenovo Tab 4 8 | |
| GFXBench (DX / GLBenchmark) 2.7 | |
| T-Rex Onscreen | |
| Huawei MediaPad M3 8.4 inch | |
| Asus ZenPad 8.0 Z380M-6B026A | |
| Amazon Fire HD 8 2017 | |
| Lenovo Tab 4 8 | |
| Lenovo Tab 4 10 | |
| 1920x1080 T-Rex Offscreen | |
| Huawei MediaPad M3 8.4 inch | |
| Asus ZenPad 8.0 Z380M-6B026A | |
| Amazon Fire HD 8 2017 | |
| Lenovo Tab 4 8 | |
| Lenovo Tab 4 10 | |
| GFXBench 3.0 | |
| on screen Manhattan Onscreen OGL | |
| Huawei MediaPad M3 8.4 inch | |
| Asus ZenPad 8.0 Z380M-6B026A | |
| Amazon Fire HD 8 2017 | |
| Lenovo Tab 4 8 | |
| Lenovo Tab 4 10 | |
| 1920x1080 1080p Manhattan Offscreen | |
| Huawei MediaPad M3 8.4 inch | |
| Asus ZenPad 8.0 Z380M-6B026A | |
| Amazon Fire HD 8 2017 | |
| Lenovo Tab 4 8 | |
| Lenovo Tab 4 10 | |
| Octane V2 - Total Score | |
| Huawei MediaPad M3 8.4 inch (Chrome 54) | |
| Lenovo Tab 4 10 (Chrome 60) | |
| Lenovo Tab 4 8 (Chrome 61) | |
| Amazon Fire HD 8 2017 (Amazon Silk 58.2.3029.83.10) | |
| Asus ZenPad 8.0 Z380M-6B026A (Chrome 52.0.2743.91) | |
| WebXPRT 2015 - Overall | |
| Huawei MediaPad M3 8.4 inch (Chrome 54) | |
| Lenovo Tab 4 8 (Chrome 61) | |
| Lenovo Tab 4 10 (Chrome 60) | |
| Asus ZenPad 8.0 Z380M-6B026A (Chrome 52.0.2743.91) | |
| Amazon Fire HD 8 2017 (Amazon Silk 58.2.3029.83.10) | |
| JetStream 1.1 - 1.1 Total | |
| Huawei MediaPad M3 8.4 inch (Chrome 54) | |
| Amazon Fire HD 8 2017 (Amazon Silk 58.2.3029.83.10) | |
| Asus ZenPad 8.0 Z380M-6B026A (Chrome 52.0.2743.91) | |
| Lenovo Tab 4 8 (Chrome 61) | |
| Mozilla Kraken 1.1 - Total | |
| Lenovo Tab 4 10 (Chrome 60) | |
| Asus ZenPad 8.0 Z380M-6B026A (Chrome 52.0.2743.91) | |
| Lenovo Tab 4 8 (Chrome 61) | |
| Amazon Fire HD 8 2017 (Amazon Silk 58.2.3029.83.10) | |
| Huawei MediaPad M3 8.4 inch (Chrome 54) | |
* ... smaller is better
| Lenovo Tab 4 8 | Amazon Fire HD 8 2017 | Asus ZenPad 8.0 Z380M-6B026A | Huawei MediaPad M3 8.4 inch | Lenovo Tab 4 10 | |
|---|---|---|---|---|---|
| AndroBench 3-5 | -25% | -38% | 47% | -6% | |
| Sequential Read 256KB (MB/s) | 265.1 | 159.1 -40% | 158.4 -40% | 249.7 -6% | 275 4% |
| Sequential Write 256KB (MB/s) | 72.3 | 47.23 -35% | 45.71 -37% | 117.2 62% | 45.3 -37% |
| Random Read 4KB (MB/s) | 44 | 21.55 -51% | 21.96 -50% | 32.04 -27% | 32.3 -27% |
| Random Write 4KB (MB/s) | 7.1 | 11.51 62% | 8.35 18% | 31.35 342% | 8.9 25% |
| Sequential Read 256KB SDCard (MB/s) | 84.8 | 51.1 -40% | 35.2 -58% | 61.7 ? -27% | 84.5 0% |
| Sequential Write 256KB SDCard (MB/s) | 61.1 | 34.15 -44% | 24.9 -59% | 23.52 ? -62% | 59.9 -2% |
| Asphalt 8: Airborne | |||
| Settings | Value | ||
| high | 18 fps | ||
| very low | 30 fps | ||
| Dead Trigger 2 | |||
| Settings | Value | ||
| high | 30 fps | ||
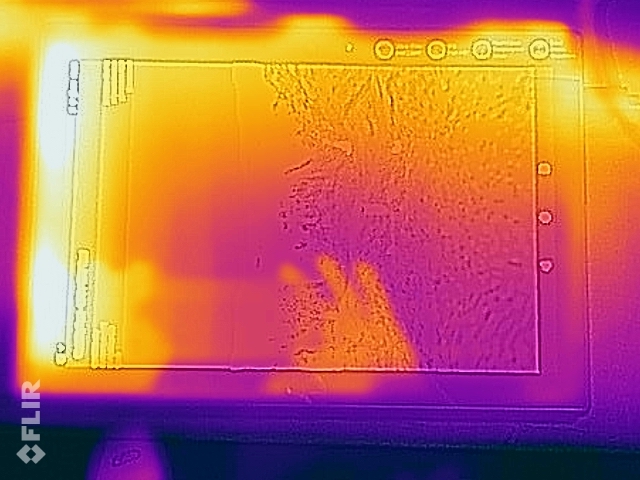
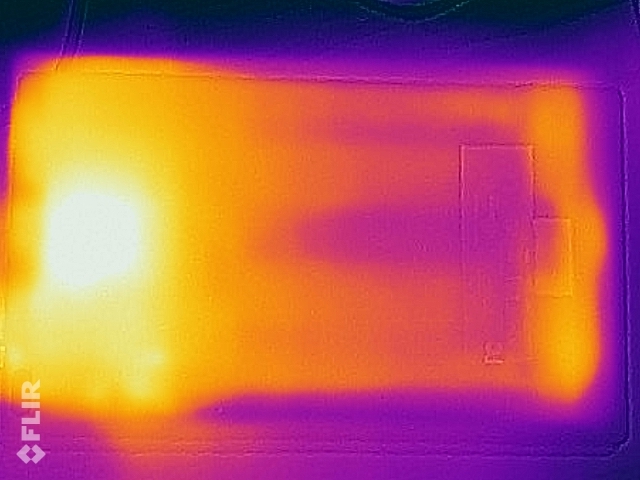
(+) The maximum temperature on the upper side is 38.5 °C / 101 F, compared to the average of 33.7 °C / 93 F, ranging from 20.7 to 53.2 °C for the class Tablet.
(±) The bottom heats up to a maximum of 40.1 °C / 104 F, compared to the average of 33.2 °C / 92 F
(+) In idle usage, the average temperature for the upper side is 30.9 °C / 88 F, compared to the device average of 30 °C / 86 F.
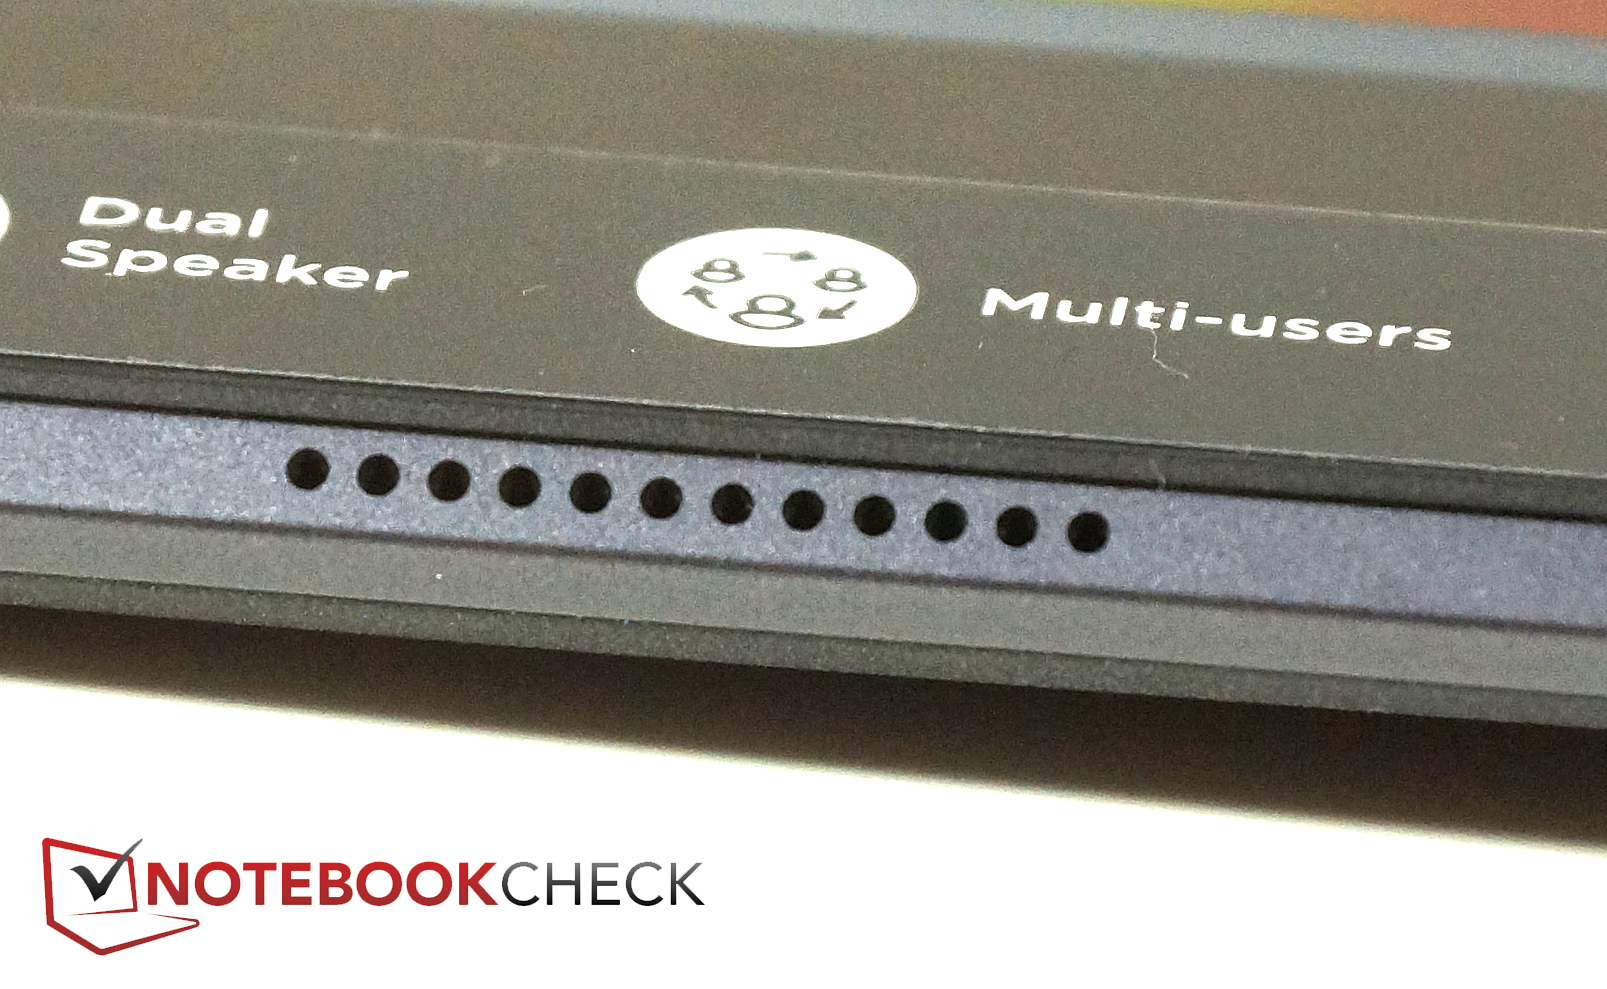
Lenovo Tab 4 8 audio analysis
(+) | speakers can play relatively loud (84.8 dB)
Bass 100 - 315 Hz
(-) | nearly no bass - on average 18.8% lower than median
(±) | linearity of bass is average (8.5% delta to prev. frequency)
Mids 400 - 2000 Hz
(±) | higher mids - on average 7.9% higher than median
(±) | linearity of mids is average (7.3% delta to prev. frequency)
Highs 2 - 16 kHz
(±) | higher highs - on average 5.7% higher than median
(+) | highs are linear (5.8% delta to prev. frequency)
Overall 100 - 16.000 Hz
(±) | linearity of overall sound is average (24% difference to median)
Compared to same class
» 76% of all tested devices in this class were better, 5% similar, 19% worse
» The best had a delta of 7%, average was 20%, worst was 129%
Compared to all devices tested
» 72% of all tested devices were better, 6% similar, 22% worse
» The best had a delta of 4%, average was 23%, worst was 134%
Asus ZenPad 8.0 Z380M-6B026A audio analysis
(±) | speaker loudness is average but good (75.1 dB)
Bass 100 - 315 Hz
(-) | nearly no bass - on average 28.5% lower than median
(-) | bass is not linear (18.8% delta to prev. frequency)
Mids 400 - 2000 Hz
(+) | balanced mids - only 3.9% away from median
(±) | linearity of mids is average (9.3% delta to prev. frequency)
Highs 2 - 16 kHz
(+) | balanced highs - only 2.5% away from median
(+) | highs are linear (5.4% delta to prev. frequency)
Overall 100 - 16.000 Hz
(±) | linearity of overall sound is average (23.9% difference to median)
Compared to same class
» 75% of all tested devices in this class were better, 6% similar, 19% worse
» The best had a delta of 7%, average was 20%, worst was 129%
Compared to all devices tested
» 72% of all tested devices were better, 6% similar, 22% worse
» The best had a delta of 4%, average was 23%, worst was 134%
| Off / Standby | |
| Idle | |
| Load |
|
Key:
min: | |
| Lenovo Tab 4 8 4850 mAh | Amazon Fire HD 8 2017 mAh | Asus ZenPad 8.0 Z380M-6B026A 4000 mAh | Huawei MediaPad M3 8.4 inch 5100 mAh | Lenovo Tab 4 10 7000 mAh | |
|---|---|---|---|---|---|
| Power Consumption | 16% | 13% | -24% | -3% | |
| Idle Minimum * (Watt) | 1.1 | 0.99 10% | 1.32 -20% | 1.51 -37% | 1.09 1% |
| Idle Average * (Watt) | 3.51 | 2.74 22% | 2.71 23% | 3.64 -4% | 3.71 -6% |
| Idle Maximum * (Watt) | 4.14 | 2.83 32% | 2.83 32% | 3.68 11% | 3.84 7% |
| Load Average * (Watt) | 4.86 | 4.51 7% | 4.24 13% | 6.95 -43% | 5.07 -4% |
| Load Maximum * (Watt) | 6.13 | 5.69 7% | 5.01 18% | 9.11 -49% | 6.88 -12% |
* ... smaller is better
| Lenovo Tab 4 8 4850 mAh | Amazon Fire HD 8 2017 mAh | Asus ZenPad 8.0 Z380M-6B026A 4000 mAh | Huawei MediaPad M3 8.4 inch 5100 mAh | Lenovo Tab 4 10 7000 mAh | |
|---|---|---|---|---|---|
| Battery runtime | 52% | 5% | 2% | 40% | |
| Reader / Idle (h) | 20.1 | 33.9 69% | 21.8 8% | 18.5 -8% | |
| H.264 (h) | 10.1 | 12.4 23% | 10.4 3% | 9.7 -4% | |
| WiFi v1.3 (h) | 7.5 | 12.8 71% | 7.9 5% | 9.1 21% | 10.5 40% |
| Load (h) | 4.6 | 6.6 43% | 4.8 4% | 4.5 -2% |
Pros
Cons
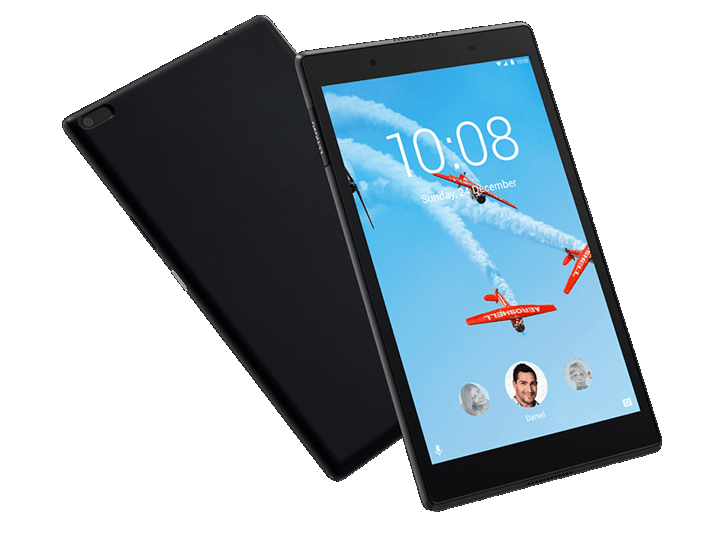
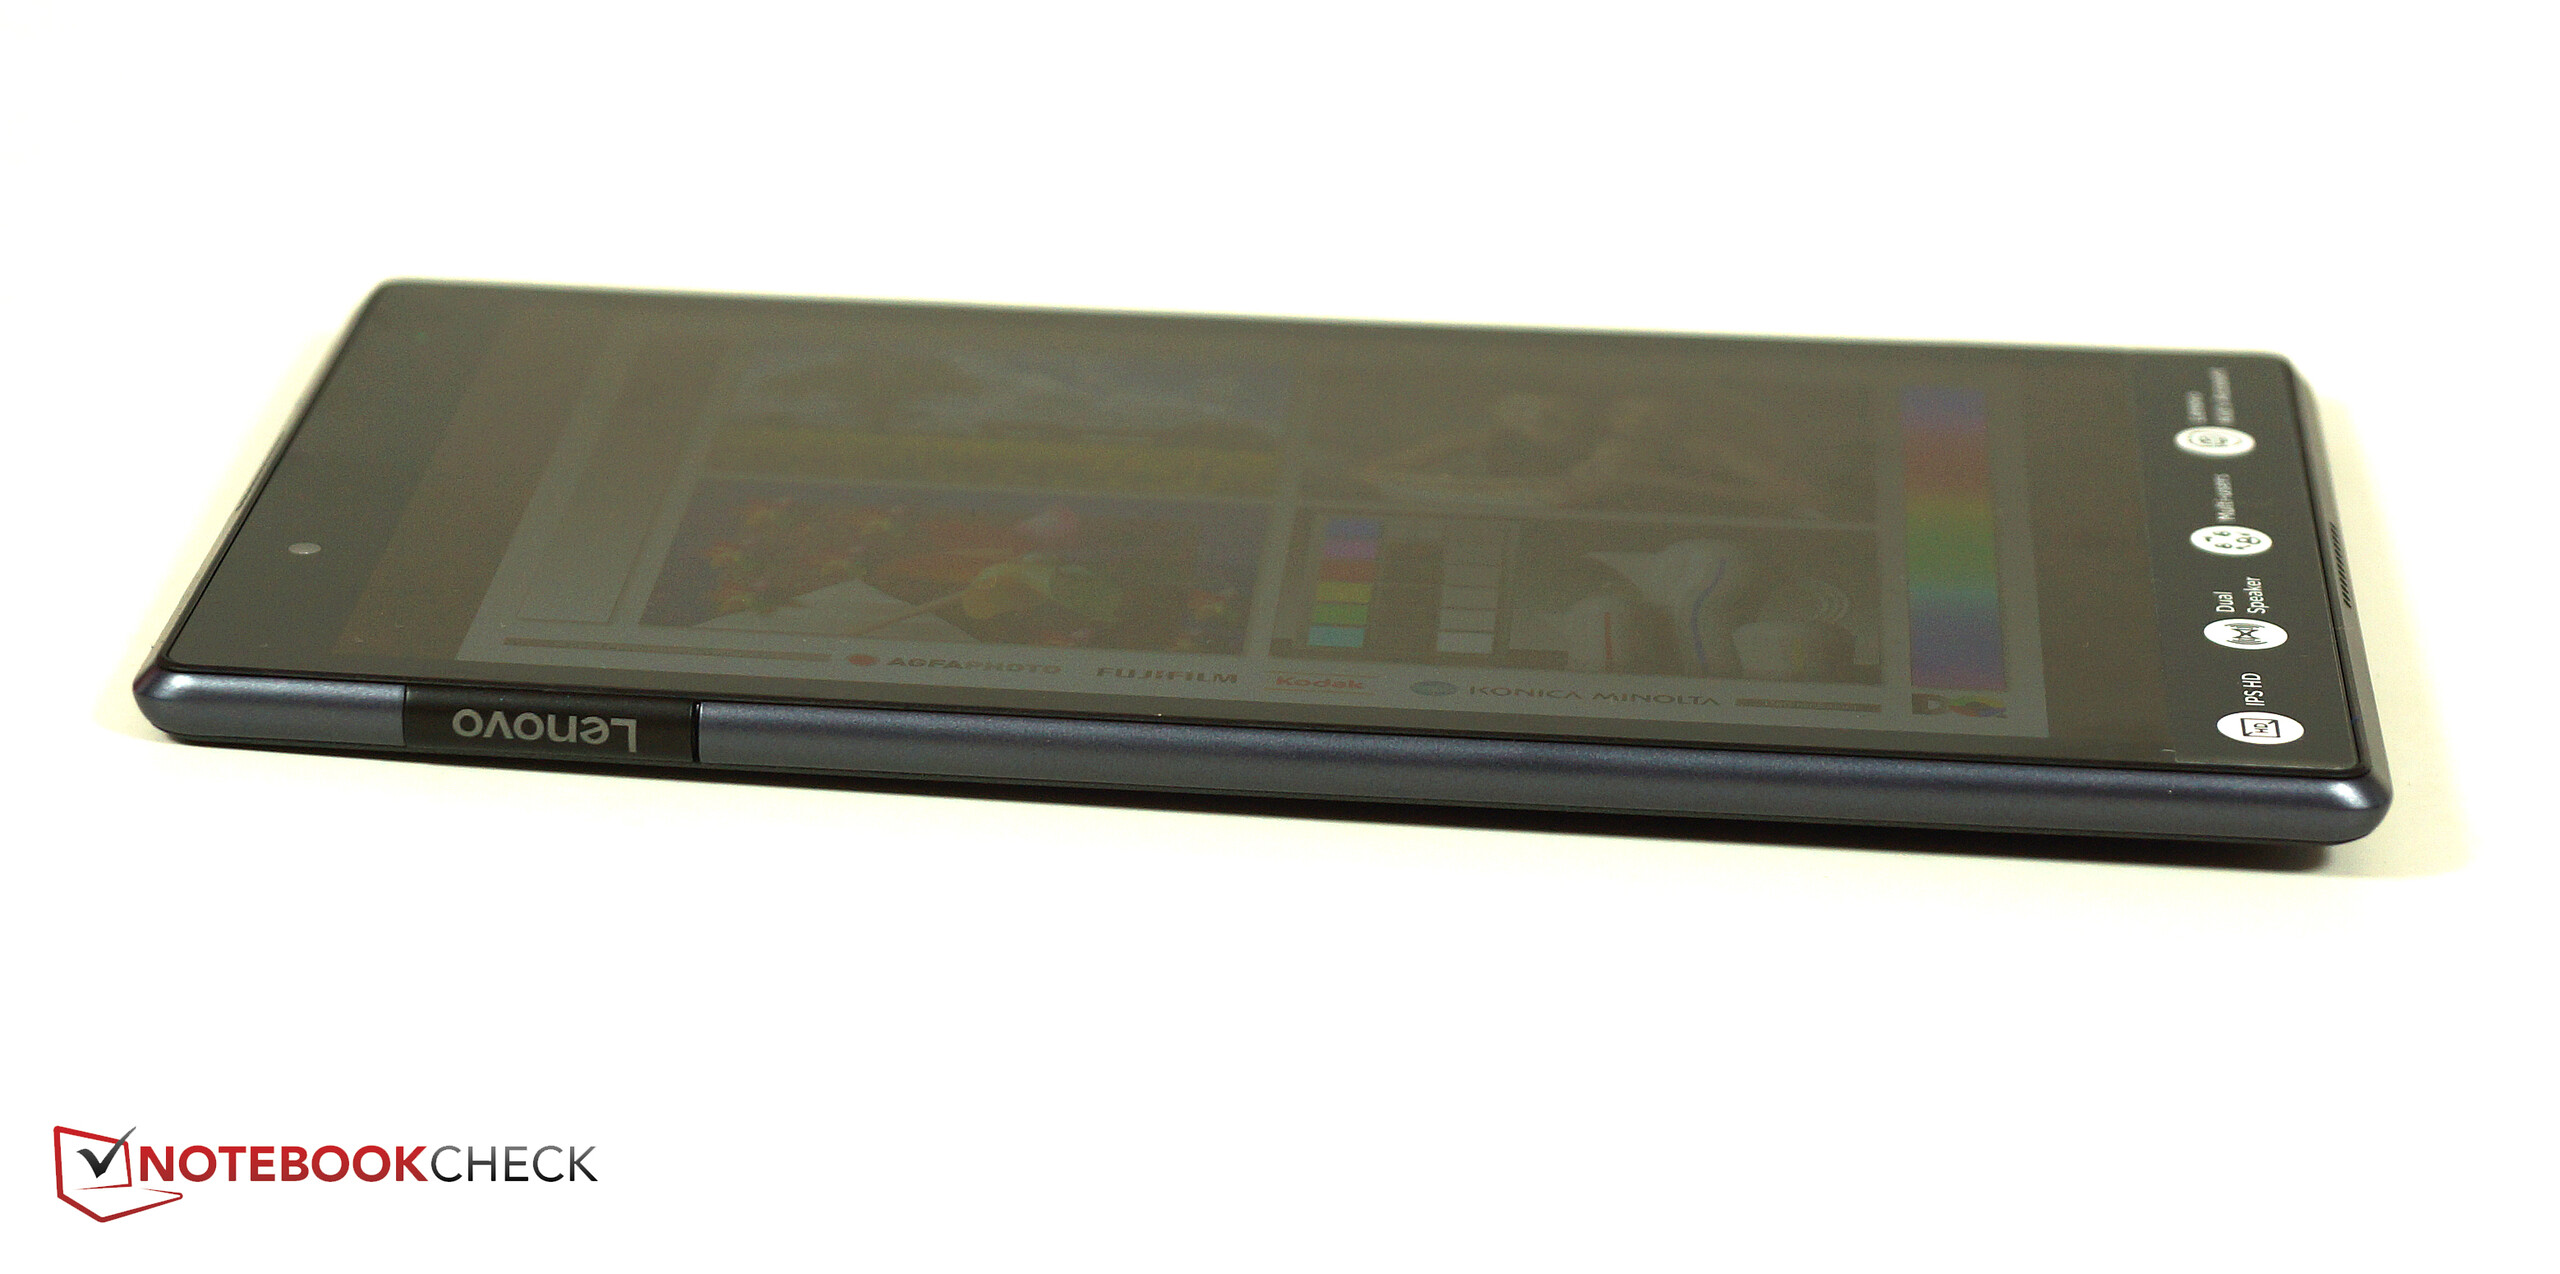
联想Tab 4 8是一台价格实惠却又难以脱颖而出的平板电脑。它的设计拘谨保守,外壳容易因为扭曲和压力变形。摄像头解决方案、照相水平、机器性能、拓展性与同类产品类似。
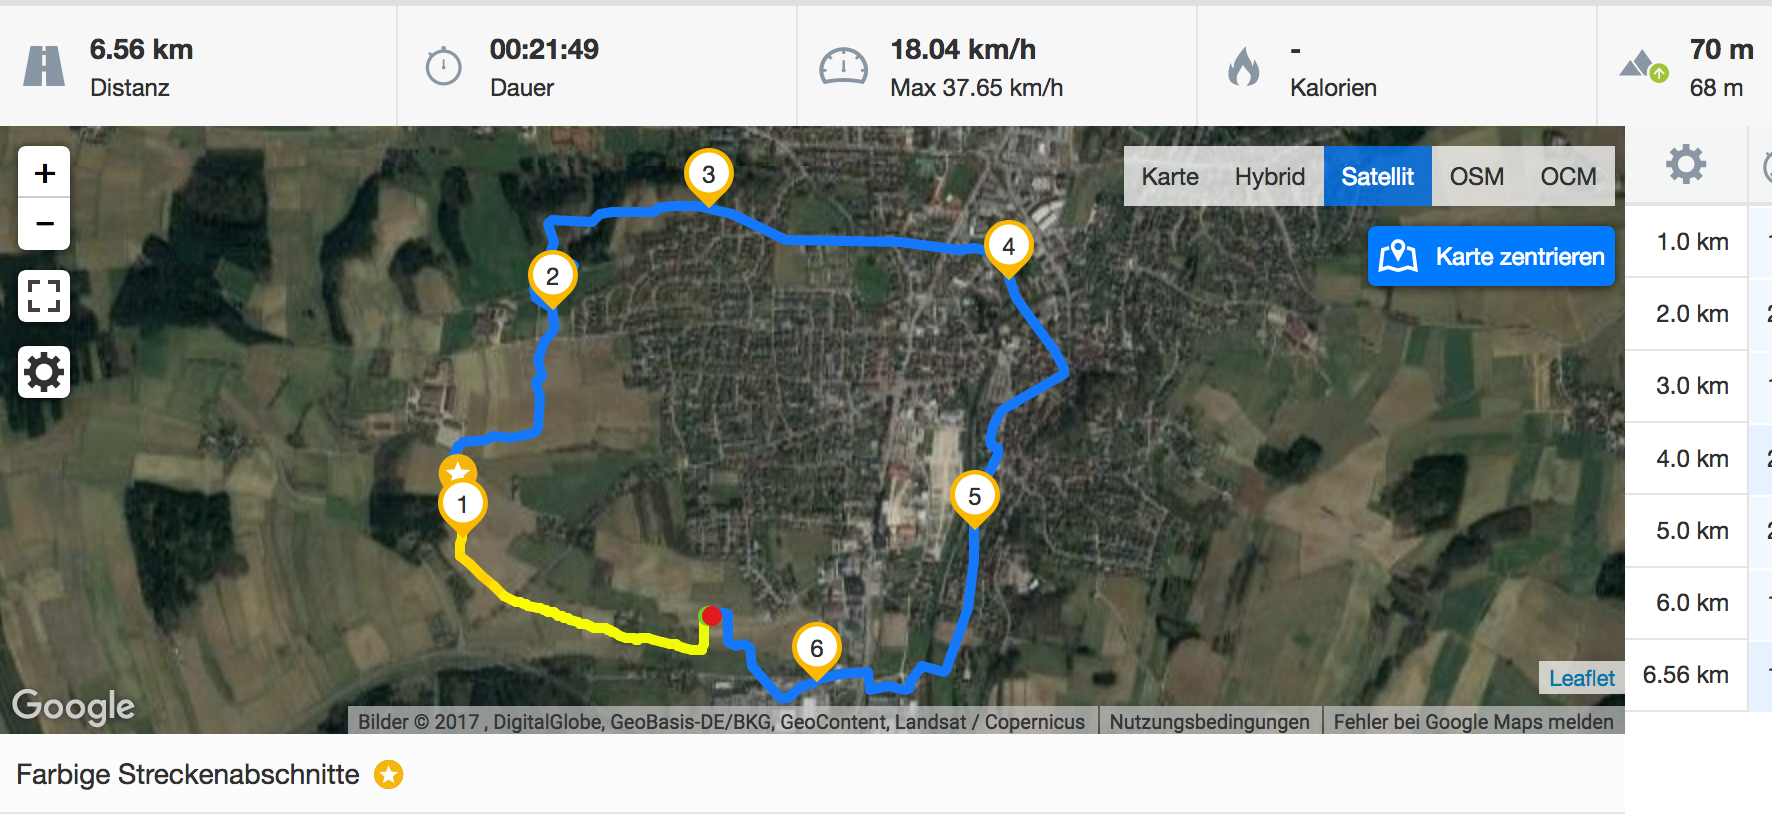
换言之:该机在任何方面都显得普通,却又在许多方面做的很稳健。明亮的显示屏拥有宽广的可视角度。GPS定位系统非常准确。在高负载下,该机也不会过热。它的前置扬声器、纯净的安卓系统、和大容量电池(虽然联想在电池拓容上失败了),都是值得一提的。我们必须强调的是:联想在如何通过可选配置,来提升一个廉价平板上花了很多时间和精力。
联想Tab 4 8是一台没有太多花哨功能,而且性能稳定的8寸平板电脑。
总的来说,像联想Yoga系列的平板电脑这样的设备,会比该机跟富吸引力。该机性能稳定,价格实惠,而且没有明显的缺陷。
注:本文是基于完整评测的缩减版本,阅读完整的英文评测,请点击这里。
Lenovo Tab 4 8
- 10/06/2017 v6 (old)
Florian Wimmer
Price comparison
