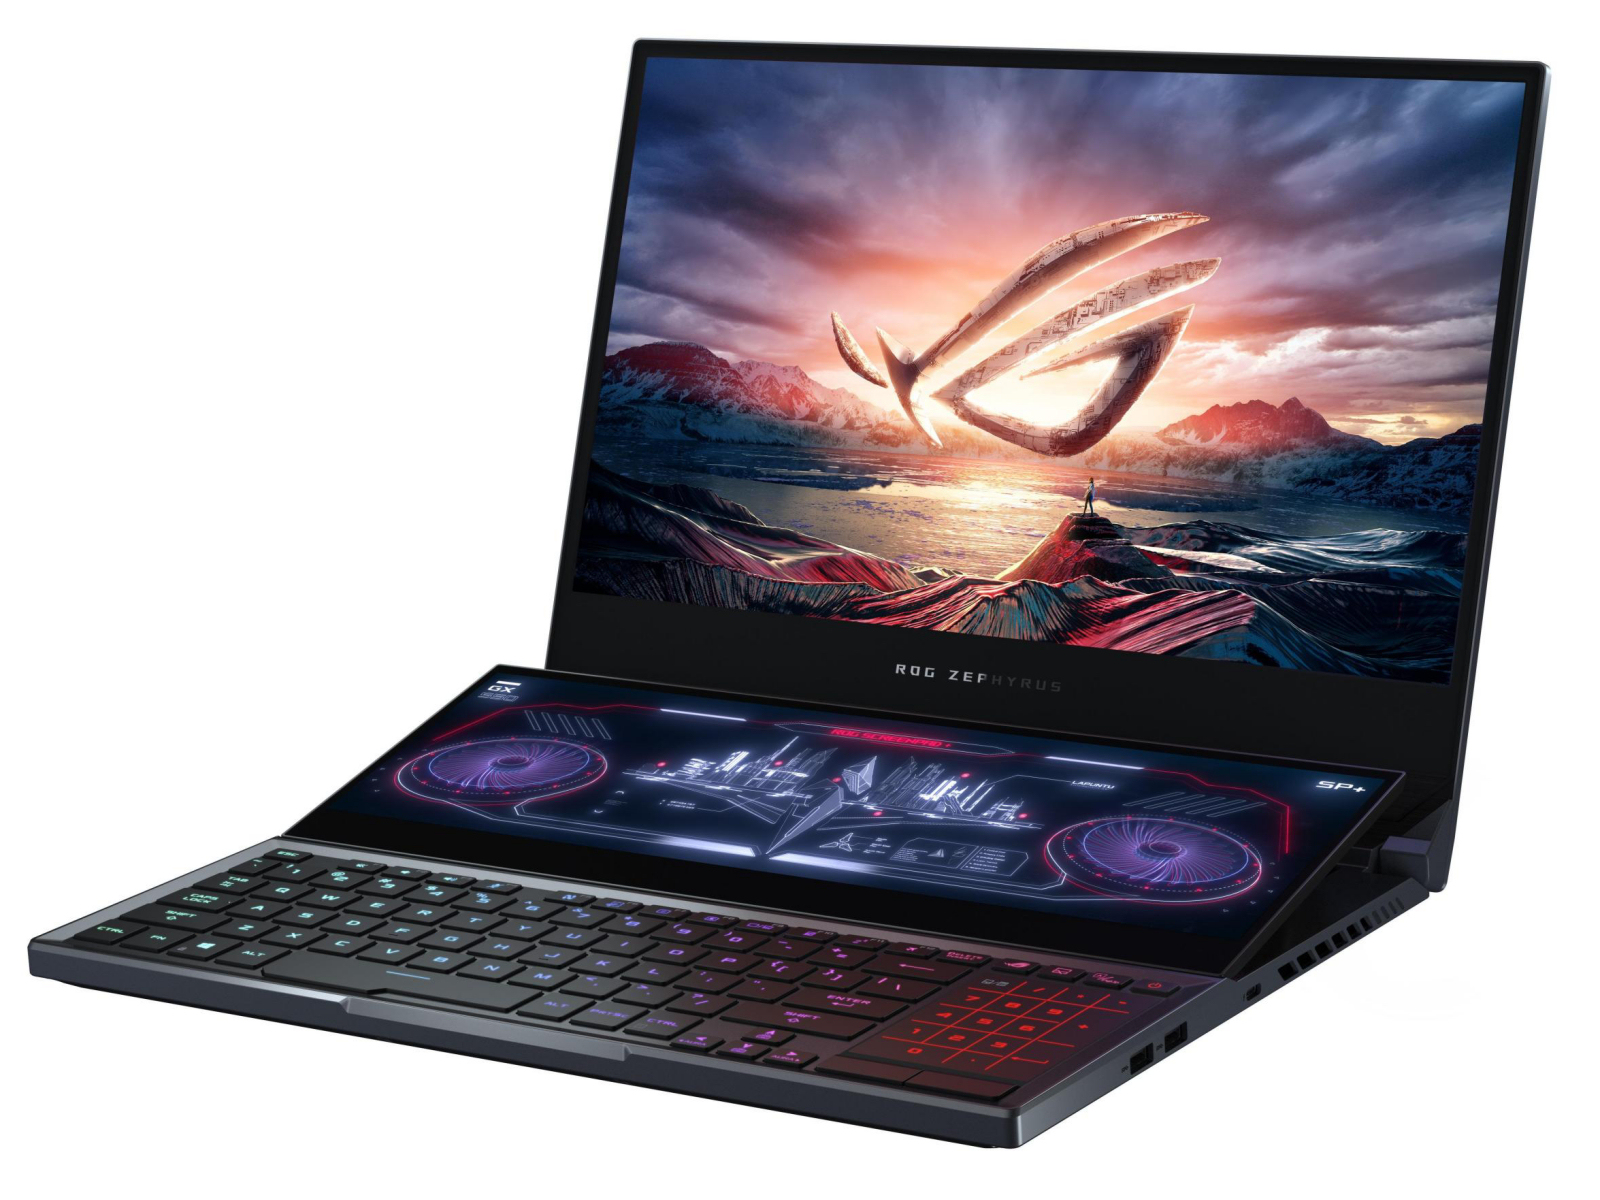
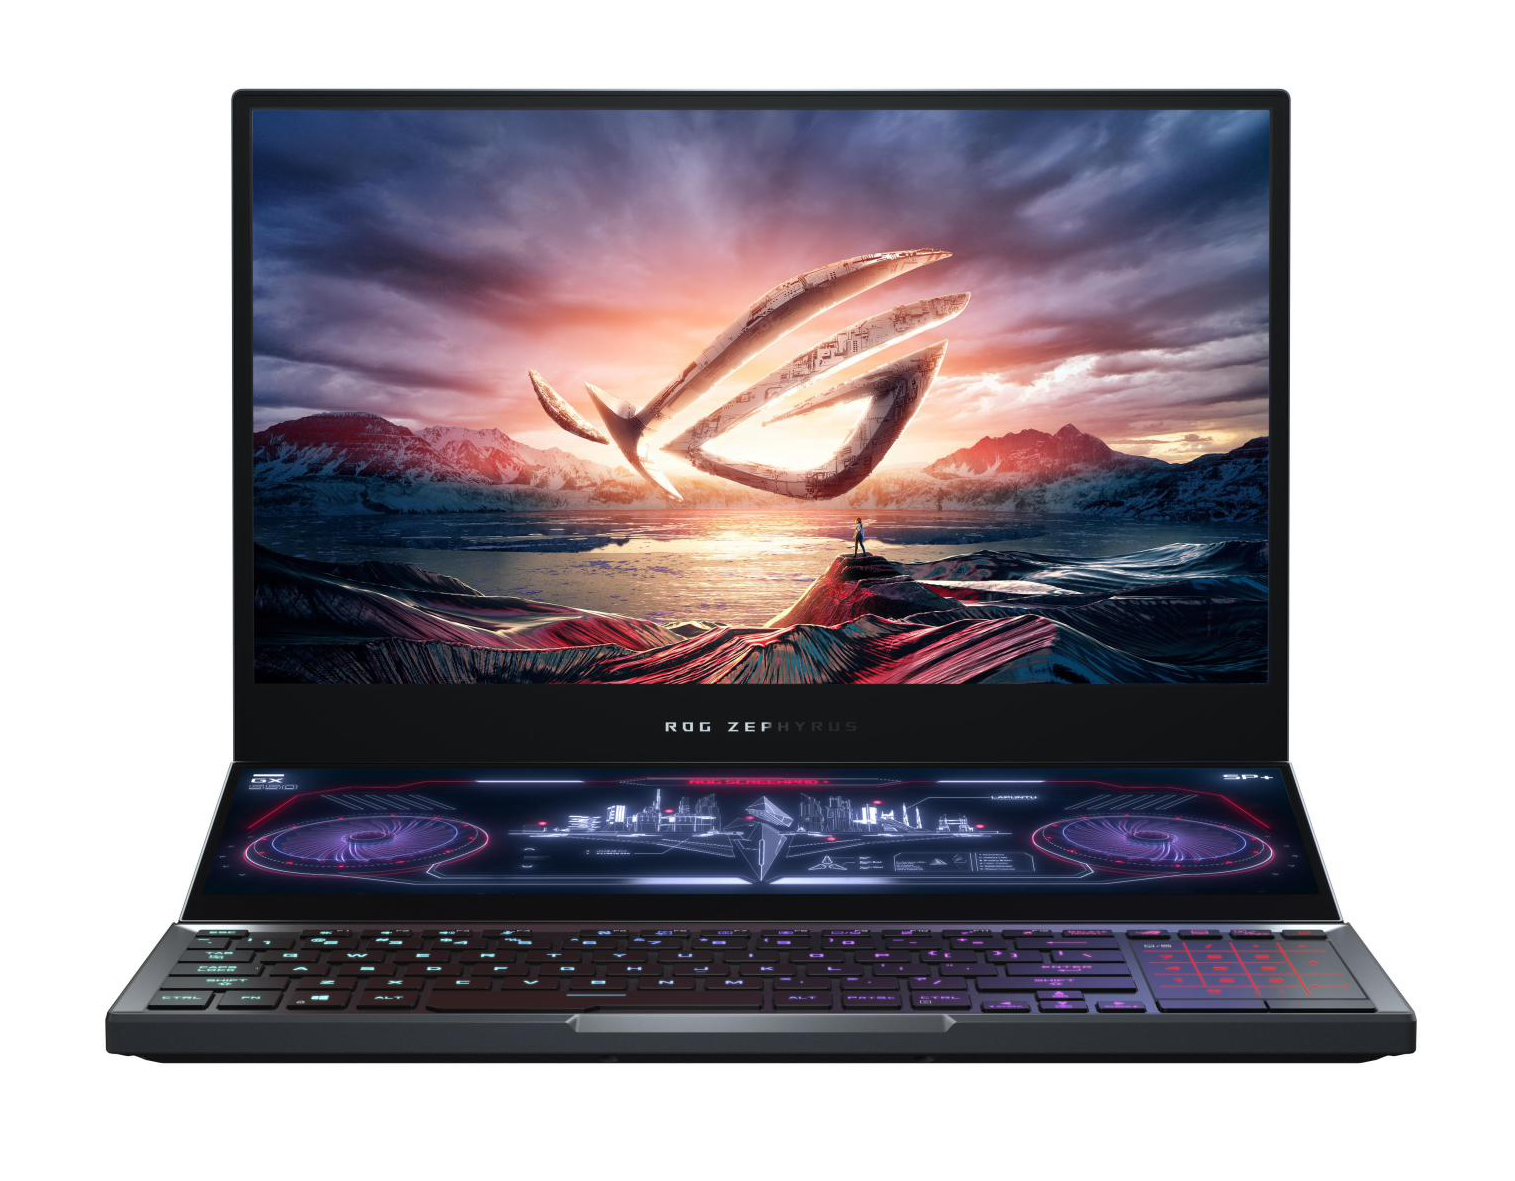
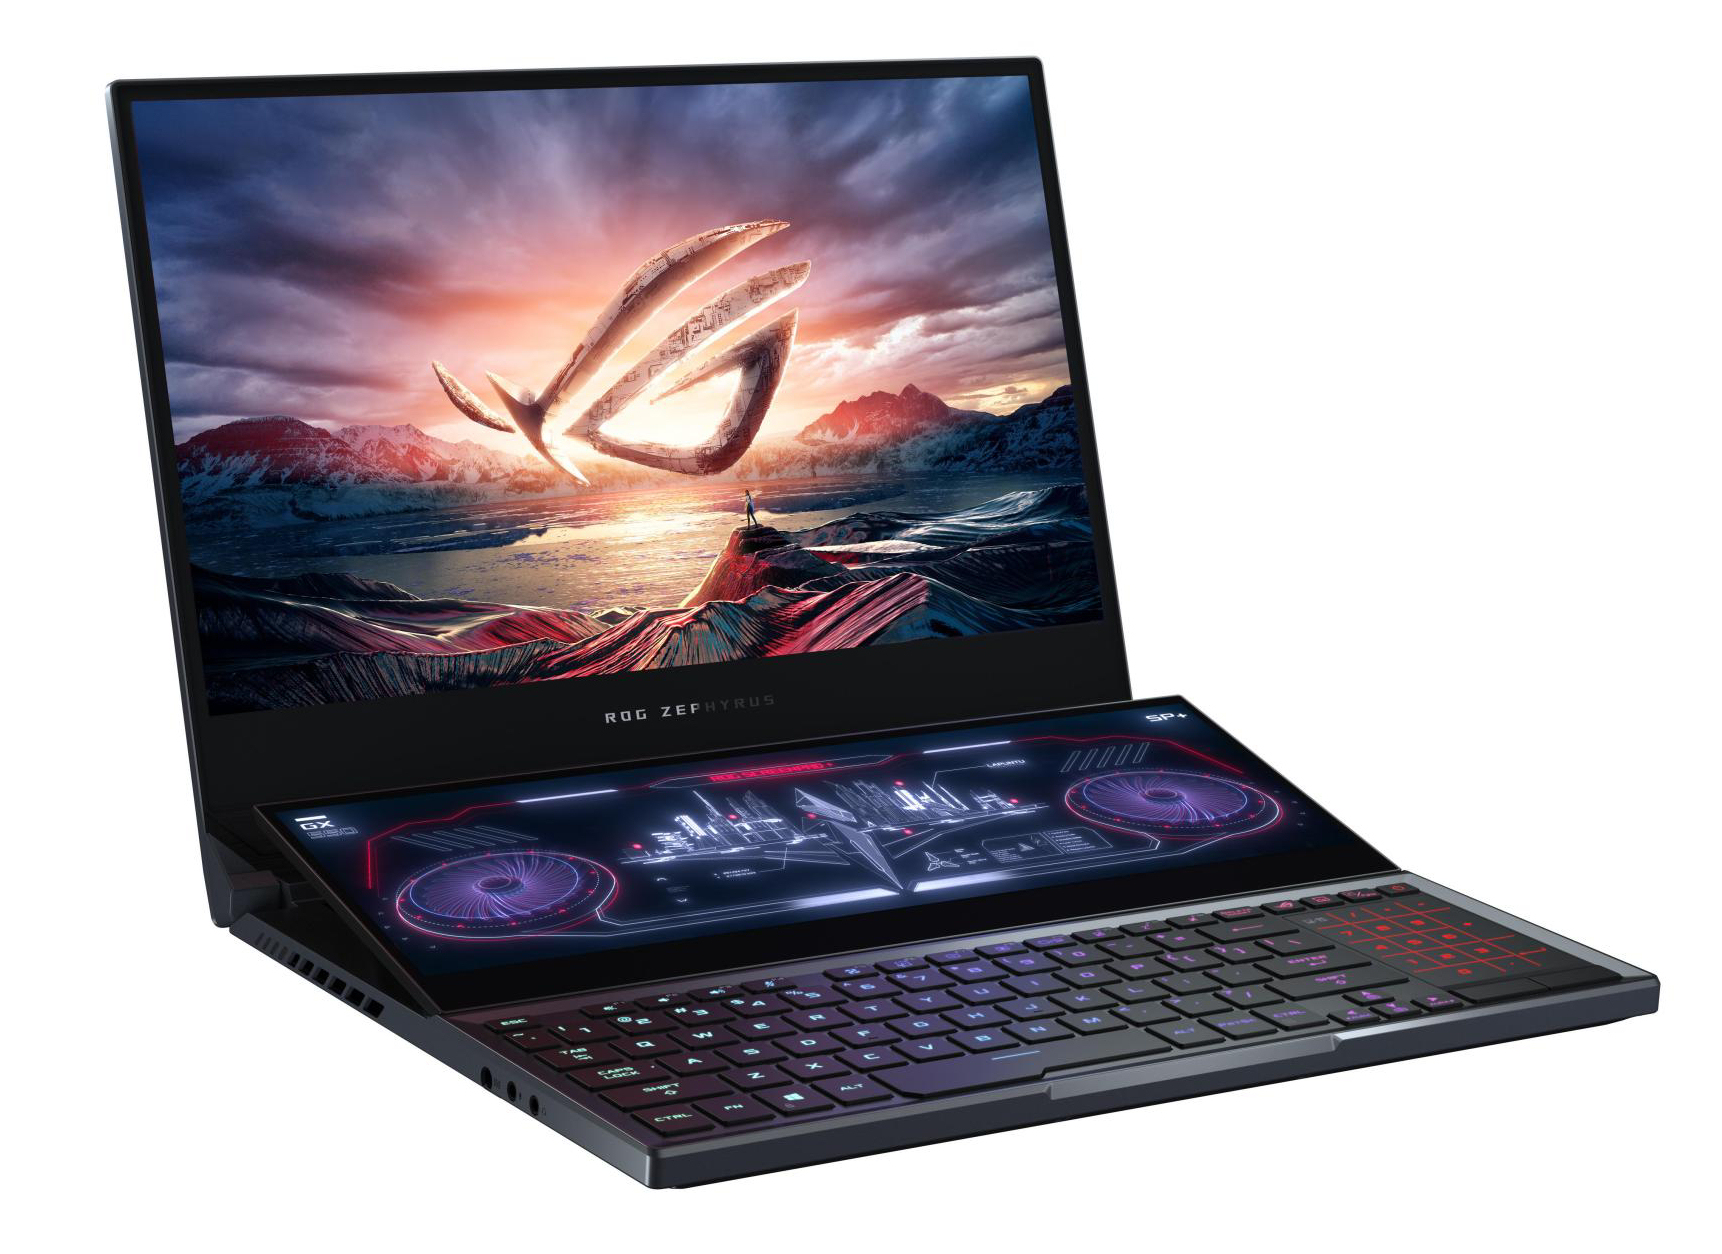
华硕ROG Zephyrus Duo 15 GX550LXS笔记本电脑评测:一台有着强劲性能的特殊游戏本
Rating | Date | Model | Weight | Height | Size | Resolution | Price |
|---|---|---|---|---|---|---|---|
| 84.5 % v7 (old) | 09 / 2020 | Asus ROG Zephyrus Duo 15 GX550LXS i9-10980HK, GeForce RTX 2080 Super Max-Q | 2.5 kg | 20 mm | 15.60" | 3840x2160 | |
v (old) | 06 / 2020 | Acer Predator Triton 500 PT515-52-70N3 i7-10750H, GeForce RTX 2080 Super Max-Q | 2.1 kg | 18 mm | 15.60" | 1920x1080 | |
| 82.8 % v7 (old) | 06 / 2020 | MSI GS66 Stealth 10SFS i9-10980HK, GeForce RTX 2070 Super Max-Q | 2.2 kg | 20 mm | 15.60" | 1920x1080 | |
| 85.8 % v7 (old) | 06 / 2020 | Gigabyte Aero 15 OLED XB-8DE51B0SP i7-10875H, GeForce RTX 2070 Super Max-Q | 2.2 kg | 20 mm | 15.60" | 3840x2160 |
| |||||||||||||||||||||||||
Brightness Distribution: 90 %
Center on Battery: 398 cd/m²
Contrast: 1421:1 (Black: 0.28 cd/m²)
ΔE ColorChecker Calman: 1.53 | ∀{0.5-29.43 Ø4.71}
calibrated: 0.77
ΔE Greyscale Calman: 2.4 | ∀{0.09-98 Ø4.96}
100% sRGB (Argyll 1.6.3 3D)
100% AdobeRGB 1998 (Argyll 1.6.3 3D)
99.9% AdobeRGB 1998 (Argyll 3D)
100% sRGB (Argyll 3D)
87% Display P3 (Argyll 3D)
Gamma: 2.19
CCT: 6996 K
| Asus ROG Zephyrus Duo 15 GX550LXS AU Optronics B156ZAN03.1, IPS, 3840x2160, 15.6" | Acer Predator Triton 500 PT515-52-70N3 AUO B156HAN12.0 (AUO7A8C), IPS, 1920x1080, 15.6" | MSI GS66 Stealth 10SFS AUO B156HAN12.0 (AUO328E), IPS, 1920x1080, 15.6" | Gigabyte Aero 15 OLED XB-8DE51B0SP Samsung SDCA029, OLED, 3840x2160, 15.6" | |
|---|---|---|---|---|
| Display | -16% | -16% | 4% | |
| Display P3 Coverage (%) | 87 | 70.3 -19% | 69.5 -20% | 99.9 15% |
| sRGB Coverage (%) | 100 | 99.5 0% | 99.6 0% | 100 0% |
| AdobeRGB 1998 Coverage (%) | 99.9 | 72.2 -28% | 70.8 -29% | 98.2 -2% |
| Response Times | 66% | 68% | 95% | |
| Response Time Grey 50% / Grey 80% * (ms) | 56.4 ? | 14.4 ? 74% | 14 ? 75% | 2.2 ? 96% |
| Response Time Black / White * (ms) | 24.4 ? | 10.4 ? 57% | 9.6 ? 61% | 1.8 ? 93% |
| PWM Frequency (Hz) | 60 ? | |||
| Screen | -48% | -31% | -30% | |
| Brightness middle (cd/m²) | 398 | 320 -20% | 316 -21% | 385 -3% |
| Brightness (cd/m²) | 385 | 318 -17% | 311 -19% | 390 1% |
| Brightness Distribution (%) | 90 | 88 -2% | 92 2% | 93 3% |
| Black Level * (cd/m²) | 0.28 | 0.24 14% | 0.21 25% | |
| Contrast (:1) | 1421 | 1333 -6% | 1505 6% | |
| Colorchecker dE 2000 * | 1.53 | 4.03 -163% | 3.03 -98% | 2.46 -61% |
| Colorchecker dE 2000 max. * | 3.69 | 8.43 -128% | 7.32 -98% | 4.01 -9% |
| Colorchecker dE 2000 calibrated * | 0.77 | 0.98 -27% | 1.1 -43% | 2.6 -238% |
| Greyscale dE 2000 * | 2.4 | 5.94 -148% | 3.9 -63% | 1.39 42% |
| Gamma | 2.19 100% | 2.42 91% | 2.42 91% | 2.31 95% |
| CCT | 6996 93% | 6751 96% | 7439 87% | 6395 102% |
| Color Space (Percent of AdobeRGB 1998) (%) | 100 | 66 -34% | 65 -35% | 98 -2% |
| Color Space (Percent of sRGB) (%) | 100 | 99 -1% | 100 0% | 100 0% |
| Total Average (Program / Settings) | 1% /
-28% | 7% /
-16% | 23% /
-5% |
* ... smaller is better
Display Response Times
| ↔ Response Time Black to White | ||
|---|---|---|
| 24.4 ms ... rise ↗ and fall ↘ combined | ↗ 10 ms rise | 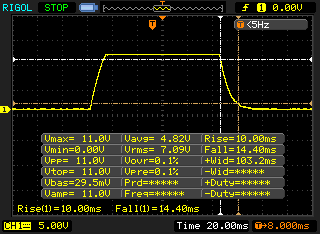 |
| ↘ 14.4 ms fall | ||
| The screen shows good response rates in our tests, but may be too slow for competitive gamers. In comparison, all tested devices range from 0.1 (minimum) to 240 (maximum) ms. » 58 % of all devices are better. This means that the measured response time is worse than the average of all tested devices (19.8 ms). | ||
| ↔ Response Time 50% Grey to 80% Grey | ||
| 56.4 ms ... rise ↗ and fall ↘ combined | ↗ 26.4 ms rise | 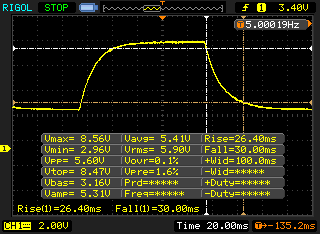 |
| ↘ 30 ms fall | ||
| The screen shows slow response rates in our tests and will be unsatisfactory for gamers. In comparison, all tested devices range from 0.165 (minimum) to 636 (maximum) ms. » 93 % of all devices are better. This means that the measured response time is worse than the average of all tested devices (30.9 ms). | ||
Screen Flickering / PWM (Pulse-Width Modulation)
| Screen flickering / PWM not detected | 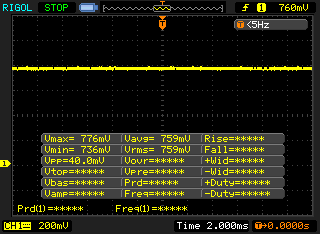 | ||
In comparison: 52 % of all tested devices do not use PWM to dim the display. If PWM was detected, an average of 7744 (minimum: 5 - maximum: 343500) Hz was measured. | |||
| Cinebench R15 | |
| CPU Single 64Bit | |
| Average of class Gaming (188.8 - 350, n=103, last 2 years) | |
| Asus ROG Zephyrus Duo 15 GX550LXS (Turbo) | |
| Gigabyte Aero 15 OLED XB-8DE51B0SP | |
| Average Intel Core i9-10980HK (198 - 219, n=15) | |
| Asus ROG Zephyrus Duo 15 GX550LXS | |
| MSI GS66 Stealth 10SFS | |
| Acer Predator Triton 500 PT515-52-70N3 | |
| CPU Multi 64Bit | |
| Average of class Gaming (1578 - 6330, n=102, last 2 years) | |
| Asus ROG Zephyrus Duo 15 GX550LXS (Turbo) | |
| Gigabyte Aero 15 OLED XB-8DE51B0SP | |
| Asus ROG Zephyrus Duo 15 GX550LXS | |
| Average Intel Core i9-10980HK (1606 - 1862, n=15) | |
| MSI GS66 Stealth 10SFS | |
| Acer Predator Triton 500 PT515-52-70N3 | |
| Blender - v2.79 BMW27 CPU | |
| Acer Predator Triton 500 PT515-52-70N3 | |
| MSI GS66 Stealth 10SFS | |
| Asus ROG Zephyrus Duo 15 GX550LXS (Turbo) | |
| Asus ROG Zephyrus Duo 15 GX550LXS | |
| Gigabyte Aero 15 OLED XB-8DE51B0SP | |
| Average Intel Core i9-10980HK (239 - 299, n=13) | |
| Average of class Gaming (79 - 330, n=101, last 2 years) | |
| 7-Zip 18.03 | |
| 7z b 4 -mmt1 | |
| Average of class Gaming (4824 - 7436, n=102, last 2 years) | |
| Gigabyte Aero 15 OLED XB-8DE51B0SP | |
| Average Intel Core i9-10980HK (5081 - 5542, n=13) | |
| Asus ROG Zephyrus Duo 15 GX550LXS | |
| MSI GS66 Stealth 10SFS | |
| Asus ROG Zephyrus Duo 15 GX550LXS (Turbo) | |
| Acer Predator Triton 500 PT515-52-70N3 | |
| 7z b 4 | |
| Average of class Gaming (33491 - 148086, n=102, last 2 years) | |
| Asus ROG Zephyrus Duo 15 GX550LXS | |
| Gigabyte Aero 15 OLED XB-8DE51B0SP | |
| Average Intel Core i9-10980HK (43786 - 49275, n=13) | |
| Asus ROG Zephyrus Duo 15 GX550LXS (Turbo) | |
| MSI GS66 Stealth 10SFS | |
| Acer Predator Triton 500 PT515-52-70N3 | |
| HWBOT x265 Benchmark v2.2 - 4k Preset | |
| Average of class Gaming (11.5 - 44.4, n=102, last 2 years) | |
| Gigabyte Aero 15 OLED XB-8DE51B0SP | |
| Average Intel Core i9-10980HK (12 - 14.6, n=13) | |
| Asus ROG Zephyrus Duo 15 GX550LXS | |
| Asus ROG Zephyrus Duo 15 GX550LXS (Turbo) | |
| MSI GS66 Stealth 10SFS | |
| Acer Predator Triton 500 PT515-52-70N3 | |
| LibreOffice - 20 Documents To PDF | |
| Asus ROG Zephyrus Duo 15 GX550LXS | |
| Average Intel Core i9-10980HK (44 - 89, n=13) | |
| MSI GS66 Stealth 10SFS | |
| Gigabyte Aero 15 OLED XB-8DE51B0SP | |
| Acer Predator Triton 500 PT515-52-70N3 | |
| Average of class Gaming (33.2 - 88.8, n=102, last 2 years) | |
| Asus ROG Zephyrus Duo 15 GX550LXS (Turbo) | |
| R Benchmark 2.5 - Overall mean | |
| Acer Predator Triton 500 PT515-52-70N3 | |
| Asus ROG Zephyrus Duo 15 GX550LXS (Turbo) | |
| MSI GS66 Stealth 10SFS | |
| Asus ROG Zephyrus Duo 15 GX550LXS | |
| Average Intel Core i9-10980HK (0.561 - 0.596, n=13) | |
| Gigabyte Aero 15 OLED XB-8DE51B0SP | |
| Average of class Gaming (0.3439 - 0.59, n=102, last 2 years) | |
* ... smaller is better
| PCMark 8 Home Score Accelerated v2 | 3821 points | |
| PCMark 8 Creative Score Accelerated v2 | 4210 points | |
| PCMark 8 Work Score Accelerated v2 | 4762 points | |
| PCMark 10 Score | 5277 points | |
Help | ||
| PCMark 8 | |
| Home Score Accelerated v2 | |
| Average of class Gaming (n=1last 2 years) | |
| Asus ROG Zephyrus Duo 15 GX550LXS | |
| Average Intel Core i9-10980HK, NVIDIA GeForce RTX 2080 Super Max-Q (n=1) | |
| Work Score Accelerated v2 | |
| Asus ROG Zephyrus Duo 15 GX550LXS | |
| Average Intel Core i9-10980HK, NVIDIA GeForce RTX 2080 Super Max-Q (n=1) | |
| Average of class Gaming (n=1last 2 years) | |
| DPC Latencies / LatencyMon - interrupt to process latency (max), Web, Youtube, Prime95 | |
| Acer Predator Triton 500 PT515-52-70N3 | |
| Asus ROG Zephyrus Duo 15 GX550LXS | |
| MSI GS66 Stealth 10SFS | |
| Gigabyte Aero 15 OLED XB-8DE51B0SP | |
* ... smaller is better

| Asus ROG Zephyrus Duo 15 GX550LXS 2x Samsung PM981a MZVLB1T0HBLR (RAID 0) | Acer Predator Triton 500 PT515-52-70N3 Samsung SSD PM981a MZVLB512HBJQ | MSI GS66 Stealth 10SFS Samsung SSD PM981 MZVLB1T0HALR | Gigabyte Aero 15 OLED XB-8DE51B0SP Intel Optane Memory H10 with Solid State Storage 32GB + 512GB HBRPEKNX0202A(L/H) | Average 2x Samsung PM981a MZVLB1T0HBLR (RAID 0) | |
|---|---|---|---|---|---|
| CrystalDiskMark 5.2 / 6 | -8% | -13% | -4% | 23% | |
| Write 4K (MB/s) | 127.6 | 131.7 3% | 131.3 3% | 127.4 0% | 175.9 ? 38% |
| Read 4K (MB/s) | 48.4 | 47.34 -2% | 45.84 -5% | 147.5 205% | 49.7 ? 3% |
| Write Seq (MB/s) | 2958 | 2884 -3% | 2370 -20% | 485.9 -84% | 4078 ? 38% |
| Read Seq (MB/s) | 2984 | 2303 -23% | 1509 -49% | 1352 -55% | 3653 ? 22% |
| Write 4K Q32T1 (MB/s) | 472.7 | 423.9 -10% | 481.5 2% | 476.5 1% | 540 ? 14% |
| Read 4K Q32T1 (MB/s) | 529 | 487.7 -8% | 560 6% | 531 0% | 456 ? -14% |
| Write Seq Q32T1 (MB/s) | 3431 | 2822 -18% | 2392 -30% | 1061 -69% | 4457 ? 30% |
| Read Seq Q32T1 (MB/s) | 3536 | 3478 -2% | 3232 -9% | 2552 -28% | 5307 ? 50% |
| AS SSD | 2% | -1% | -36% | 9% | |
| Seq Read (MB/s) | 2981 | 2767 -7% | 1065 -64% | 1200 -60% | 3515 ? 18% |
| Seq Write (MB/s) | 2783 | 2613 -6% | 2360 -15% | 836 -70% | 2878 ? 3% |
| 4K Read (MB/s) | 43.98 | 47.55 8% | 48.09 9% | 65.8 50% | 48.4 ? 10% |
| 4K Write (MB/s) | 113.9 | 98.9 -13% | 110.7 -3% | 103.8 -9% | 165.6 ? 45% |
| 4K-64 Read (MB/s) | 1519 | 1205 -21% | 1635 8% | 789 -48% | 1419 ? -7% |
| 4K-64 Write (MB/s) | 1296 | 2007 55% | 1829 41% | 929 -28% | 1348 ? 4% |
| Access Time Read * (ms) | 0.062 | 0.065 -5% | 0.071 -15% | 0.103 -66% | 0.0455 ? 27% |
| Access Time Write * (ms) | 0.033 | 0.038 -15% | 0.034 -3% | 0.045 -36% | 0.04375 ? -33% |
| Score Read (Points) | 1861 | 1529 -18% | 1790 -4% | 975 -48% | 1818 ? -2% |
| Score Write (Points) | 1688 | 2367 40% | 2176 29% | 1117 -34% | 1801 ? 7% |
| Score Total (Points) | 4492 | 4677 4% | 4950 10% | 2594 -42% | 4521 ? 1% |
| Copy ISO MB/s (MB/s) | 2438 | 2919 ? 20% | |||
| Copy Program MB/s (MB/s) | 604 | 706 ? 17% | |||
| Copy Game MB/s (MB/s) | 1404 | 1560 ? 11% | |||
| Total Average (Program / Settings) | -3% /
-2% | -7% /
-6% | -20% /
-22% | 16% /
14% |
* ... smaller is better
Continuous read performance: DiskSpd Read Loop, Queue Depth 8
| 3DMark 11 Performance | 23526 points | |
| 3DMark Cloud Gate Standard Score | 44534 points | |
| 3DMark Fire Strike Score | 17714 points | |
| 3DMark Time Spy Score | 7780 points | |
Help | ||
| 3DMark 11 - 1280x720 Performance GPU | |
| Average of class Gaming (21841 - 80022, n=103, last 2 years) | |
| Asus ROG Zephyrus Duo 15 GX550LXS (Turbo) | |
| Acer Predator Triton 500 PT515-52-70N3 | |
| Average NVIDIA GeForce RTX 2080 Super Max-Q (26292 - 32995, n=10) | |
| Gigabyte Aero 15 OLED XB-8DE51B0SP | |
| Asus ROG Zephyrus Duo 15 GX550LXS | |
| MSI GS66 Stealth 10SFS | |
| 3DMark | |
| 1920x1080 Fire Strike Graphics | |
| Average of class Gaming (18629 - 62849, n=112, last 2 years) | |
| Asus ROG Zephyrus Duo 15 GX550LXS (Turbo) | |
| Acer Predator Triton 500 PT515-52-70N3 | |
| Average NVIDIA GeForce RTX 2080 Super Max-Q (19655 - 23649, n=10) | |
| Gigabyte Aero 15 OLED XB-8DE51B0SP | |
| Asus ROG Zephyrus Duo 15 GX550LXS | |
| MSI GS66 Stealth 10SFS | |
| 2560x1440 Time Spy Graphics | |
| Average of class Gaming (6387 - 26212, n=112, last 2 years) | |
| Asus ROG Zephyrus Duo 15 GX550LXS (Turbo) | |
| Acer Predator Triton 500 PT515-52-70N3 | |
| Average NVIDIA GeForce RTX 2080 Super Max-Q (7372 - 8979, n=11) | |
| Gigabyte Aero 15 OLED XB-8DE51B0SP | |
| Asus ROG Zephyrus Duo 15 GX550LXS | |
| MSI GS66 Stealth 10SFS | |
| The Witcher 3 - 1920x1080 Ultra Graphics & Postprocessing (HBAO+) | |
| Average of class Gaming (104.7 - 240, n=7, last 2 years) | |
| Asus ROG Zephyrus Duo 15 GX550LXS (Turbo) | |
| Average NVIDIA GeForce RTX 2080 Super Max-Q (74.3 - 96, n=11) | |
| Acer Predator Triton 500 PT515-52-70N3 | |
| Gigabyte Aero 15 OLED XB-8DE51B0SP | |
| Asus ROG Zephyrus Duo 15 GX550LXS | |
| MSI GS66 Stealth 10SFS | |
| BioShock Infinite - 1920x1080 Ultra Preset, DX11 (DDOF) | |
| Asus ROG Zephyrus Duo 15 GX550LXS (Turbo) | |
| Average NVIDIA GeForce RTX 2080 Super Max-Q (170.2 - 181.1, n=4) | |
| Asus ROG Zephyrus Duo 15 GX550LXS | |
| Doom Eternal - 1920x1080 Ultra Preset | |
| Asus ROG Zephyrus Duo 15 GX550LXS (Turbo) | |
| Average NVIDIA GeForce RTX 2080 Super Max-Q (140 - 177.7, n=8) | |
| Asus ROG Zephyrus Duo 15 GX550LXS | |
| Acer Predator Triton 500 PT515-52-70N3 | |
| MSI GS66 Stealth 10SFS | |
| Red Dead Redemption 2 - 1920x1080 Maximum Settings | |
| Asus ROG Zephyrus Duo 15 GX550LXS | |
| Acer Predator Triton 500 PT515-52-70N3 | |
| Average NVIDIA GeForce RTX 2080 Super Max-Q (40.6 - 45, n=5) | |
| Gigabyte Aero 15 OLED XB-8DE51B0SP | |
| Call of Duty Modern Warfare 2019 - 1920x1080 Maximum Settings AA:T2X Filmic SM | |
| Acer Predator Triton 500 PT515-52-70N3 | |
| Average NVIDIA GeForce RTX 2080 Super Max-Q (91.2 - 107, n=4) | |
| Asus ROG Zephyrus Duo 15 GX550LXS | |
| Far Cry 5 - 1920x1080 Ultra Preset AA:T | |
| Average of class Gaming (70 - 151, n=6, last 2 years) | |
| Asus ROG Zephyrus Duo 15 GX550LXS | |
| Average NVIDIA GeForce RTX 2080 Super Max-Q (91 - 110, n=4) | |
| Shadow of the Tomb Raider - 1920x1080 Highest Preset AA:T | |
| Average of class Gaming (96 - 116, n=2, last 2 years) | |
| Gigabyte Aero 15 OLED XB-8DE51B0SP | |
| Acer Predator Triton 500 PT515-52-70N3 | |
| Average NVIDIA GeForce RTX 2080 Super Max-Q (89 - 106, n=10) | |
| MSI GS66 Stealth 10SFS | |
| Asus ROG Zephyrus Duo 15 GX550LXS (Turbo) | |
| Asus ROG Zephyrus Duo 15 GX550LXS | |
| low | med. | high | ultra | QHD | 4K | |
|---|---|---|---|---|---|---|
| BioShock Infinite (2013) | 425.1 | 349.2 | 324.2 | 173.1 | ||
| The Witcher 3 (2015) | 330.5 | 237 | 143.4 | 75.8 | 53.5 | |
| Far Cry 5 (2018) | 143 | 115 | 108 | 102 | 77 | 42 |
| Shadow of the Tomb Raider (2018) | 103 | 95 | 93 | 89 | 67 | 36 |
| Total War: Three Kingdoms (2019) | 245.5 | 136.4 | 86.5 | 62.5 | 39.9 | 19.6 |
| Ghost Recon Breakpoint (2019) | 128 | 93 | 87 | 65 | 49 | 29 |
| Call of Duty Modern Warfare 2019 (2019) | 172.3 | 123.6 | 104.3 | 91.2 | 64.7 | 36.3 |
| Red Dead Redemption 2 (2019) | 131.4 | 99.7 | 68.3 | 44.9 | 36.2 | 23.5 |
| Doom Eternal (2020) | 205 | 168.3 | 154 | 152.1 | 116.7 | 64 |
| Gears Tactics (2020) | 210.4 | 161.2 | 110.6 | 89.7 | 57.9 | 30.3 |
| F1 2020 (2020) | 253 | 167 | 149 | 118 | 89 | 51 |
Noise level
| Idle |
| 33 / 34 / 35 dB(A) |
| Load |
| 48 / 49 dB(A) |
 | ||
30 dB silent 40 dB(A) audible 50 dB(A) loud |
||
min: | ||
| Asus ROG Zephyrus Duo 15 GX550LXS i9-10980HK, GeForce RTX 2080 Super Max-Q | Acer Predator Triton 500 PT515-52-70N3 i7-10750H, GeForce RTX 2080 Super Max-Q | MSI GS66 Stealth 10SFS i9-10980HK, GeForce RTX 2070 Super Max-Q | Gigabyte Aero 15 OLED XB-8DE51B0SP i7-10875H, GeForce RTX 2070 Super Max-Q | Average NVIDIA GeForce RTX 2080 Super Max-Q | Average of class Gaming | |
|---|---|---|---|---|---|---|
| Noise | 0% | -4% | -5% | 4% | 12% | |
| off / environment * (dB) | 30 | 30 -0% | 30 -0% | 30 -0% | 27.9 ? 7% | 24.1 ? 20% |
| Idle Minimum * (dB) | 33 | 30 9% | 32 3% | 34 -3% | 29.7 ? 10% | 25.9 ? 22% |
| Idle Average * (dB) | 34 | 33 3% | 34 -0% | 36 -6% | 30.8 ? 9% | 27.4 ? 19% |
| Idle Maximum * (dB) | 35 | 36 -3% | 39 -11% | 41 -17% | 35.4 ? -1% | 30.1 ? 14% |
| Load Average * (dB) | 48 | 50 -4% | 53 -10% | 48 -0% | 47.2 ? 2% | 43.7 ? 9% |
| Witcher 3 ultra * (dB) | 48 | 48 -0% | 48 -0% | 48 -0% | ||
| Load Maximum * (dB) | 49 | 50 -2% | 53 -8% | 54 -10% | 49.6 ? -1% | 54.3 ? -11% |
* ... smaller is better
(±) The maximum temperature on the upper side is 43 °C / 109 F, compared to the average of 40.4 °C / 105 F, ranging from 21.2 to 68.8 °C for the class Gaming.
(-) The bottom heats up to a maximum of 53 °C / 127 F, compared to the average of 43.2 °C / 110 F
(+) In idle usage, the average temperature for the upper side is 29.4 °C / 85 F, compared to the device average of 33.9 °C / 93 F.
(-) Playing The Witcher 3, the average temperature for the upper side is 40.1 °C / 104 F, compared to the device average of 33.9 °C / 93 F.
(-) The palmrests and touchpad can get very hot to the touch with a maximum of 44 °C / 111.2 F.
(-) The average temperature of the palmrest area of similar devices was 28.8 °C / 83.8 F (-15.2 °C / -27.4 F).
| Asus ROG Zephyrus Duo 15 GX550LXS i9-10980HK, GeForce RTX 2080 Super Max-Q | Acer Predator Triton 500 PT515-52-70N3 i7-10750H, GeForce RTX 2080 Super Max-Q | MSI GS66 Stealth 10SFS i9-10980HK, GeForce RTX 2070 Super Max-Q | Gigabyte Aero 15 OLED XB-8DE51B0SP i7-10875H, GeForce RTX 2070 Super Max-Q | Average NVIDIA GeForce RTX 2080 Super Max-Q | Average of class Gaming | |
|---|---|---|---|---|---|---|
| Heat | 3% | -2% | -2% | -1% | -1% | |
| Maximum Upper Side * (°C) | 43 | 44 -2% | 53 -23% | 49 -14% | 47.9 ? -11% | 45.1 ? -5% |
| Maximum Bottom * (°C) | 53 | 50 6% | 55 -4% | 61 -15% | 51.9 ? 2% | 48.1 ? 9% |
| Idle Upper Side * (°C) | 32 | 29 9% | 28 12% | 27 16% | 30 ? 6% | 31 ? 3% |
| Idle Bottom * (°C) | 31 | 31 -0% | 29 6% | 29 6% | 31 ? -0% | 34.2 ? -10% |
* ... smaller is better
Asus ROG Zephyrus Duo 15 GX550LXS audio analysis
(+) | speakers can play relatively loud (87 dB)
Bass 100 - 315 Hz
(-) | nearly no bass - on average 15.2% lower than median
(+) | bass is linear (6.2% delta to prev. frequency)
Mids 400 - 2000 Hz
(+) | balanced mids - only 3.8% away from median
(+) | mids are linear (5.2% delta to prev. frequency)
Highs 2 - 16 kHz
(±) | higher highs - on average 5.6% higher than median
(+) | highs are linear (4.5% delta to prev. frequency)
Overall 100 - 16.000 Hz
(+) | overall sound is linear (14.5% difference to median)
Compared to same class
» 27% of all tested devices in this class were better, 7% similar, 66% worse
» The best had a delta of 6%, average was 18%, worst was 132%
Compared to all devices tested
» 19% of all tested devices were better, 4% similar, 77% worse
» The best had a delta of 4%, average was 23%, worst was 134%
| Off / Standby | |
| Idle | |
| Load |
|
Key:
min: | |
| Asus ROG Zephyrus Duo 15 GX550LXS i9-10980HK, GeForce RTX 2080 Super Max-Q | Acer Predator Triton 500 PT515-52-70N3 i7-10750H, GeForce RTX 2080 Super Max-Q | MSI GS66 Stealth 10SFS i9-10980HK, GeForce RTX 2070 Super Max-Q | Gigabyte Aero 15 OLED XB-8DE51B0SP i7-10875H, GeForce RTX 2070 Super Max-Q | Average NVIDIA GeForce RTX 2080 Super Max-Q | Average of class Gaming | |
|---|---|---|---|---|---|---|
| Power Consumption | 31% | 23% | 10% | 28% | 24% | |
| Idle Minimum * (Watt) | 23 | 11 52% | 13 43% | 18 22% | 12.9 ? 44% | 13.1 ? 43% |
| Idle Average * (Watt) | 30 | 15 50% | 16 47% | 21 30% | 17.3 ? 42% | 19 ? 37% |
| Idle Maximum * (Watt) | 39 | 25 36% | 27 31% | 38 3% | 26.9 ? 31% | 24.6 ? 37% |
| Load Average * (Watt) | 156 | 95 39% | 109 30% | 113 28% | 123.9 ? 21% | 111.3 ? 29% |
| Witcher 3 ultra * (Watt) | 152 | 140 8% | 155 -2% | 149 2% | ||
| Load Maximum * (Watt) | 208 | 211 -1% | 236 -13% | 256 -23% | 205 ? 1% | 260 ? -25% |
* ... smaller is better
| Asus ROG Zephyrus Duo 15 GX550LXS i9-10980HK, GeForce RTX 2080 Super Max-Q, 90 Wh | Acer Predator Triton 500 PT515-52-70N3 i7-10750H, GeForce RTX 2080 Super Max-Q, 84 Wh | MSI GS66 Stealth 10SFS i9-10980HK, GeForce RTX 2070 Super Max-Q, 99.99 Wh | Gigabyte Aero 15 OLED XB-8DE51B0SP i7-10875H, GeForce RTX 2070 Super Max-Q, 94.2 Wh | Average of class Gaming | |
|---|---|---|---|---|---|
| Battery runtime | 38% | 48% | 79% | 51% | |
| Reader / Idle (h) | 8 | 8.3 4% | 8.4 5% | 8.6 8% | 7.84 ? -2% |
| H.264 (h) | 5.4 | 8.27 ? 53% | |||
| WiFi v1.3 (h) | 3.1 | 6.3 103% | 6.1 97% | 6.1 97% | 7.08 ? 128% |
| Load (h) | 1.2 | 1.3 8% | 1.7 42% | 2.8 133% | 1.496 ? 25% |
Pros
Cons
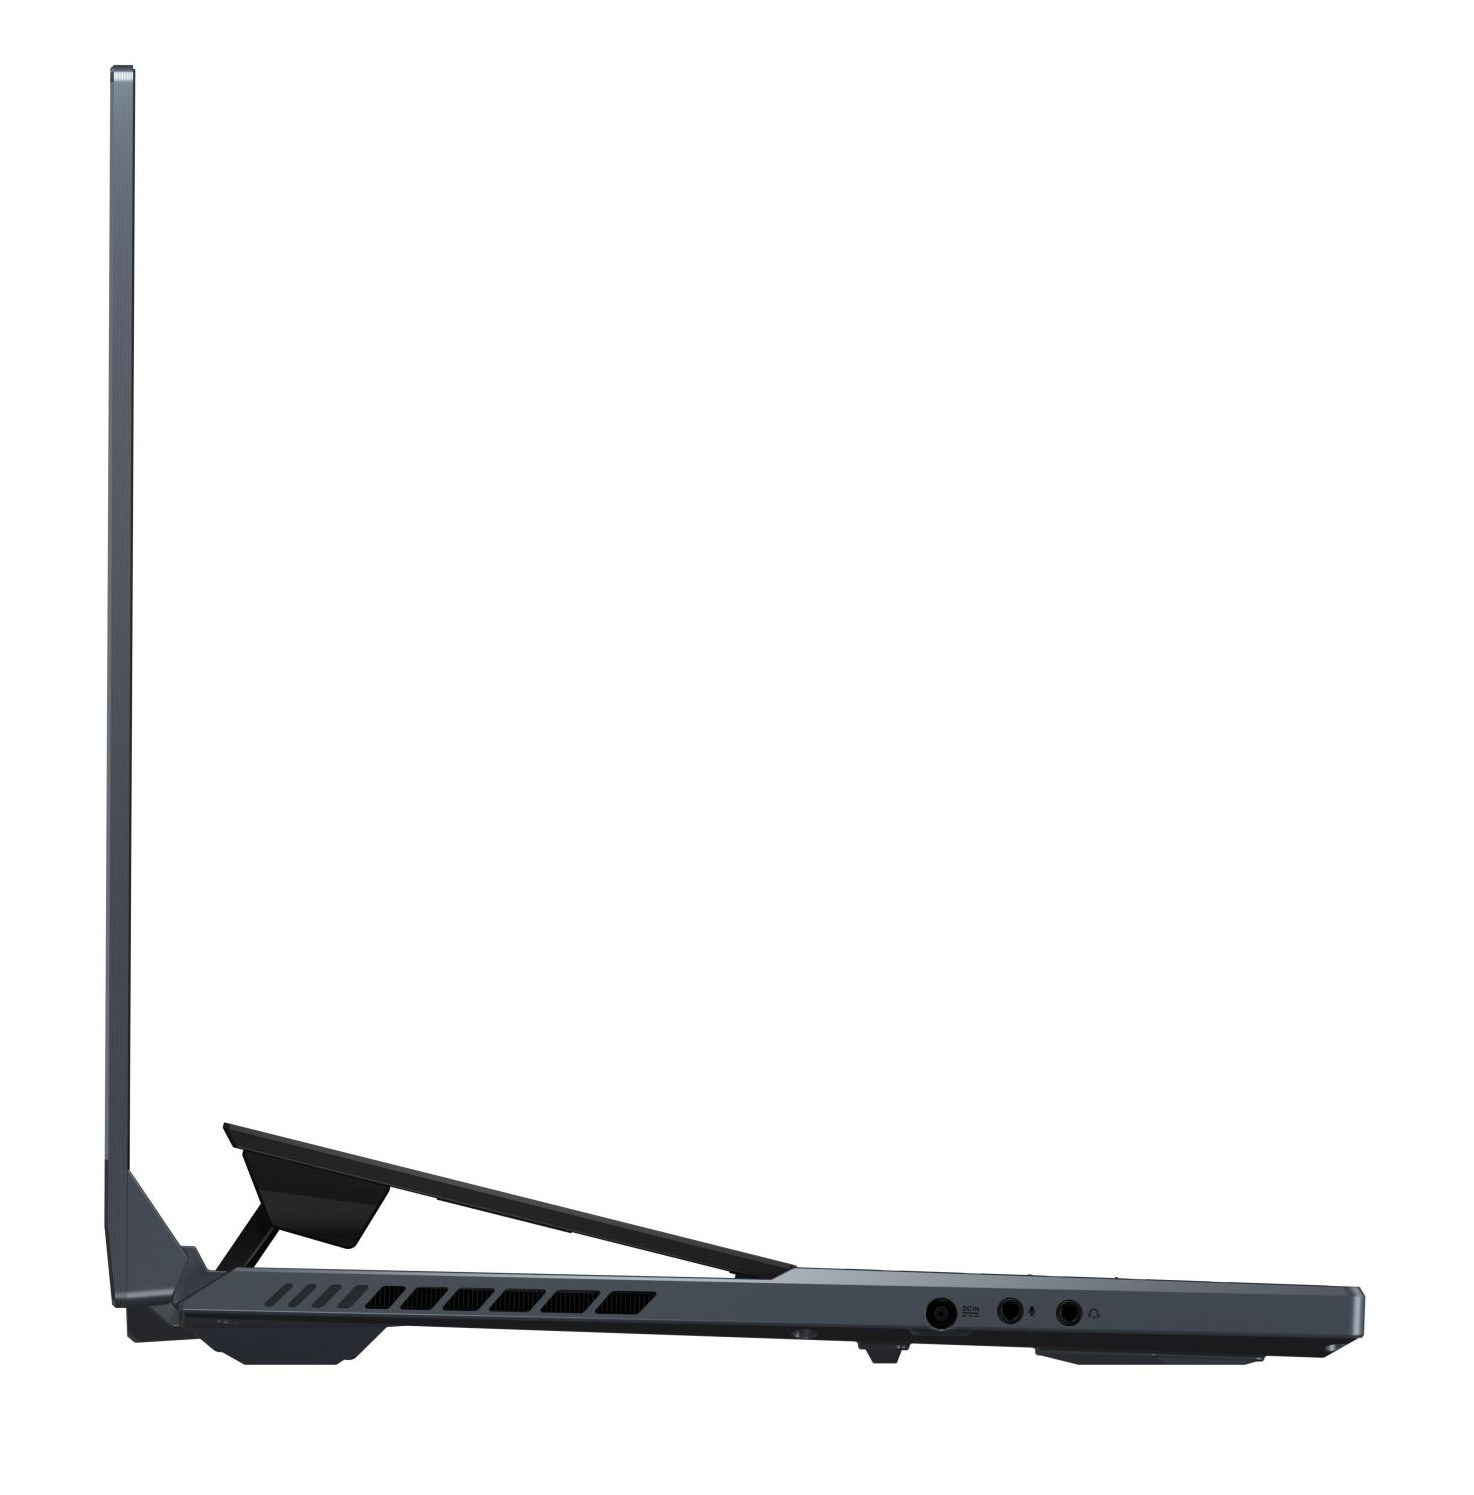
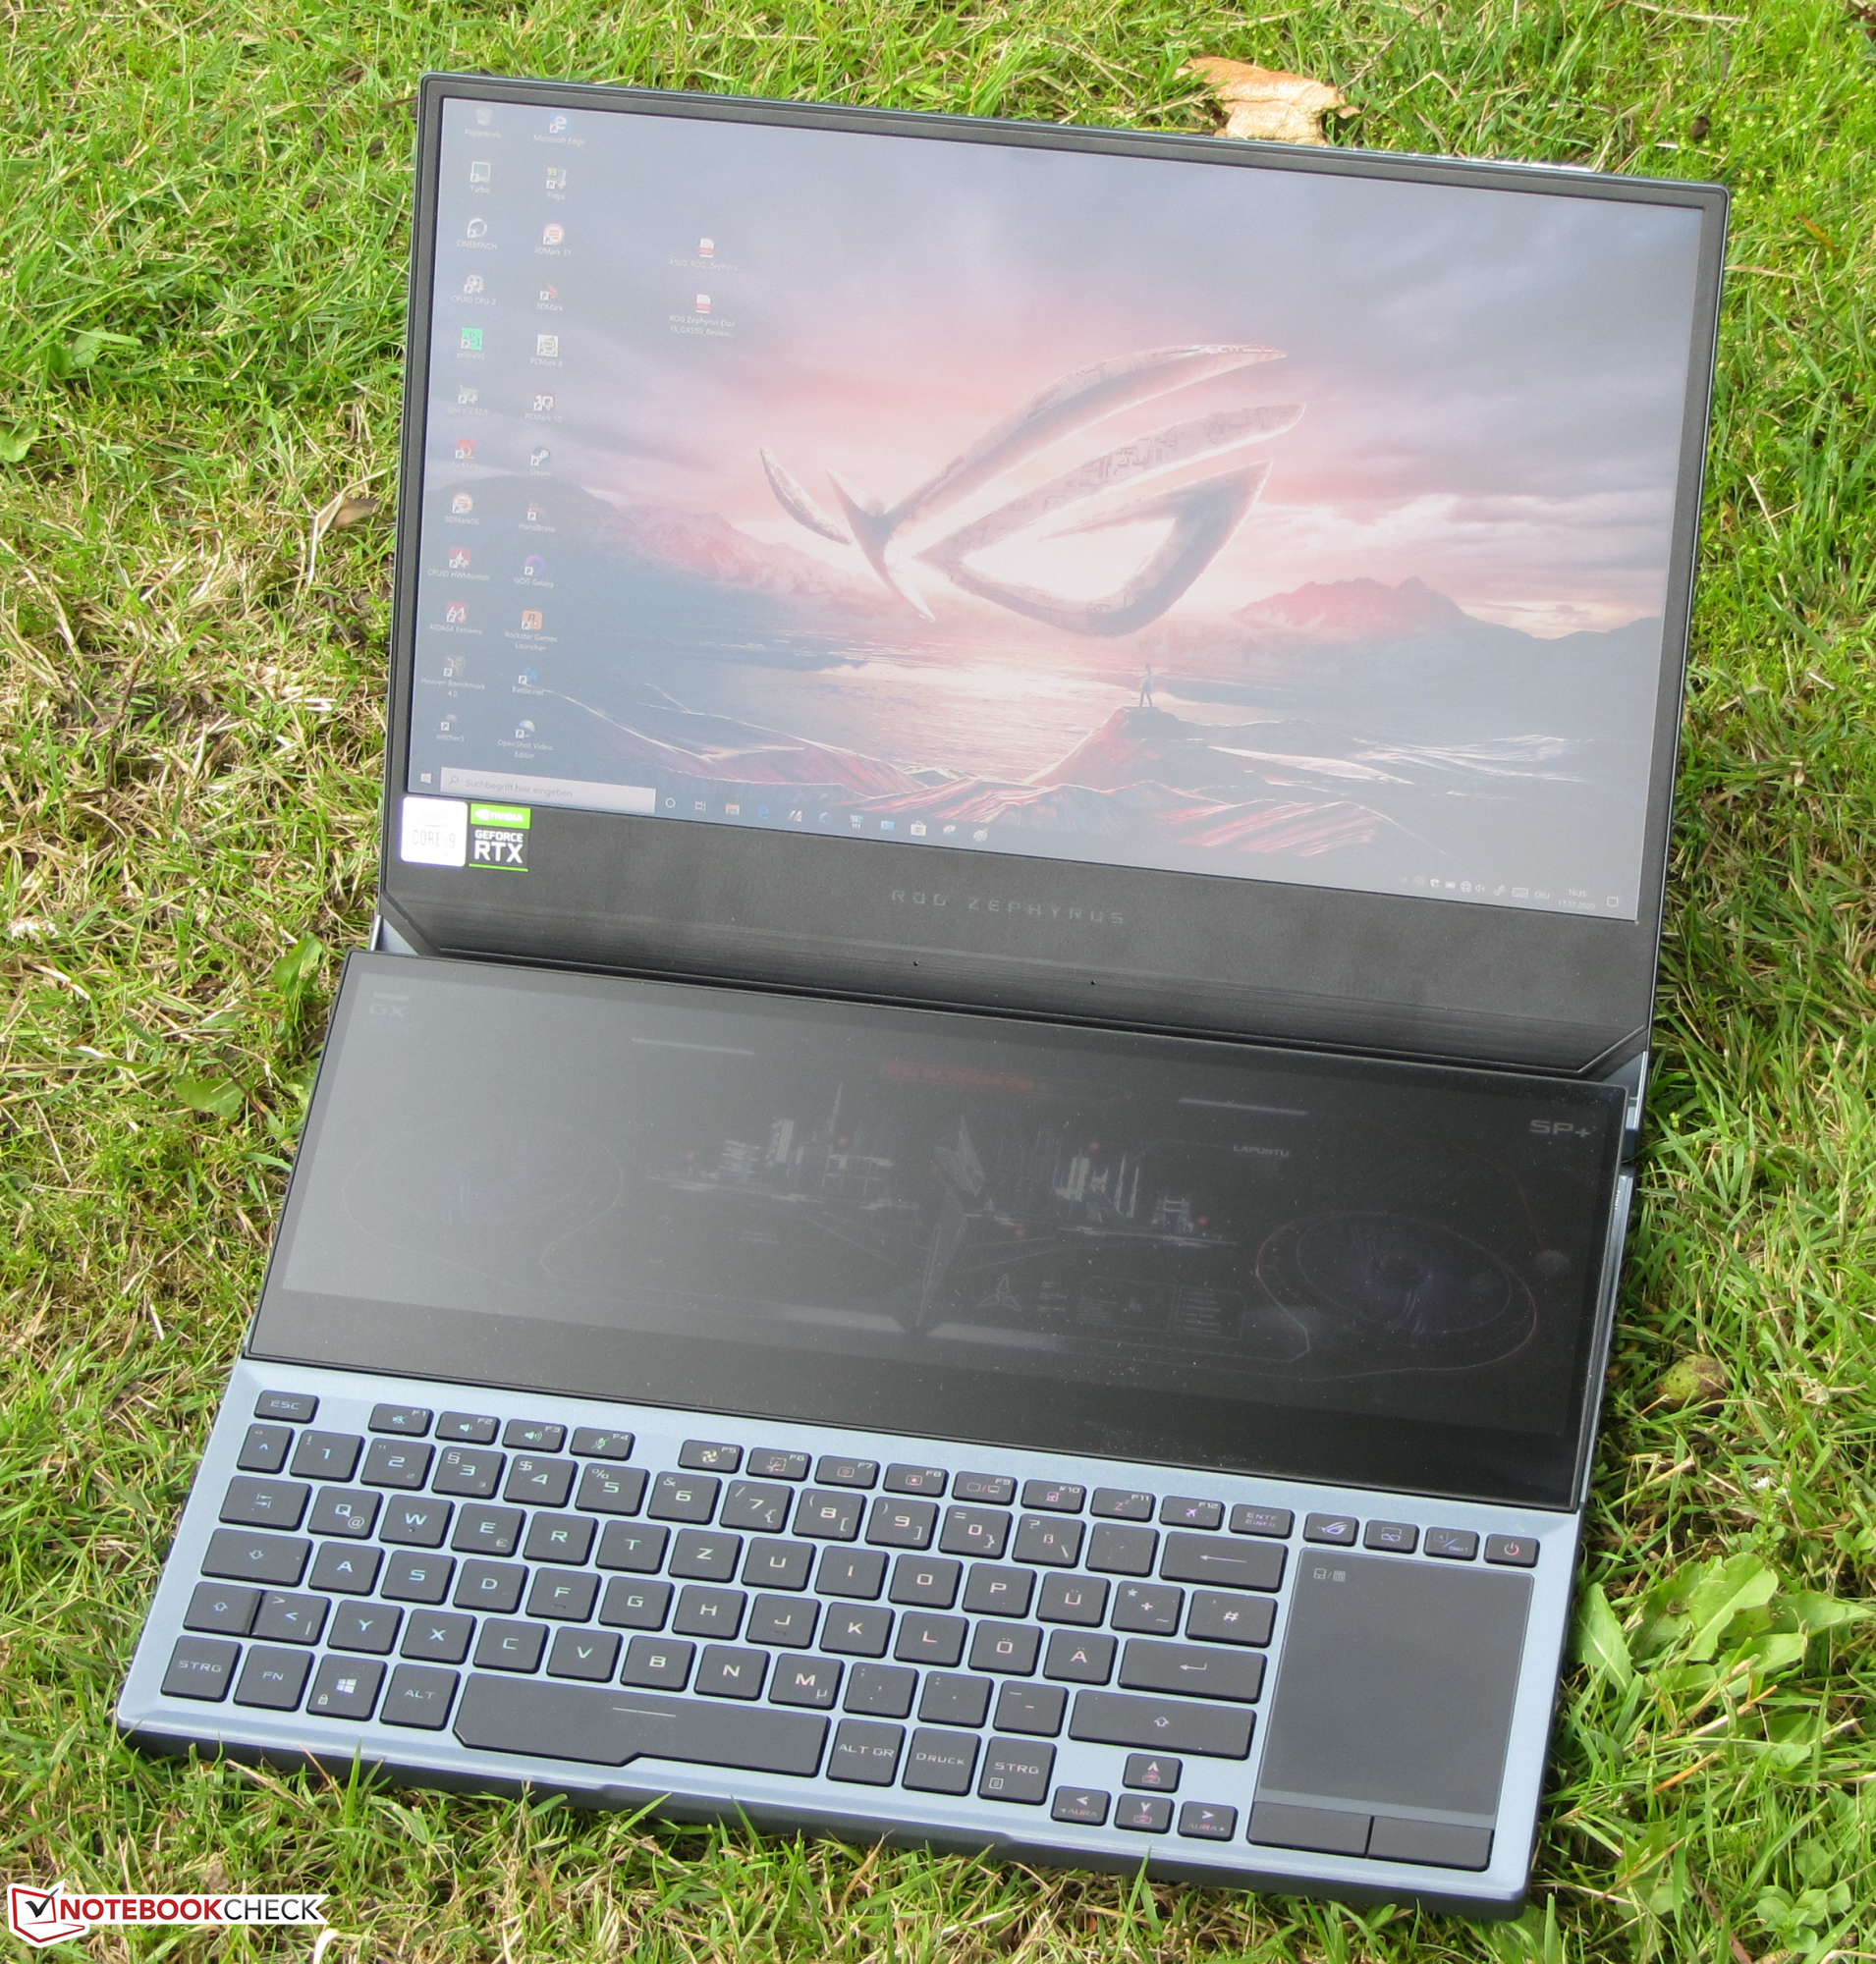
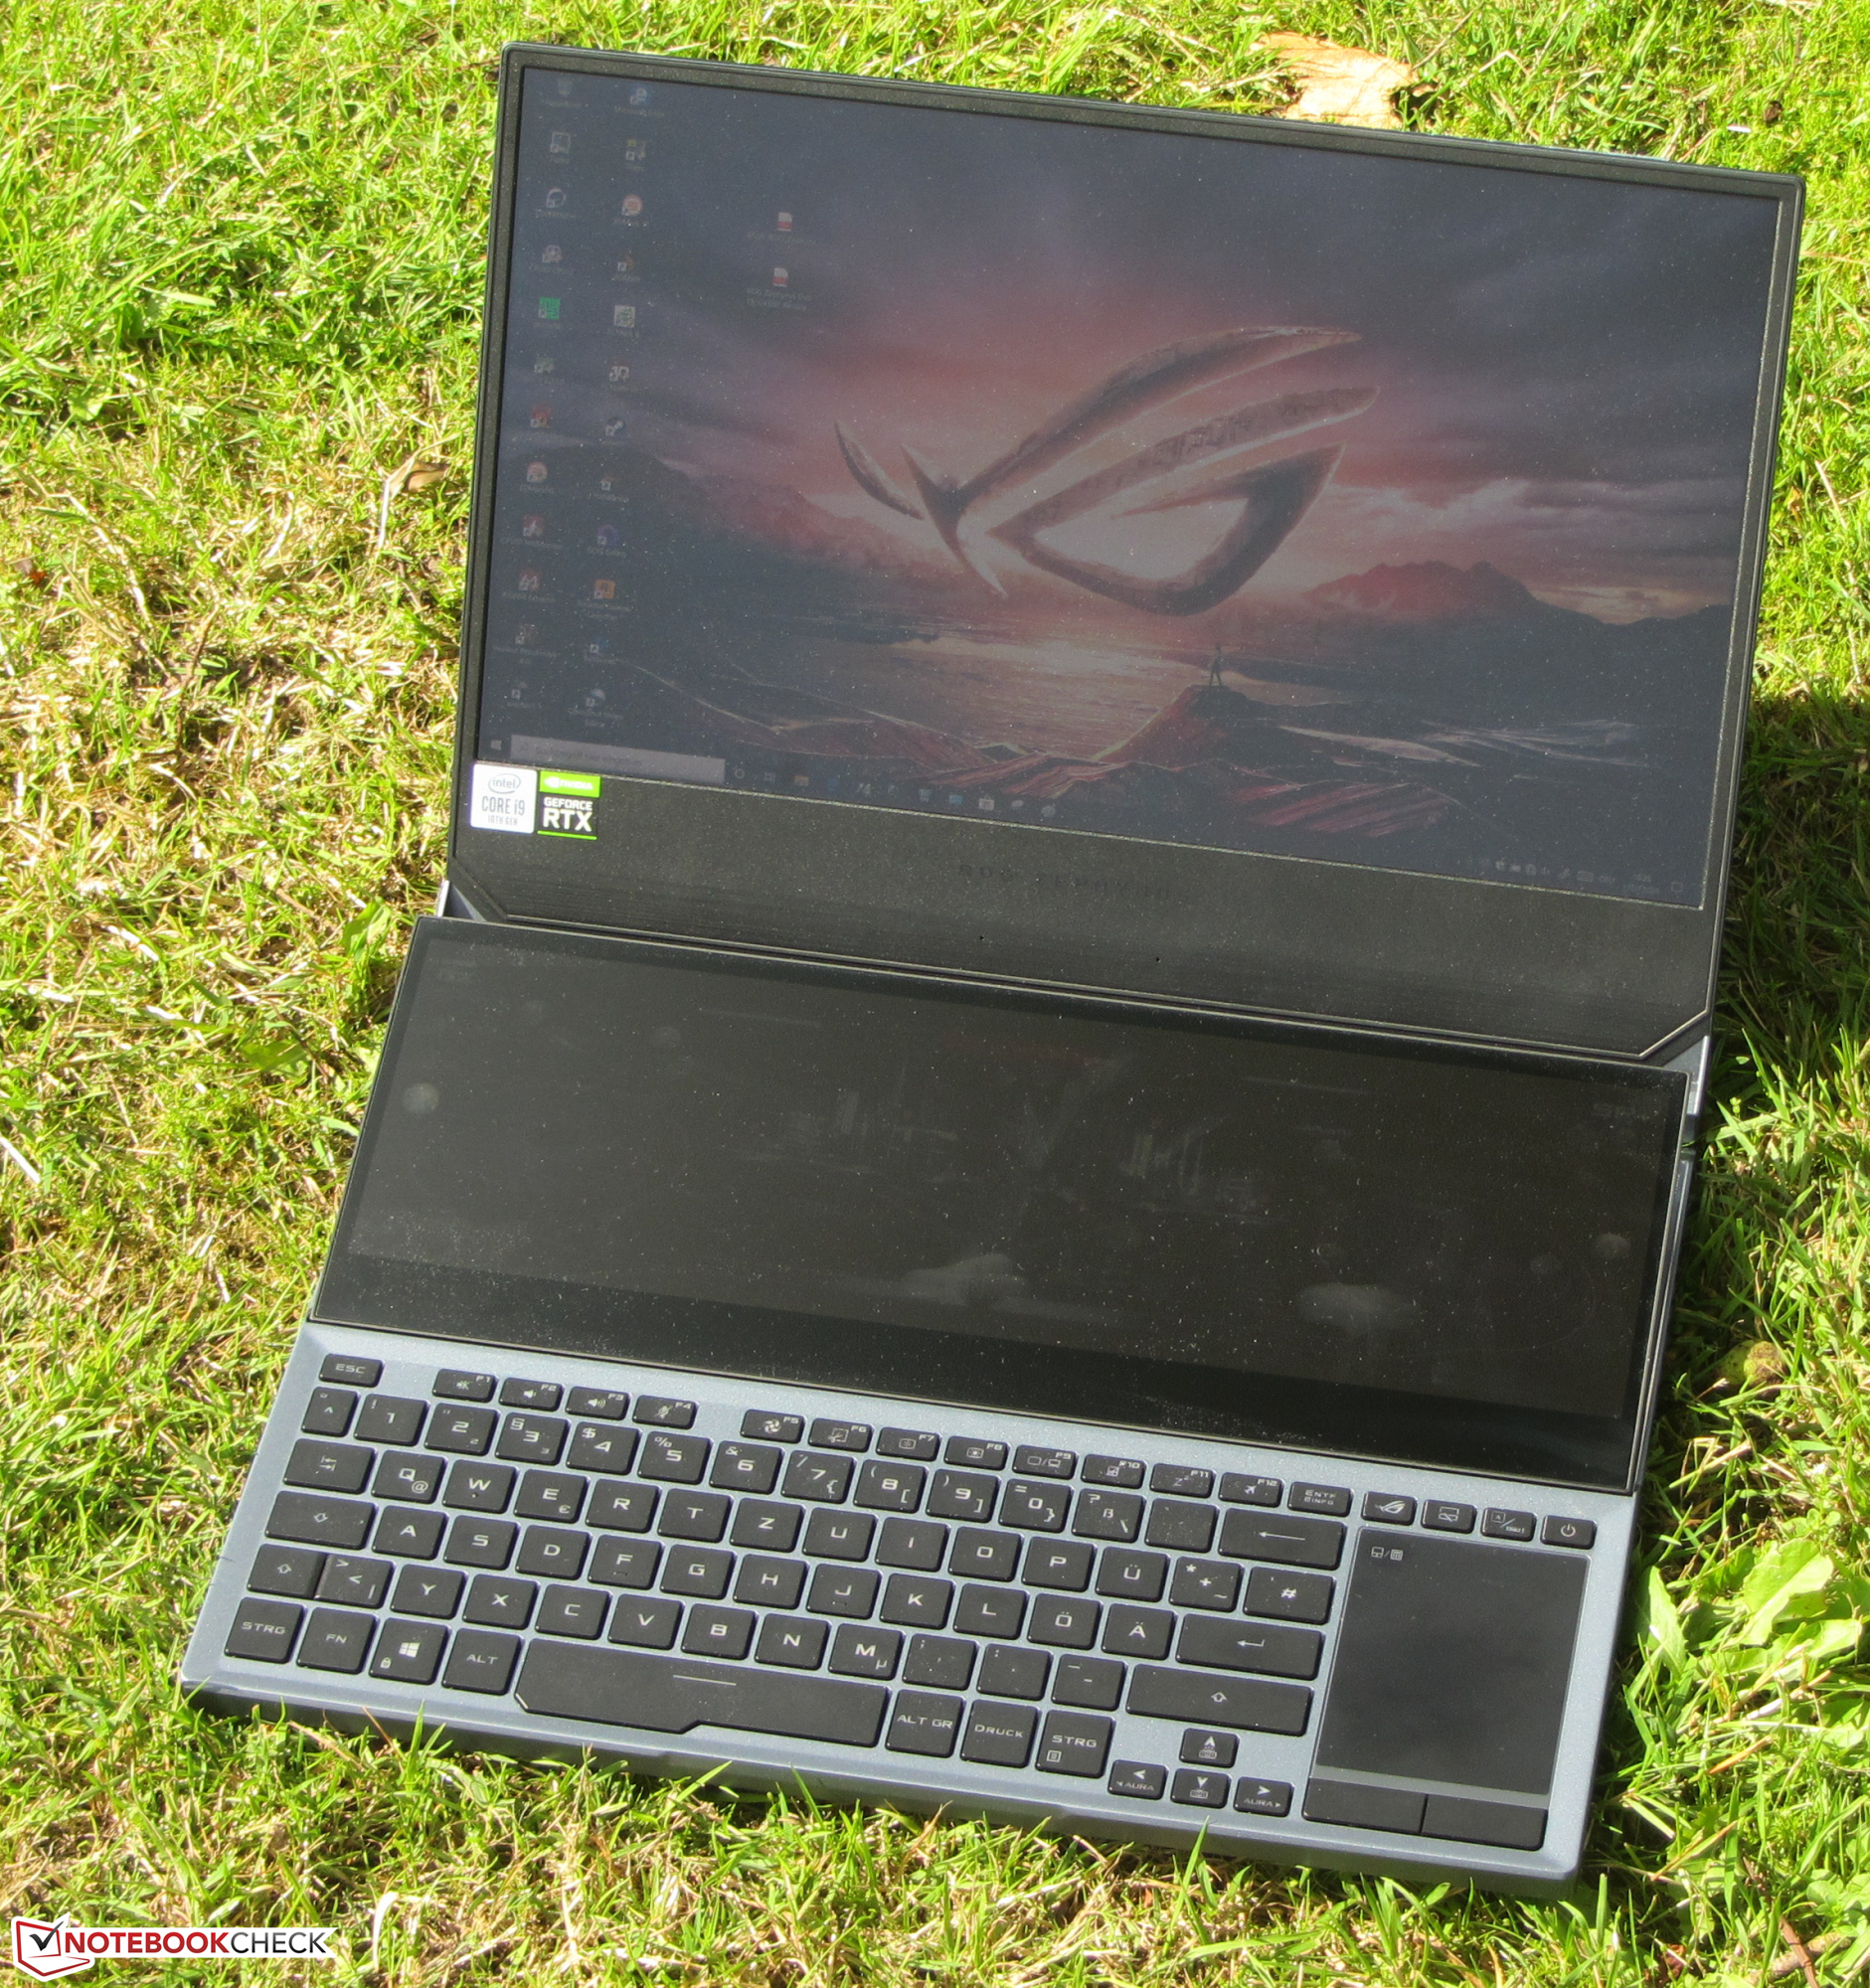
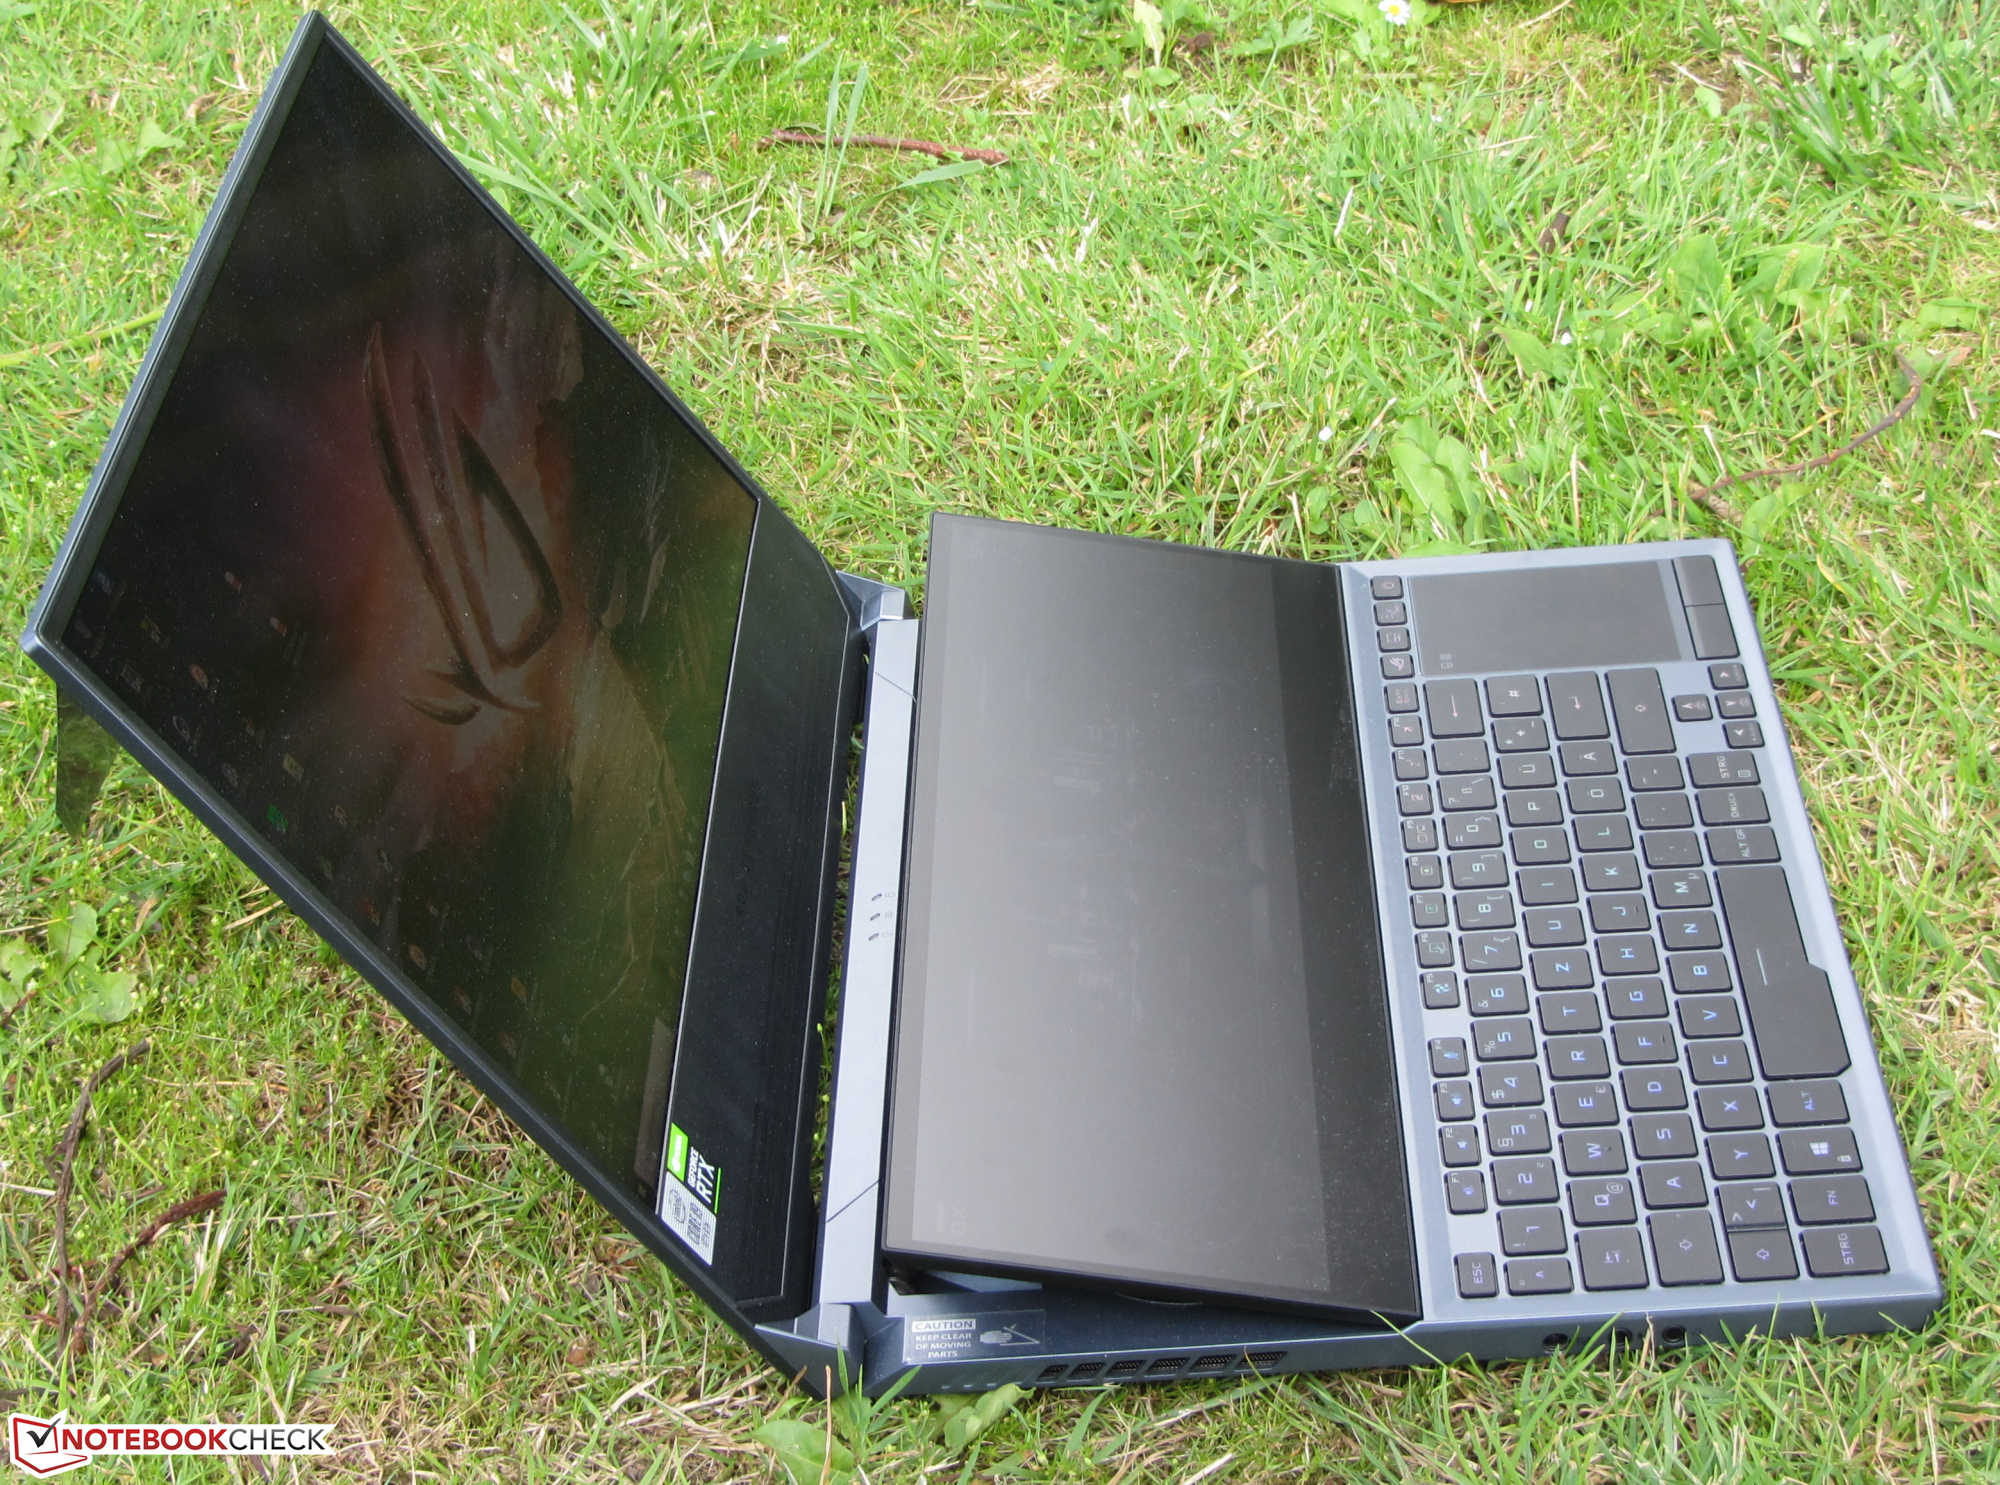
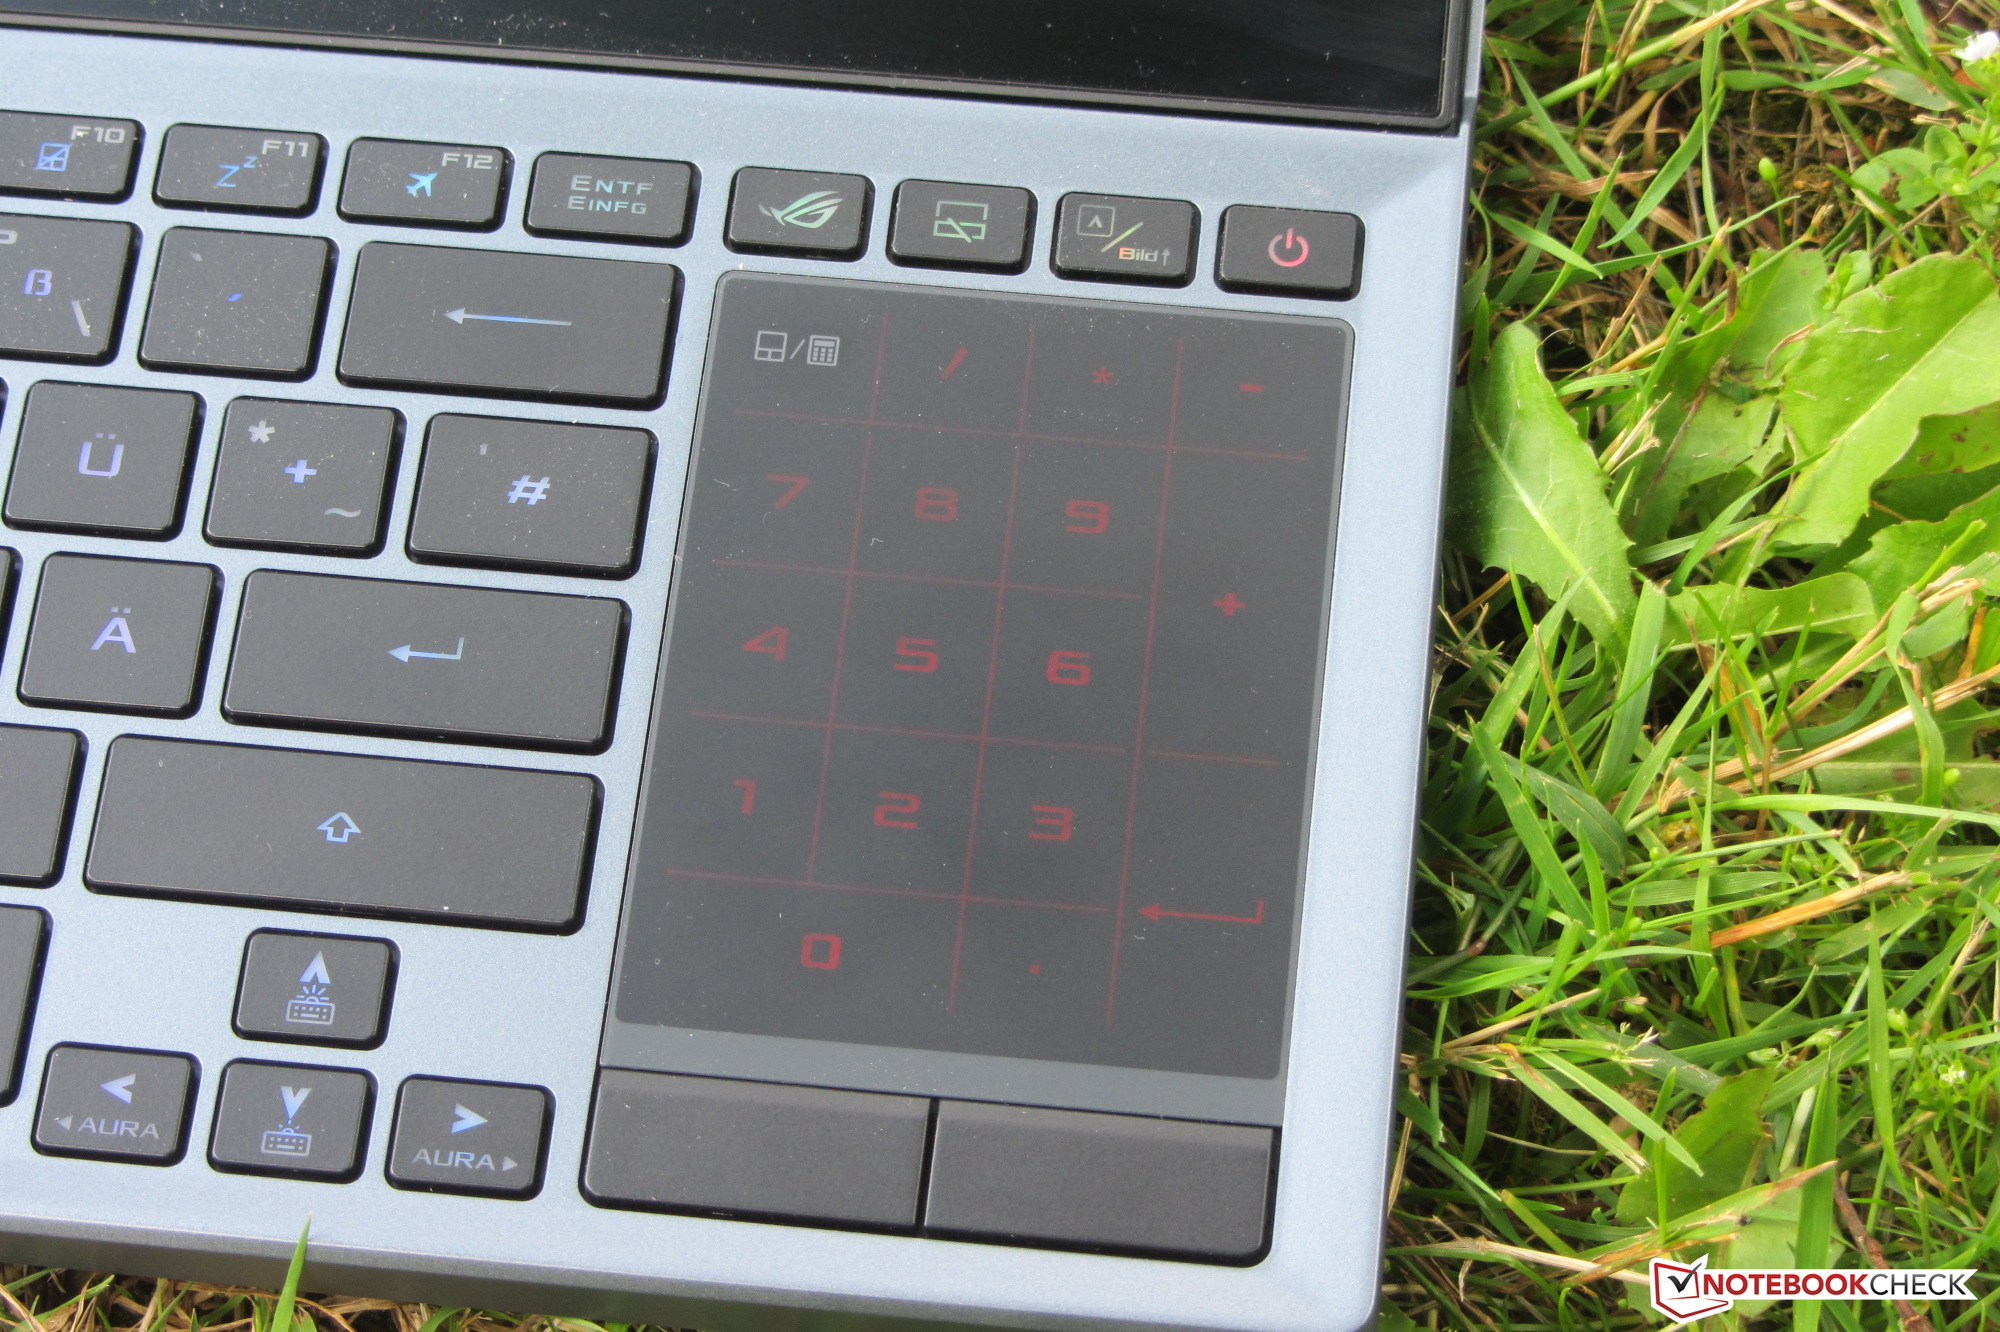
借助这款Zephyrus设备及其Screenpad Plus,华硕正努力为目标群体的游戏玩家,主播和内容创作者提供更多价值。通常,Screenpad在很多方面都很有用。但是,这是有代价的:与其他没有辅助显示器的游戏笔记本电脑相比,Zephyrus的重量更大,尺寸也更大。
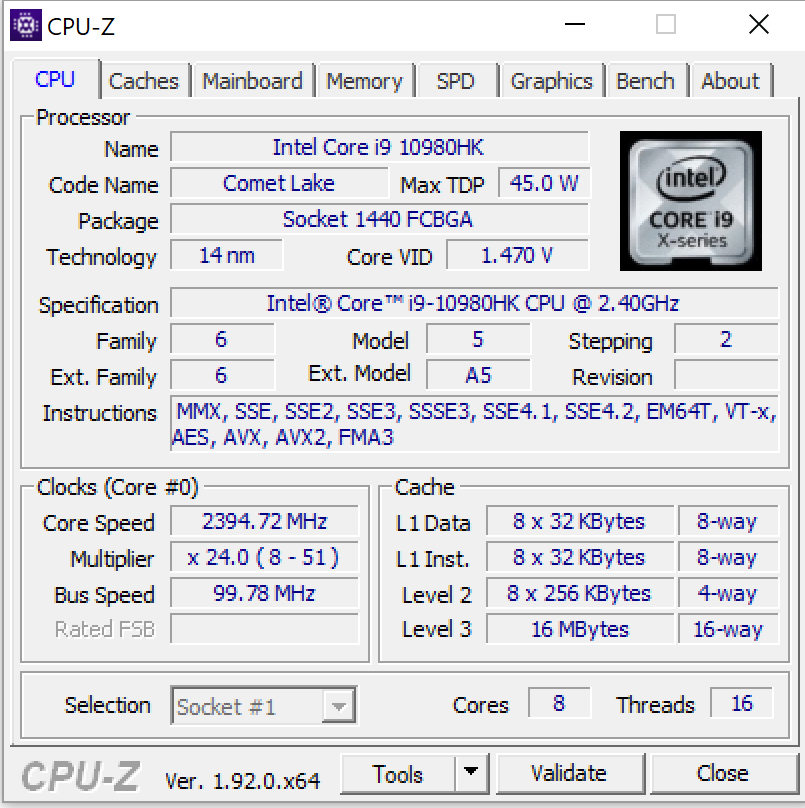
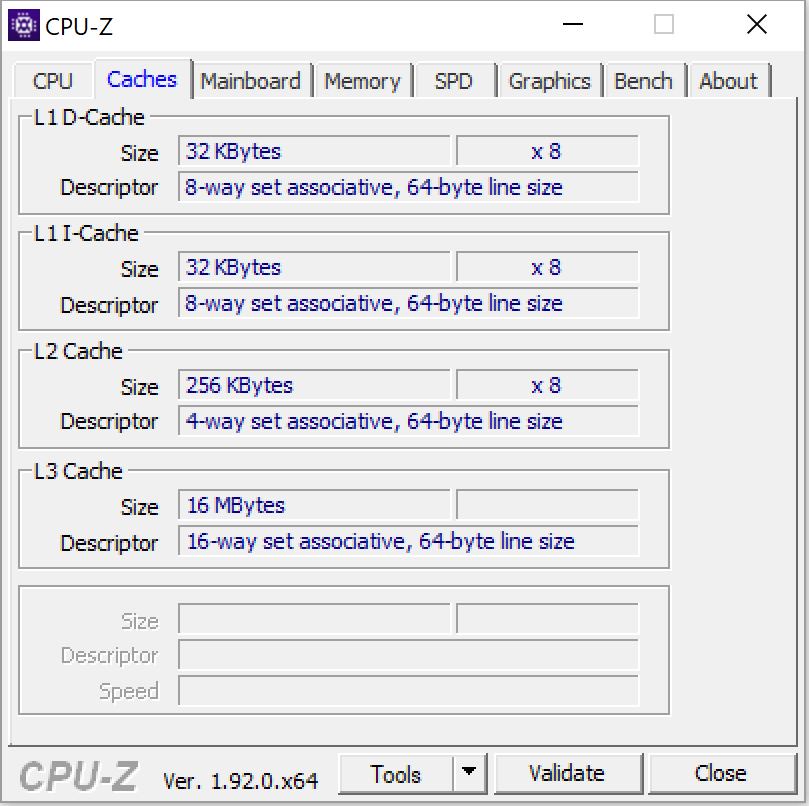
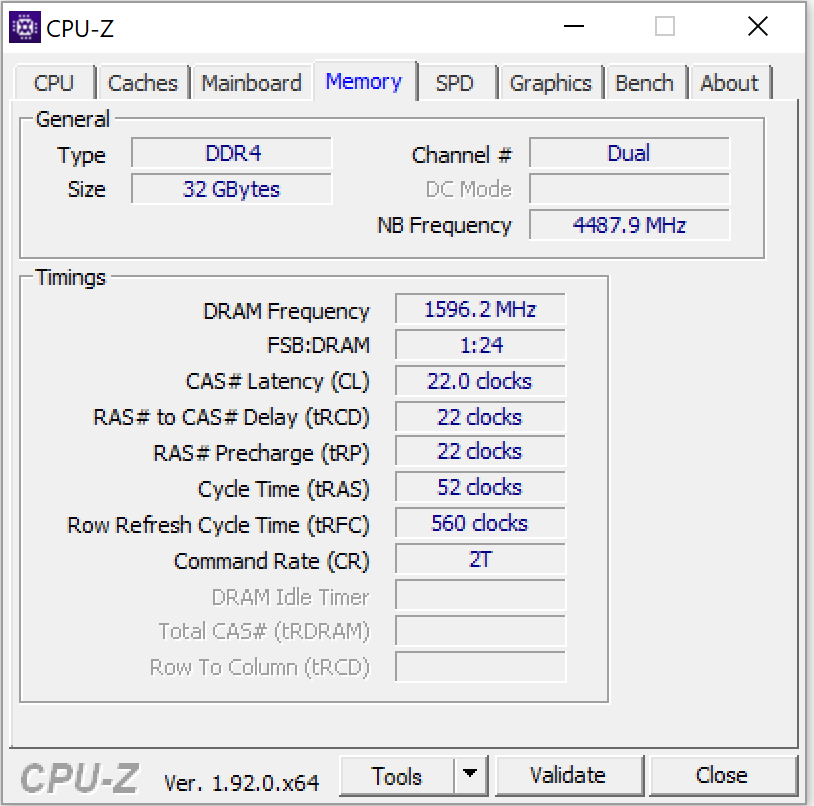
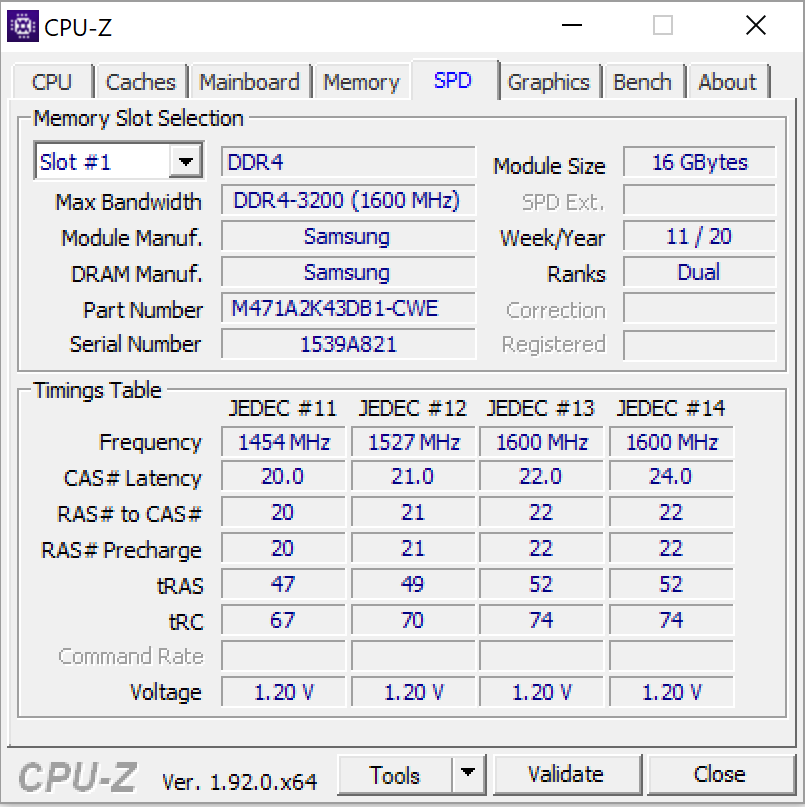
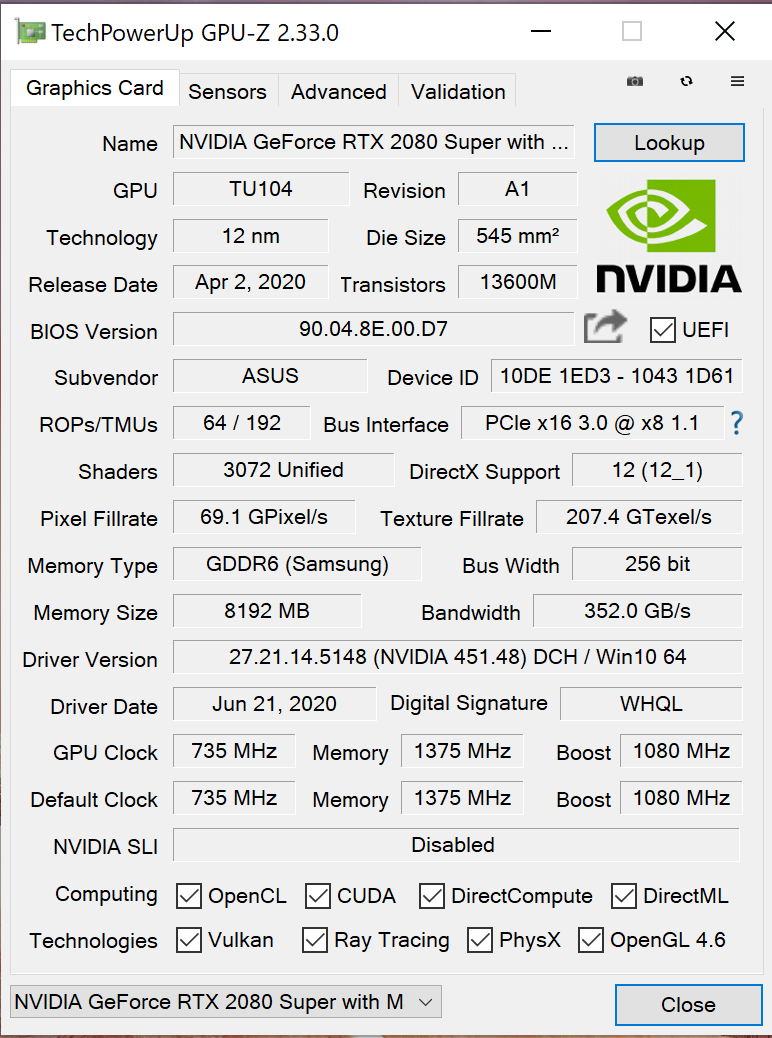
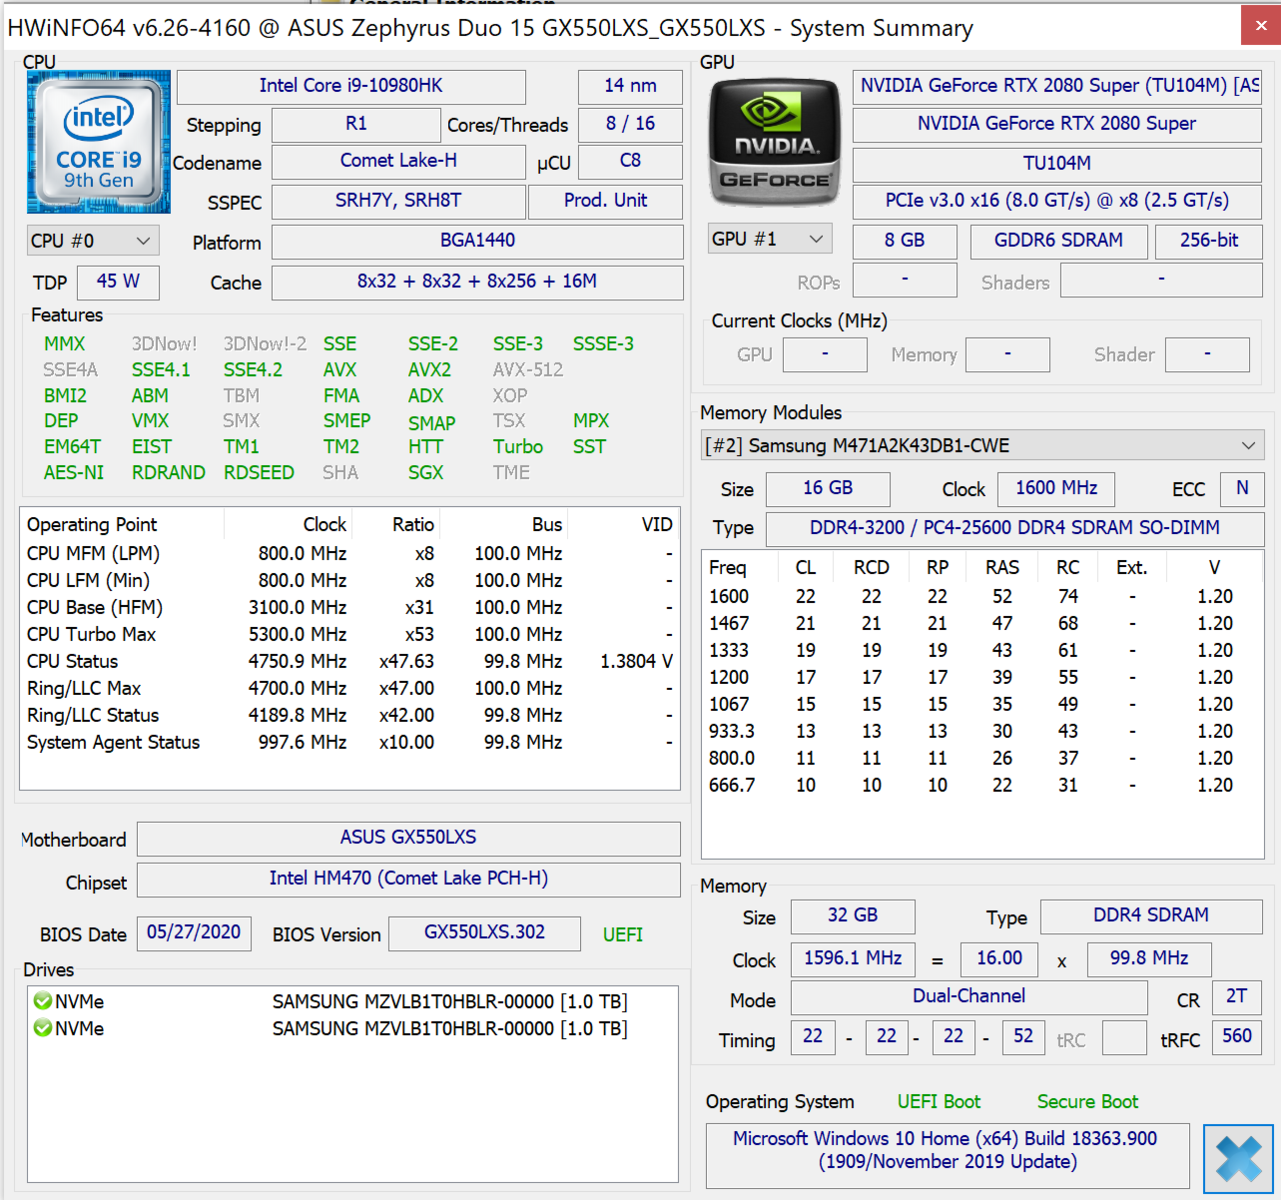
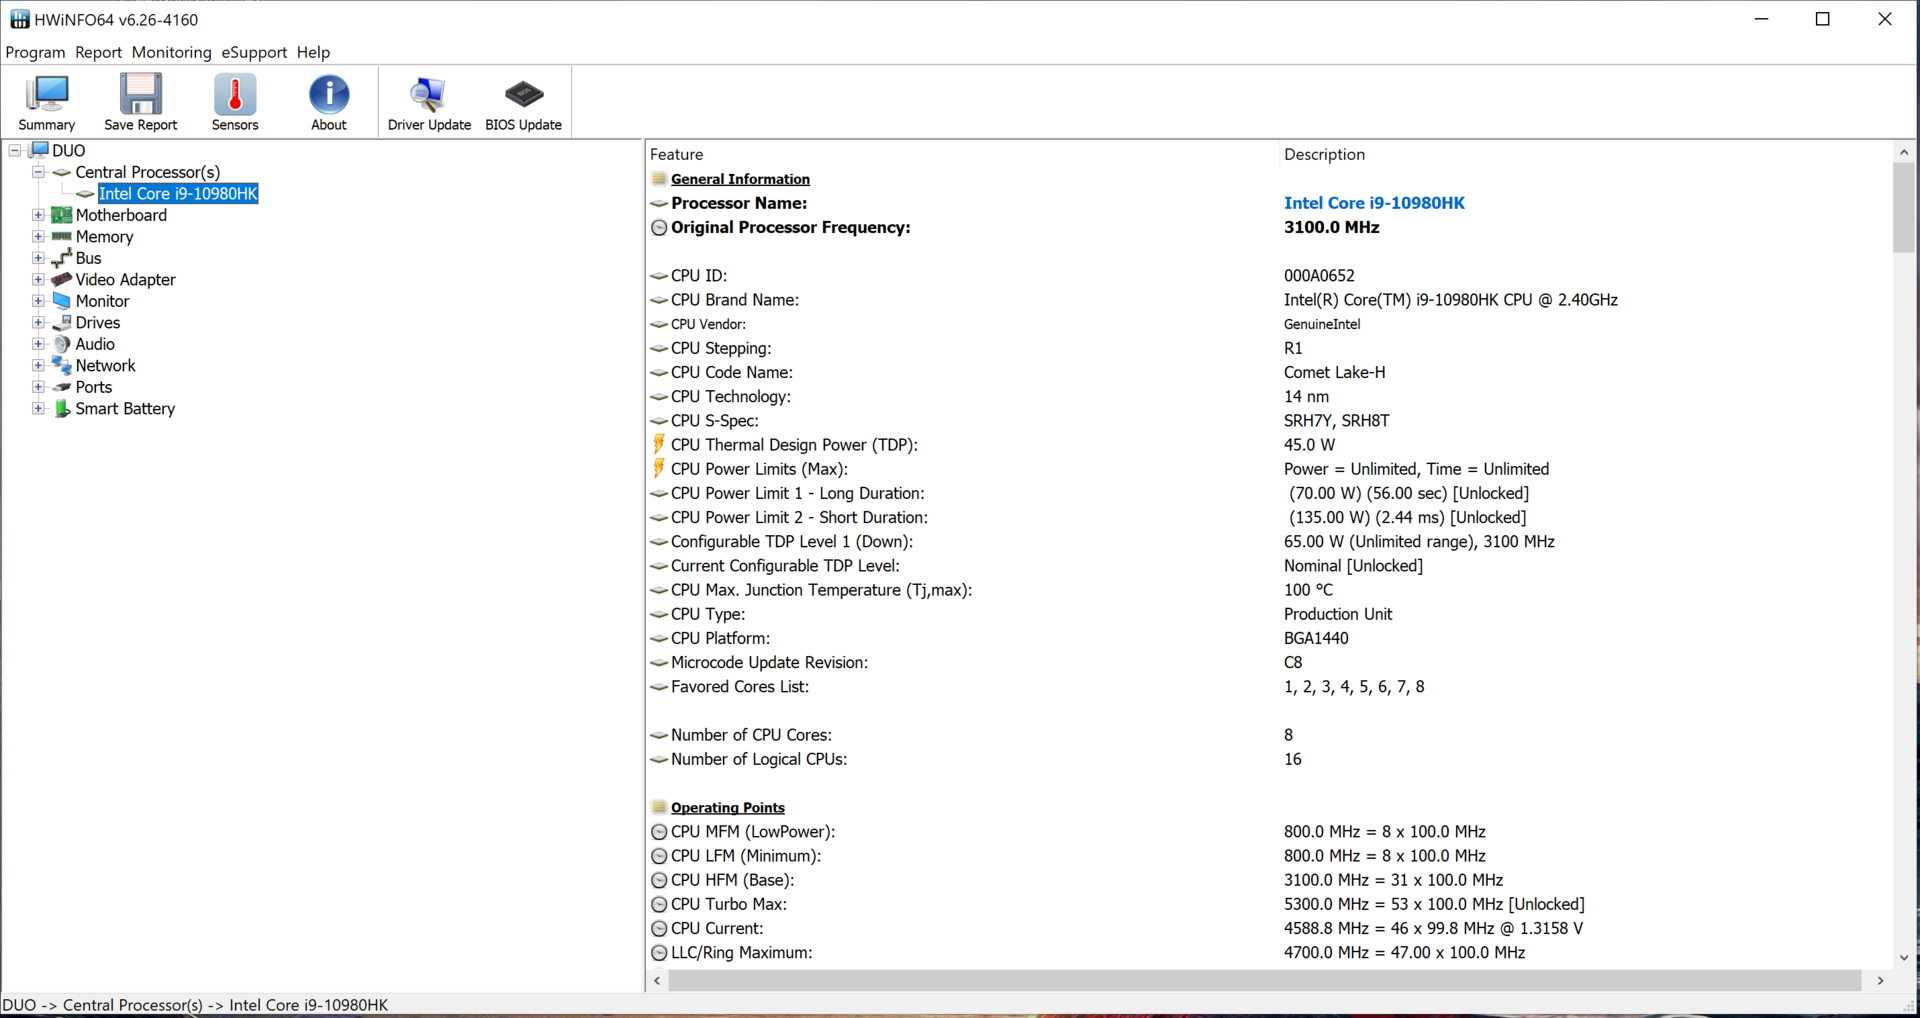
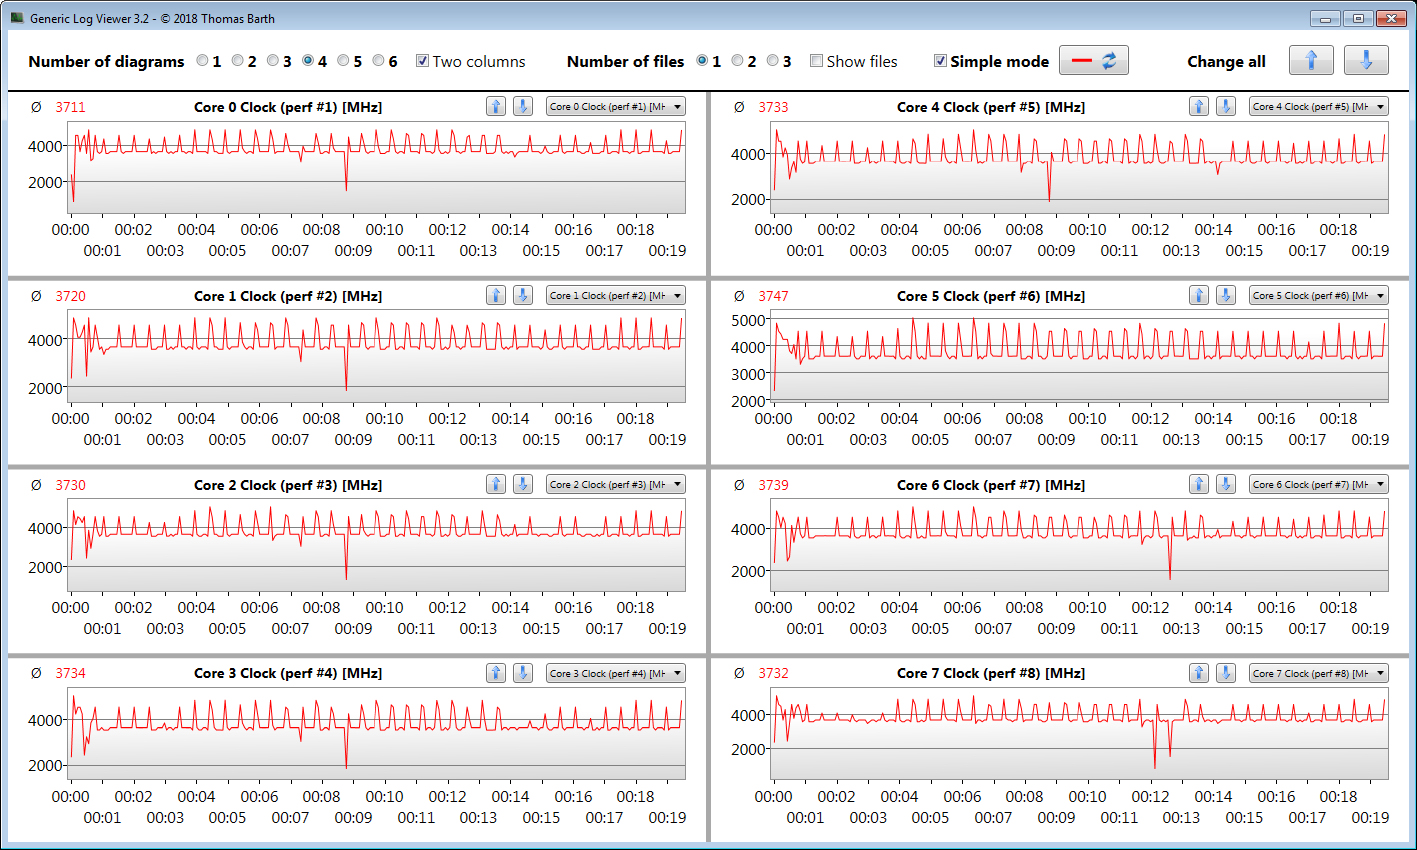
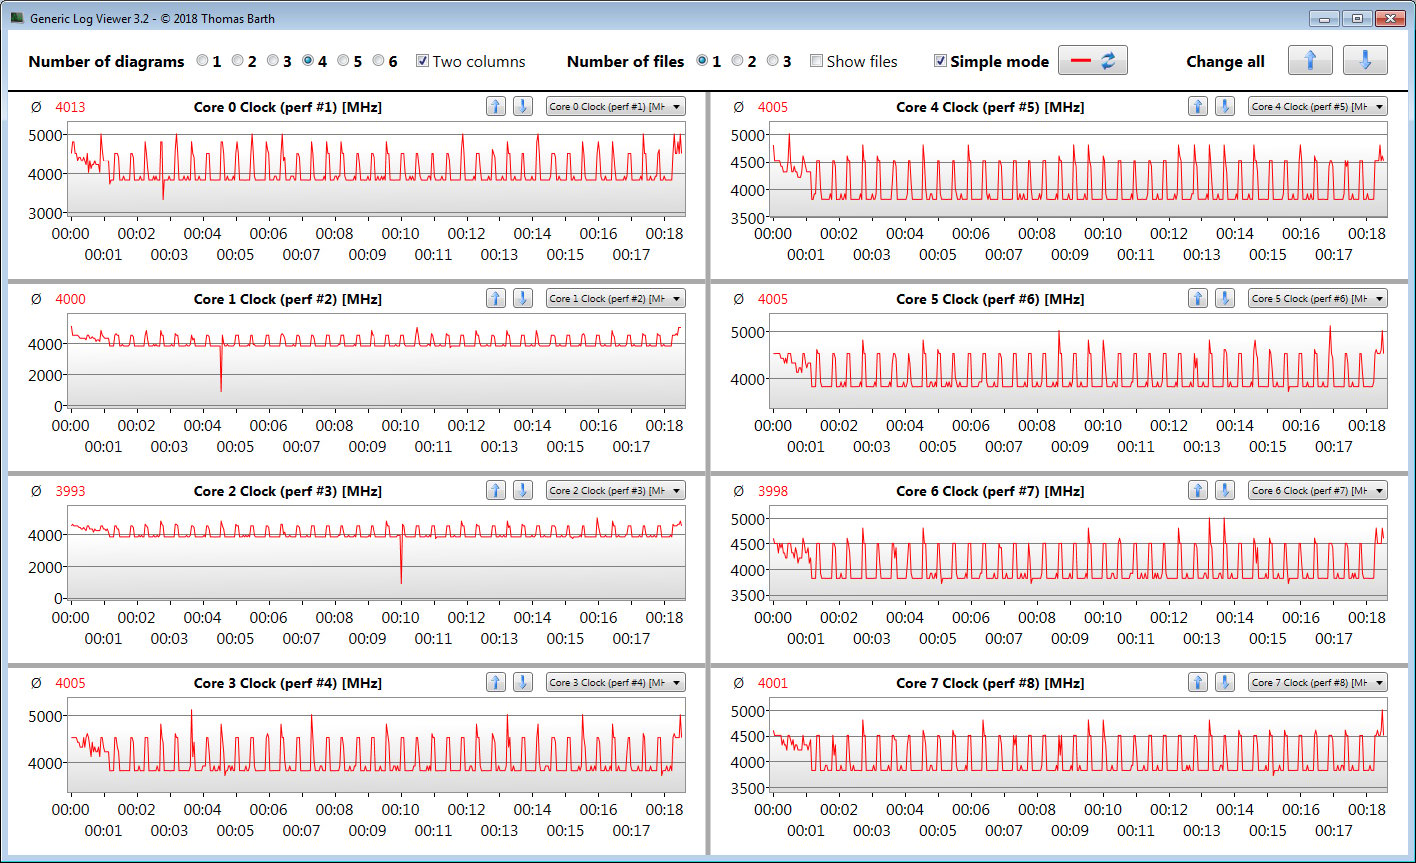
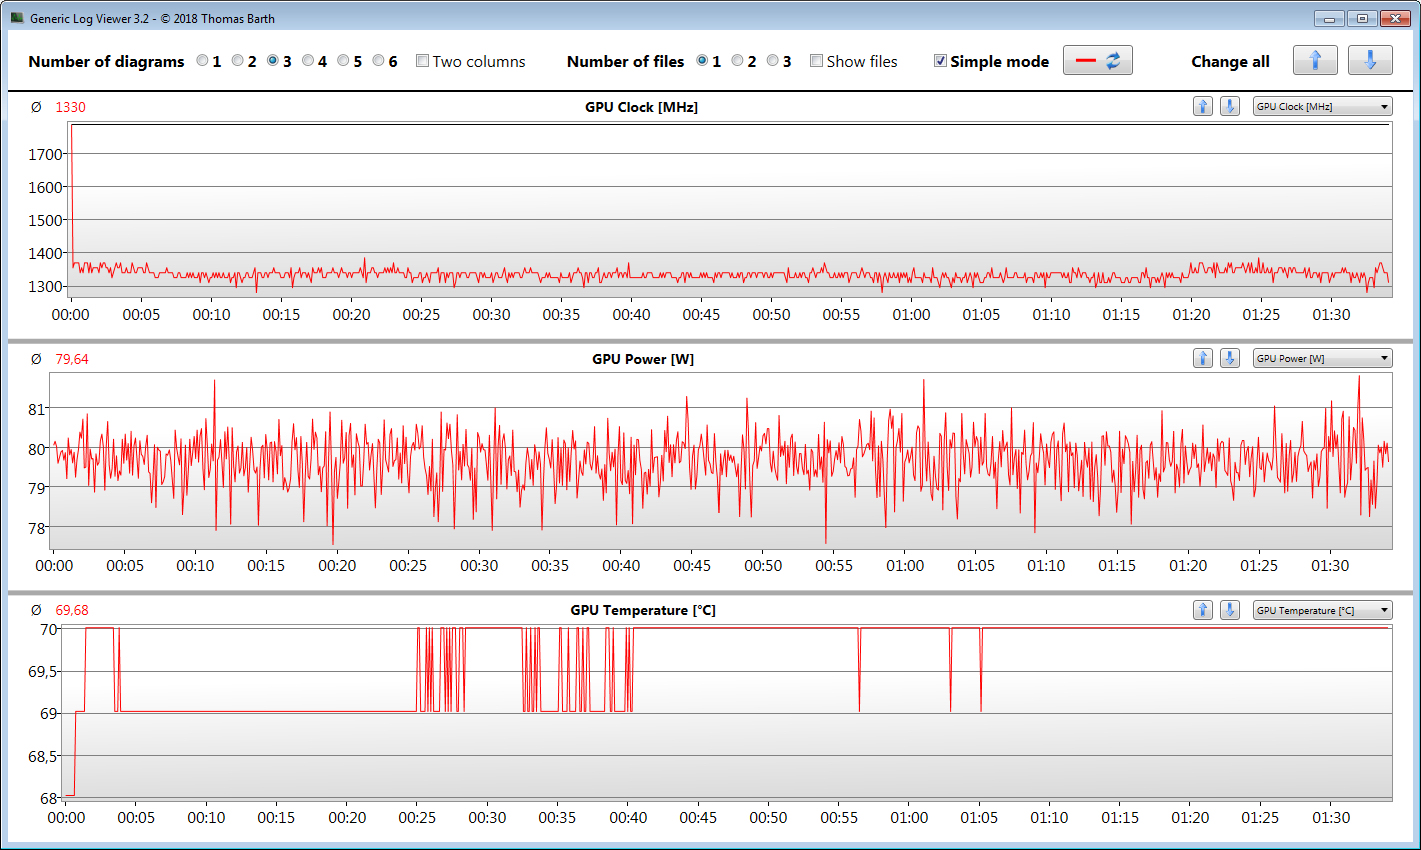
得益于八核Core i9-10980HK CPU和GeForce RTX 2080 Super Max-Q GPU,该笔记本电脑不缺乏性能。带有32 GB的RAM(在双通道模式下),其中包括一个16 GB的模块和16 GB的板载内存。最高可以升级到48 GB。 RAID 0中的两个NVMe SSD提供高传输速度和大量存储(2 TB)。
所有最新游戏在Asus Zephyrus Duo 15 GX550LXS上均可流畅运行。
带有G-Sync的IPS 4K显示屏具有高亮度,良好的对比度,良好的视角,以及通过Pantone验证的出色色彩。此外,它涵盖了整个AdobeRGB颜色空间。响应时间中等。为了获得更好的响应时间,还提供了可选的300 Hz全高清显示选项。
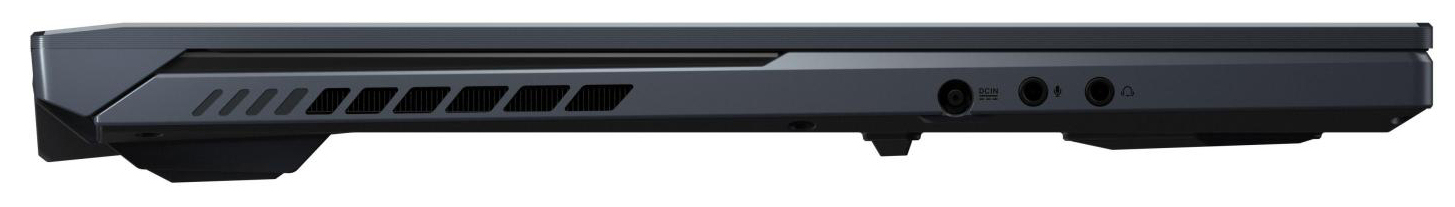
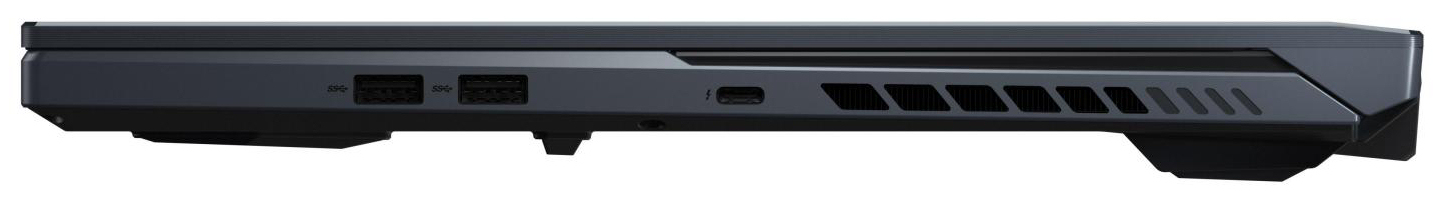
大量的接口选择特别包括Thunderbolt 3端口。它可用于连接功能丰富的扩展坞或外部GPU。此外,该端口可用于通过随附的第二个AC适配器(65瓦)以降低的性能水平(例如,旅行时)为设备供电。
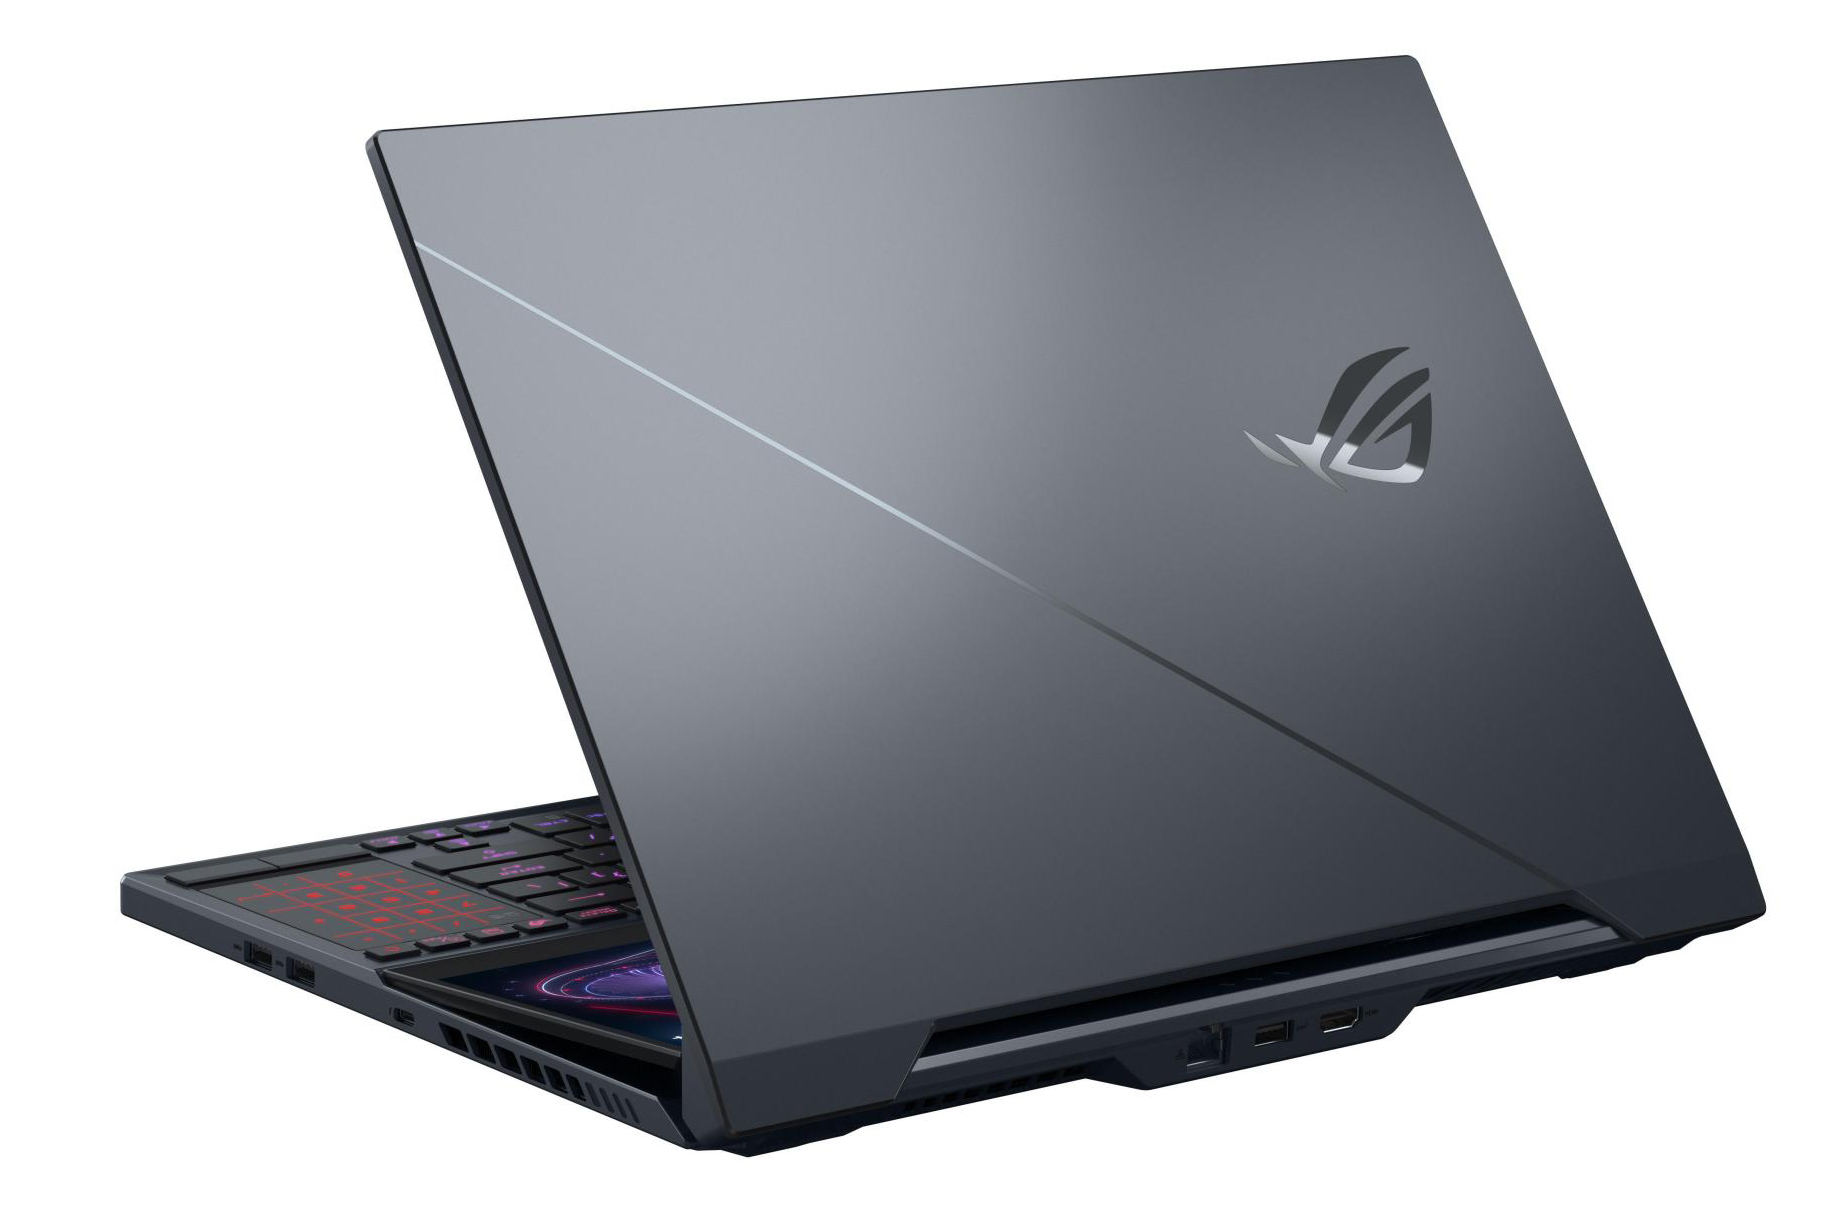
Asus ROG Zephyrus Duo 15 GX550LXS
- 07/22/2020 v7 (old)
Sascha Mölck
Price comparison

