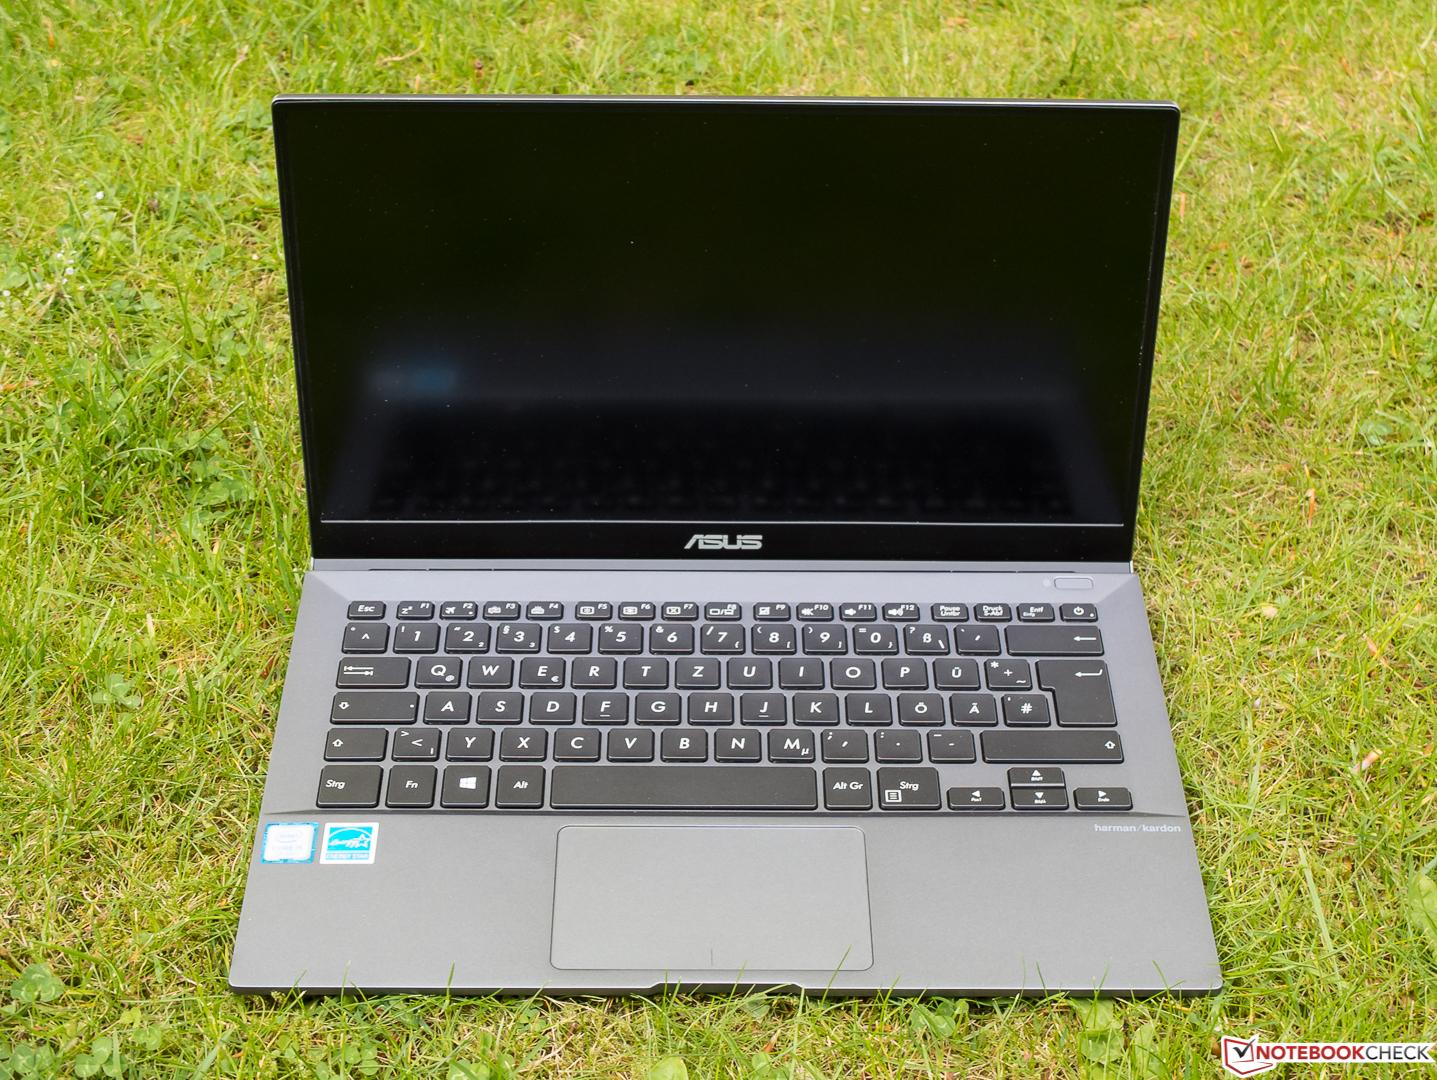
华硕 AsusPro B9440UA (Core i5, 8 GB) 笔记本简短评测

| Networking | |
| iperf3 transmit AX12 | |
| HP Spectre 13-v131ng | |
| Lenovo IdeaPad 710S Plus-13IKB | |
| Fujitsu LifeBook U747 | |
| Asus ASUSPRO B9440UA-GV0100T | |
| iperf3 receive AX12 | |
| Fujitsu LifeBook U747 | |
| Lenovo IdeaPad 710S Plus-13IKB | |
| Asus ASUSPRO B9440UA-GV0100T | |
| HP Spectre 13-v131ng | |
| |||||||||||||||||||||||||
Brightness Distribution: 87 %
Center on Battery: 321 cd/m²
Contrast: 1227:1 (Black: 0.26 cd/m²)
ΔE ColorChecker Calman: 7.1 | ∀{0.5-29.43 Ø4.71}
ΔE Greyscale Calman: 9.61 | ∀{0.09-98 Ø4.96}
83.02% sRGB (Argyll 1.6.3 3D)
54.01% AdobeRGB 1998 (Argyll 1.6.3 3D)
65.2% AdobeRGB 1998 (Argyll 3D)
89.1% sRGB (Argyll 3D)
64% Display P3 (Argyll 3D)
Gamma: 2.33
CCT: 6021 K
| Asus ASUSPRO B9440UA-GV0100T AU Optronics AUO353D / B140HAN03.5, , 1920x1080, 14" | Fujitsu LifeBook U747 LG LP140WF3, , 1920x1080, 14" | HP Spectre 13-v131ng CMN1374, , 1920x1080, 13.3" | Lenovo IdeaPad 710S Plus-13IKB LG Philips LP133WF4-SPB1 (LGD04EF), , 1920x1080, 13.3" | |
|---|---|---|---|---|
| Display | -2% | 0% | -4% | |
| Display P3 Coverage (%) | 64 | 66.1 3% | 64.6 1% | 65.3 2% |
| sRGB Coverage (%) | 89.1 | 84.8 -5% | 88.8 0% | 82.9 -7% |
| AdobeRGB 1998 Coverage (%) | 65.2 | 62 -5% | 64.8 -1% | 60.6 -7% |
| Response Times | 26% | -1% | 7% | |
| Response Time Grey 50% / Grey 80% * (ms) | 48.8 ? | 36 ? 26% | 46 ? 6% | 45 ? 8% |
| Response Time Black / White * (ms) | 30.8 ? | 23.2 ? 25% | 33 ? -7% | 29 ? 6% |
| PWM Frequency (Hz) | ||||
| Screen | 8% | 12% | 12% | |
| Brightness middle (cd/m²) | 319 | 291 -9% | 404 27% | 343 8% |
| Brightness (cd/m²) | 294 | 296 1% | 382 30% | 306 4% |
| Brightness Distribution (%) | 87 | 84 -3% | 91 5% | 81 -7% |
| Black Level * (cd/m²) | 0.26 | 0.32 -23% | 0.35 -35% | 0.3 -15% |
| Contrast (:1) | 1227 | 909 -26% | 1154 -6% | 1143 -7% |
| Colorchecker dE 2000 * | 7.1 | 4.3 39% | 5.37 24% | 4.73 33% |
| Colorchecker dE 2000 max. * | 13.7 | 7.5 45% | 9.46 31% | 9.05 34% |
| Greyscale dE 2000 * | 9.61 | 4.3 55% | 6.44 33% | 3.29 66% |
| Gamma | 2.33 94% | 2.31 95% | 2.52 87% | 2.36 93% |
| CCT | 6021 108% | 6529 100% | 6738 96% | 6437 101% |
| Color Space (Percent of AdobeRGB 1998) (%) | 54.01 | 55.46 3% | 58 7% | 54 0% |
| Color Space (Percent of sRGB) (%) | 83.02 | 84.77 2% | 89 7% | 83 0% |
| Total Average (Program / Settings) | 11% /
9% | 4% /
8% | 5% /
8% |
* ... smaller is better
Display Response Times
| ↔ Response Time Black to White | ||
|---|---|---|
| 30.8 ms ... rise ↗ and fall ↘ combined | ↗ 8 ms rise | 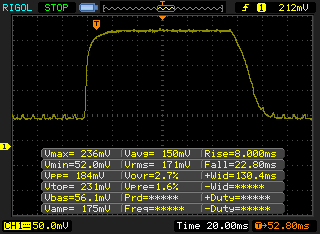 |
| ↘ 22.8 ms fall | ||
| The screen shows slow response rates in our tests and will be unsatisfactory for gamers. In comparison, all tested devices range from 0.1 (minimum) to 240 (maximum) ms. » 83 % of all devices are better. This means that the measured response time is worse than the average of all tested devices (19.8 ms). | ||
| ↔ Response Time 50% Grey to 80% Grey | ||
| 48.8 ms ... rise ↗ and fall ↘ combined | ↗ 18 ms rise | 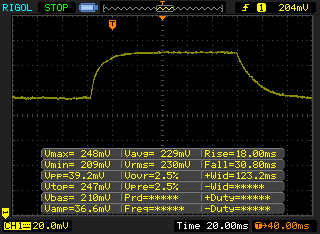 |
| ↘ 30.8 ms fall | ||
| The screen shows slow response rates in our tests and will be unsatisfactory for gamers. In comparison, all tested devices range from 0.165 (minimum) to 636 (maximum) ms. » 84 % of all devices are better. This means that the measured response time is worse than the average of all tested devices (30.9 ms). | ||
Screen Flickering / PWM (Pulse-Width Modulation)
| Screen flickering / PWM not detected | ||
In comparison: 52 % of all tested devices do not use PWM to dim the display. If PWM was detected, an average of 7748 (minimum: 5 - maximum: 343500) Hz was measured. | ||
| PCMark 8 | |
| Home Score Accelerated v2 | |
| HP Spectre 13-v131ng | |
| Asus ASUSPRO B9440UA-GV0100T | |
| Fujitsu LifeBook U747 | |
| Lenovo IdeaPad 710S Plus-13IKB | |
| Work Score Accelerated v2 | |
| HP Spectre 13-v131ng | |
| Fujitsu LifeBook U747 | |
| Asus ASUSPRO B9440UA-GV0100T | |
| Lenovo IdeaPad 710S Plus-13IKB | |
| PCMark 8 Home Score Accelerated v2 | 3714 points | |
| PCMark 8 Work Score Accelerated v2 | 4630 points | |
Help | ||
| Asus ASUSPRO B9440UA-GV0100T Micron SSD 1100 (MTFDDAV256TBN) | Fujitsu LifeBook U747 Samsung MZYTY256HDHP | HP Spectre 13-v131ng Samsung PM961 NVMe MZVLW512HMJP | Lenovo IdeaPad 710S Plus-13IKB Samsung PM961 NVMe MZVLW512HMJP | |
|---|---|---|---|---|
| CrystalDiskMark 3.0 | 15% | 112% | 149% | |
| Read Seq (MB/s) | 462 | 504 9% | 1090 136% | 1577 241% |
| Write Seq (MB/s) | 441.4 | 497.8 13% | 1088 146% | 1472 233% |
| Read 512 (MB/s) | 323.2 | 396.7 23% | 753 133% | 1165 260% |
| Write 512 (MB/s) | 398.8 | 283.4 -29% | 911 128% | 1244 212% |
| Read 4k (MB/s) | 26.81 | 35.73 33% | 57.5 114% | 54.8 104% |
| Write 4k (MB/s) | 87.8 | 87.8 0% | 140.2 60% | 121.5 38% |
| Read 4k QD32 (MB/s) | 247.3 | 399.1 61% | 497.1 101% | 407.5 65% |
| Write 4k QD32 (MB/s) | 232.1 | 249.7 8% | 416 79% | 321.4 38% |

| 3DMark 11 - 1280x720 Performance GPU | |
| Lenovo IdeaPad 710S Plus-13IKB | |
| HP Spectre 13-v131ng | |
| Asus ASUSPRO B9440UA-GV0100T | |
| Fujitsu LifeBook U747 | |
| 3DMark | |
| 1280x720 Cloud Gate Standard Graphics | |
| Lenovo IdeaPad 710S Plus-13IKB | |
| Asus ASUSPRO B9440UA-GV0100T | |
| HP Spectre 13-v131ng | |
| Fujitsu LifeBook U747 | |
| 1920x1080 Fire Strike Graphics | |
| Lenovo IdeaPad 710S Plus-13IKB | |
| Asus ASUSPRO B9440UA-GV0100T | |
| HP Spectre 13-v131ng | |
| Fujitsu LifeBook U747 | |
| 3DMark 11 Performance | 1715 points | |
| 3DMark Cloud Gate Standard Score | 6478 points | |
| 3DMark Fire Strike Score | 891 points | |
Help | ||
| low | med. | high | ultra | |
|---|---|---|---|---|
| The Witcher 3 (2015) | 14.8 | |||
| Ghost Recon Wildlands (2017) | 13.7 | |||
| Warhammer 40.000: Dawn of War III (2017) | 24.4 |
Noise level
| Idle |
| 29 / 29 / 29 dB(A) |
| Load |
| 36.7 / 40.2 dB(A) |
 | ||
30 dB silent 40 dB(A) audible 50 dB(A) loud |
||
min: | ||
(+) The maximum temperature on the upper side is 36.6 °C / 98 F, compared to the average of 34.3 °C / 94 F, ranging from 21.2 to 62.5 °C for the class Office.
(±) The bottom heats up to a maximum of 41 °C / 106 F, compared to the average of 36.8 °C / 98 F
(+) In idle usage, the average temperature for the upper side is 26.3 °C / 79 F, compared to the device average of 29.5 °C / 85 F.
(+) The palmrests and touchpad are cooler than skin temperature with a maximum of 27.5 °C / 81.5 F and are therefore cool to the touch.
(±) The average temperature of the palmrest area of similar devices was 27.5 °C / 81.5 F (0 °C / 0 F).
Asus ASUSPRO B9440UA-GV0100T audio analysis
(±) | speaker loudness is average but good (78 dB)
Bass 100 - 315 Hz
(±) | reduced bass - on average 9.4% lower than median
(±) | linearity of bass is average (9.6% delta to prev. frequency)
Mids 400 - 2000 Hz
(+) | balanced mids - only 2% away from median
(+) | mids are linear (4.4% delta to prev. frequency)
Highs 2 - 16 kHz
(±) | higher highs - on average 5.3% higher than median
(+) | highs are linear (6.8% delta to prev. frequency)
Overall 100 - 16.000 Hz
(±) | linearity of overall sound is average (16.1% difference to median)
Compared to same class
» 19% of all tested devices in this class were better, 6% similar, 75% worse
» The best had a delta of 7%, average was 21%, worst was 53%
Compared to all devices tested
» 26% of all tested devices were better, 5% similar, 69% worse
» The best had a delta of 4%, average was 23%, worst was 134%
Fujitsu LifeBook U747 audio analysis
(-) | not very loud speakers (68.1 dB)
Bass 100 - 315 Hz
(-) | nearly no bass - on average 15.2% lower than median
(+) | bass is linear (6.6% delta to prev. frequency)
Mids 400 - 2000 Hz
(±) | higher mids - on average 6.1% higher than median
(±) | linearity of mids is average (8.4% delta to prev. frequency)
Highs 2 - 16 kHz
(+) | balanced highs - only 4.4% away from median
(±) | linearity of highs is average (10.4% delta to prev. frequency)
Overall 100 - 16.000 Hz
(±) | linearity of overall sound is average (26.3% difference to median)
Compared to same class
» 81% of all tested devices in this class were better, 7% similar, 13% worse
» The best had a delta of 7%, average was 21%, worst was 53%
Compared to all devices tested
» 81% of all tested devices were better, 4% similar, 15% worse
» The best had a delta of 4%, average was 23%, worst was 134%
HP Spectre 13-v131ng audio analysis
(-) | not very loud speakers (68 dB)
Bass 100 - 315 Hz
(-) | nearly no bass - on average 23.7% lower than median
(±) | linearity of bass is average (9.6% delta to prev. frequency)
Mids 400 - 2000 Hz
(±) | reduced mids - on average 5.1% lower than median
(±) | linearity of mids is average (7.6% delta to prev. frequency)
Highs 2 - 16 kHz
(±) | higher highs - on average 7.7% higher than median
(+) | highs are linear (3.1% delta to prev. frequency)
Overall 100 - 16.000 Hz
(±) | linearity of overall sound is average (28.6% difference to median)
Compared to same class
» 90% of all tested devices in this class were better, 2% similar, 7% worse
» The best had a delta of 5%, average was 18%, worst was 53%
Compared to all devices tested
» 86% of all tested devices were better, 3% similar, 11% worse
» The best had a delta of 4%, average was 23%, worst was 134%
Lenovo IdeaPad 710S Plus-13IKB audio analysis
(±) | speaker loudness is average but good (73 dB)
Bass 100 - 315 Hz
(-) | nearly no bass - on average 21.4% lower than median
(±) | linearity of bass is average (12.2% delta to prev. frequency)
Mids 400 - 2000 Hz
(±) | higher mids - on average 6.7% higher than median
(±) | linearity of mids is average (10.6% delta to prev. frequency)
Highs 2 - 16 kHz
(+) | balanced highs - only 2.2% away from median
(+) | highs are linear (6.9% delta to prev. frequency)
Overall 100 - 16.000 Hz
(±) | linearity of overall sound is average (24.4% difference to median)
Compared to same class
» 82% of all tested devices in this class were better, 4% similar, 13% worse
» The best had a delta of 5%, average was 18%, worst was 53%
Compared to all devices tested
» 74% of all tested devices were better, 6% similar, 20% worse
» The best had a delta of 4%, average was 23%, worst was 134%
| Off / Standby | |
| Idle | |
| Load |
|
Key:
min: | |
| Asus ASUSPRO B9440UA-GV0100T i5-7200U, HD Graphics 620, Micron SSD 1100 (MTFDDAV256TBN), IPS, 1920x1080, 14" | Fujitsu LifeBook U747 i5-7200U, HD Graphics 620, Samsung MZYTY256HDHP, IPS LED, 1920x1080, 14" | HP Spectre 13-v131ng i7-7500U, HD Graphics 620, Samsung PM961 NVMe MZVLW512HMJP, IPS UWVA, 1920x1080, 13.3" | Lenovo IdeaPad 710S Plus-13IKB i7-7500U, GeForce 940MX, Samsung PM961 NVMe MZVLW512HMJP, IPS, 1920x1080, 13.3" | |
|---|---|---|---|---|
| Power Consumption | -15% | -12% | -24% | |
| Idle Minimum * (Watt) | 3.1 | 4.11 -33% | 3.6 -16% | 3.6 -16% |
| Idle Average * (Watt) | 6.1 | 7.87 -29% | 6.4 -5% | 7.4 -21% |
| Idle Maximum * (Watt) | 6.8 | 8.74 -29% | 9.2 -35% | 8.7 -28% |
| Load Average * (Watt) | 27.4 | 30.2 -10% | 34 -24% | 43 -57% |
| Load Maximum * (Watt) | 43.7 | 32.4 26% | 34.4 21% | 42 4% |
* ... smaller is better
| Asus ASUSPRO B9440UA-GV0100T i5-7200U, HD Graphics 620, 48 Wh | Fujitsu LifeBook U747 i5-7200U, HD Graphics 620, 50 Wh | HP Spectre 13-v131ng i7-7500U, HD Graphics 620, 38 Wh | Lenovo IdeaPad 710S Plus-13IKB i7-7500U, GeForce 940MX, 46 Wh | |
|---|---|---|---|---|
| Battery runtime | -19% | -34% | -42% | |
| Reader / Idle (h) | 19 | 13 -32% | 12 -37% | 7.8 -59% |
| WiFi v1.3 (h) | 8.9 | 7.2 -19% | 6.6 -26% | 5.6 -37% |
| Load (h) | 2.1 | 2 -5% | 1.3 -38% | 1.5 -29% |
| H.264 (h) | 8.2 | 6.1 |
Pros
Cons
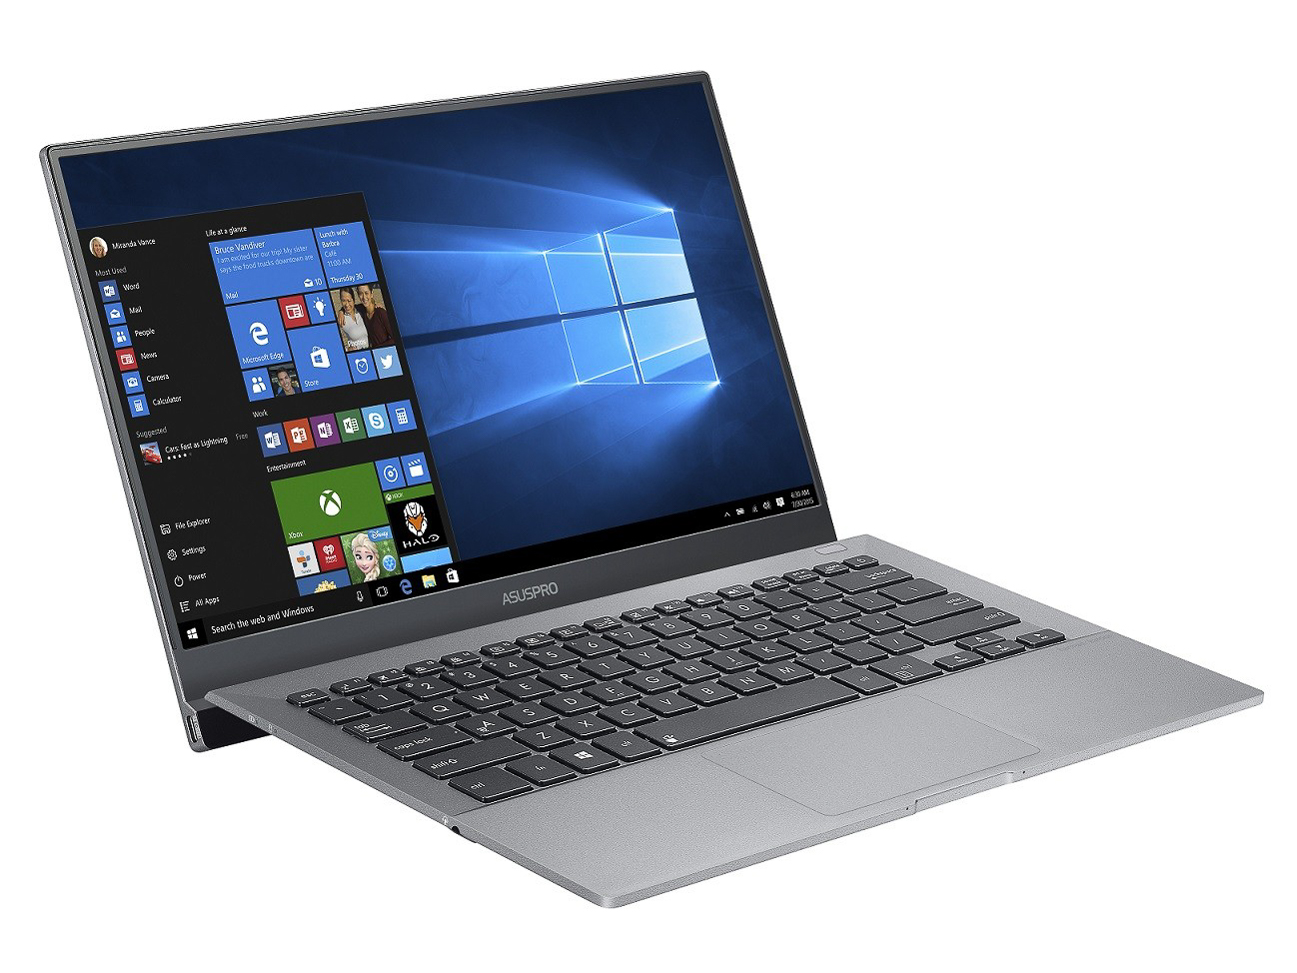
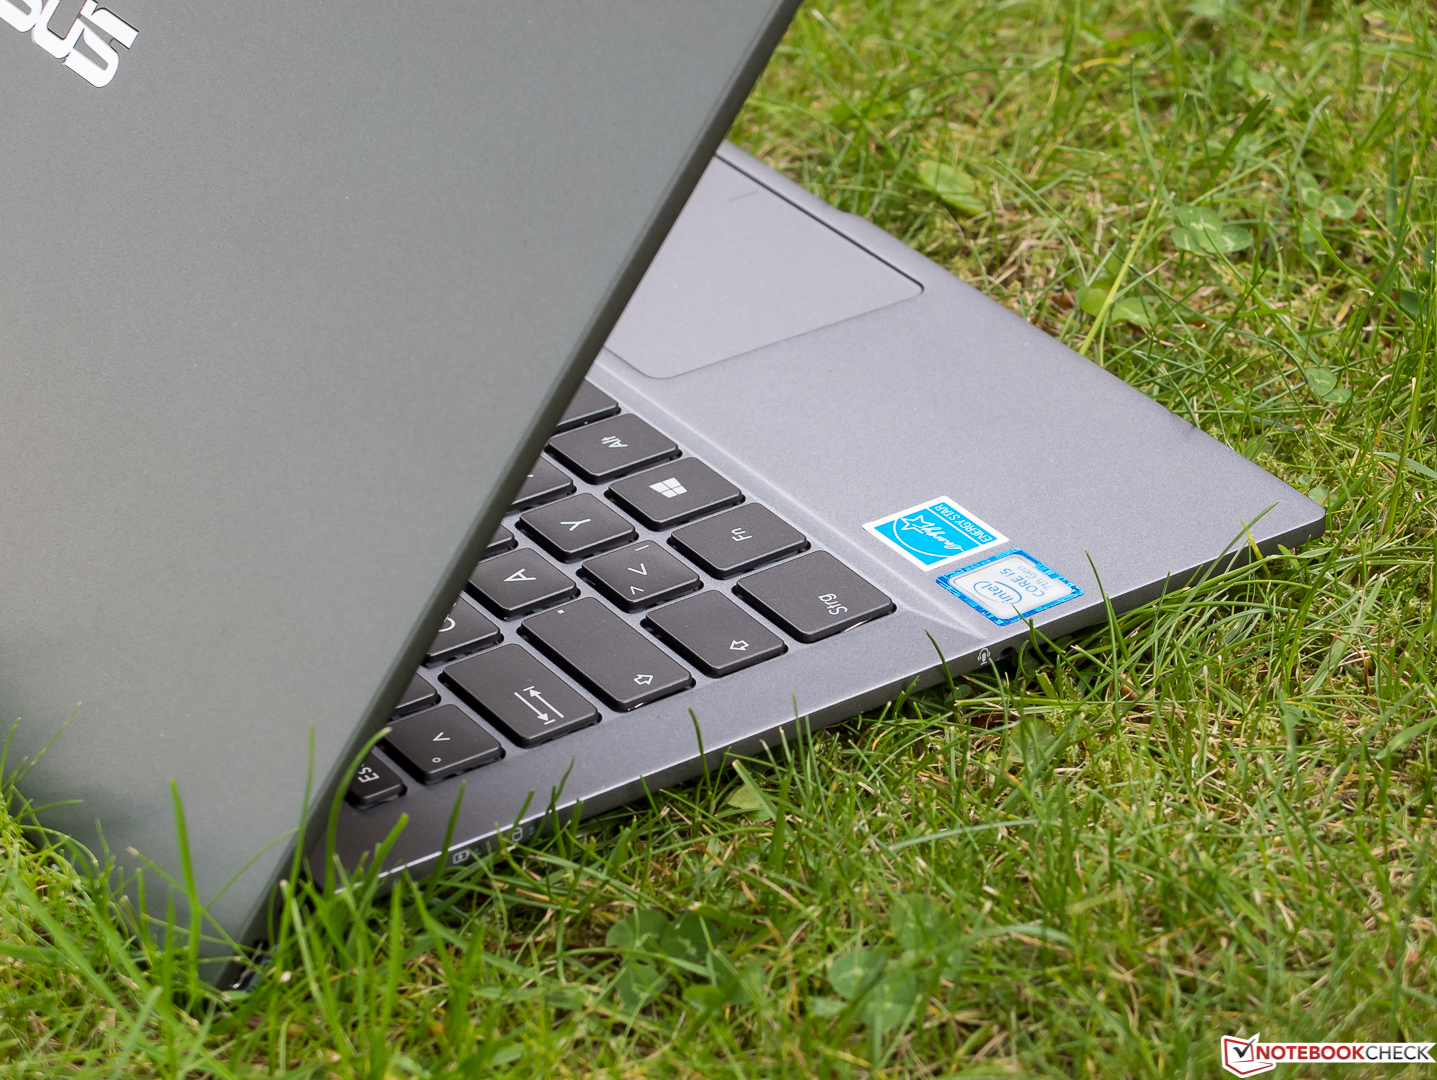
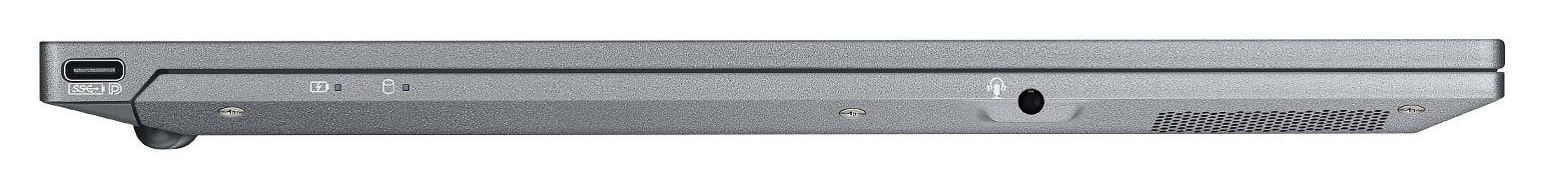
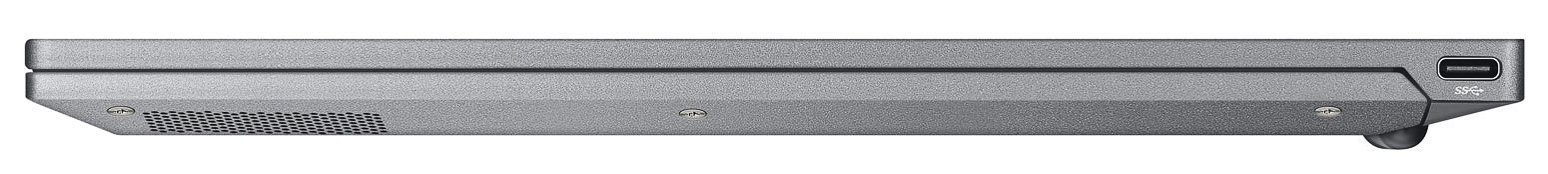
华硕牺牲了所有能在正常的笔记本上找是的接口,仅仅留下了两个USB-C接口,这将让很多用户放弃它。但是,如果不这么做,那么就做不到仅仅15mm的厚度和1.05kg的重量。
尽管它做出了很多的妥协。但它出色的键盘达到了它高售价的标准。而且附带的接口扩展器及保护壳也很让人喜欢。其安全功能反映了其极高的便携度。它是我们这几个月来测试过的最安静的笔记本之一,且其电池续航能力也令人印象深刻。除了接口外,其他在缺点列表上的项目都可以说是微不足道的,如果不是要求太高的话完全可以忽略。
华硕 Pro B9440UA 是一台高便携度的商务本。其注重于无线连接功能而且没有明显的缺点。尽管整体上它给我们留下了很好的印象,它的评分还是和“非常好”失之交臂。
在我们看来,我们所测试的欧洲型号(GV0100T,售价1200美元)是最合理的选择(但如果在大西洋彼岸的话应该多考虑售价为1000美元的配置更好的入门级型号),我们显然很推荐这款笔记本。
注:本文是基于完整评测的缩减版本,阅读完整的英文评测,请点击这里。
Asus ASUSPRO B9440UA-GV0100T
- 05/21/2017 v6 (old)
Sven Kloevekorn
Price comparison
