华硕 ASUSPRO Advanced B8430UA-FA0084E 笔记本电脑简短评测
| |||||||||||||||||||||||||
Brightness Distribution: 87 %
Center on Battery: 213 cd/m²
Contrast: 525:1 (Black: 0.4 cd/m²)
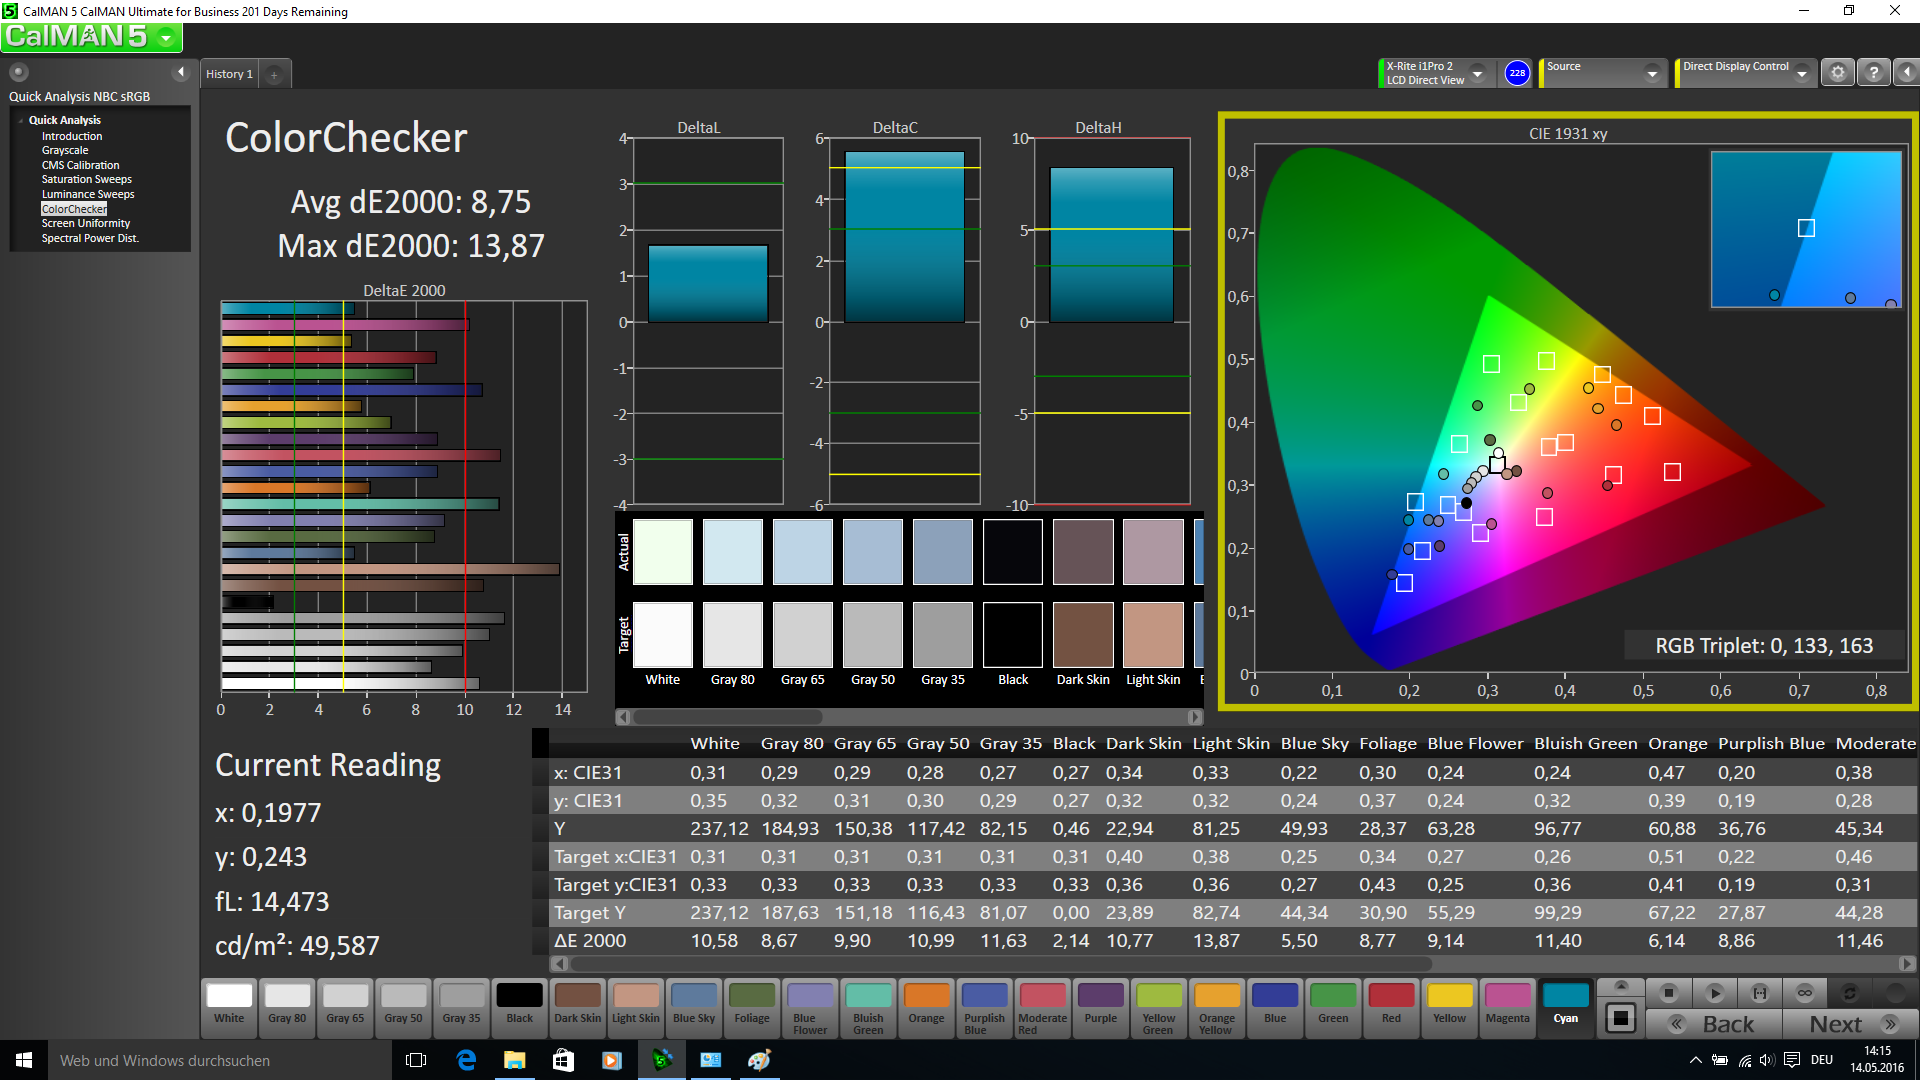
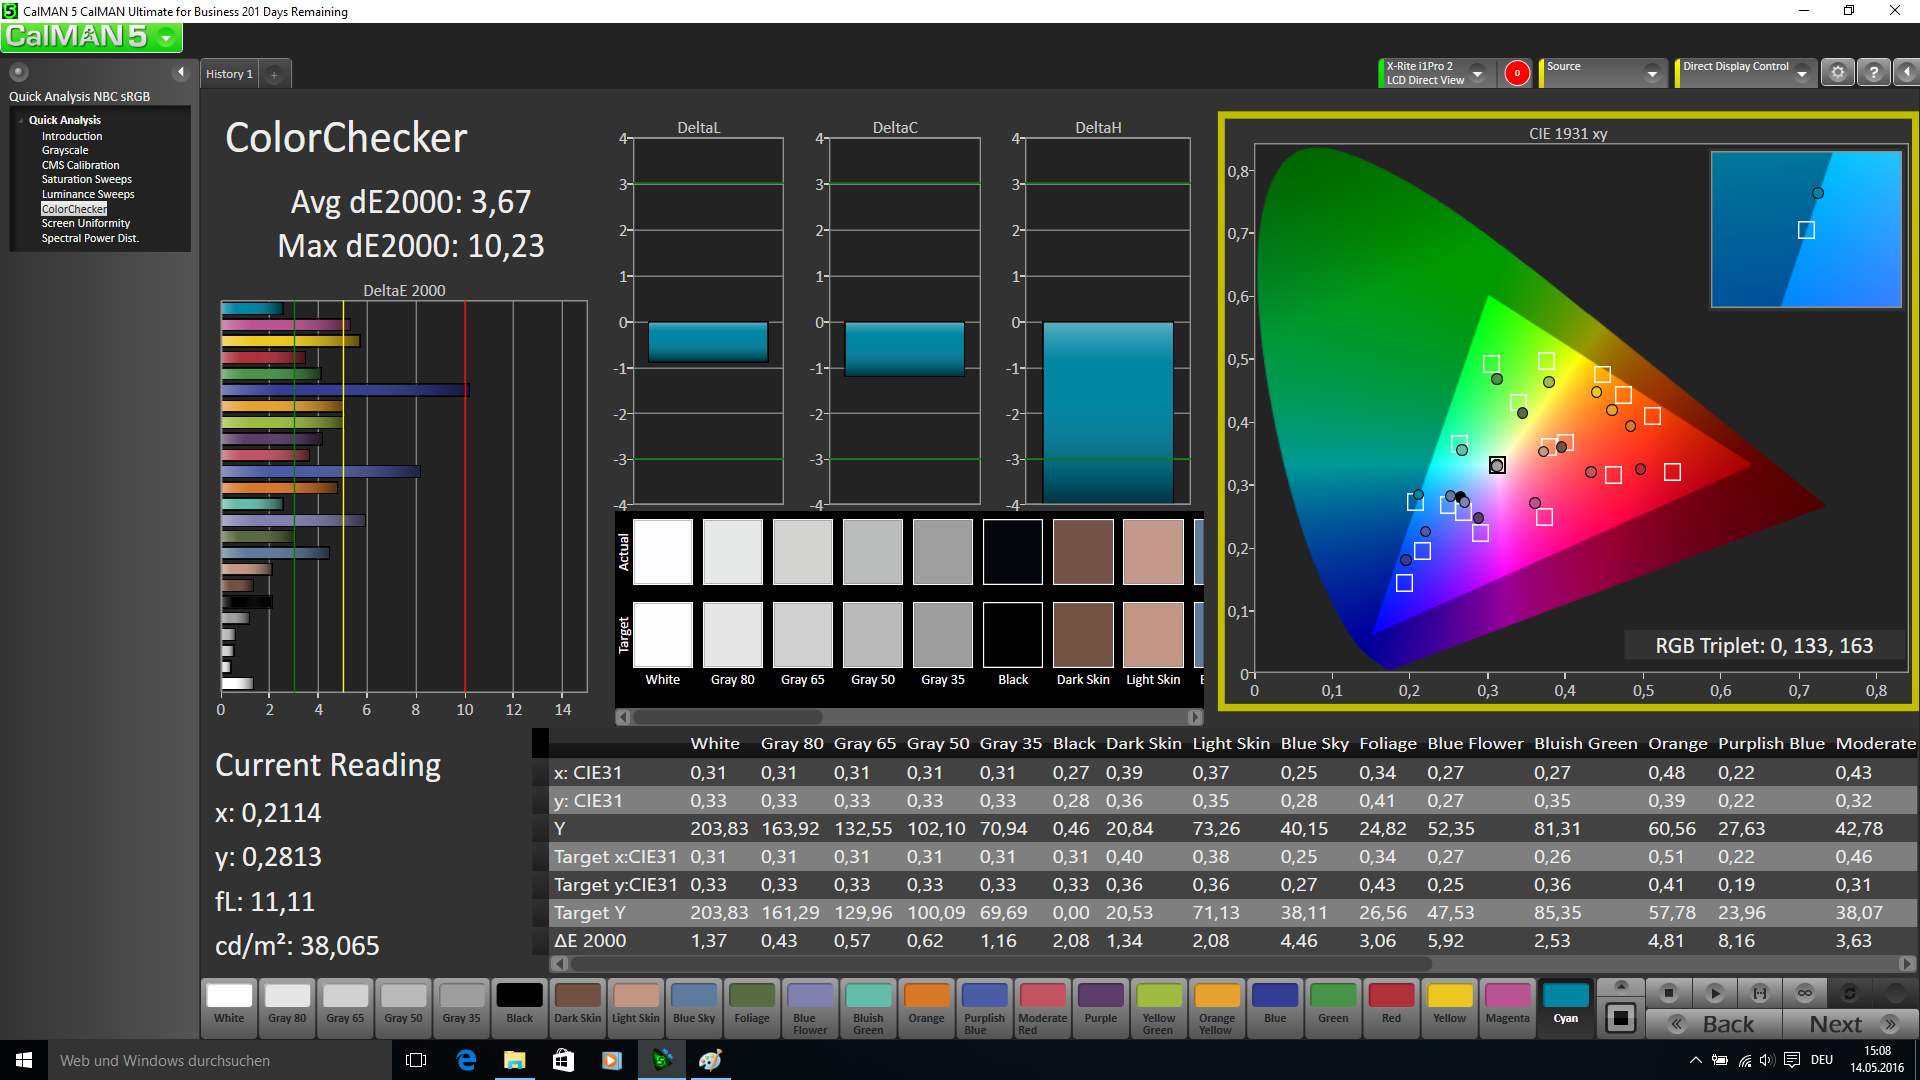
ΔE ColorChecker Calman: 8.75 | ∀{0.5-29.43 Ø4.71}
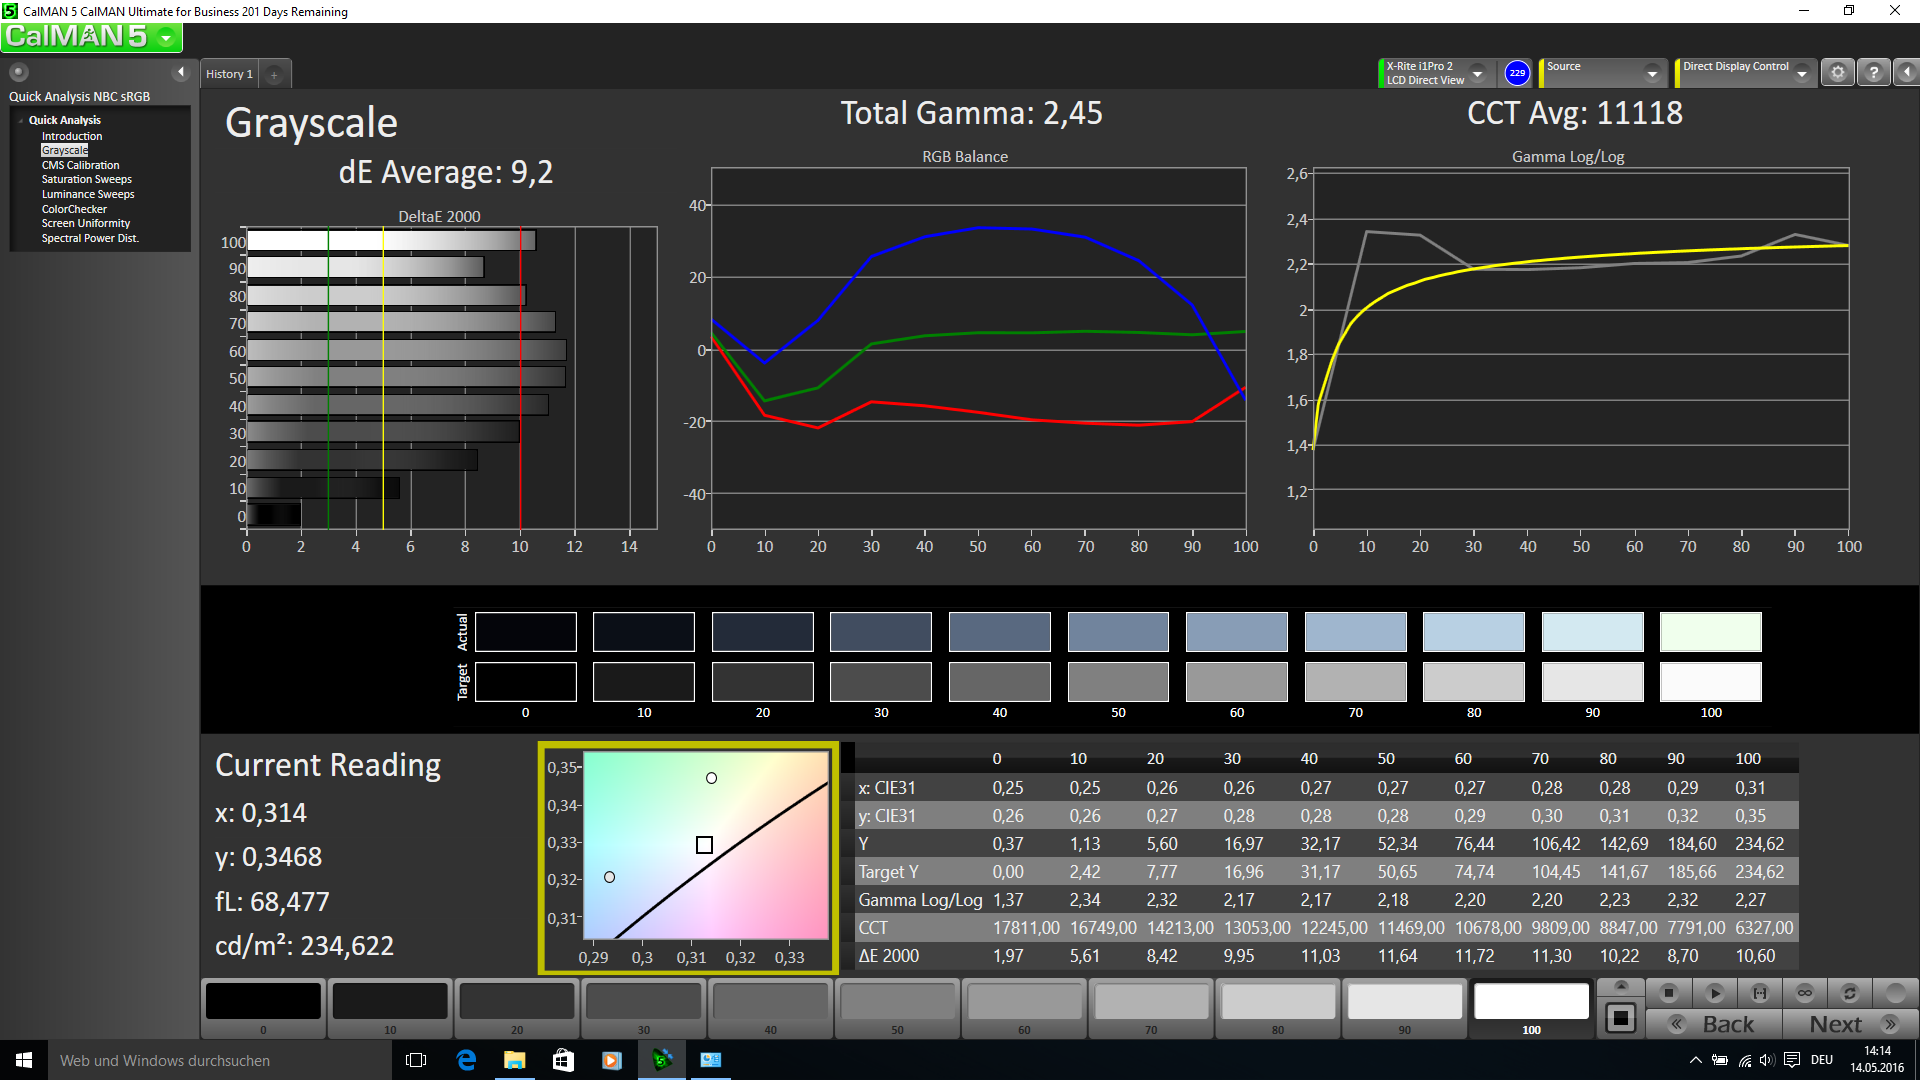
ΔE Greyscale Calman: 9.2 | ∀{0.09-98 Ø4.96}
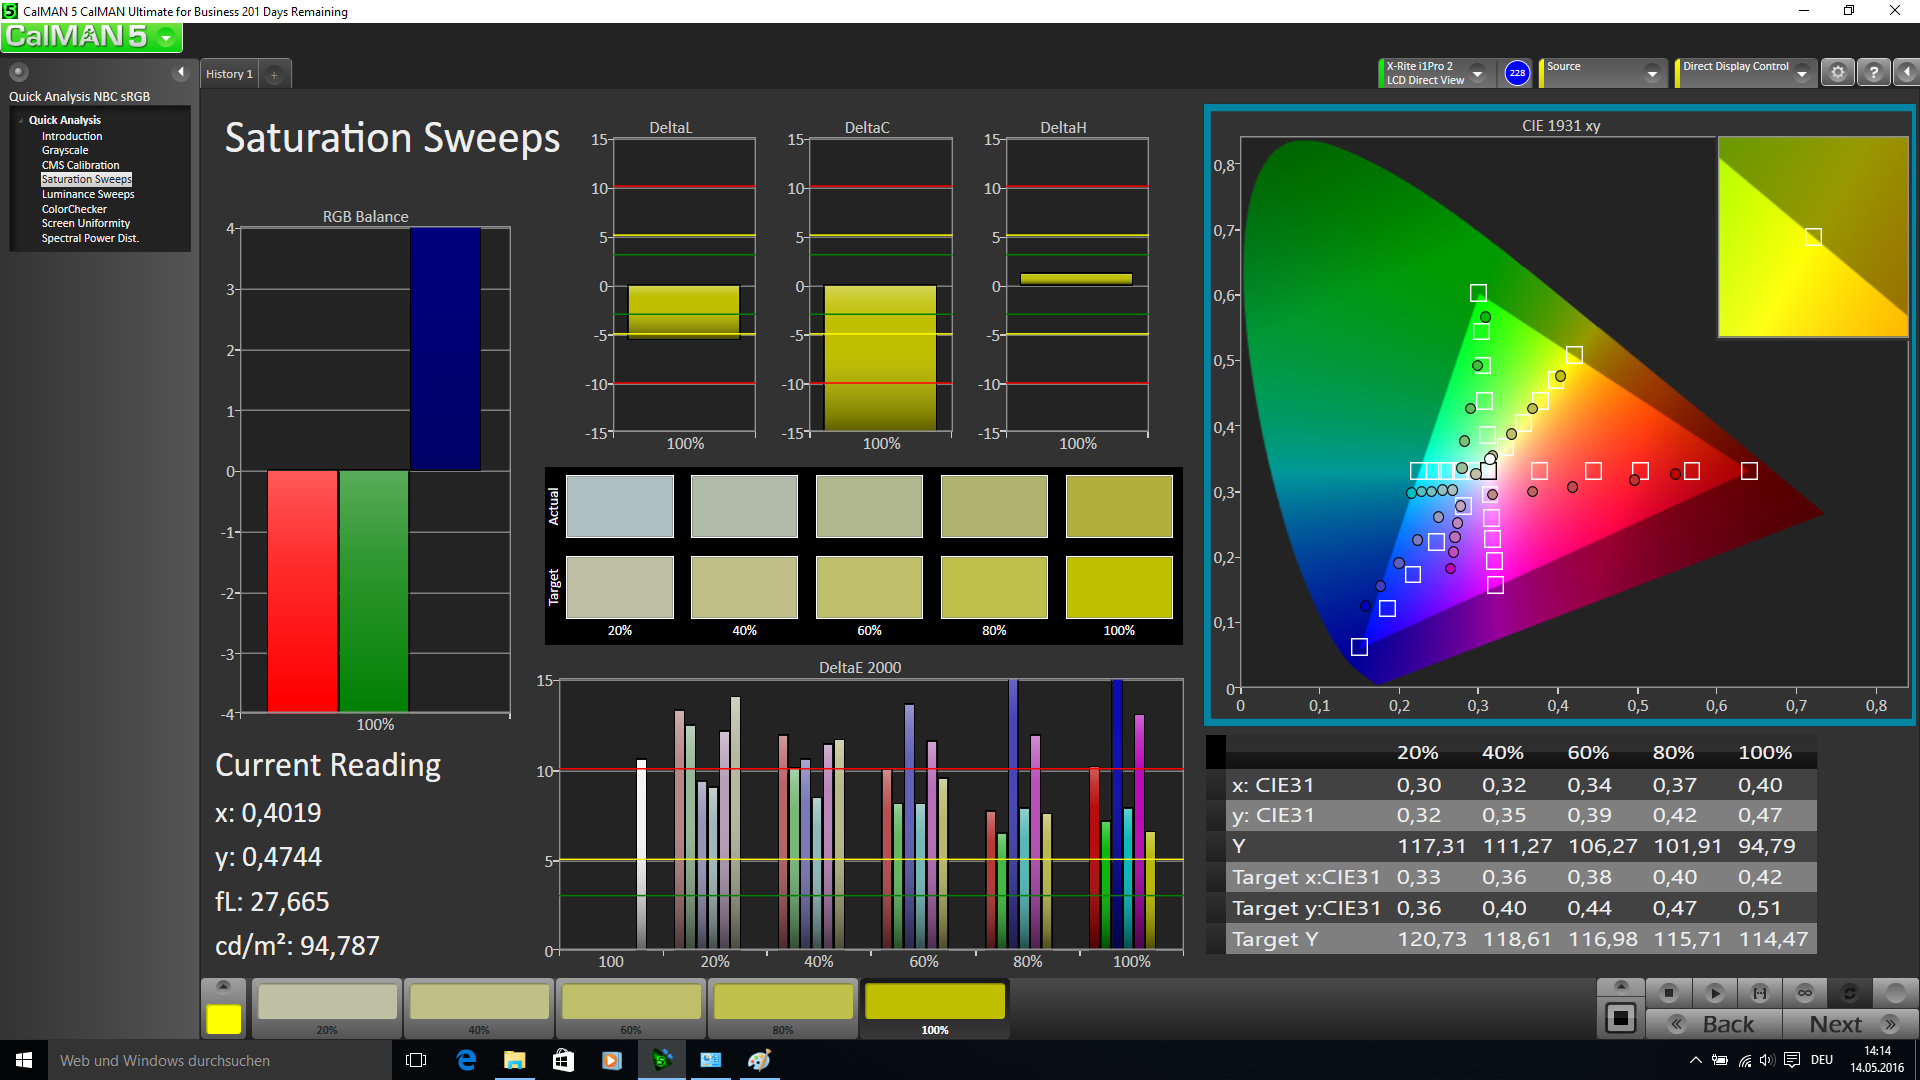
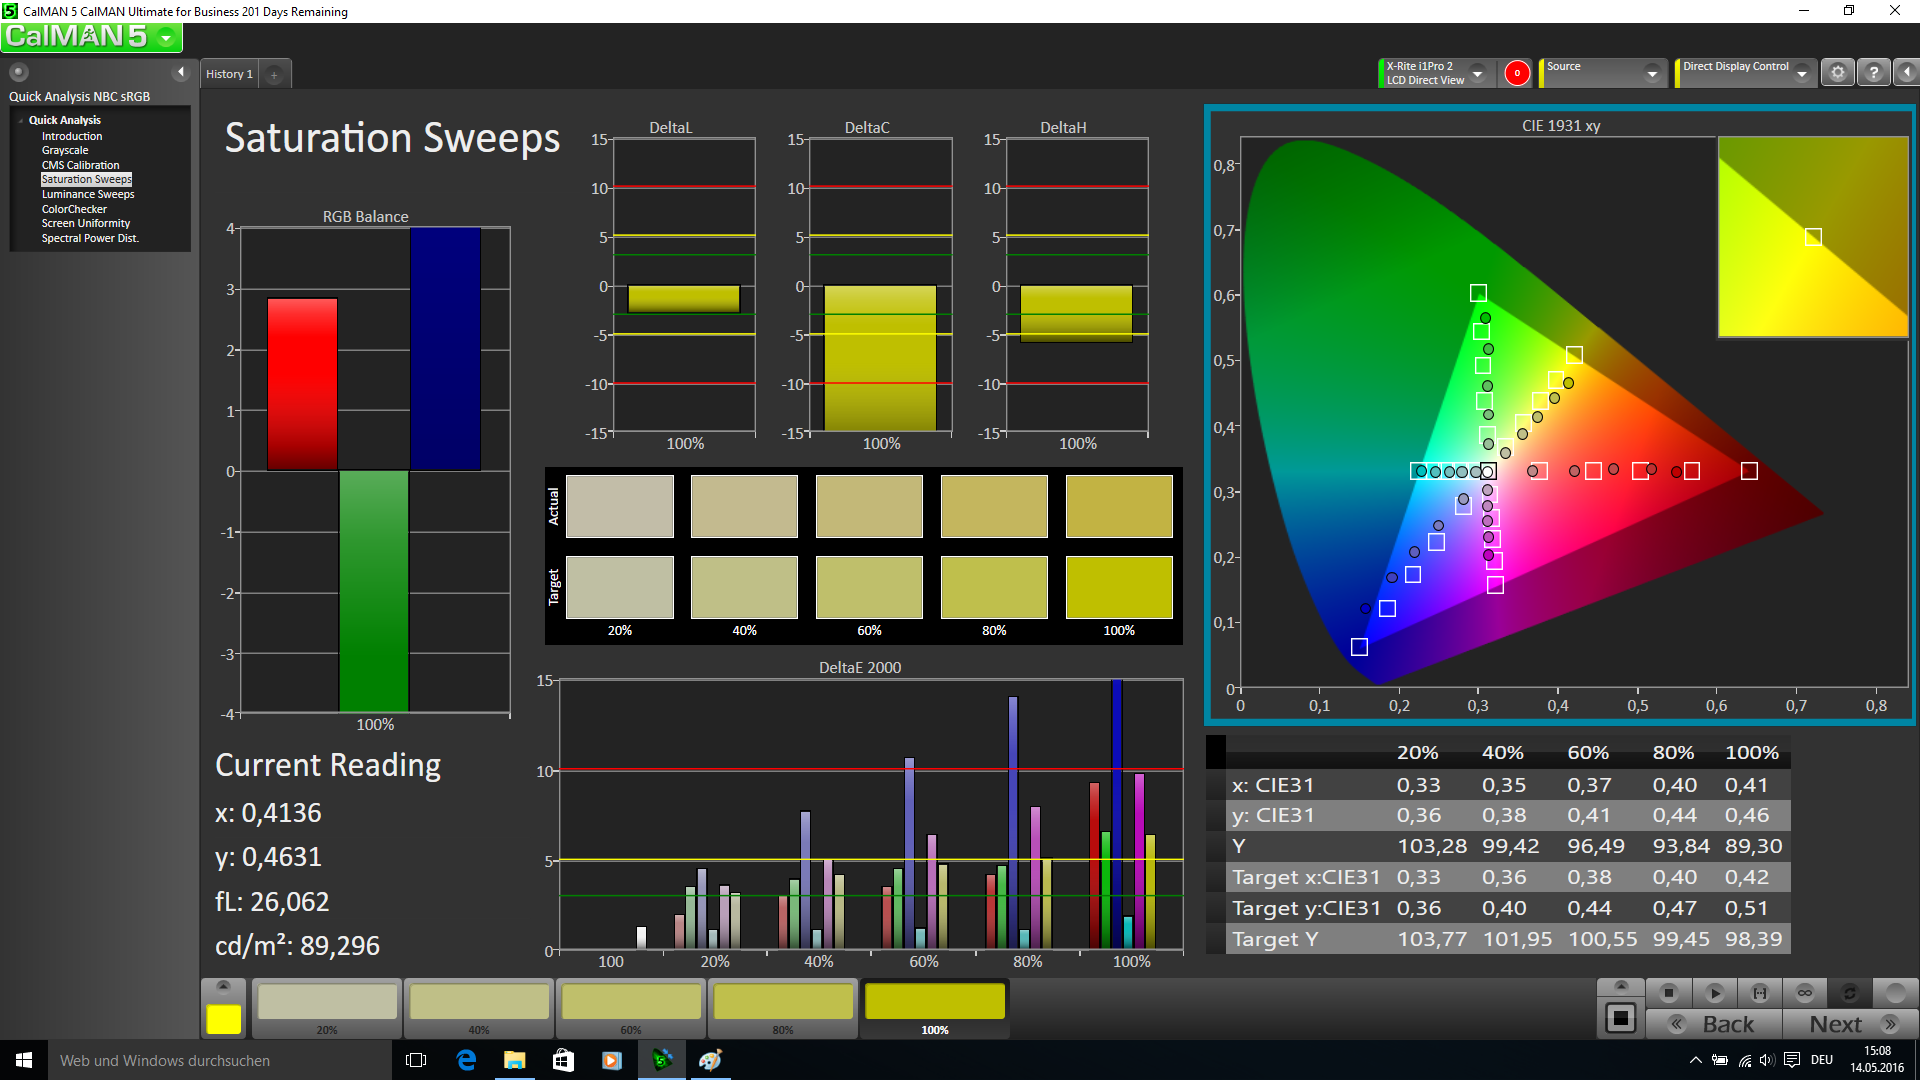
57.96% sRGB (Argyll 1.6.3 3D)
37.46% AdobeRGB 1998 (Argyll 1.6.3 3D)
40.63% AdobeRGB 1998 (Argyll 3D)
58.1% sRGB (Argyll 3D)
39.25% Display P3 (Argyll 3D)
Gamma: 2.45
CCT: 11118 K
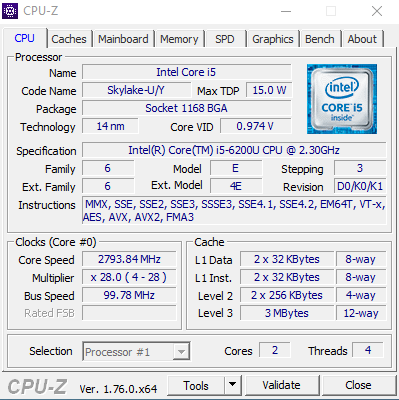
| Asus ASUSPRO Advanced B8430UA-FA0084E TN WLED, 1920x1080 | Asus ASUSPRO Advanced BU401LA-CZ020G TN-Panel, 1600x900 | Lenovo ThinkPad L460-20FVS01400 IPS, 1920x1080 | Dell Latitude 14 E5470 TN, 1366x768 | HP EliteBook 840 G3 T9X59ET#ABD TN LED, 1920x1080 | Lenovo ThinkPad T460s-20F9003SGE IPS, 1920x1080 | Lenovo ThinkPad T460-20FN003LGE IPS, 1920x1080 | |
|---|---|---|---|---|---|---|---|
| Display | 20% | 8% | 3% | 25% | 6% | 7% | |
| Display P3 Coverage (%) | 39.25 | 46.98 20% | 42.2 8% | 40.06 2% | 48.93 25% | 41.65 6% | 42.09 7% |
| sRGB Coverage (%) | 58.1 | 69.8 20% | 62.3 7% | 60.3 4% | 73.7 27% | 61.6 6% | 62 7% |
| AdobeRGB 1998 Coverage (%) | 40.63 | 48.67 20% | 43.72 8% | 41.42 2% | 50.5 24% | 43.14 6% | 43.6 7% |
| Response Times | -23% | -36% | -10% | -19% | -9% | ||
| Response Time Grey 50% / Grey 80% * (ms) | 42 ? | 44.4 ? -6% | 56.8 ? -35% | 43 ? -2% | 42 ? -0% | 42.4 ? -1% | |
| Response Time Black / White * (ms) | 21.2 ? | 29.6 ? -40% | 28.8 ? -36% | 25 ? -18% | 29.2 ? -38% | 24.8 ? -17% | |
| PWM Frequency (Hz) | 204 ? | ||||||
| Screen | -2% | 19% | -16% | 10% | 20% | 14% | |
| Brightness middle (cd/m²) | 210 | 216 3% | 245 17% | 229 9% | 366 74% | 226 8% | 230 10% |
| Brightness (cd/m²) | 207 | 209 1% | 225 9% | 207 0% | 336 62% | 211 2% | 216 4% |
| Brightness Distribution (%) | 87 | 89 2% | 83 -5% | 80 -8% | 87 0% | 89 2% | 85 -2% |
| Black Level * (cd/m²) | 0.4 | 0.436 -9% | 0.24 40% | 0.69 -73% | 0.65 -63% | 0.22 45% | 0.26 35% |
| Contrast (:1) | 525 | 495 -6% | 1021 94% | 332 -37% | 563 7% | 1027 96% | 885 69% |
| Colorchecker dE 2000 * | 8.75 | 9.63 -10% | 6.89 21% | 10.16 -16% | 10.26 -17% | 6.44 26% | 7.32 16% |
| Colorchecker dE 2000 max. * | 13.87 | 17.62 -27% | 17.18 -24% | 17.18 -24% | 18.14 -31% | ||
| Greyscale dE 2000 * | 9.2 | 10.72 -17% | 6.45 30% | 10.87 -18% | 11.51 -25% | 5.87 36% | 6.98 24% |
| Gamma | 2.45 90% | 2.49 88% | 2.46 89% | 2.41 91% | 2.4 92% | 2.37 93% | 2.5 88% |
| CCT | 11118 58% | 12873 50% | 6857 95% | 12881 50% | 12725 51% | 6856 95% | 6683 97% |
| Color Space (Percent of AdobeRGB 1998) (%) | 37.46 | 44.8 20% | 40.1 7% | 38.4 3% | 47 25% | 39.58 6% | 39.97 7% |
| Color Space (Percent of sRGB) (%) | 57.96 | 61.8 7% | 60.4 4% | 74 28% | 61.15 6% | 61.55 6% | |
| Total Average (Program / Settings) | 9% /
4% | 1% /
11% | -16% /
-15% | 8% /
11% | 2% /
12% | 4% /
9% |
* ... smaller is better
Display Response Times
| ↔ Response Time Black to White | ||
|---|---|---|
| 21.2 ms ... rise ↗ and fall ↘ combined | ↗ 16.8 ms rise | 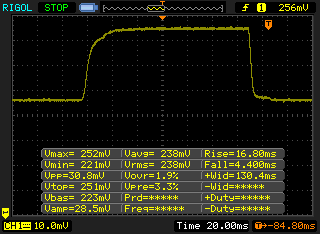 |
| ↘ 4.4 ms fall | ||
| The screen shows good response rates in our tests, but may be too slow for competitive gamers. In comparison, all tested devices range from 0.1 (minimum) to 240 (maximum) ms. » 48 % of all devices are better. This means that the measured response time is similar to the average of all tested devices (19.8 ms). | ||
| ↔ Response Time 50% Grey to 80% Grey | ||
| 42 ms ... rise ↗ and fall ↘ combined | ↗ 22.4 ms rise | 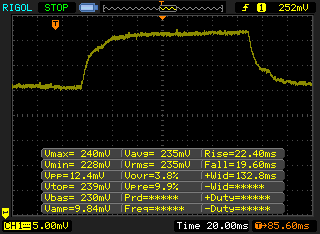 |
| ↘ 19.6 ms fall | ||
| The screen shows slow response rates in our tests and will be unsatisfactory for gamers. In comparison, all tested devices range from 0.165 (minimum) to 636 (maximum) ms. » 67 % of all devices are better. This means that the measured response time is worse than the average of all tested devices (31 ms). | ||
Screen Flickering / PWM (Pulse-Width Modulation)
| Screen flickering / PWM not detected | ||
In comparison: 52 % of all tested devices do not use PWM to dim the display. If PWM was detected, an average of 7754 (minimum: 5 - maximum: 343500) Hz was measured. | ||
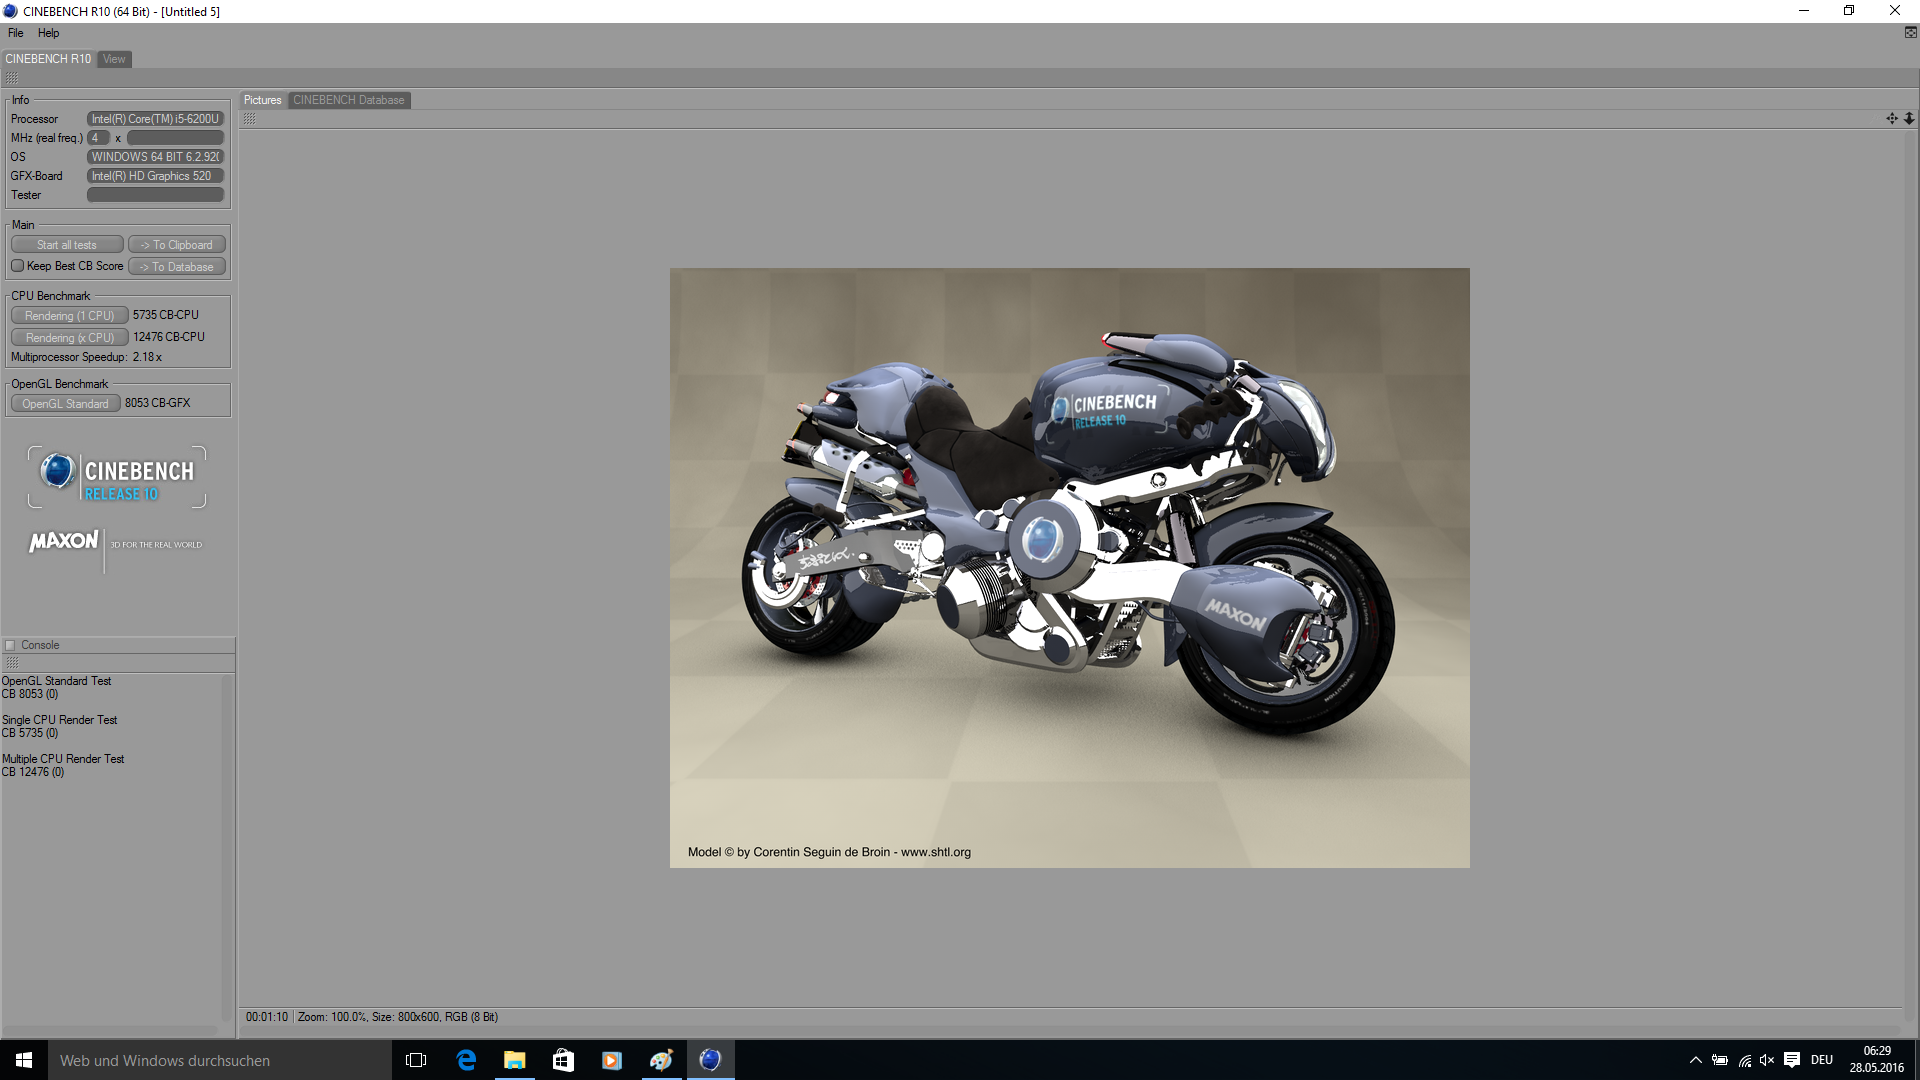
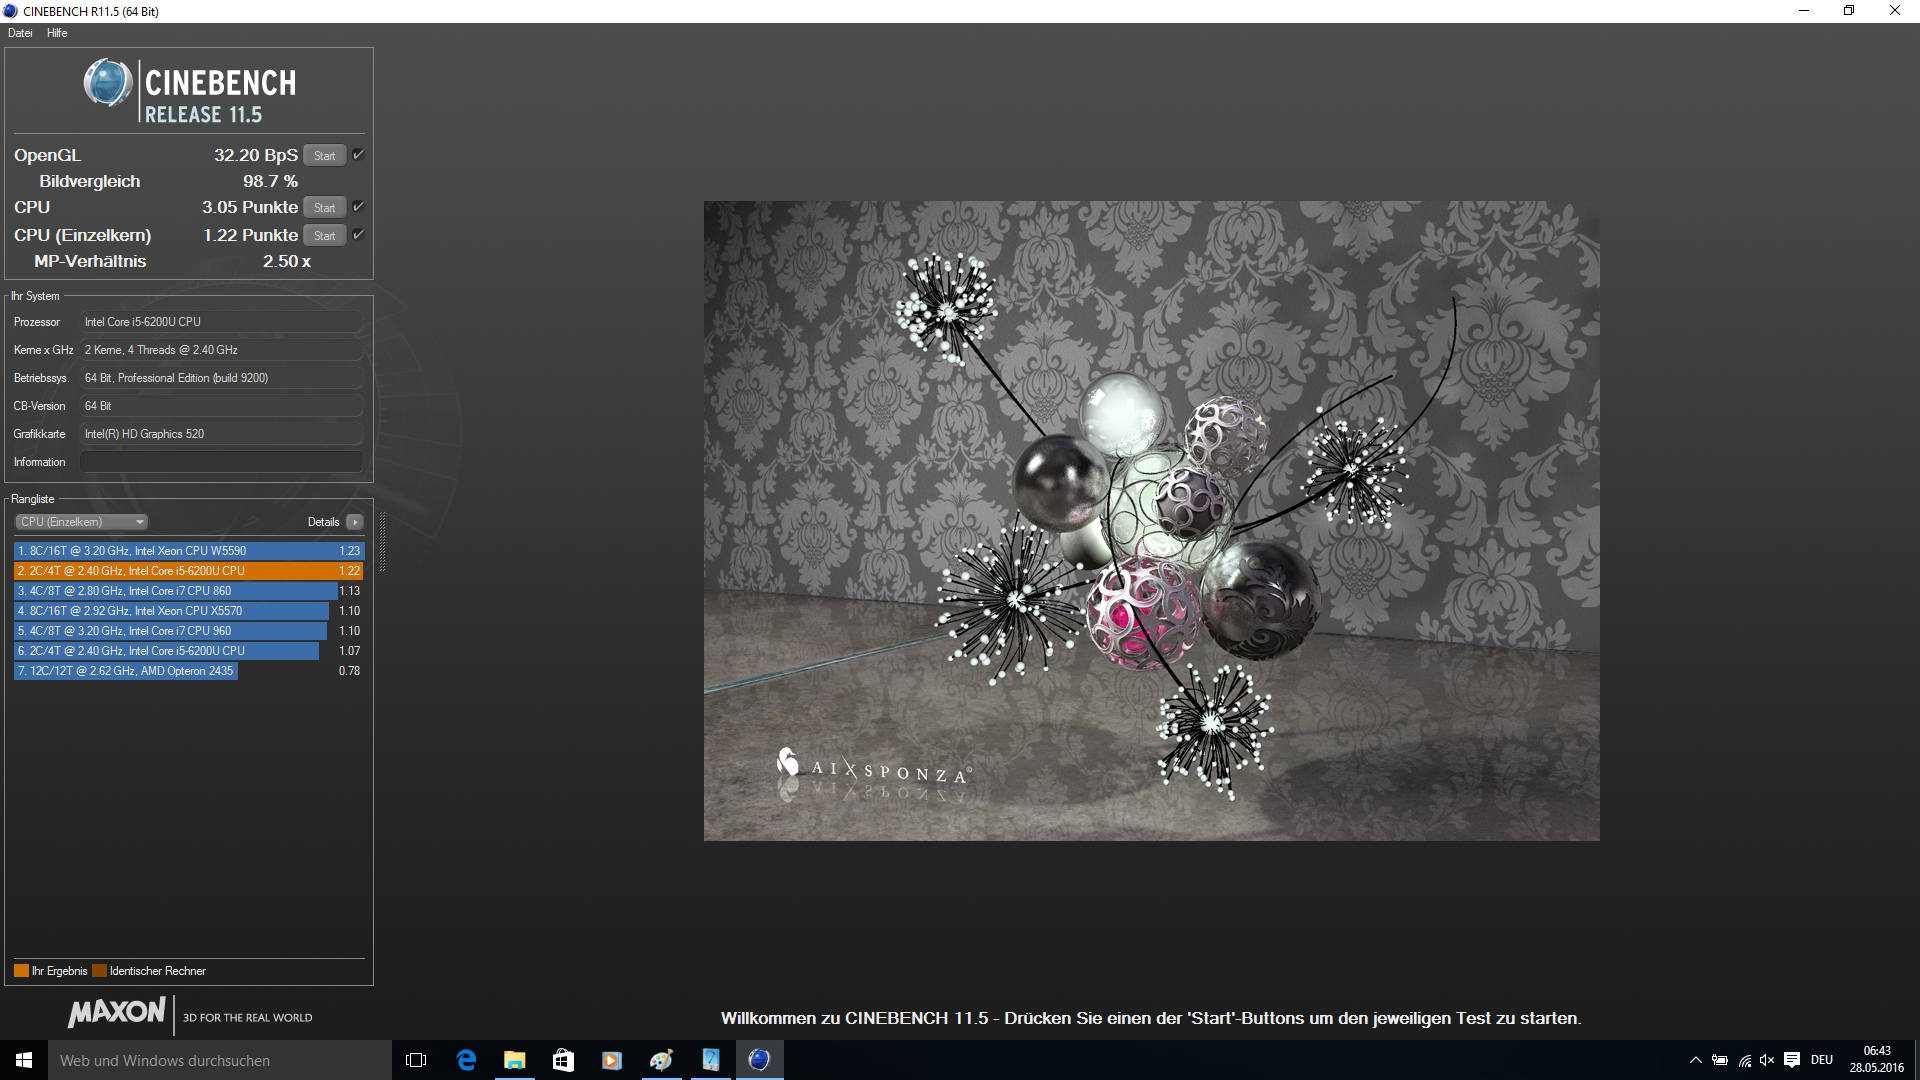
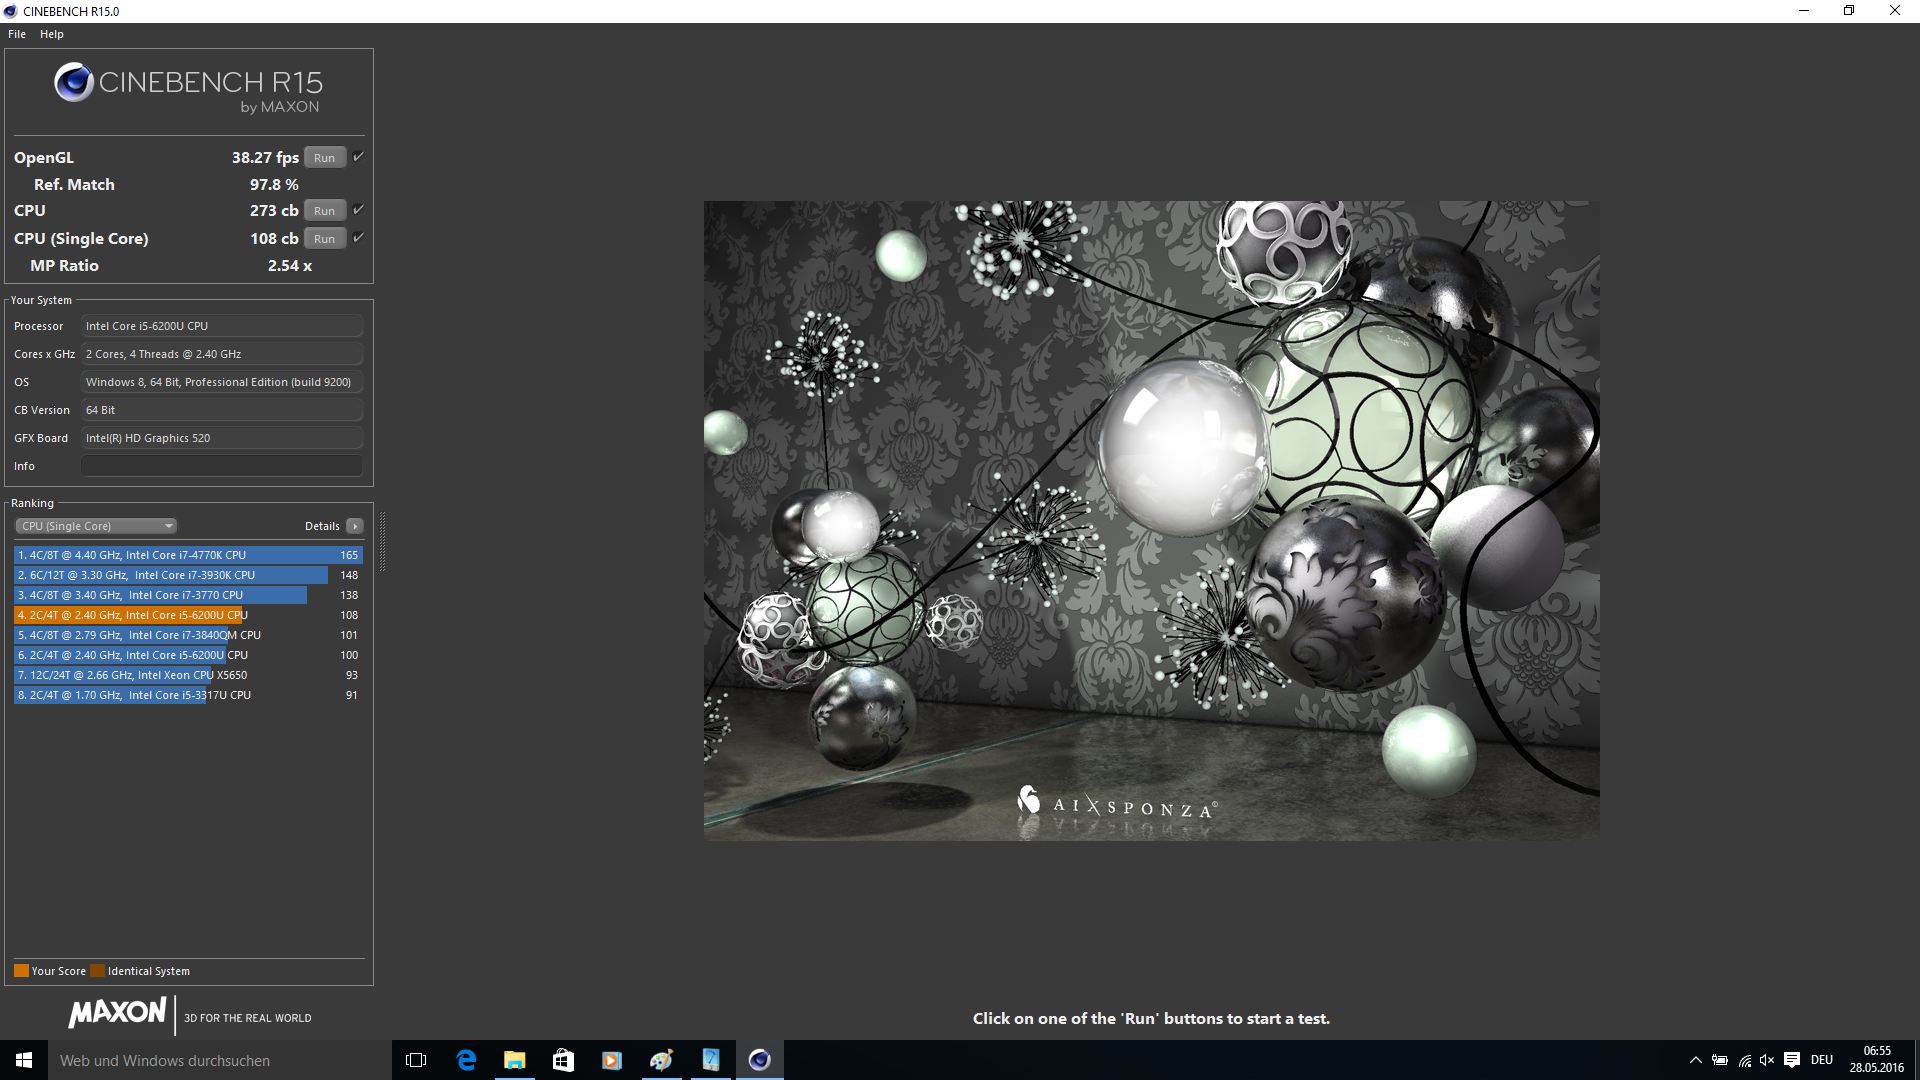
| Cinebench R10 | |
| Rendering Single CPUs 64Bit (sort by value) | |
| Asus ASUSPRO Advanced B8430UA-FA0084E | |
| Asus ASUSPRO Advanced BU401LA-CZ020G | |
| Dell Latitude 14 E5470 | |
| Rendering Multiple CPUs 64Bit (sort by value) | |
| Asus ASUSPRO Advanced B8430UA-FA0084E | |
| Asus ASUSPRO Advanced BU401LA-CZ020G | |
| Dell Latitude 14 E5470 | |
* ... smaller is better
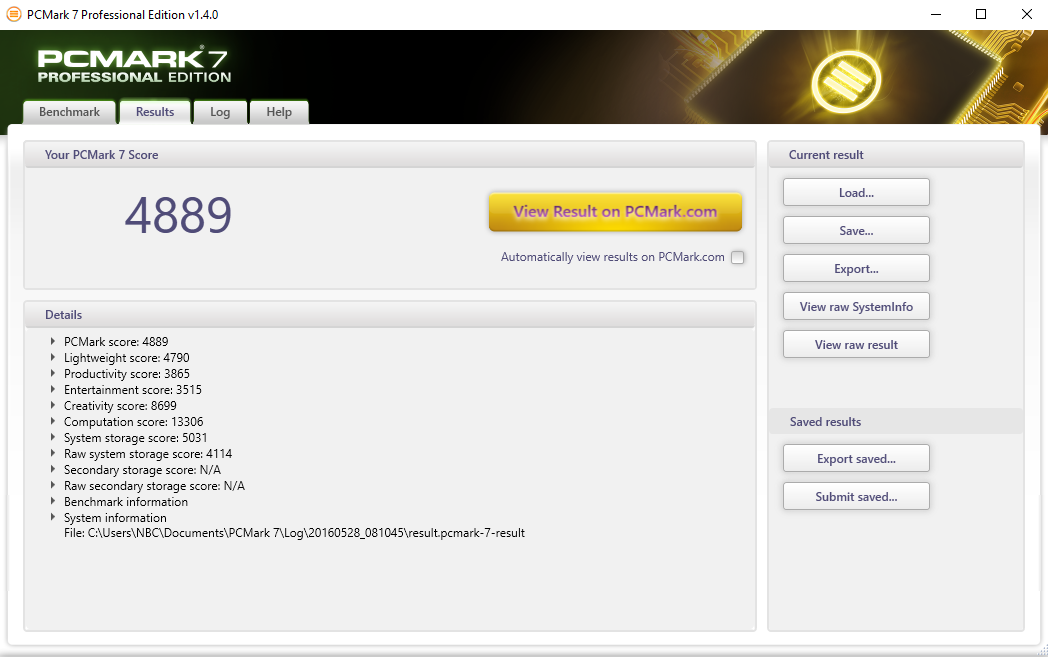
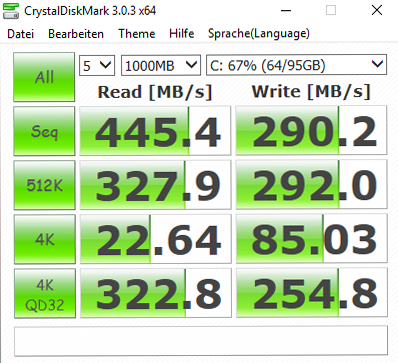
| PCMark 7 Score | 4889 points | |
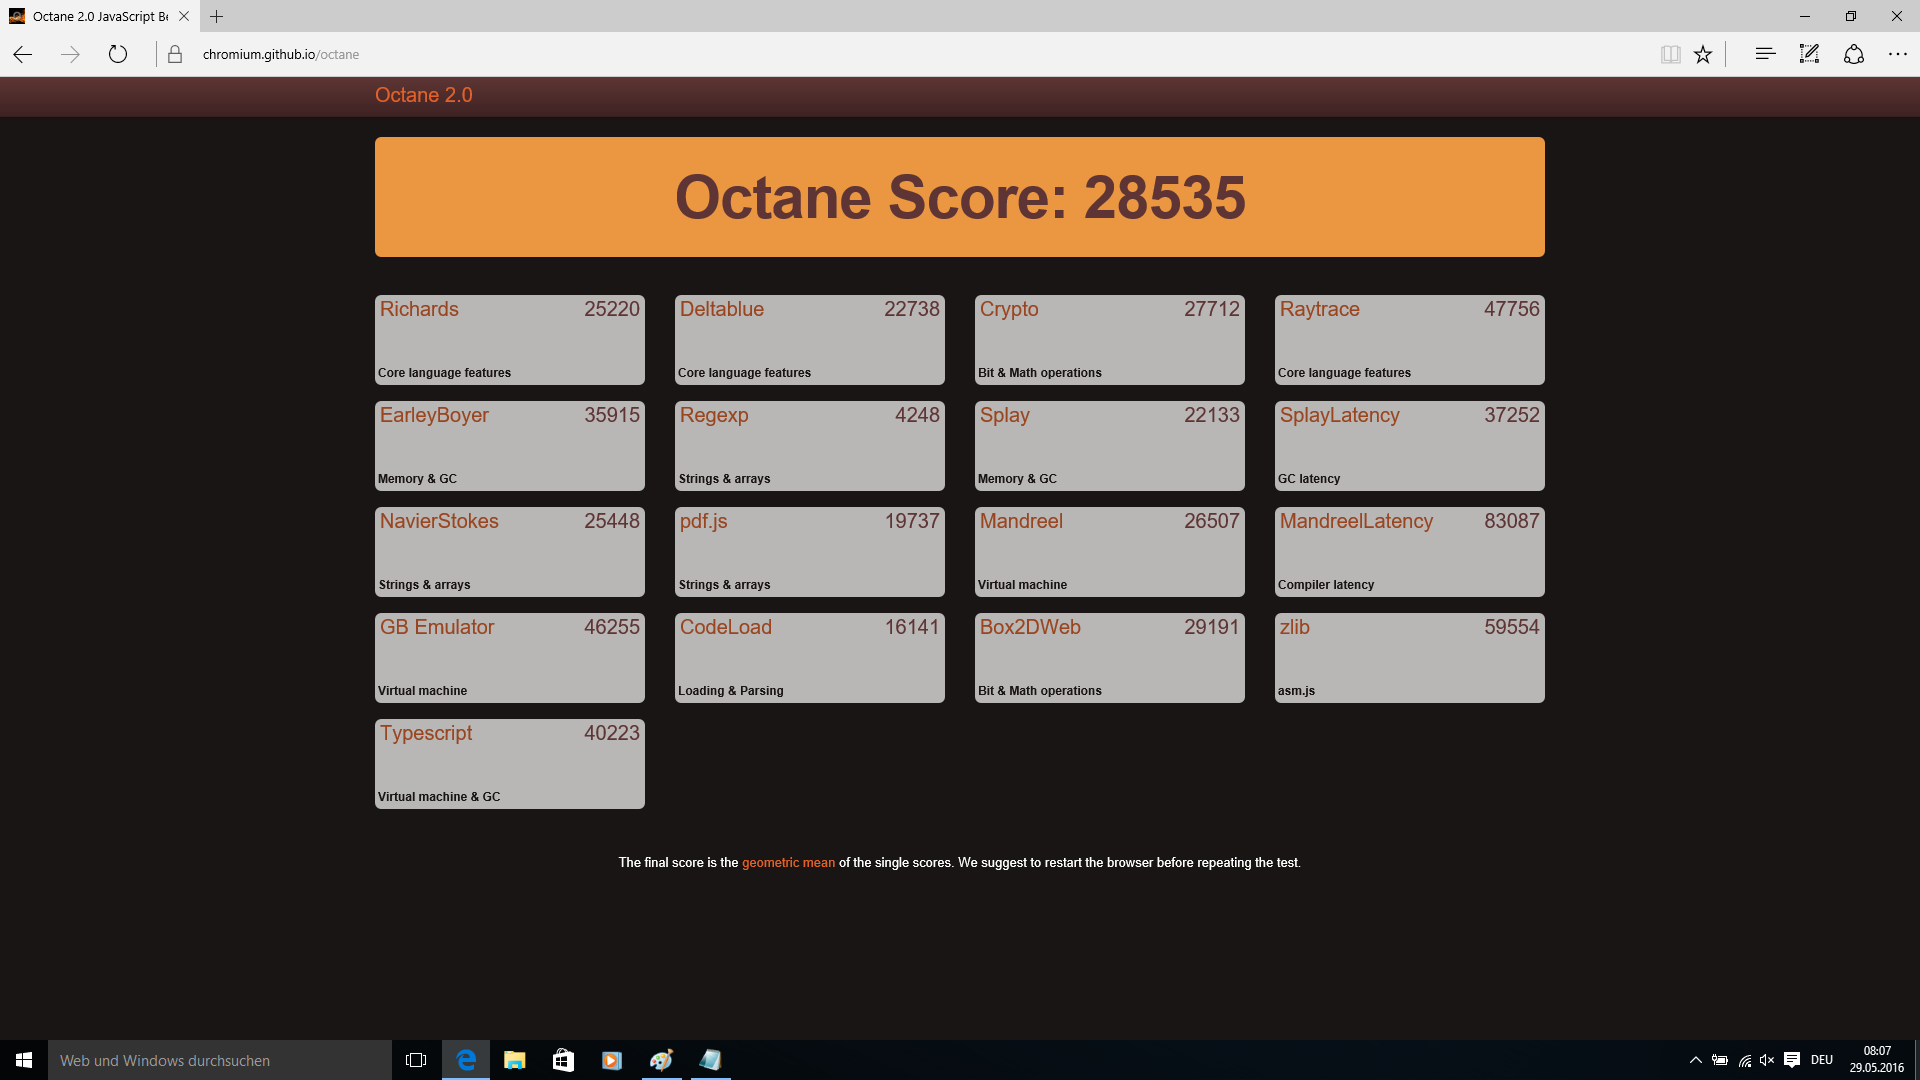
| PCMark 8 Home Score Accelerated v2 | 3309 points | |
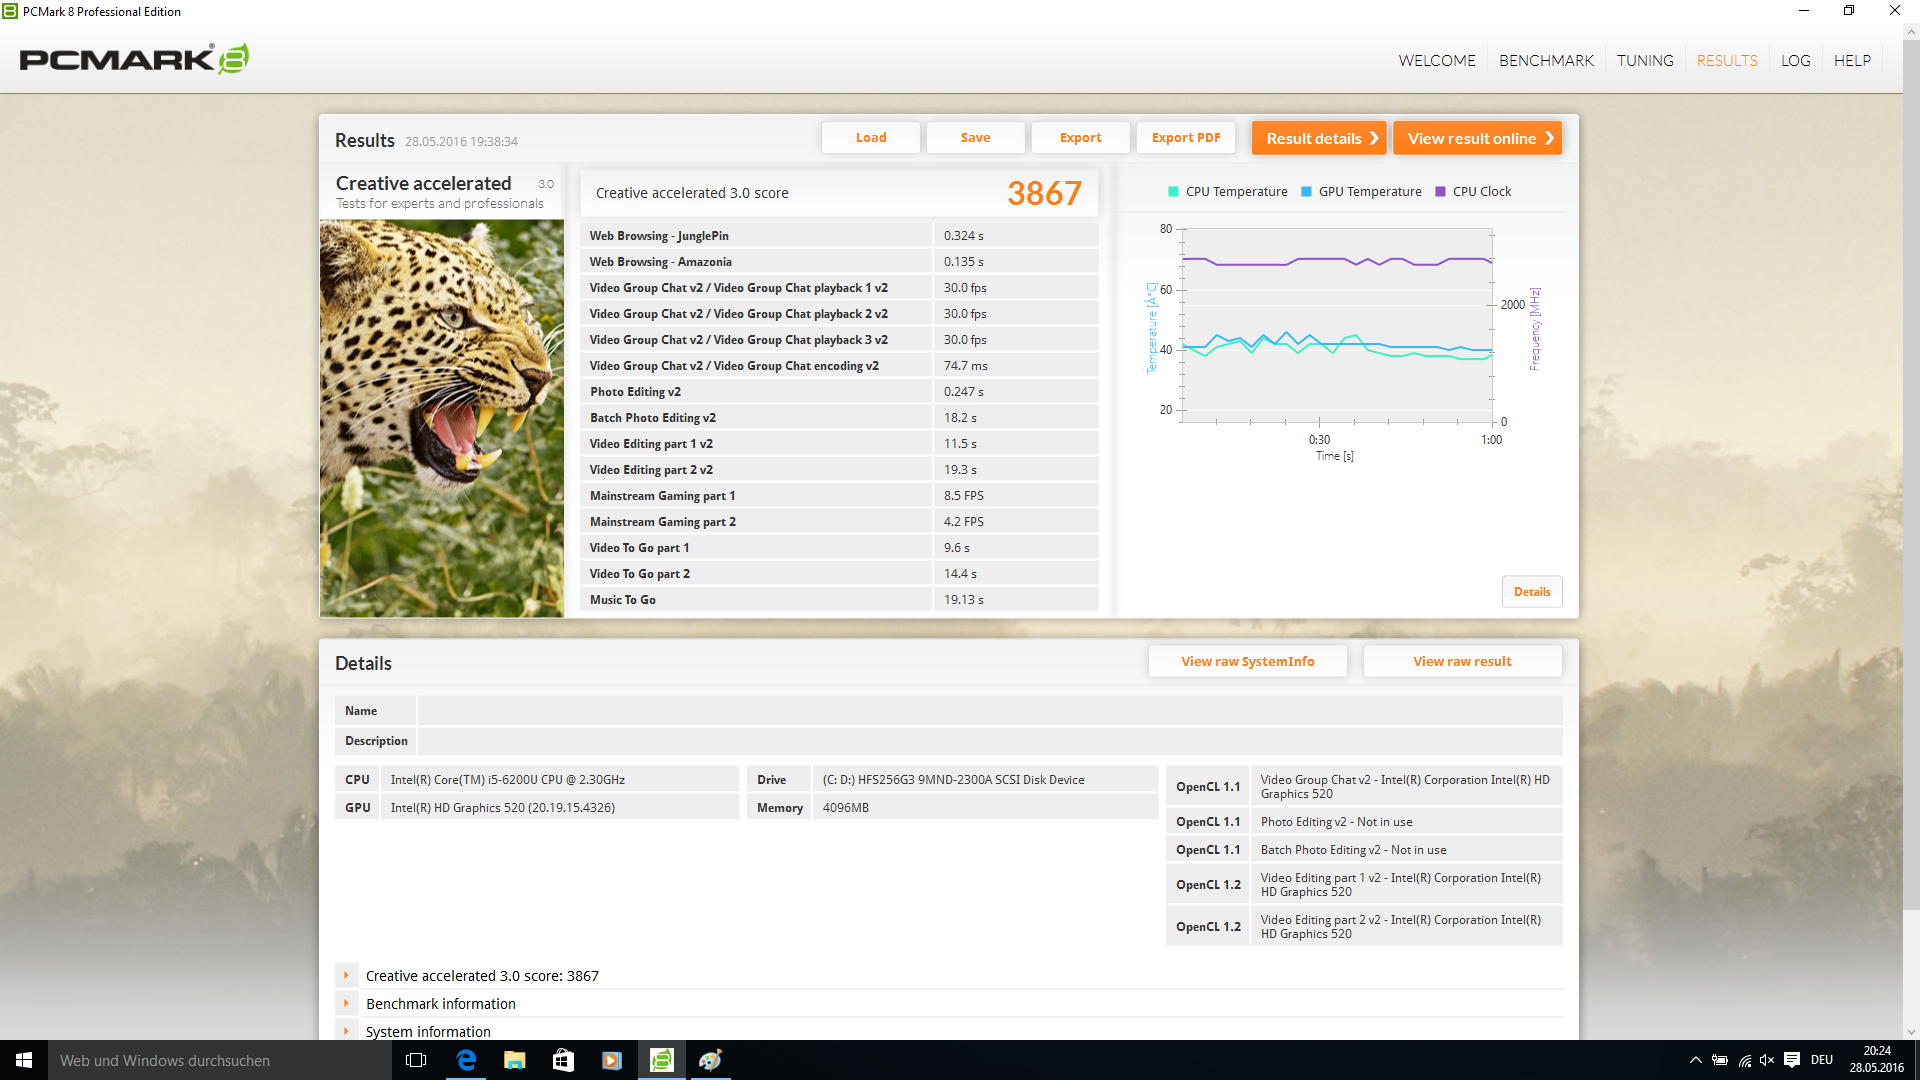
| PCMark 8 Creative Score Accelerated v2 | 3867 points | |
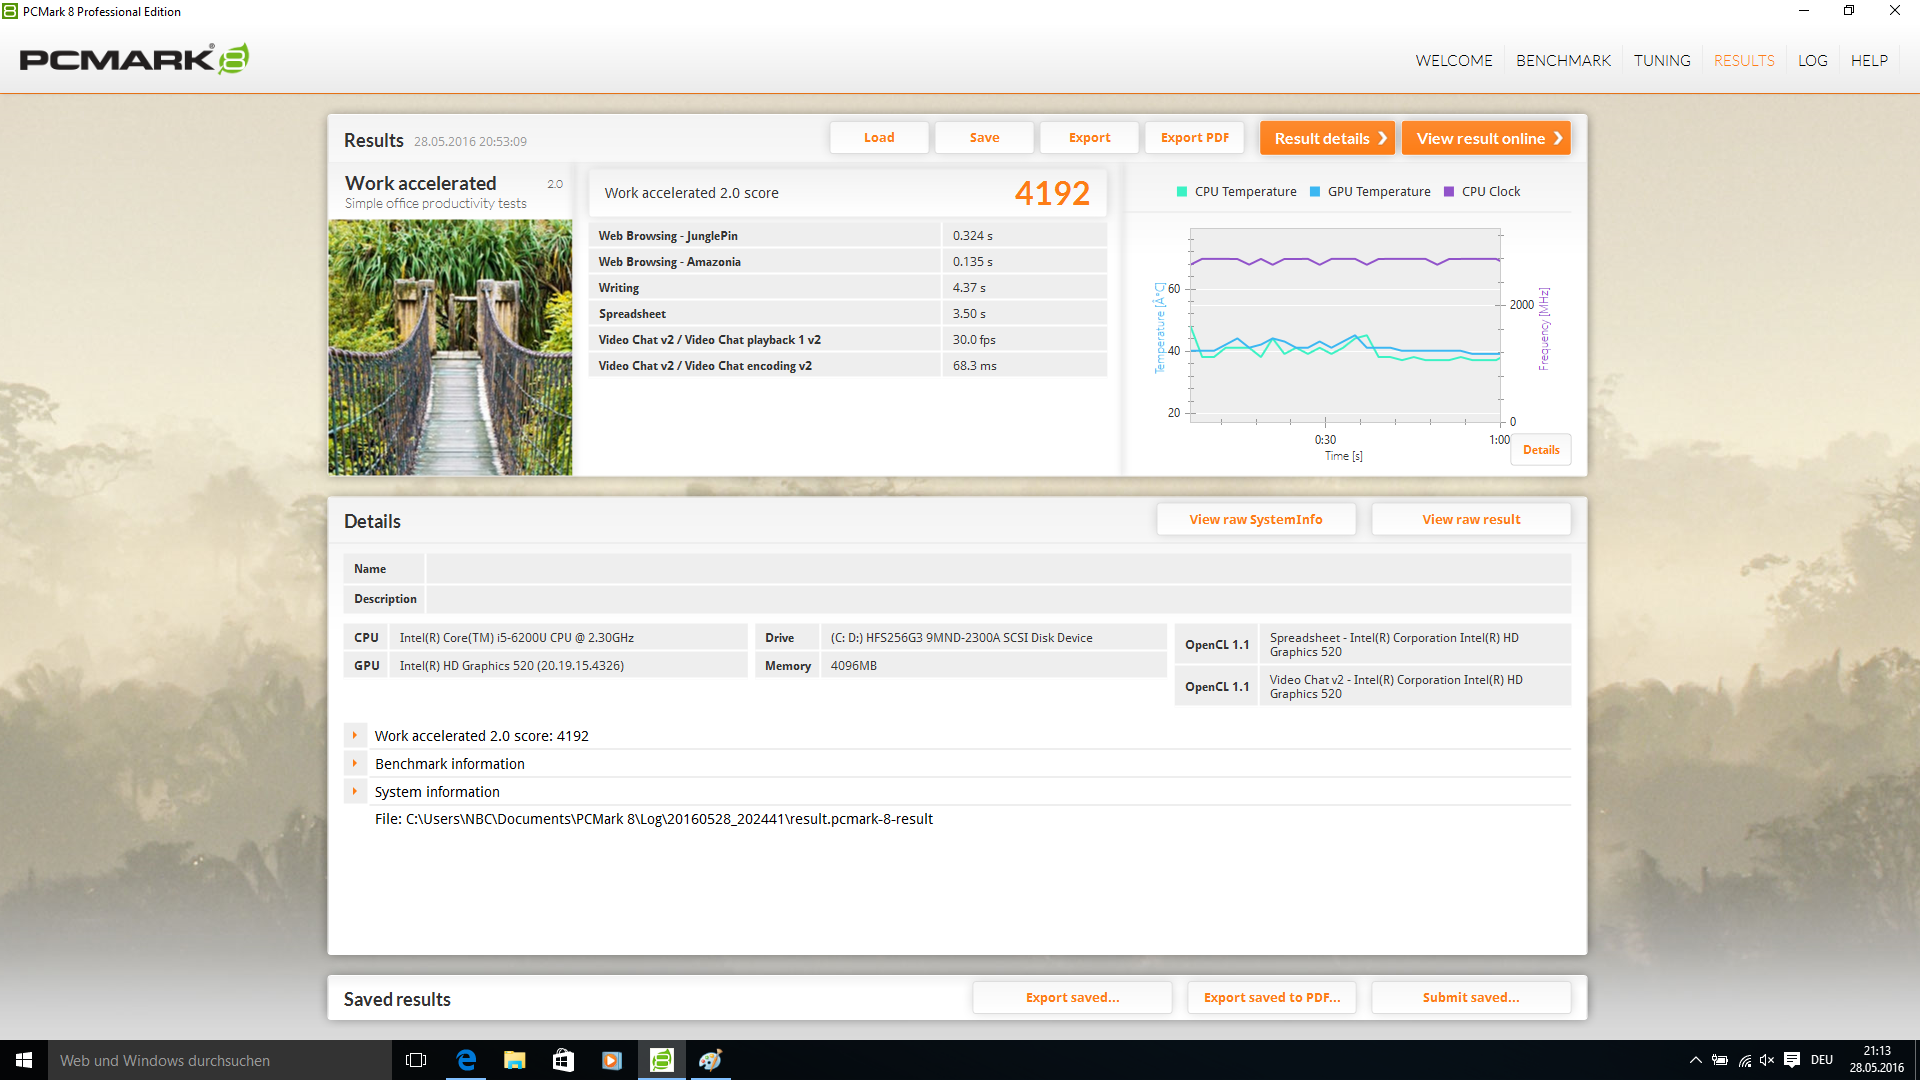
| PCMark 8 Work Score Accelerated v2 | 4192 points | |
Help | ||

| 3DMark 06 - 1280x1024 Standard Score AA:0x AF:0x (sort by value) | |
| Asus ASUSPRO Advanced B8430UA-FA0084E | |
| Lenovo ThinkPad L460-20FVS01400 | |
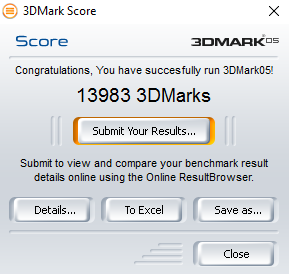
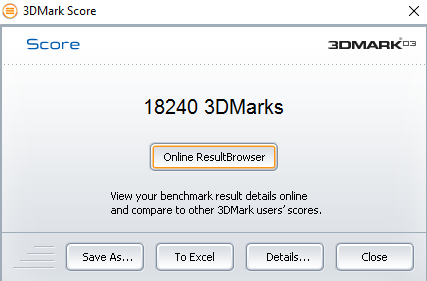
| 3DMark 03 Standard | 18240 points | |
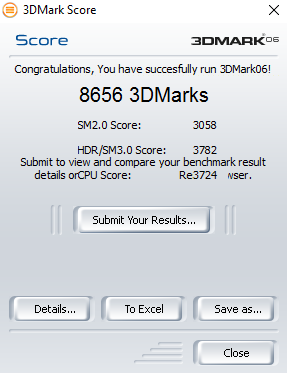
| 3DMark 06 Standard Score | 8656 points | |
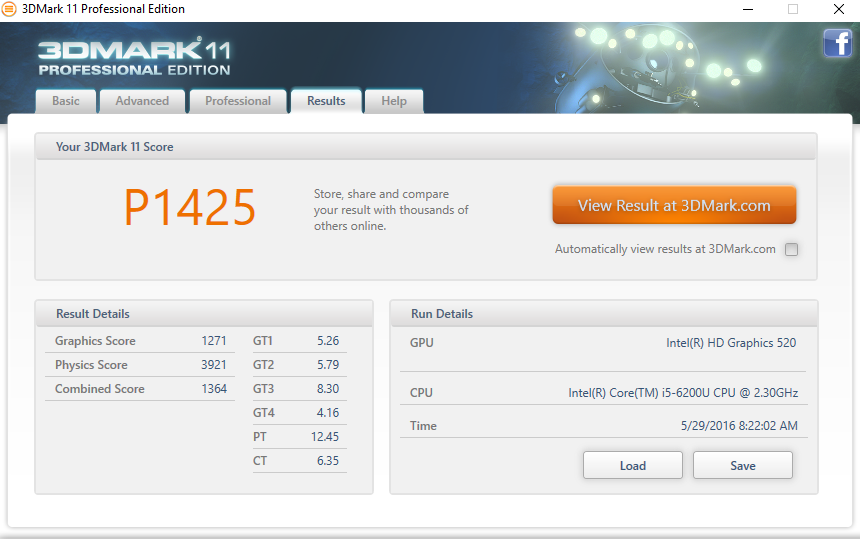
| 3DMark 11 Performance | 1425 points | |
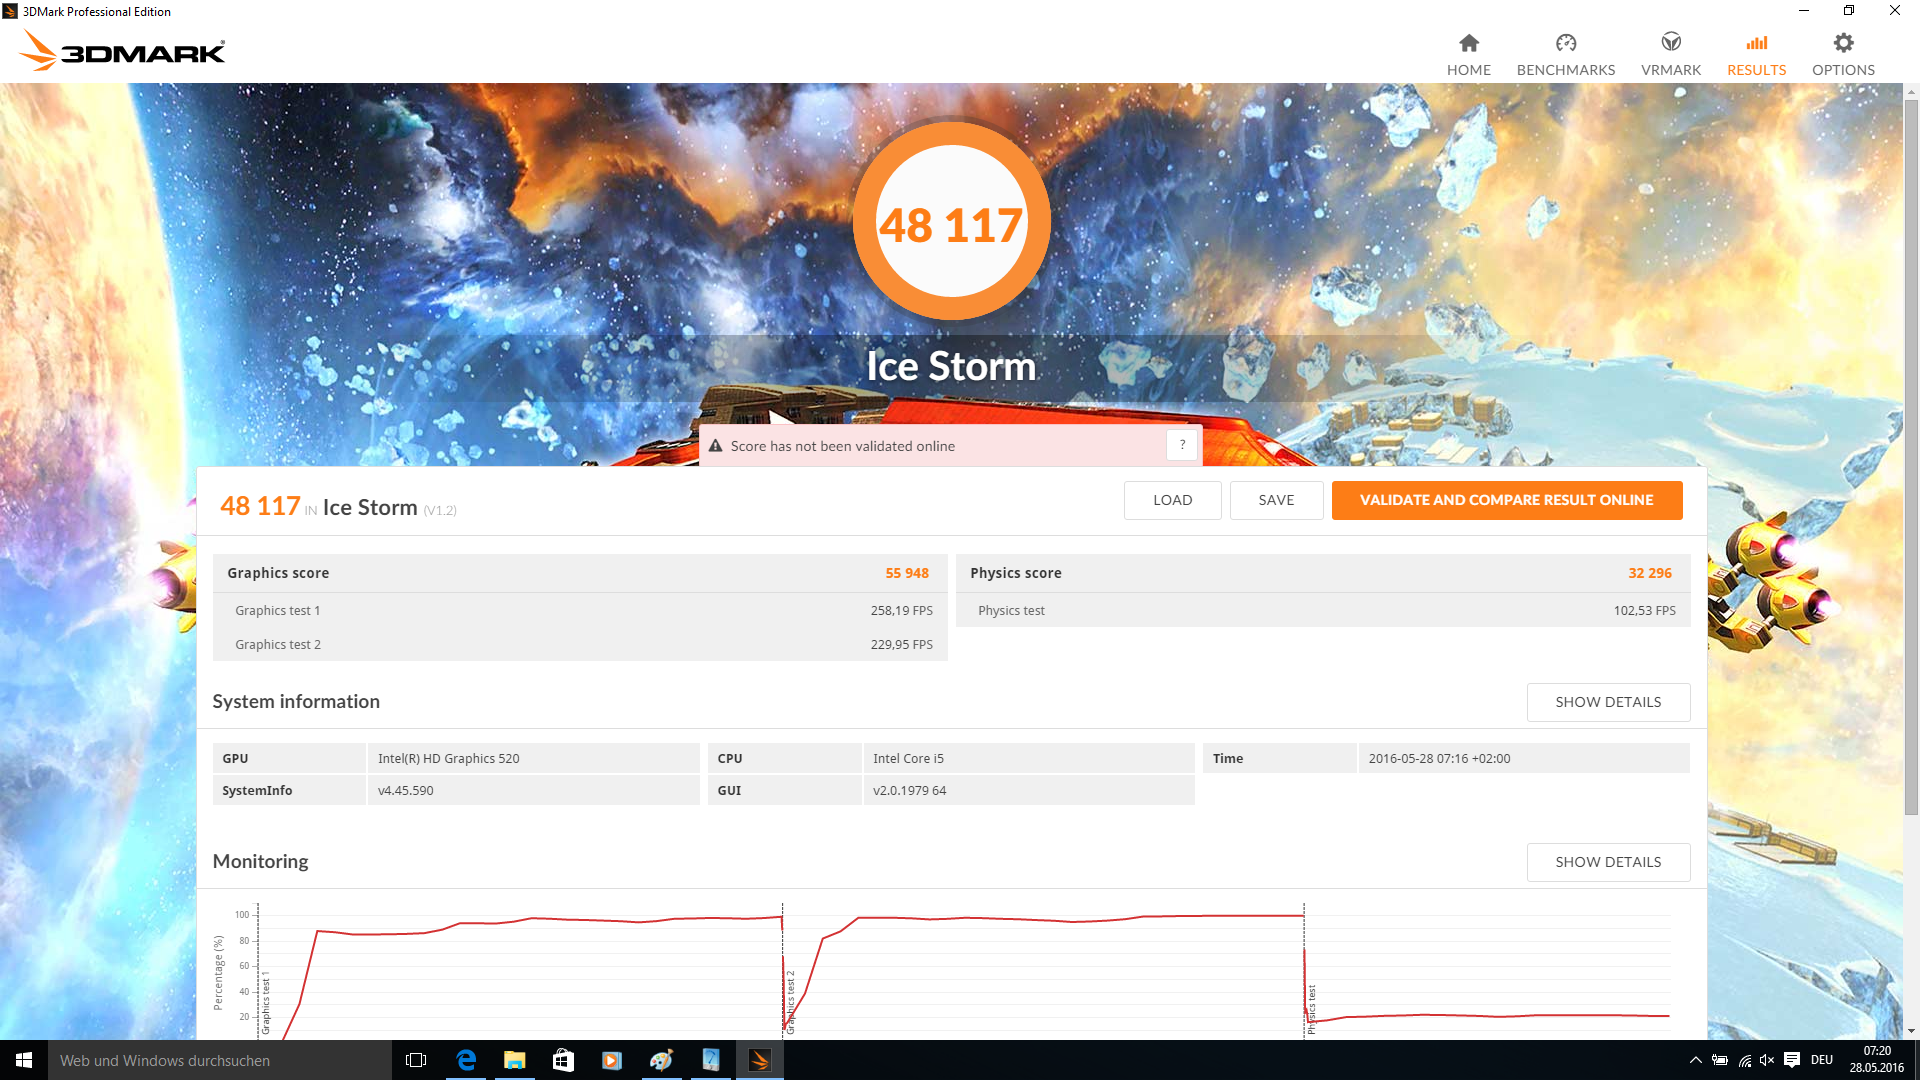
| 3DMark Ice Storm Standard Score | 48117 points | |
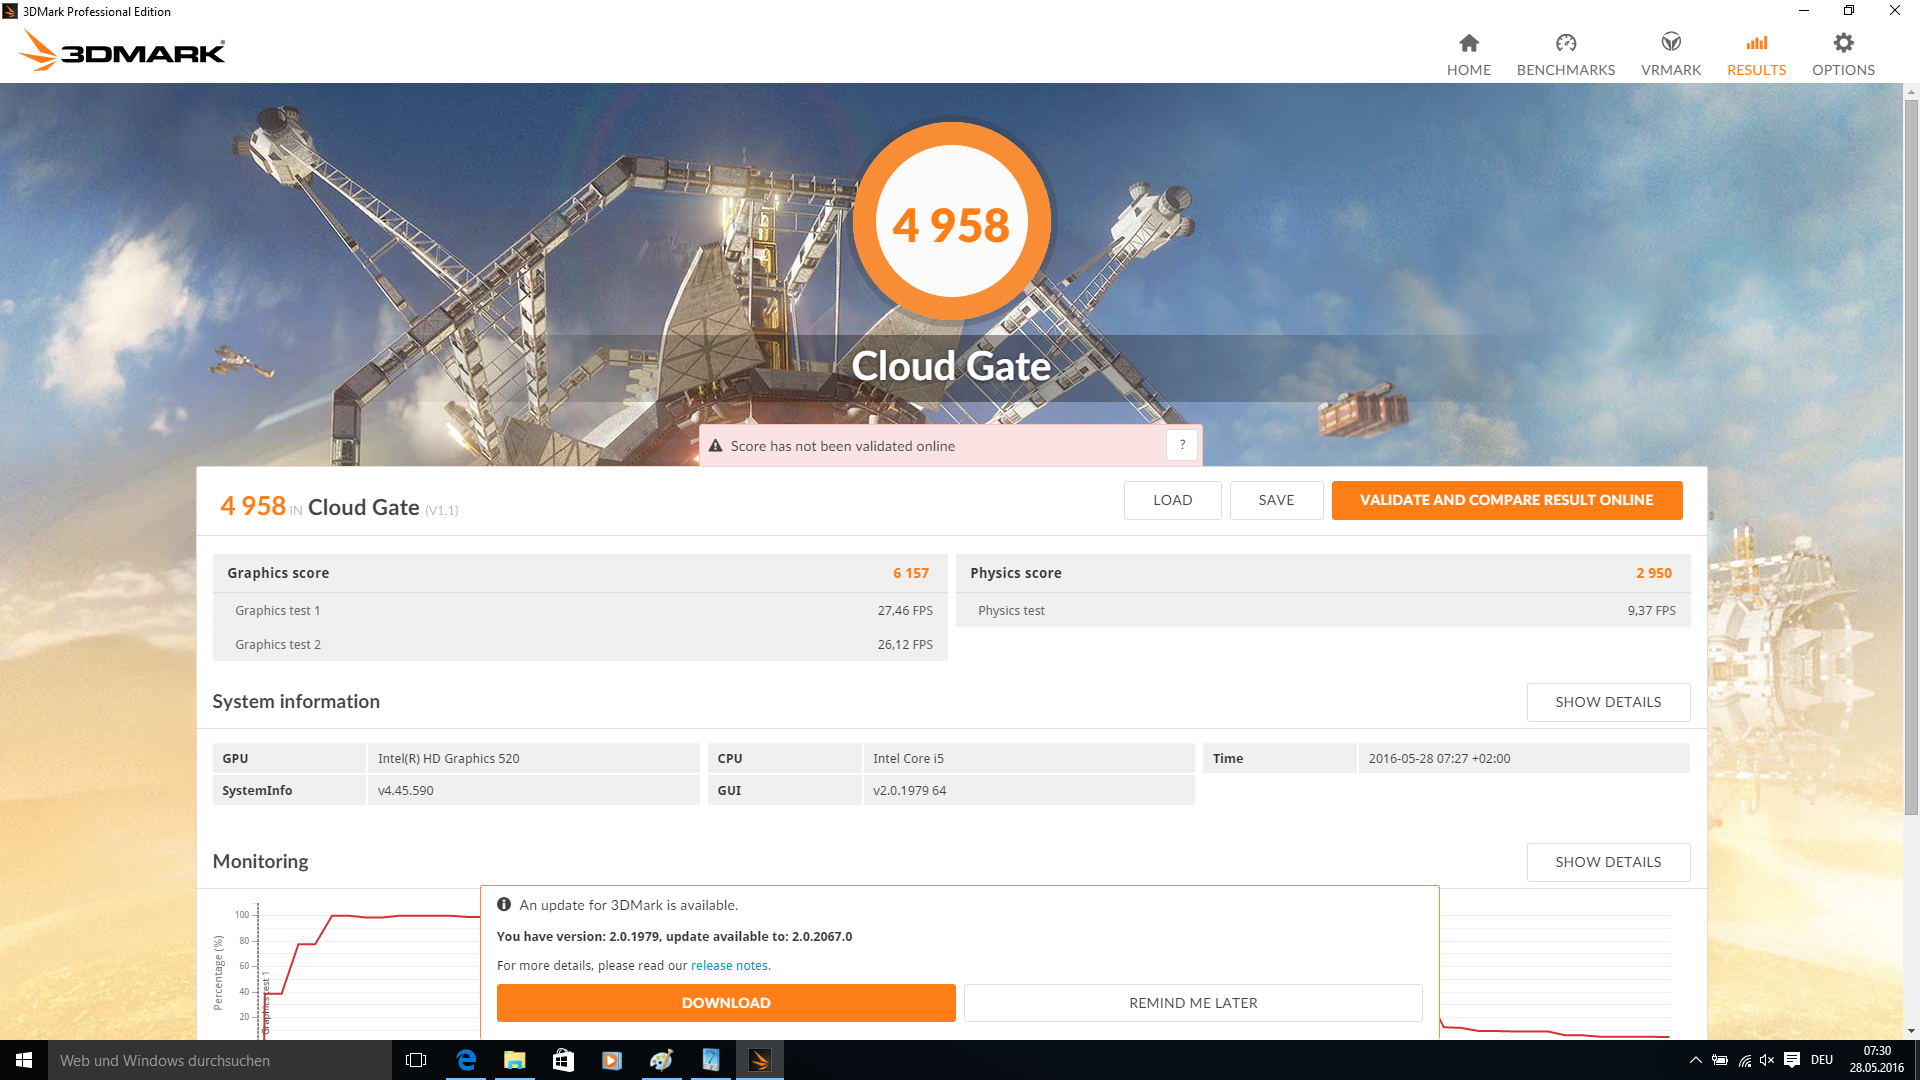
| 3DMark Cloud Gate Standard Score | 4958 points | |
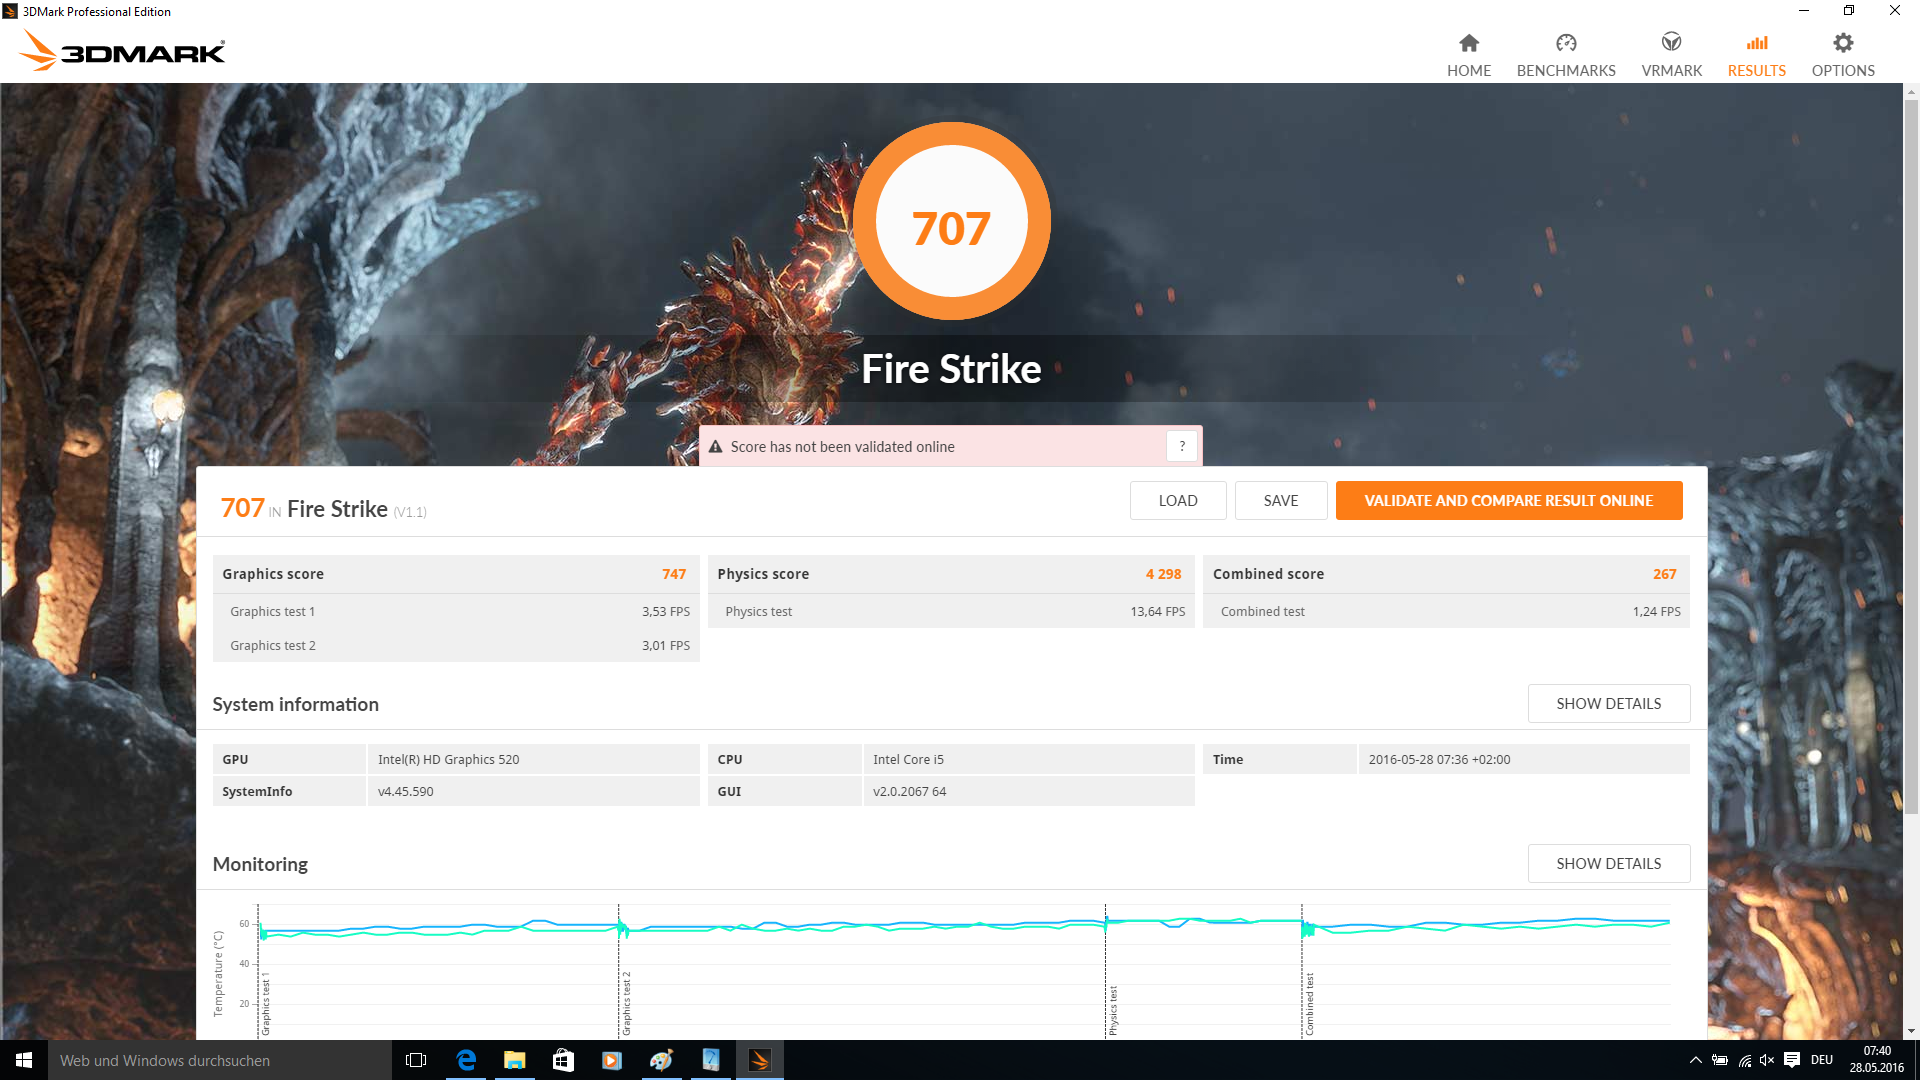
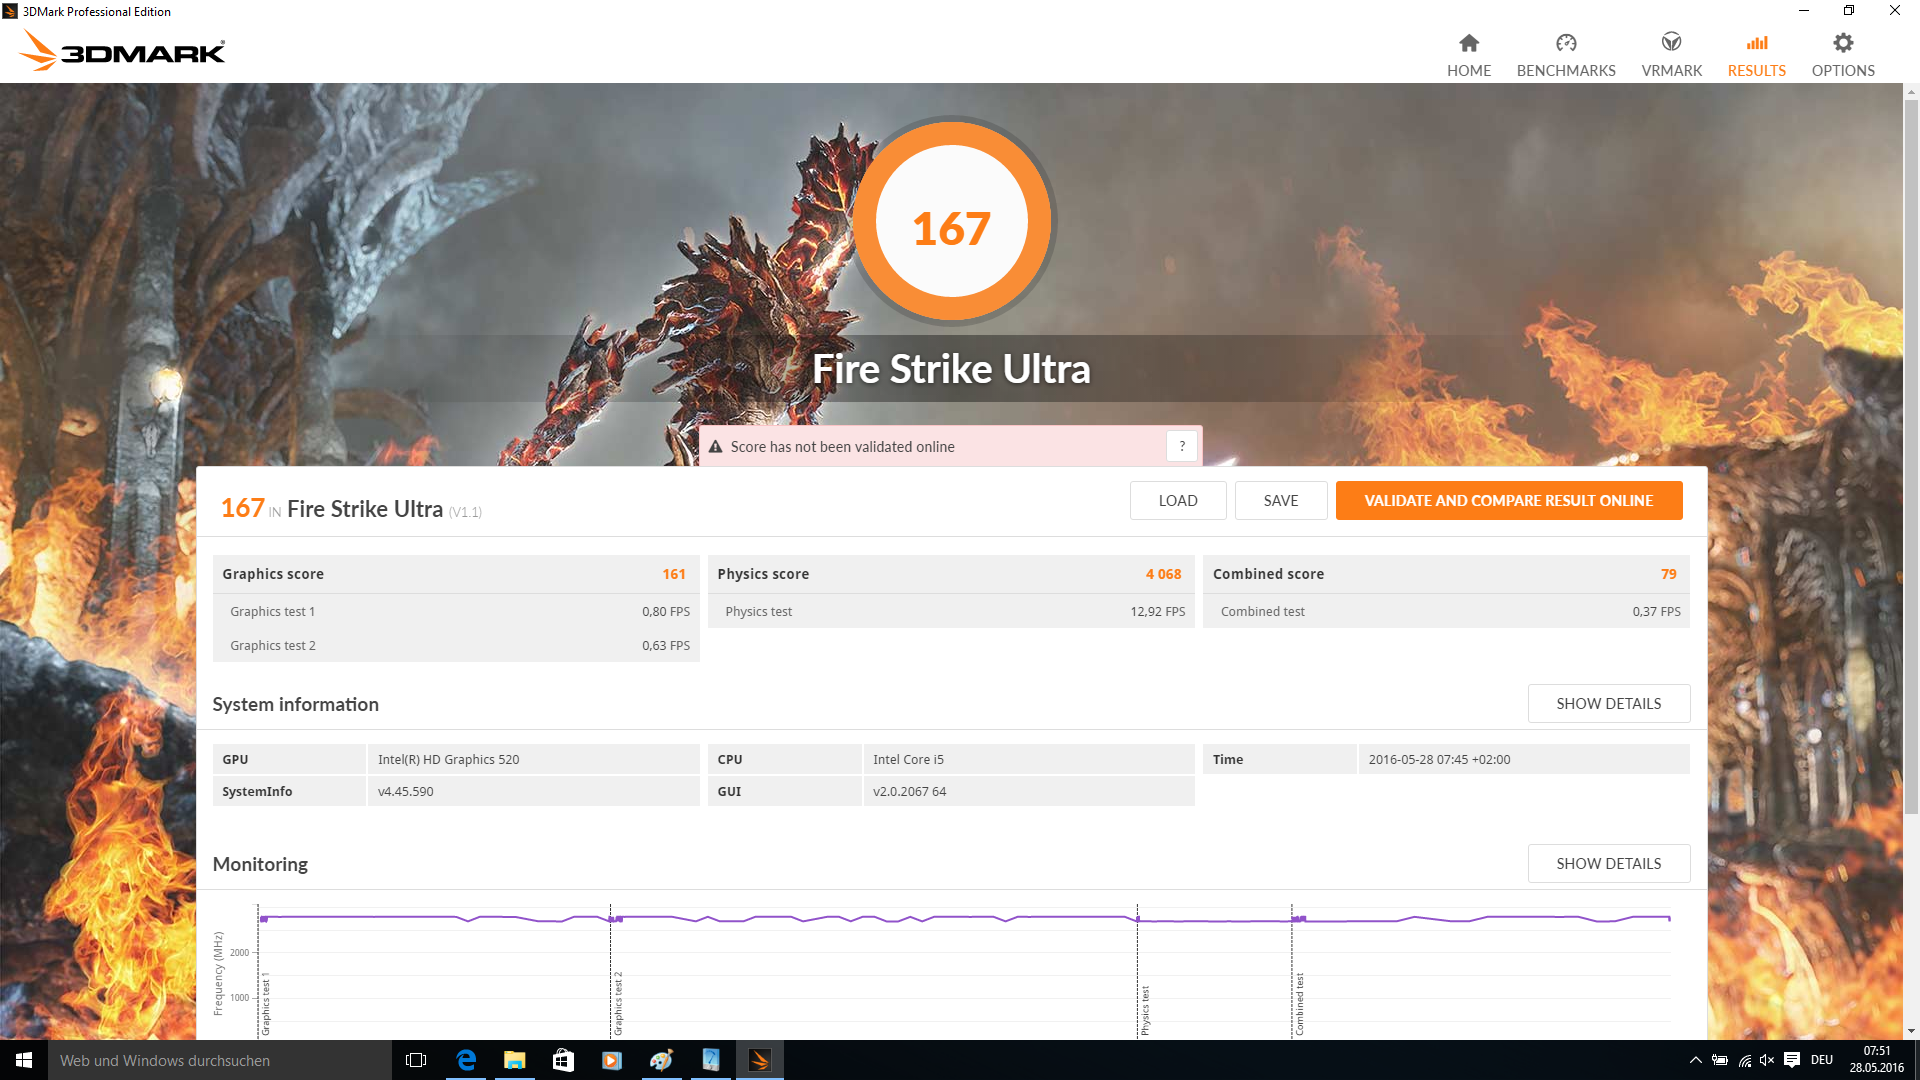
| 3DMark Fire Strike Score | 707 points | |
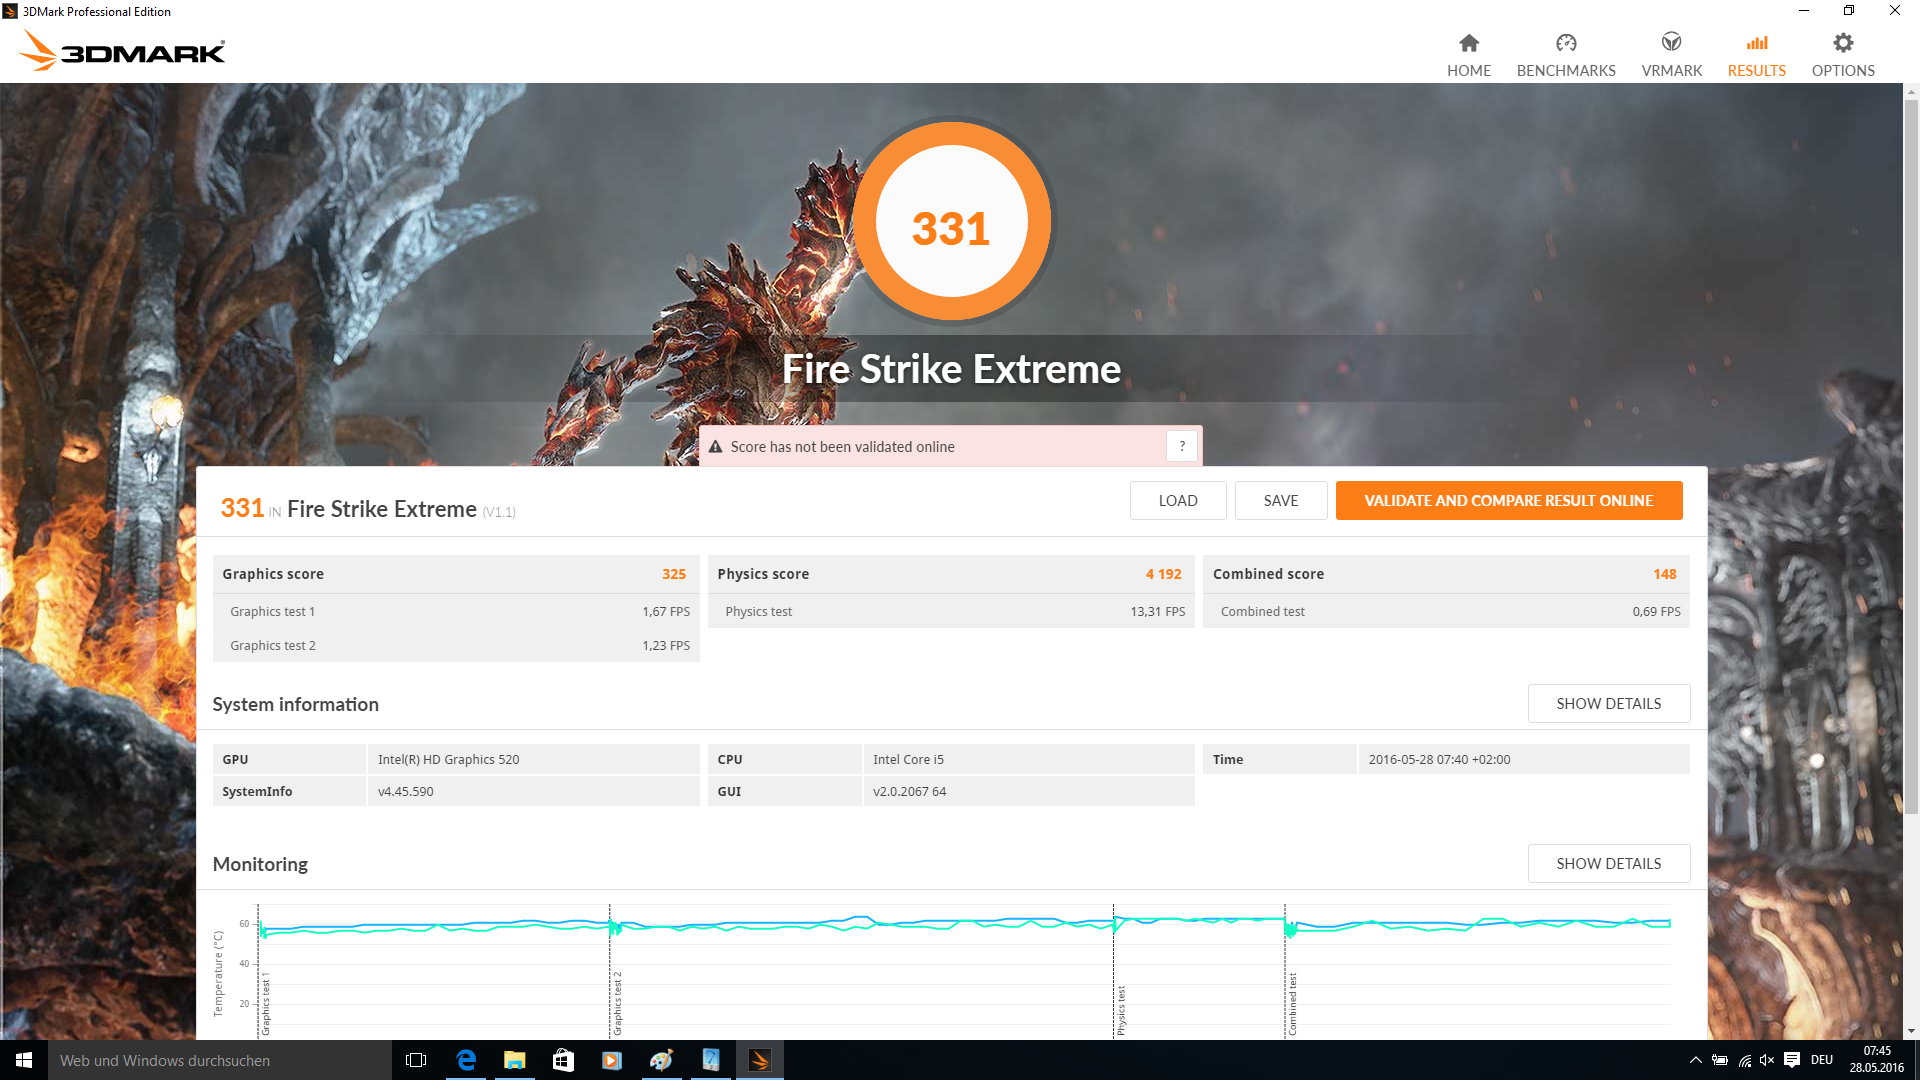
| 3DMark Fire Strike Extreme Score | 331 points | |
Help | ||
| low | med. | high | ultra | |
|---|---|---|---|---|
| BioShock Infinite (2013) | 44.04 | 23.58 | 19.79 | 5.82 |
| Battlefield 4 (2013) | 40.9 | 24.1 | 18.7 | |
| Rise of the Tomb Raider (2016) | 17.8 | 11.9 | 7.2 |
Noise level
| Idle |
| 28.8 / 28.8 / 28.8 dB(A) |
| Load |
| 34.7 / 36.1 dB(A) |
 | ||
30 dB silent 40 dB(A) audible 50 dB(A) loud |
||
min: | ||
| Asus ASUSPRO Advanced B8430UA-FA0084E Intel Core i5-6200U, HD Graphics 520 | Asus ASUSPRO Advanced BU401LA-CZ020G Intel Core i7-4650U, HD Graphics 5000 | Lenovo ThinkPad L460-20FVS01400 Intel Core i7-6500U, Radeon R5 M330 | Dell Latitude 14 E5470 Intel Core i5-6300U, HD Graphics 520 | HP EliteBook 840 G3 T9X59ET#ABD Intel Core i7-6500U, HD Graphics 520 | Lenovo ThinkPad T460s-20F9003SGE Intel Core i5-6200U, HD Graphics 520 | Lenovo ThinkPad T460-20FN003LGE Intel Core i5-6200U, HD Graphics 520 | |
|---|---|---|---|---|---|---|---|
| Noise | -2% | -0% | 0% | -9% | 0% | -1% | |
| off / environment * (dB) | 28.8 | 29.2 -1% | 29.2 -1% | 31.2 -8% | 29.1 -1% | 29 -1% | |
| Idle Minimum * (dB) | 28.8 | 29.3 -2% | 29.2 -1% | 29.2 -1% | 31.2 -8% | 29.1 -1% | 29 -1% |
| Idle Average * (dB) | 28.8 | 29.3 -2% | 29.2 -1% | 29.2 -1% | 32.1 -11% | 29.1 -1% | 29 -1% |
| Idle Maximum * (dB) | 28.8 | 30.9 -7% | 29.2 -1% | 29.2 -1% | 33.1 -15% | 29.1 -1% | 29 -1% |
| Load Average * (dB) | 34.7 | 33.1 5% | 32.5 6% | 32.1 7% | 36.2 -4% | 32.3 7% | 34.2 1% |
| Load Maximum * (dB) | 36.1 | 37.3 -3% | 37.2 -3% | 36.8 -2% | 37.8 -5% | 36.6 -1% | 37.8 -5% |
* ... smaller is better
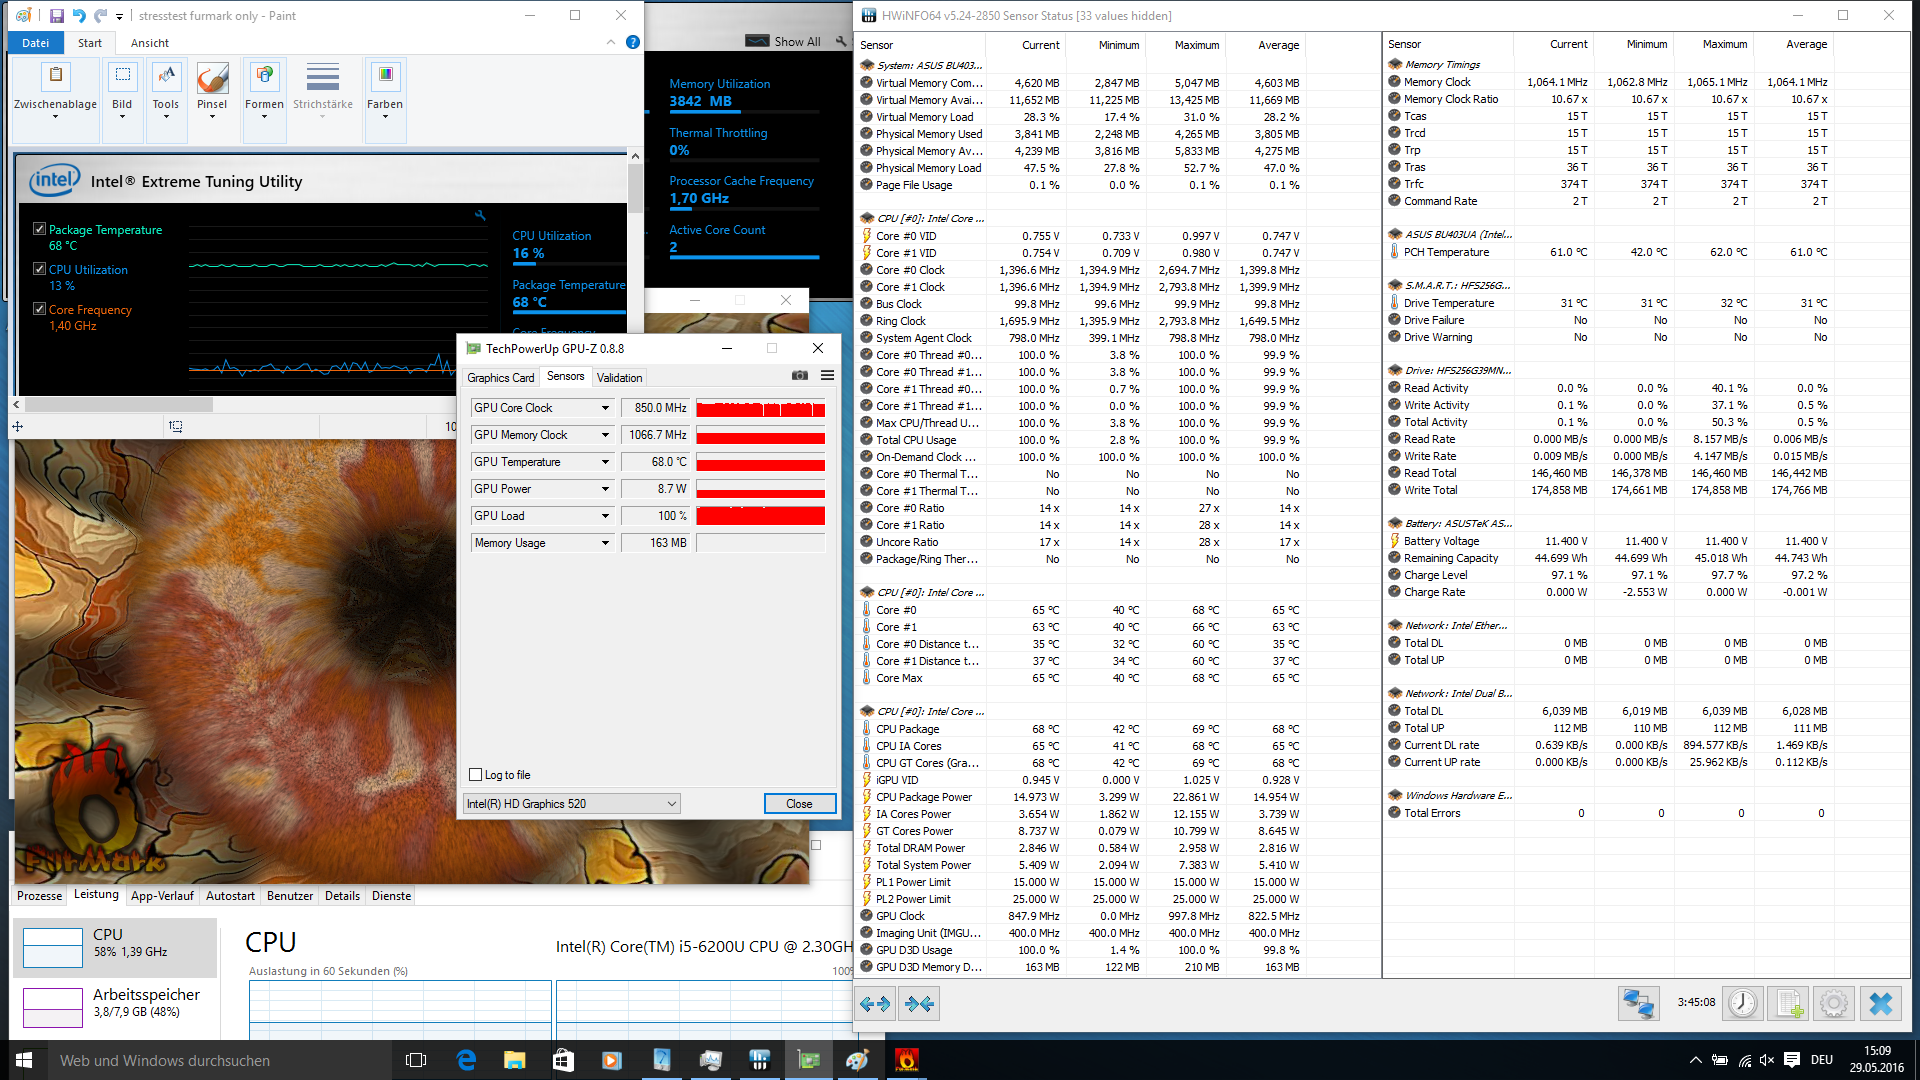
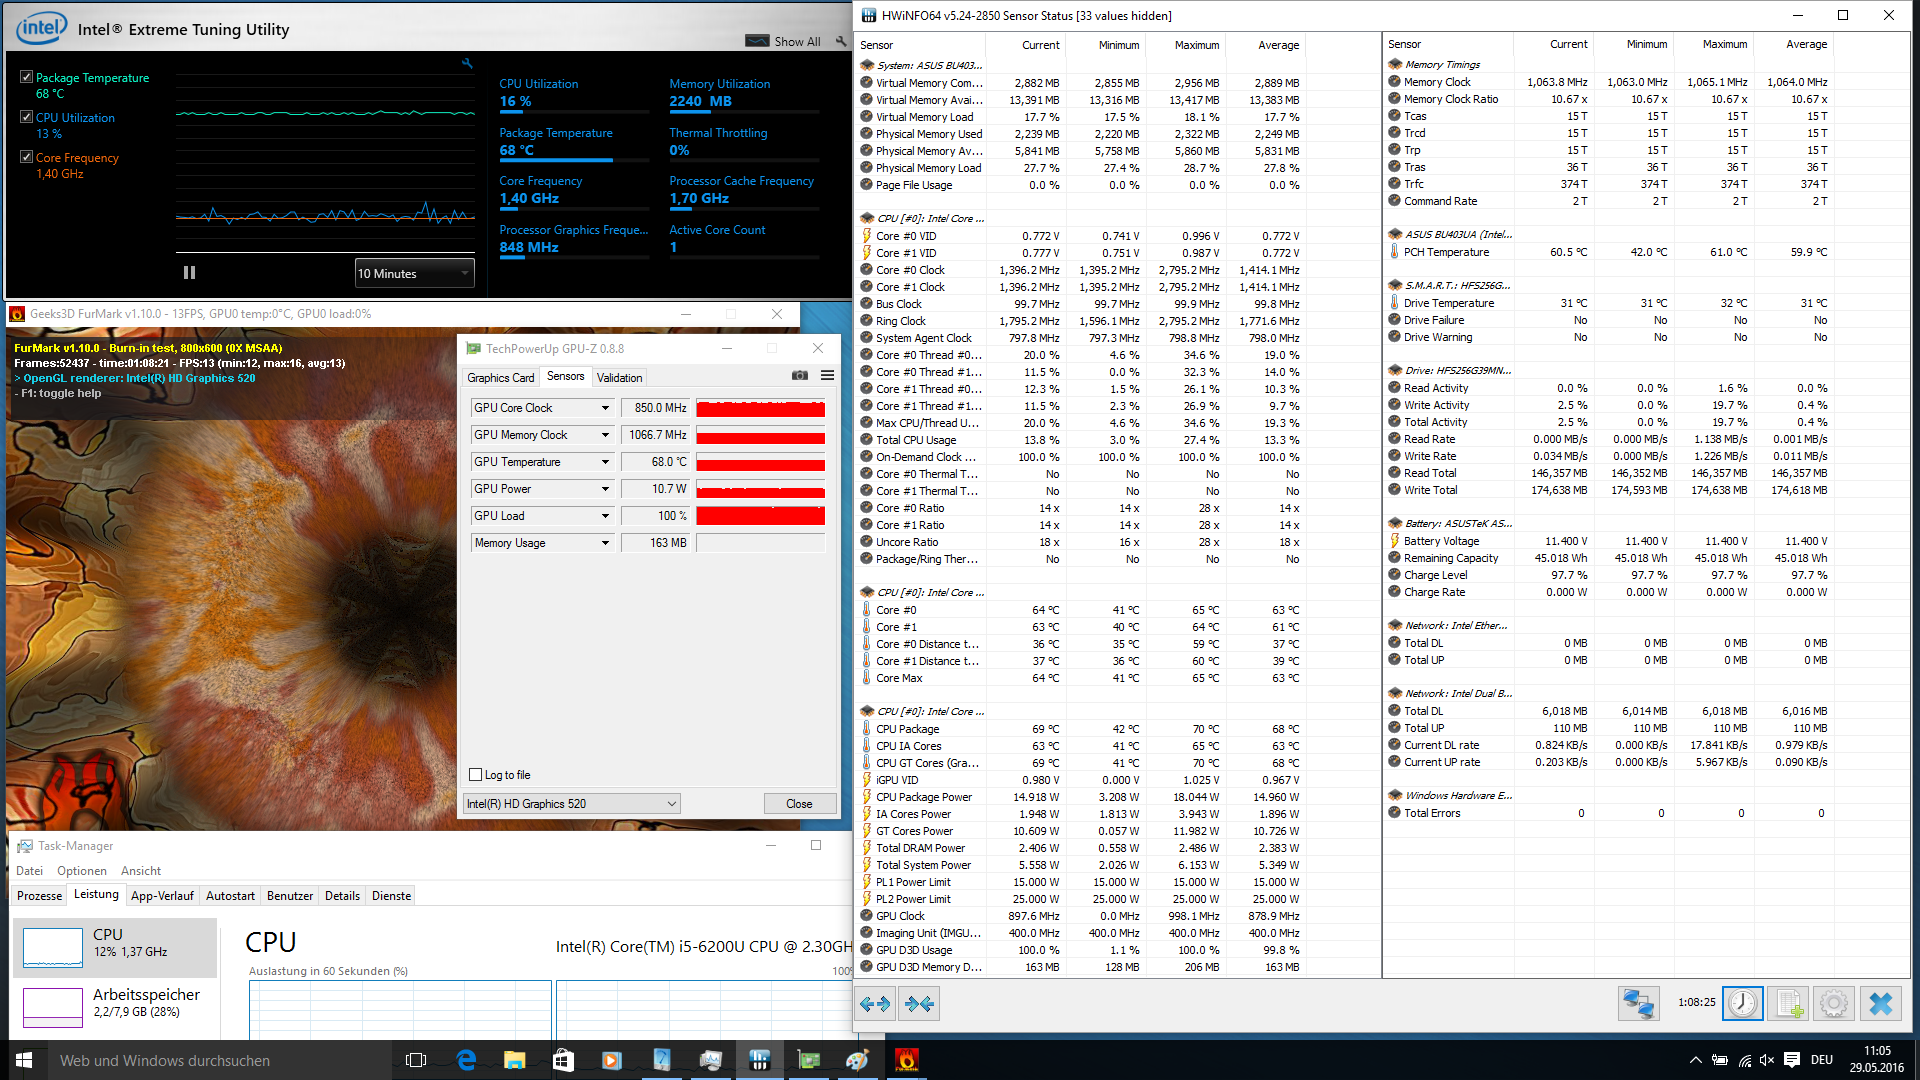
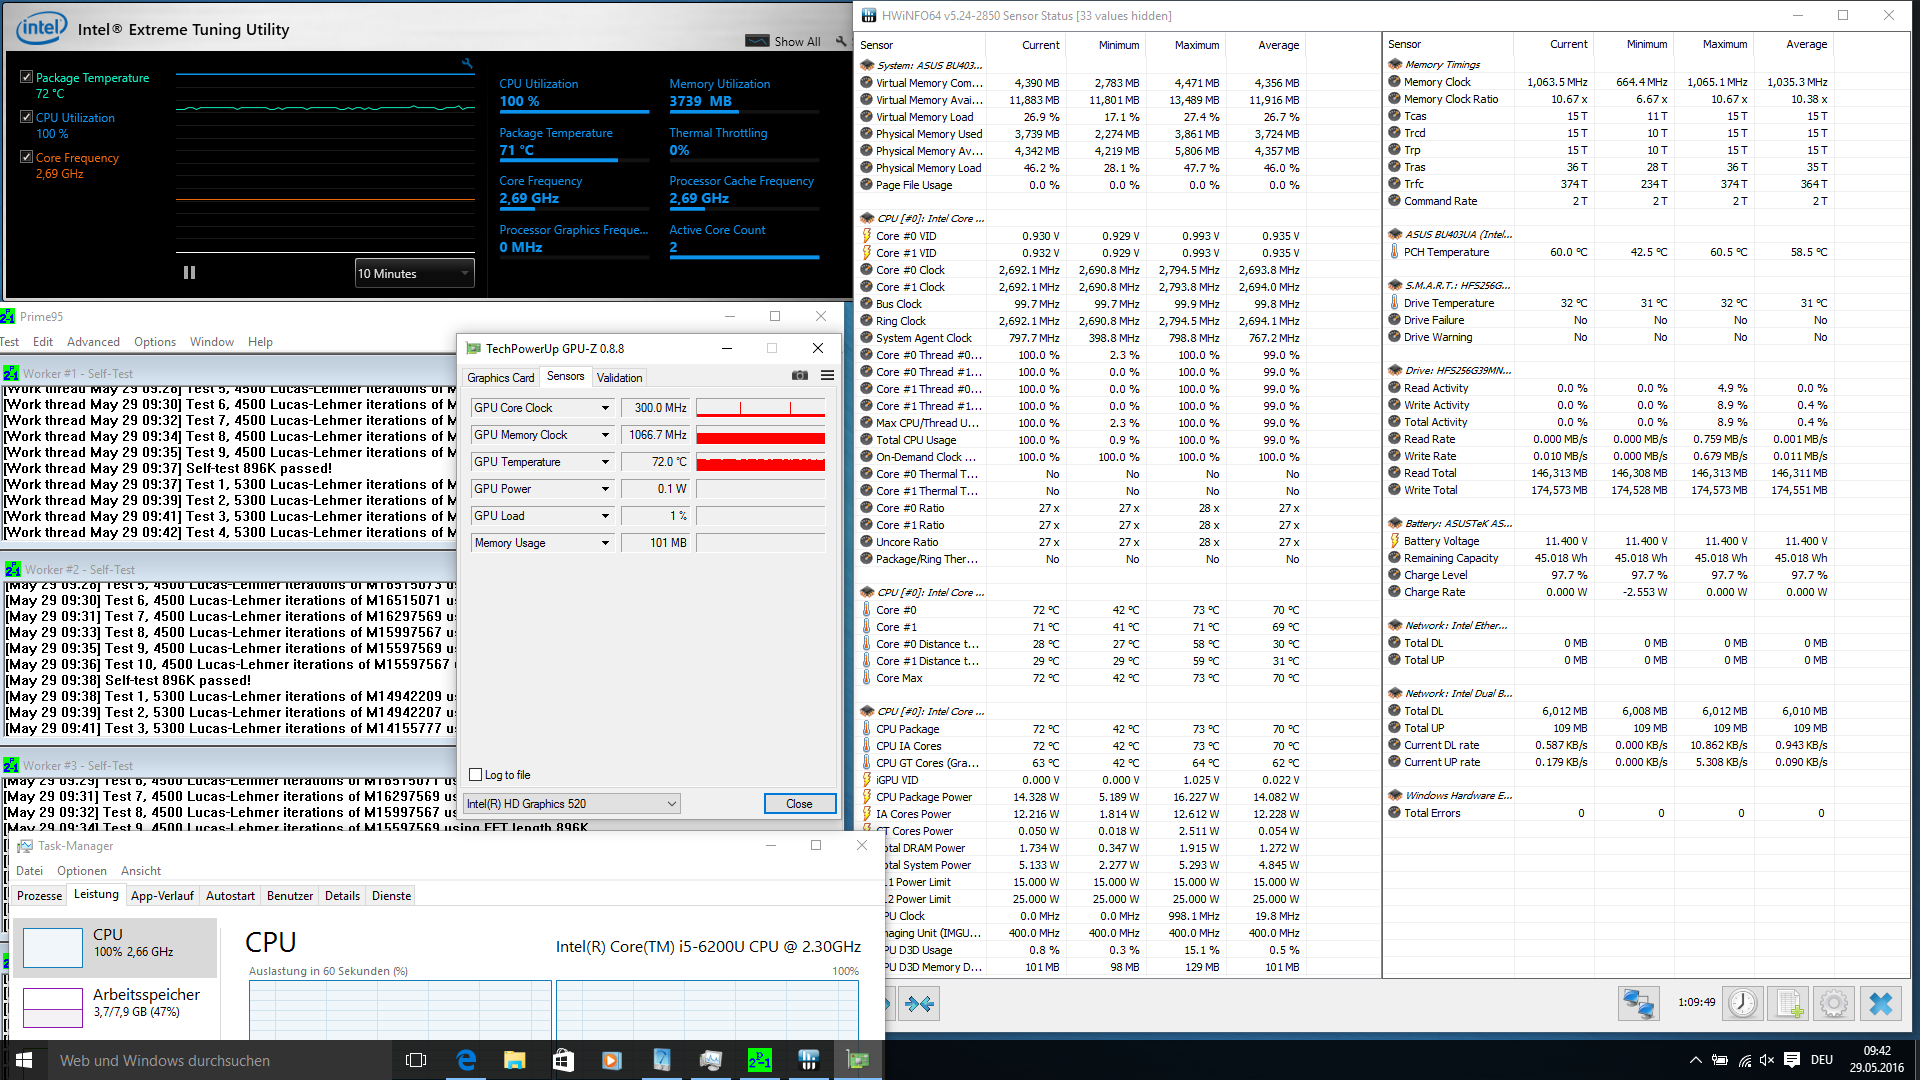
(±) The maximum temperature on the upper side is 40.1 °C / 104 F, compared to the average of 34.3 °C / 94 F, ranging from 21.2 to 62.5 °C for the class Office.
(±) The bottom heats up to a maximum of 41.8 °C / 107 F, compared to the average of 36.8 °C / 98 F
(+) In idle usage, the average temperature for the upper side is 28.8 °C / 84 F, compared to the device average of 29.5 °C / 85 F.
(+) The palmrests and touchpad are cooler than skin temperature with a maximum of 30.7 °C / 87.3 F and are therefore cool to the touch.
(-) The average temperature of the palmrest area of similar devices was 27.5 °C / 81.5 F (-3.2 °C / -5.8 F).
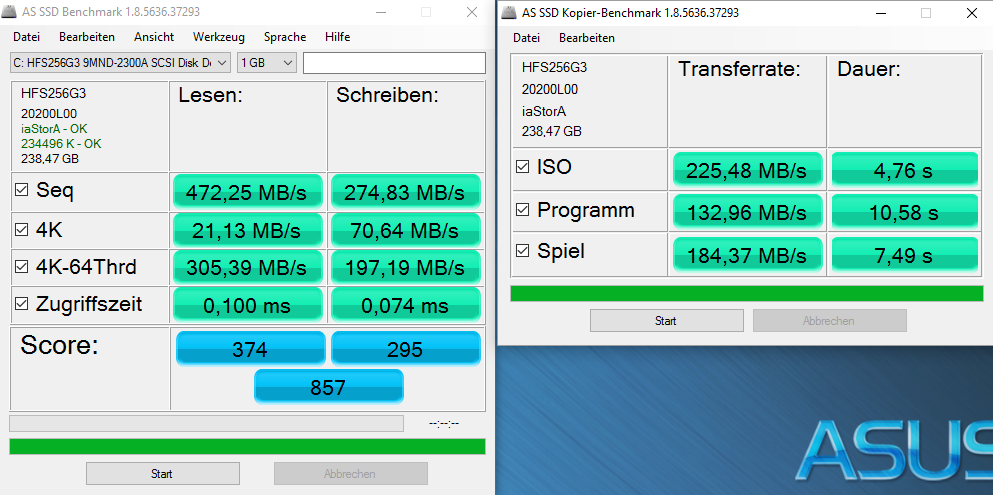
| Asus ASUSPRO Advanced B8430UA-FA0084E HD Graphics 520, 6200U, Hynix HFS256G39MND | Asus ASUSPRO Advanced BU401LA-CZ020G HD Graphics 5000, 4650U, Liteonit LCS-256M6S | Lenovo ThinkPad L460-20FVS01400 Radeon R5 M330, 6500U, Toshiba HG6 THNSFJ256GCSU | Dell Latitude 14 E5470 HD Graphics 520, 6300U, Liteon L8H-256V2G | HP EliteBook 840 G3 T9X59ET#ABD HD Graphics 520, 6500U, Samsung SSD PM851 256 GB MZNTE256HMHP | Lenovo ThinkPad T460s-20F9003SGE HD Graphics 520, 6200U, Samsung CM871 MZ7LF192HCGS | Lenovo ThinkPad T460-20FN003LGE HD Graphics 520, 6200U, Toshiba HG6 THNSFJ256GCSU | |
|---|---|---|---|---|---|---|---|
| Power Consumption | 4% | -4% | 15% | 6% | 6% | 6% | |
| Idle Minimum * (Watt) | 4.2 | 4.1 2% | 3.1 26% | 3.5 17% | 3.8 10% | 3.7 12% | 3.5 17% |
| Idle Average * (Watt) | 6.5 | 7.1 -9% | 6.3 3% | 5.3 18% | 6.3 3% | 6.8 -5% | 6.7 -3% |
| Idle Maximum * (Watt) | 7.2 | 7.3 -1% | 7.9 -10% | 6 17% | 6.8 6% | 7.3 -1% | 7.3 -1% |
| Load Average * (Watt) | 29.2 | 28.9 1% | 29.5 -1% | 26.3 10% | 34.4 -18% | 26.3 10% | 28.2 3% |
| Load Maximum * (Watt) | 41 | 29.3 29% | 57.3 -40% | 36.6 11% | 28.3 31% | 34.6 16% | 34.6 16% |
* ... smaller is better
| Off / Standby | |
| Idle | |
| Load |
|
Key:
min: | |
| Asus ASUSPRO Advanced B8430UA-FA0084E 48 Wh | Asus ASUSPRO Advanced BU401LA-CZ020G 53 Wh | Lenovo ThinkPad L460-20FVS01400 48 Wh | Dell Latitude 14 E5470 62 Wh | HP EliteBook 840 G3 T9X59ET#ABD 46 Wh | Lenovo ThinkPad T460s-20F9003SGE 49 Wh | Lenovo ThinkPad T460-20FN003LGE 46 Wh | |
|---|---|---|---|---|---|---|---|
| Battery runtime | -8% | 22% | 76% | 28% | 23% | 14% | |
| Reader / Idle (h) | 11.9 | 11.7 -2% | 19.2 61% | 21.7 82% | 17 43% | 15.3 29% | 15.9 34% |
| H.264 (h) | 5.6 | 4.9 -12% | 7.2 29% | 10.8 93% | 8.9 59% | 8.5 52% | |
| WiFi v1.3 (h) | 5.7 | 7.1 25% | 11.1 95% | 7.6 33% | 6.6 16% | 5.6 -2% | |
| Load (h) | 2.2 | 2 -9% | 1.6 -27% | 2.9 32% | 2.4 9% | 1.9 -14% | 1.6 -27% |
| WiFi (h) | 5.2 |
Pros
Cons
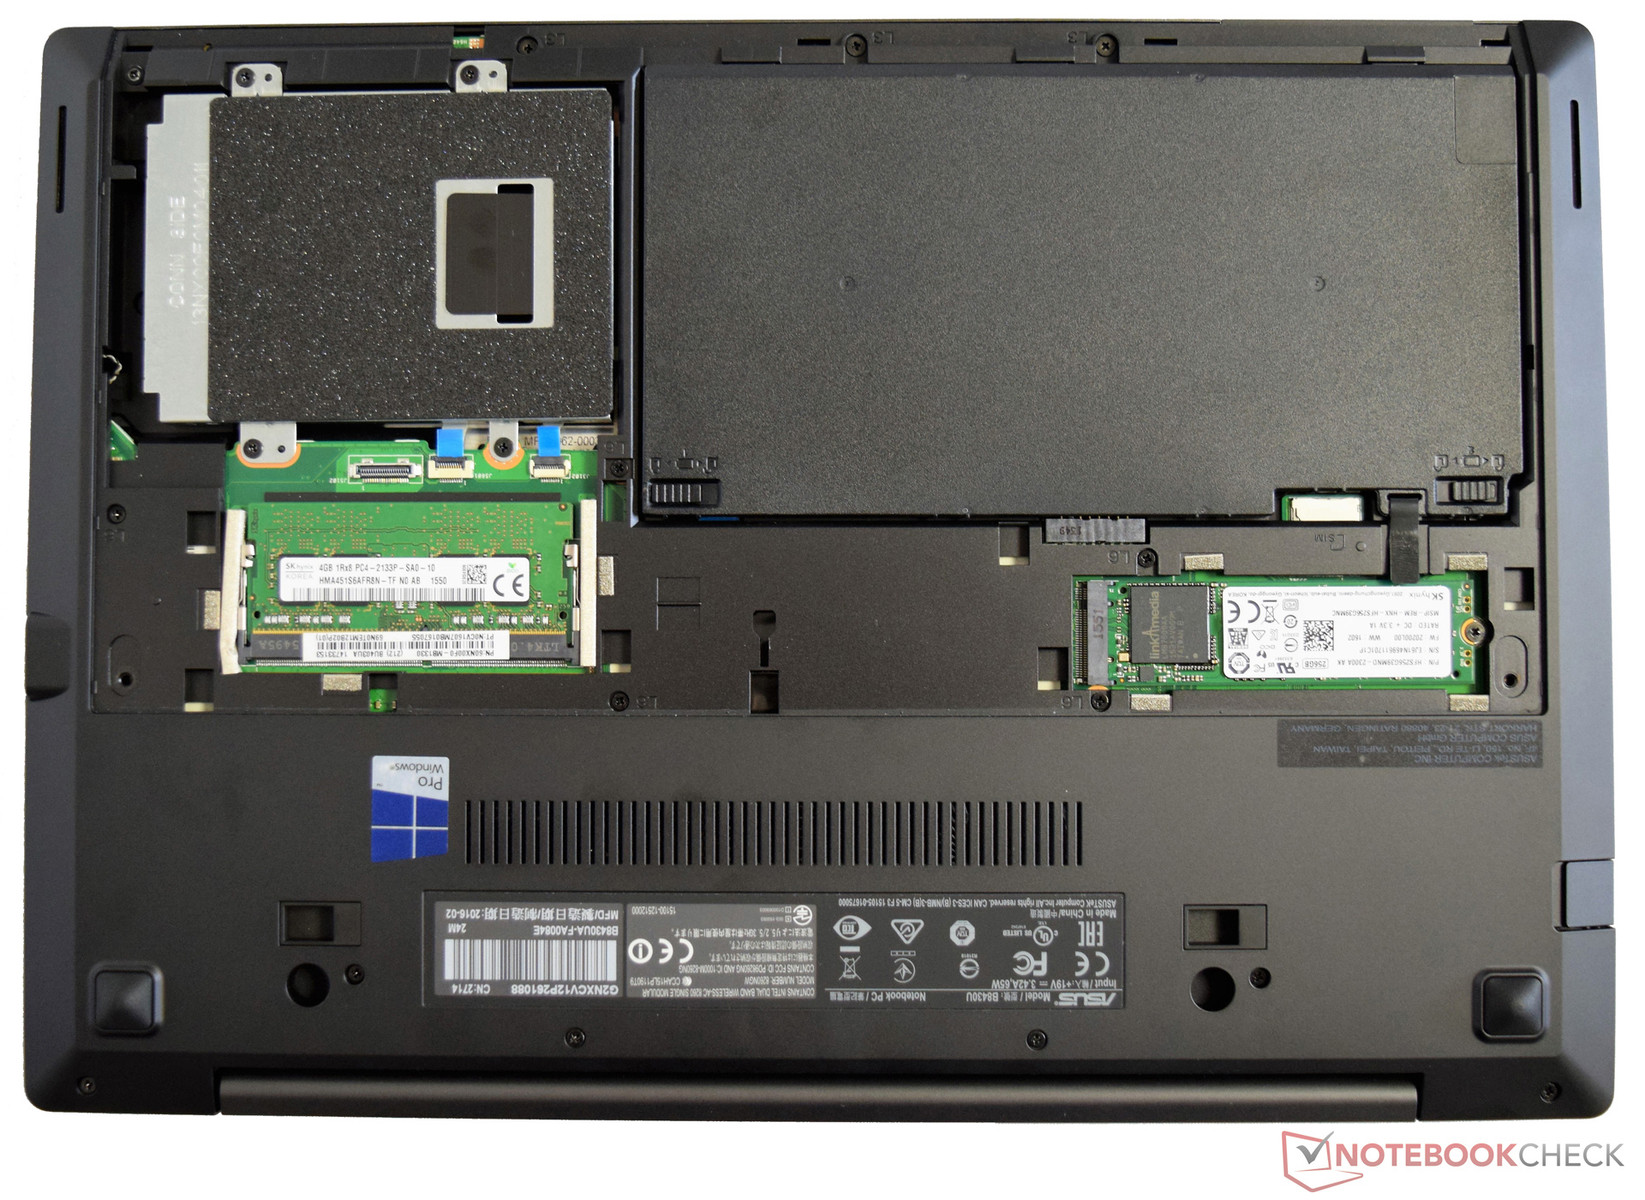
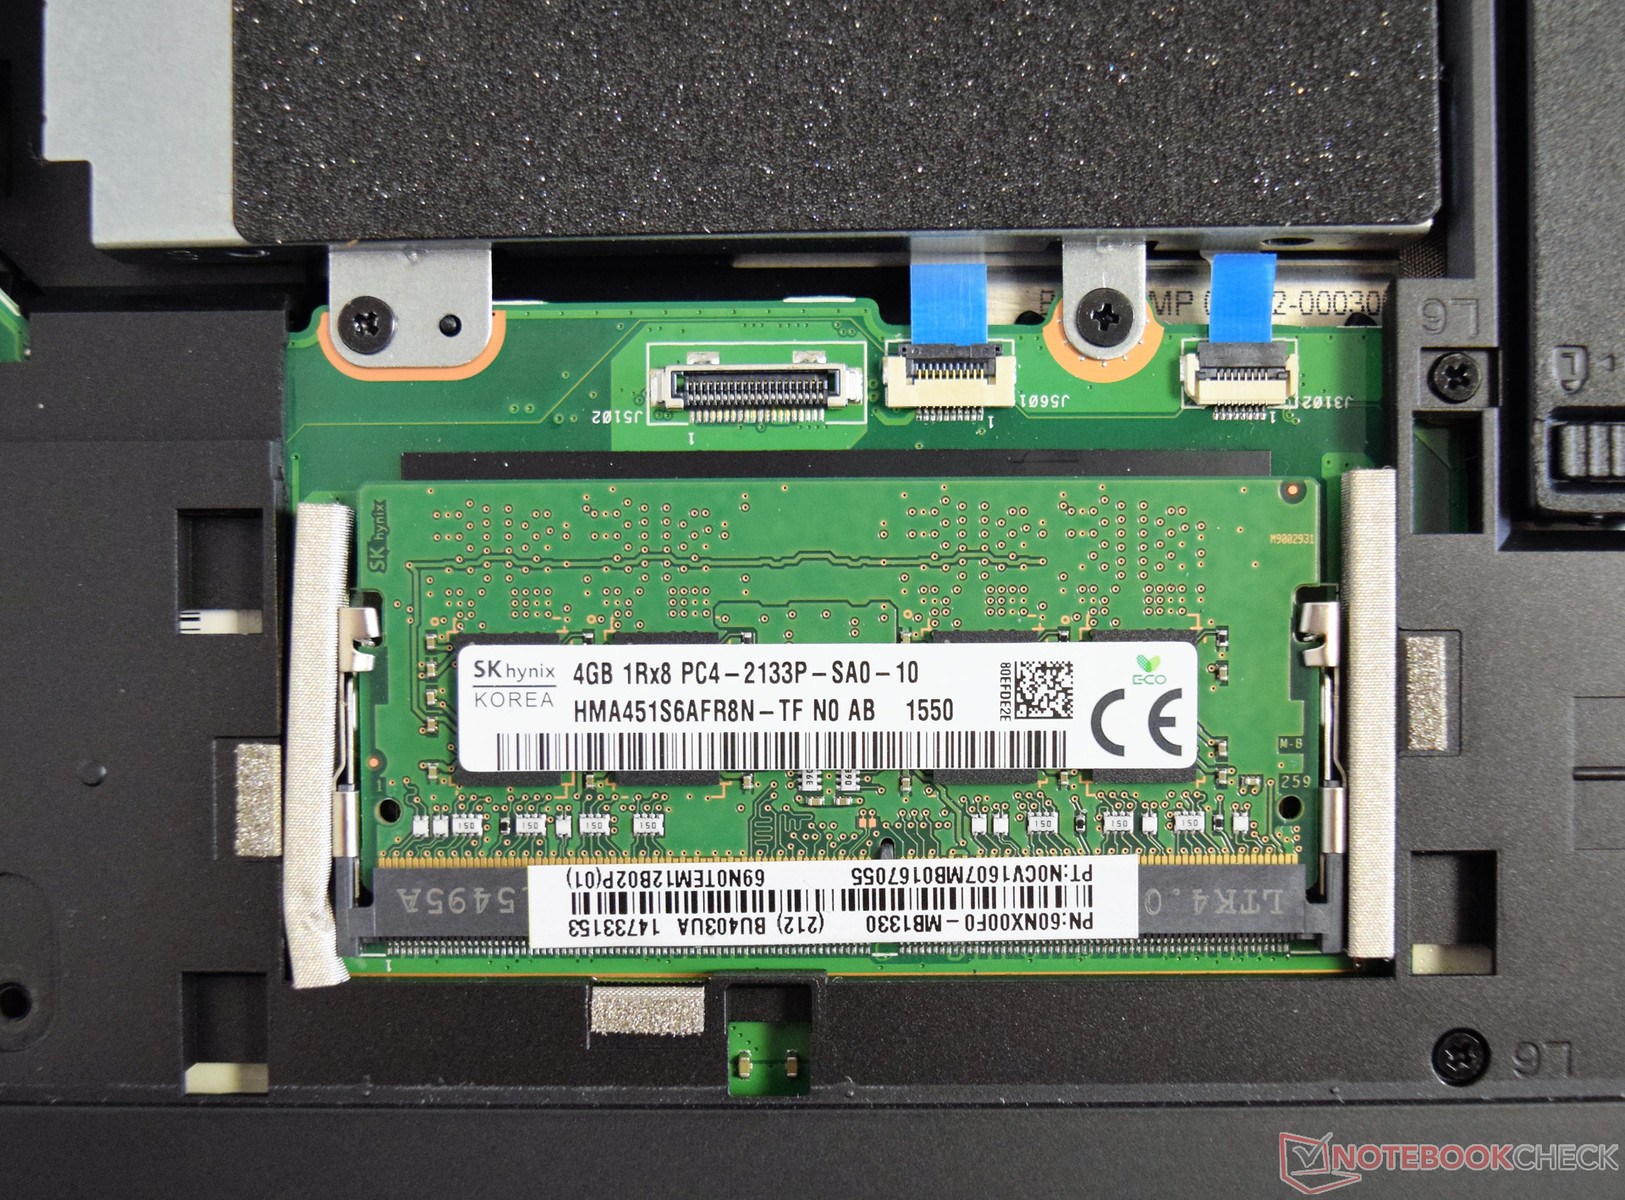
AsusPro Advanced B8430UA是一台优秀持久的14寸商务笔记本电脑。得力于最新组件,它的性能相比前代机型有了明显的提升。较低的重量带来了出色的便携性,而不足1000欧元(约7269人民币)的售价也让人垂涎三尺。优秀的系统性能对于日常使用至关重要,因此搭配固态硬盘是个很明智的选择,它对于使用体验的贡献至关重要。
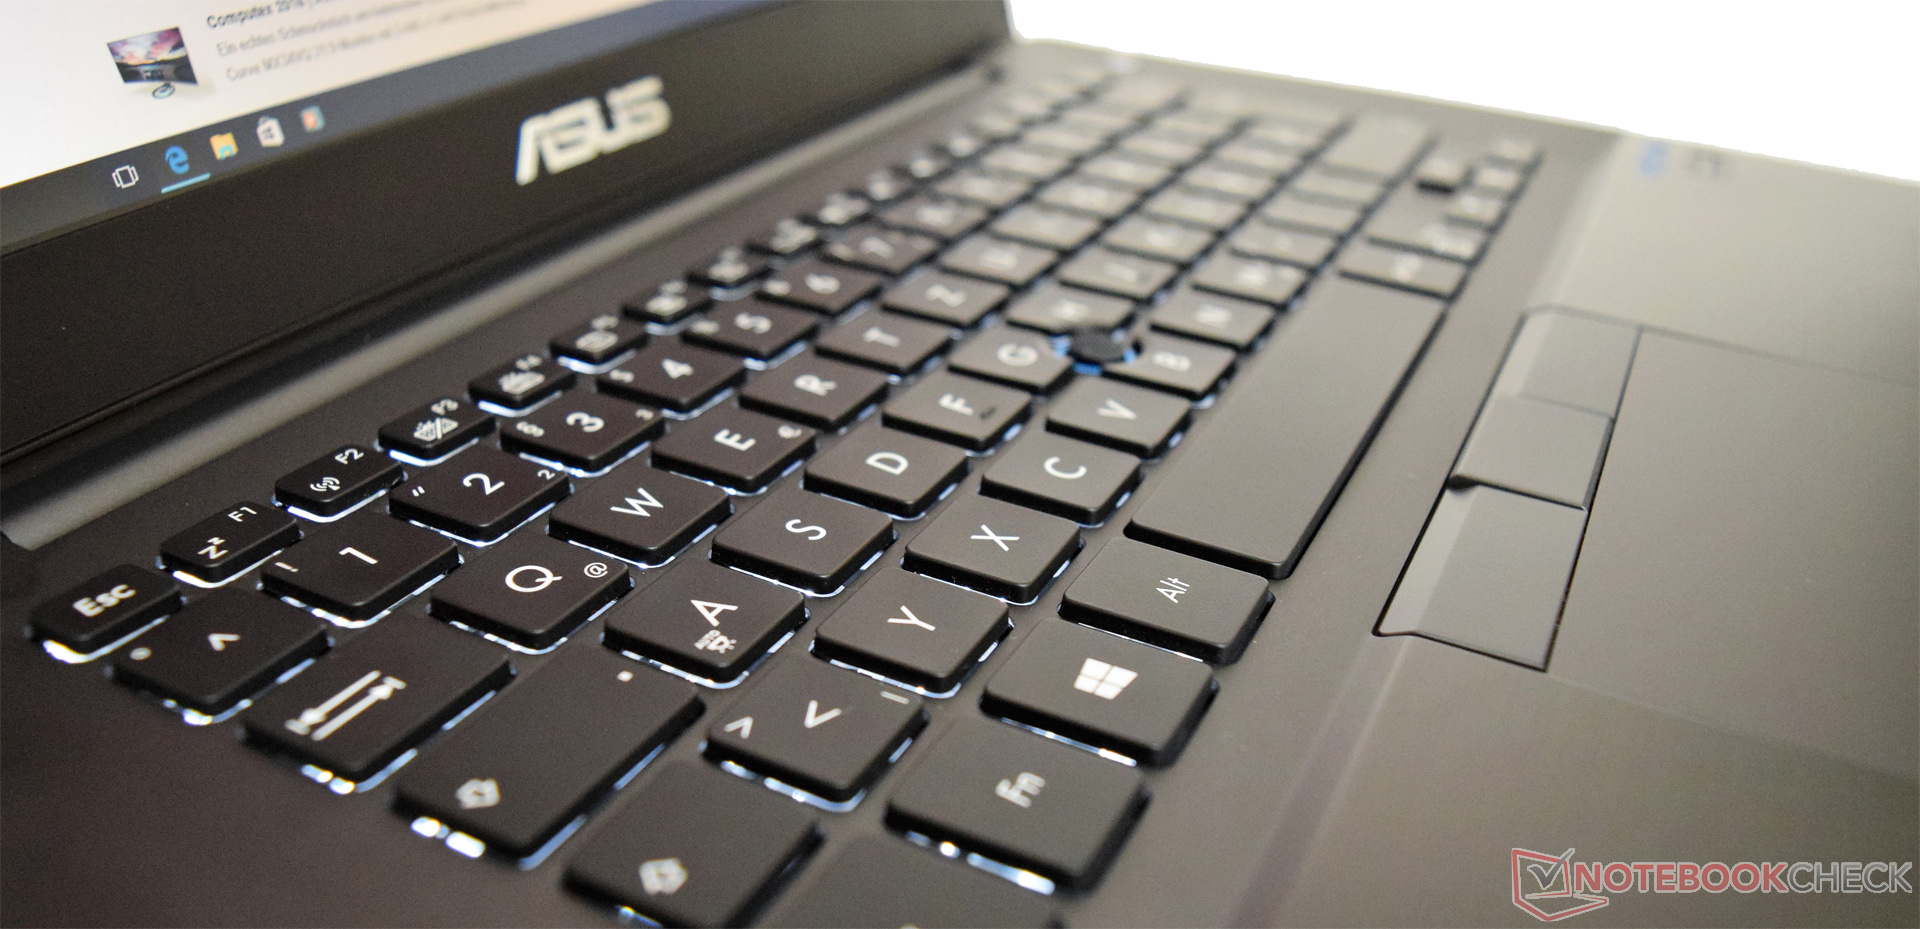
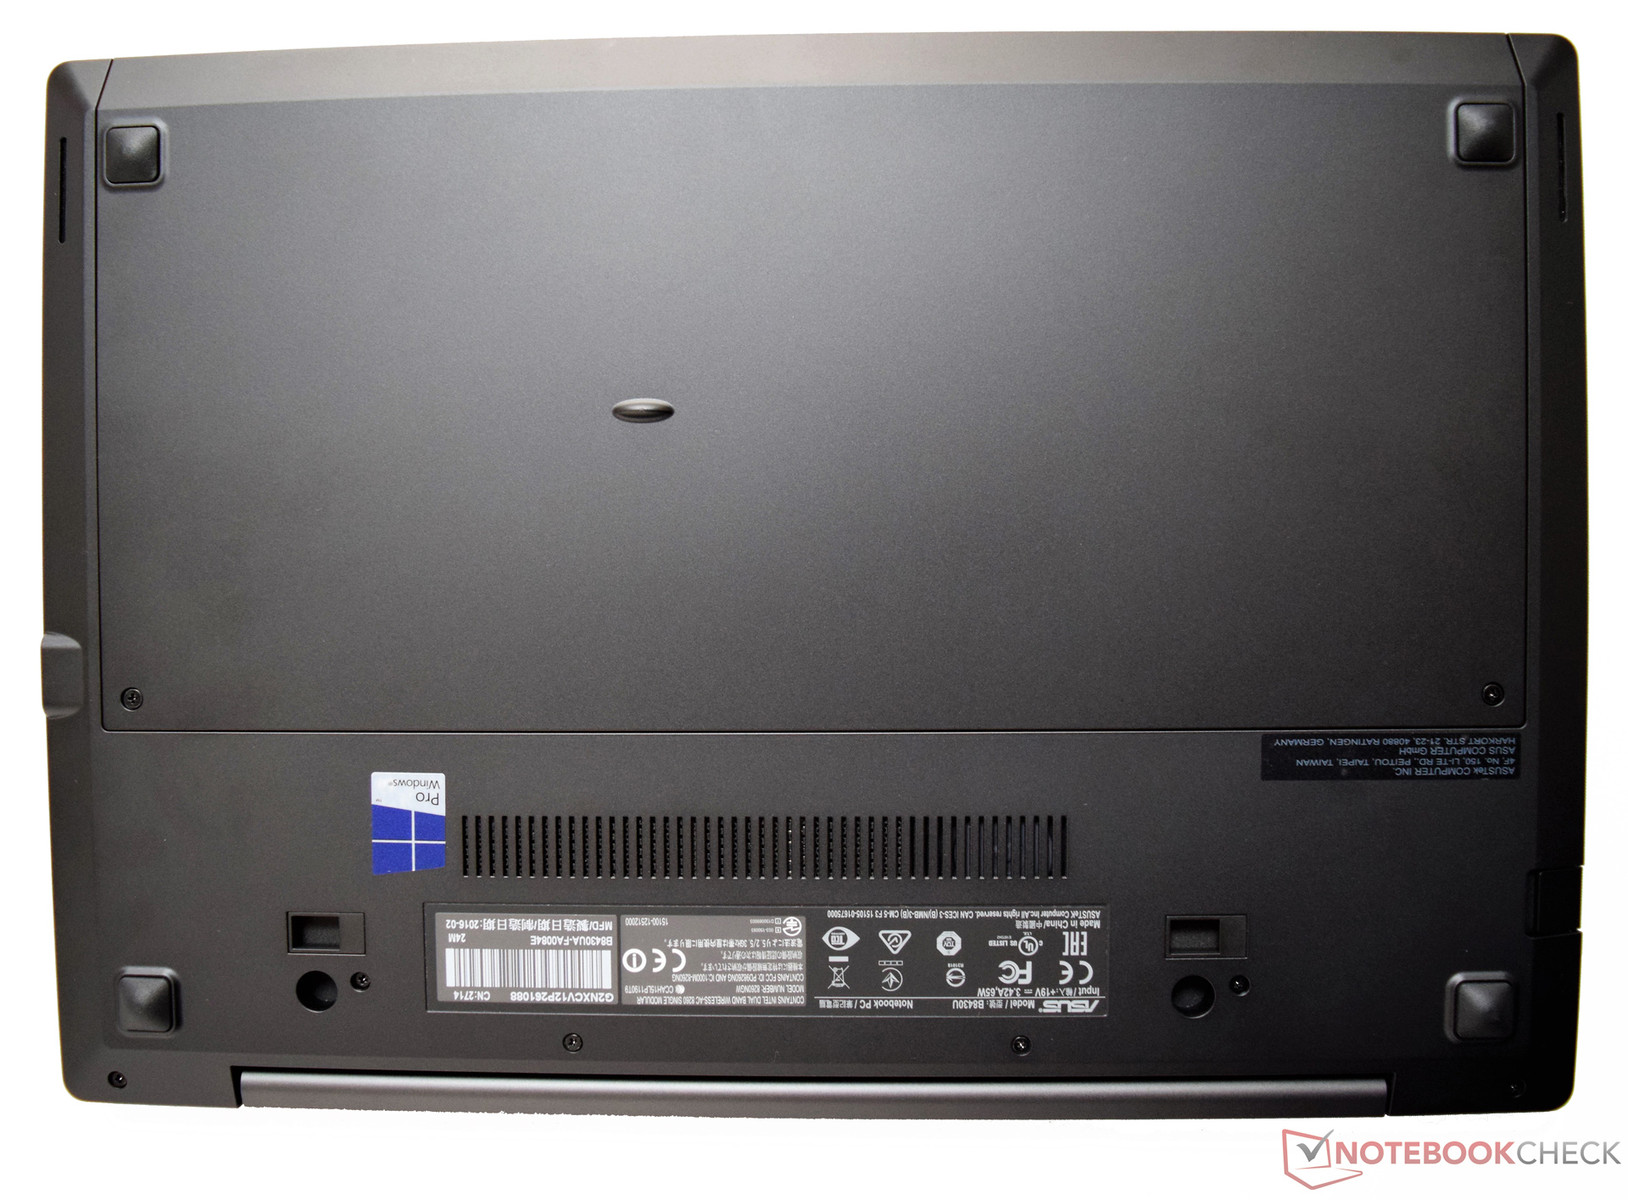
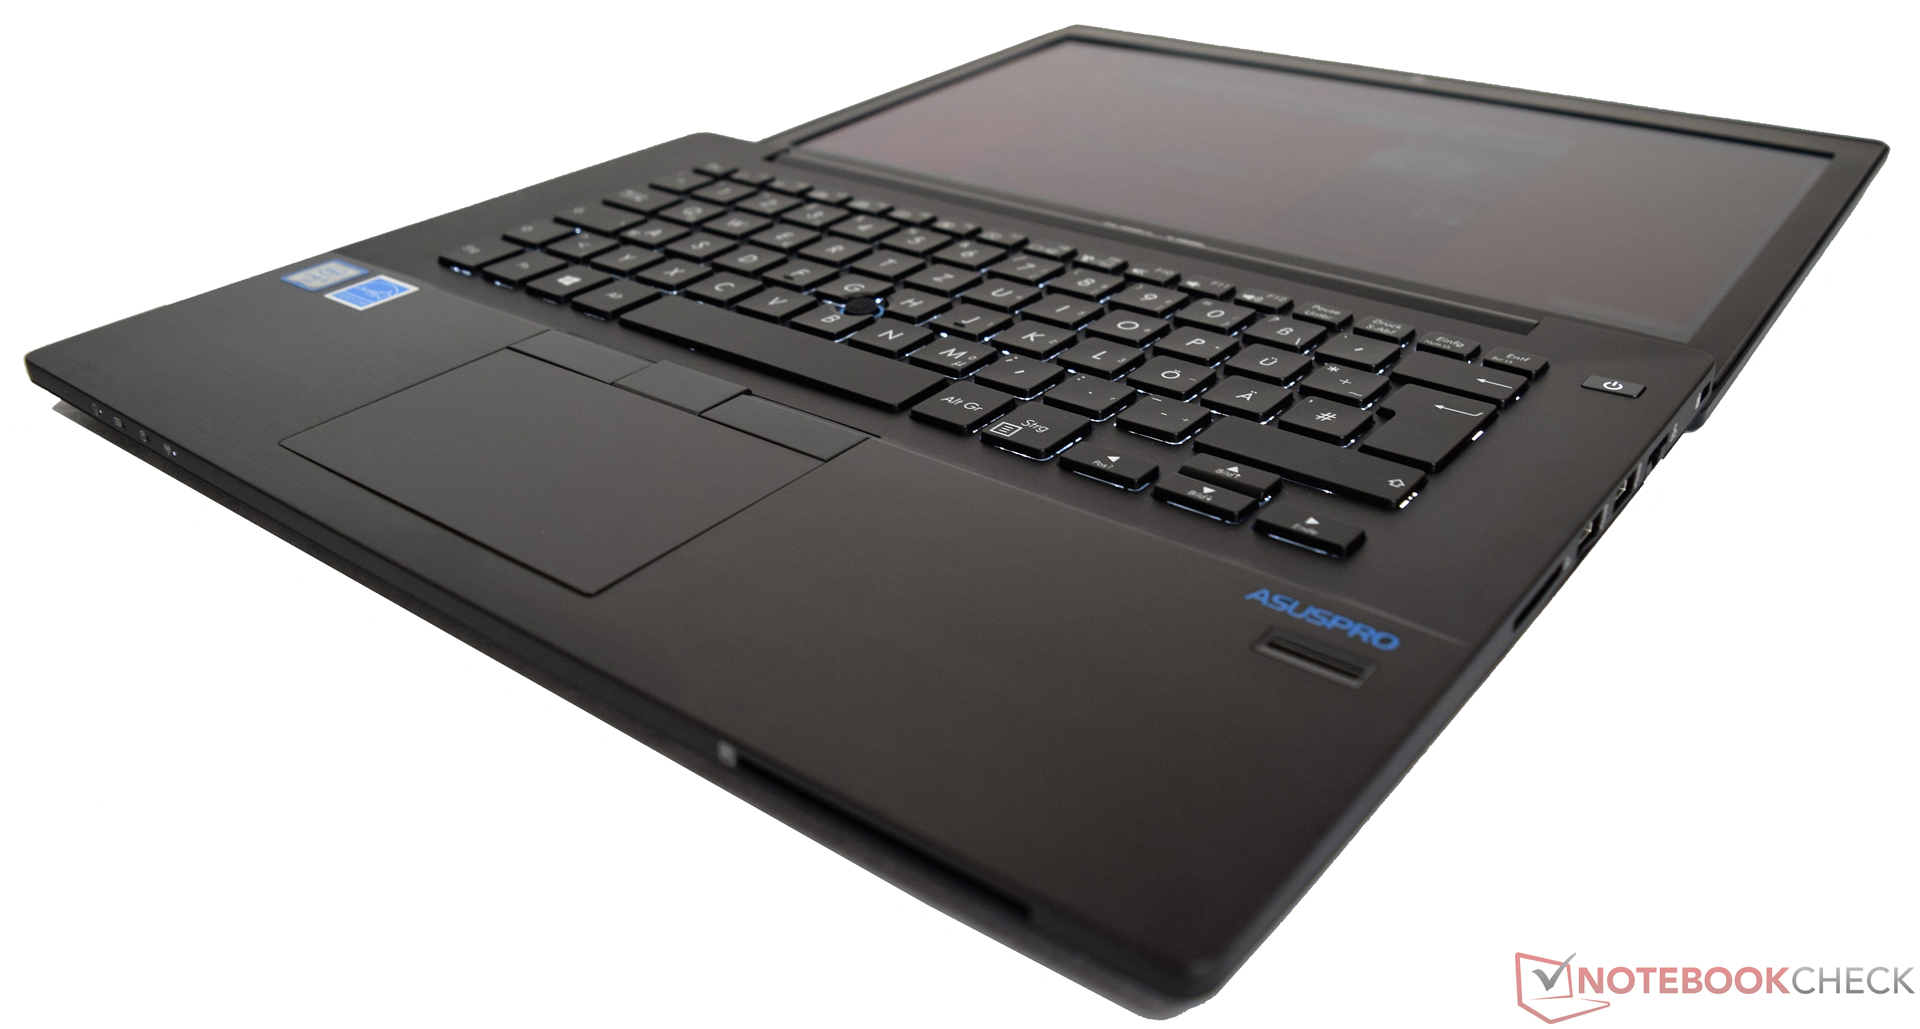
低调而坚固的机身搭配平衡的配置——这一切只需要不足1000欧元(约7269人民币)的预算。
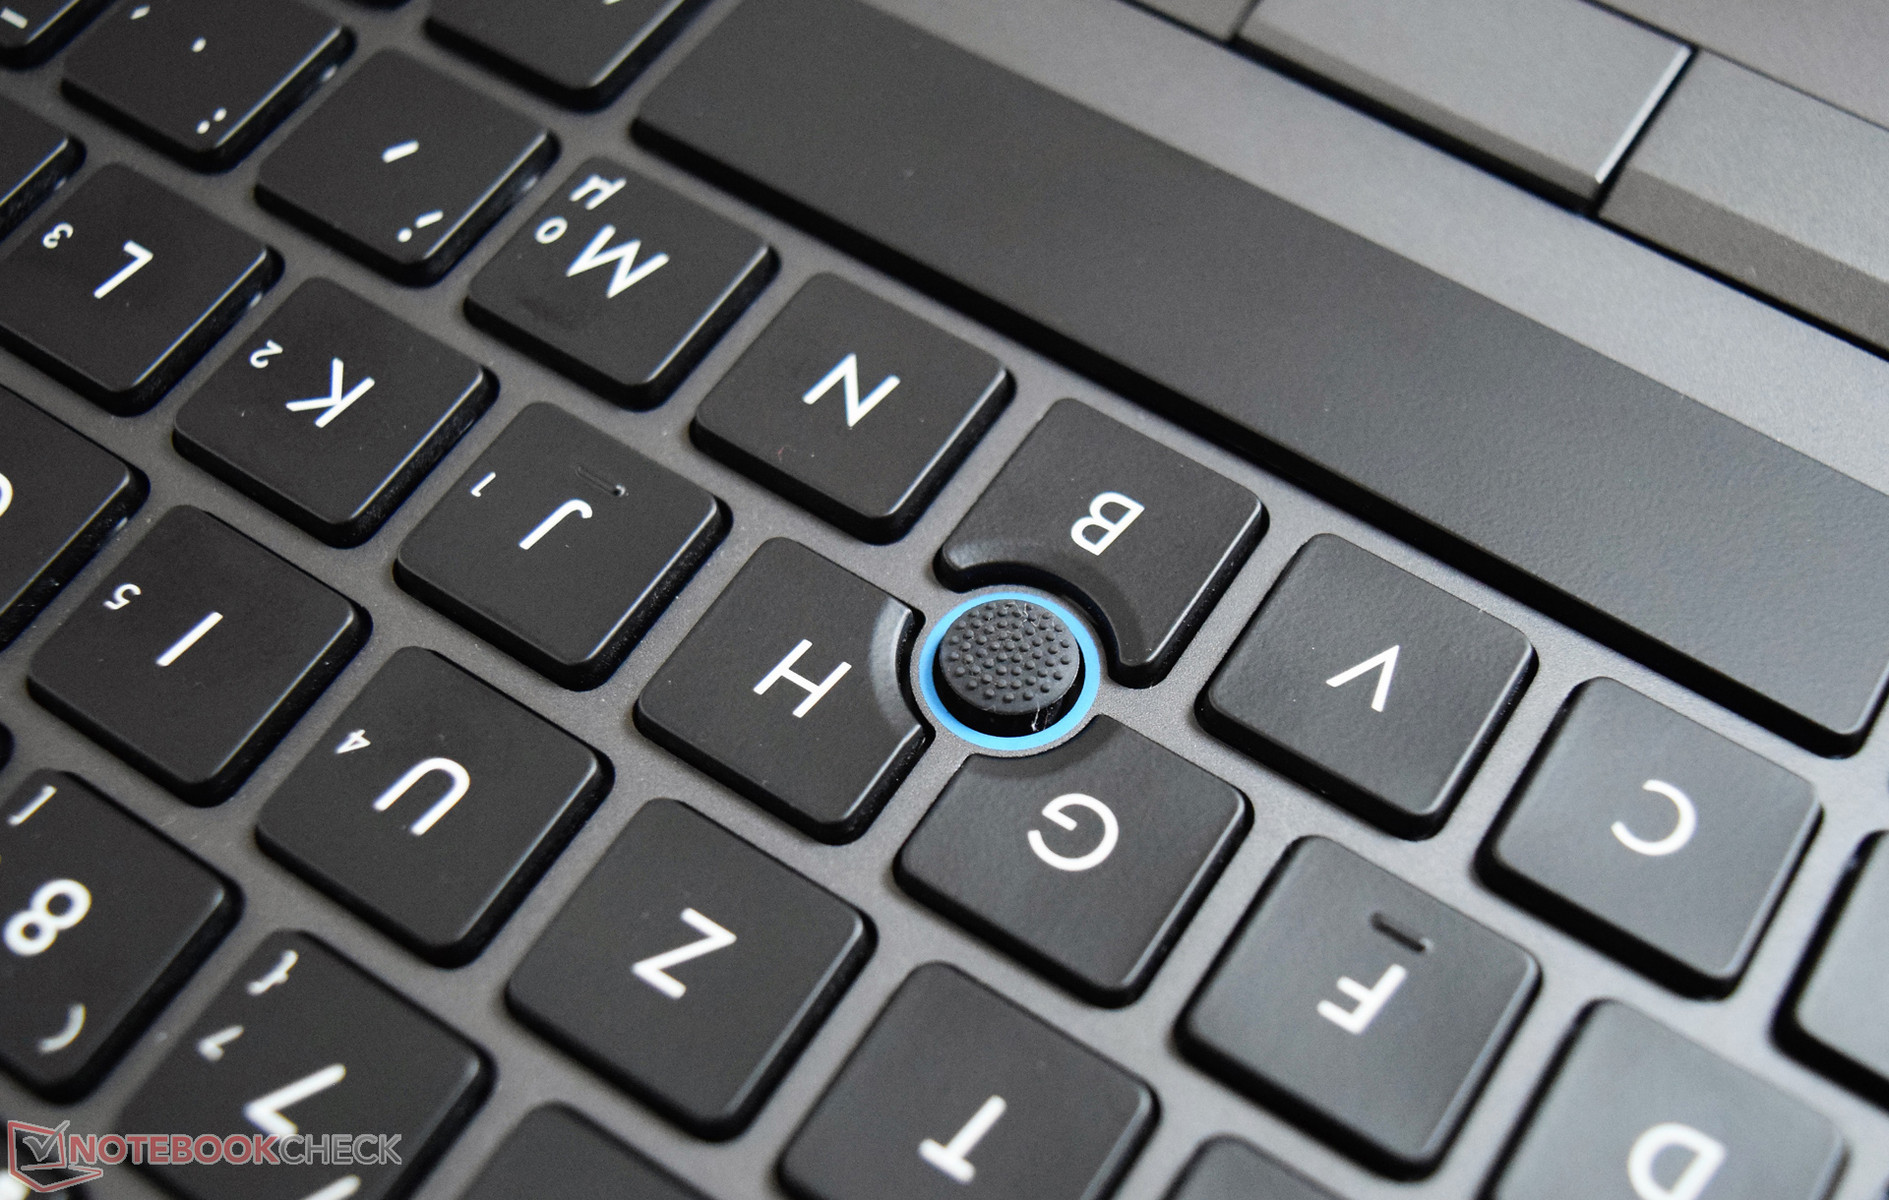
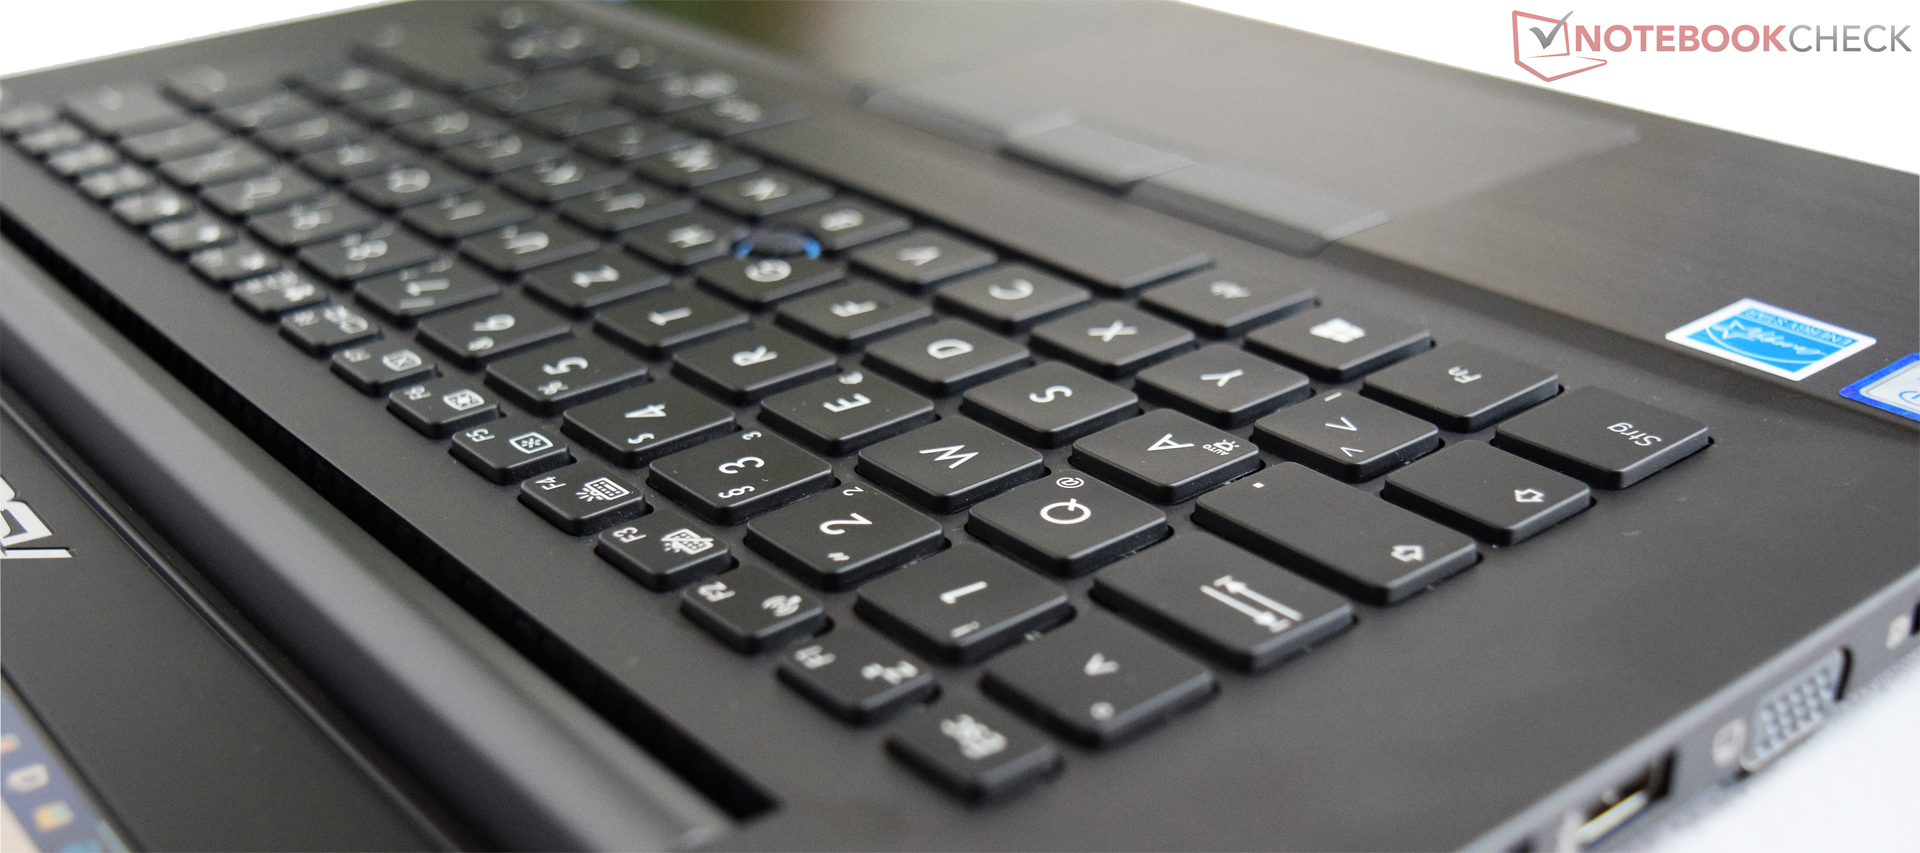
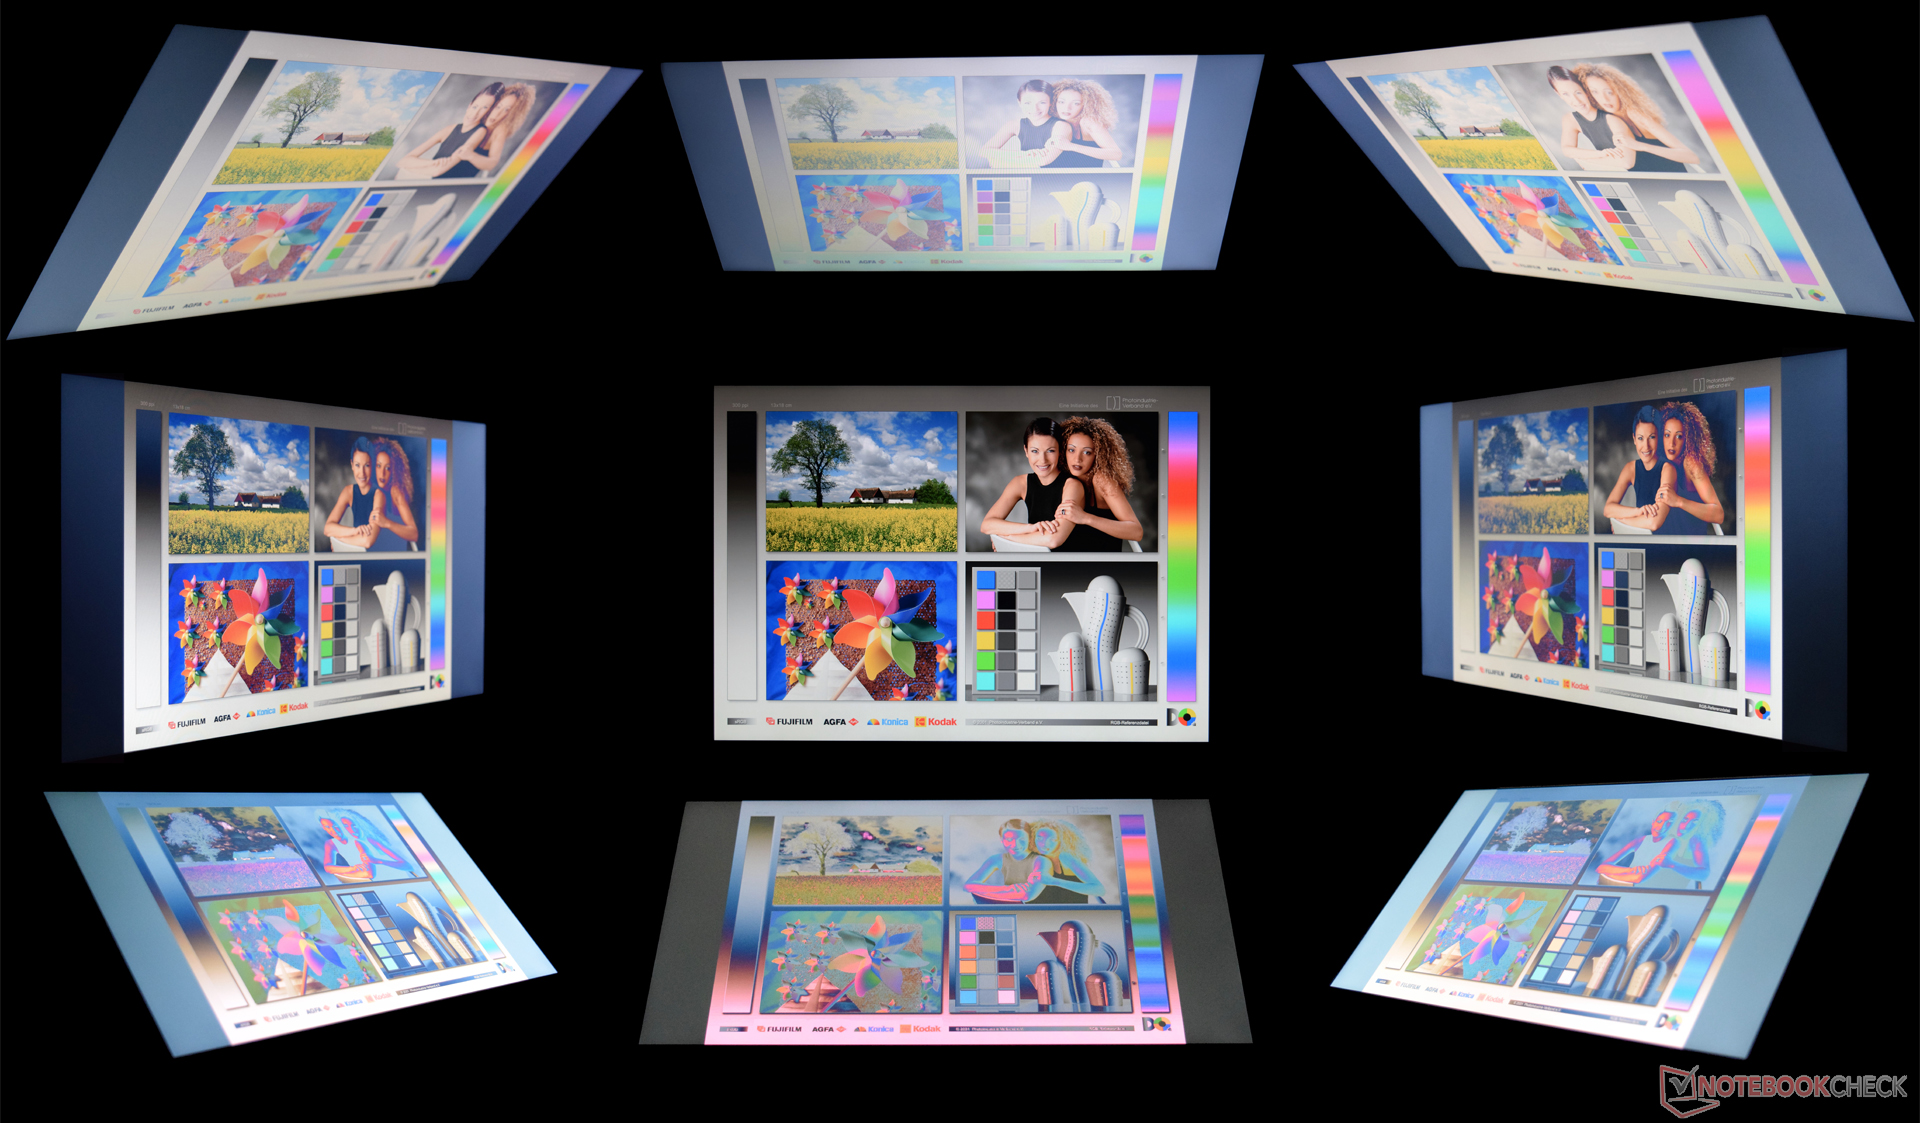
我们对它的屏幕有些失望,尽管这块TN技术面板提供了不错的可视角度范围,但在亮度上很难让人满意。而较小的立体声扬声器也很难让人满意。这台测试机的显卡性能很难满足最新3D游戏的需要,不过对于办公则绰绰有余。如果你不想放弃游戏,那么就需要考虑一台搭配独立显卡的笔记本电脑。我们很喜欢它的输入设备,这对于办公设备来说不可或缺,同时它也带来了不错的电池续航。这台AsusPro Advanced可以说是AsusPro Advanced BU401LA实至名归的后续机型。
注:本文是基于完整评测的缩减版本,阅读完整的英文评测,请点击这里。
Asus ASUSPRO Advanced B8430UA-FA0084E
- 07/03/2016 v5.1 (old)
Sebastian Bade
Price comparison
