判决
小米 Pad Mini 是一款小巧、轻便、高品质的平板电脑,8.8 英寸的小巧金属外壳中装入了大量存储空间。它拥有明亮的 165 Hz 面板、快如闪电的 Mediatek Dimensity 9400+ 处理器和两个 USB-C 端口,与许多竞争对手相比,它能提供更多的功能。尤其是其主要竞争对手之一的Apple iPad Mini 7,在电池续航时间方面明显不如小米 Pad Mini。
遗憾的是,这款小型小米平板电脑没有移动版,也没有 GPS 模块。我们希望小米 Pad Mini 能正式登陆欧洲,因为作为进口版本,它还有两个缺点:更新周期短于欧盟标准;根据进口商的不同,可能没有 24 个月的保修期。
Pros
Cons
价格和供应情况
在的新闻稿中关于 Pad Mini 的上市时间,小米只提到了 "部分市场"。至于是否包括欧盟市场,还有待观察。
对于 8/256 GB 的入门级版本,小米的零售价为 429 美元,约合 369 欧元。例如,12/512GB 的大存储版本在Aliexpress 上的售价约为 500 欧元(约合 580 美元)。在邮购公司Otto的价格约为 560 欧元。
Table of Contents
- 判决
- 规格
- 外壳 - 采用轻质金属一体成型机身的小米 Pad Mini
- 功能 - 配备 2x USB-C 接口的小米 Pad Mini
- 软件 -Android 15,更新至 2028 年
- 通信和全球导航卫星系统 - 配备 WiFi 7,但没有移动通信和全球定位系统
- 照相机 - 日光下的实用快照
- 附件和保修 - 带问号的交货范围
- 输入设备和操作 - 165 Hz 显示屏和笔支持
- 显示屏 - 小米 Pad Mini,3K 分辨率,支持 HDR
- 性能 - 配备高端 SoC 的小米 Pad Mini
- 排放 - 多为酷平板电脑,扬声器性能良好
- 电池寿命 - 持久耐用,可在 1 小时内完成充电
- Notebookcheck 总体评分
- 可比较的替代品
通过小米 Pad Mini,小米推出了全球版本的 红米 K Pad.后者在我们的测试中表现出色,其低廉的价格、高端的性能和超长的电池续航时间给人留下了深刻印象。
因此,小米 Pad Mini 有能力获得较高的评价,尤其是在规格保持不变的情况下。价格也保持在相当低的水平。
规格
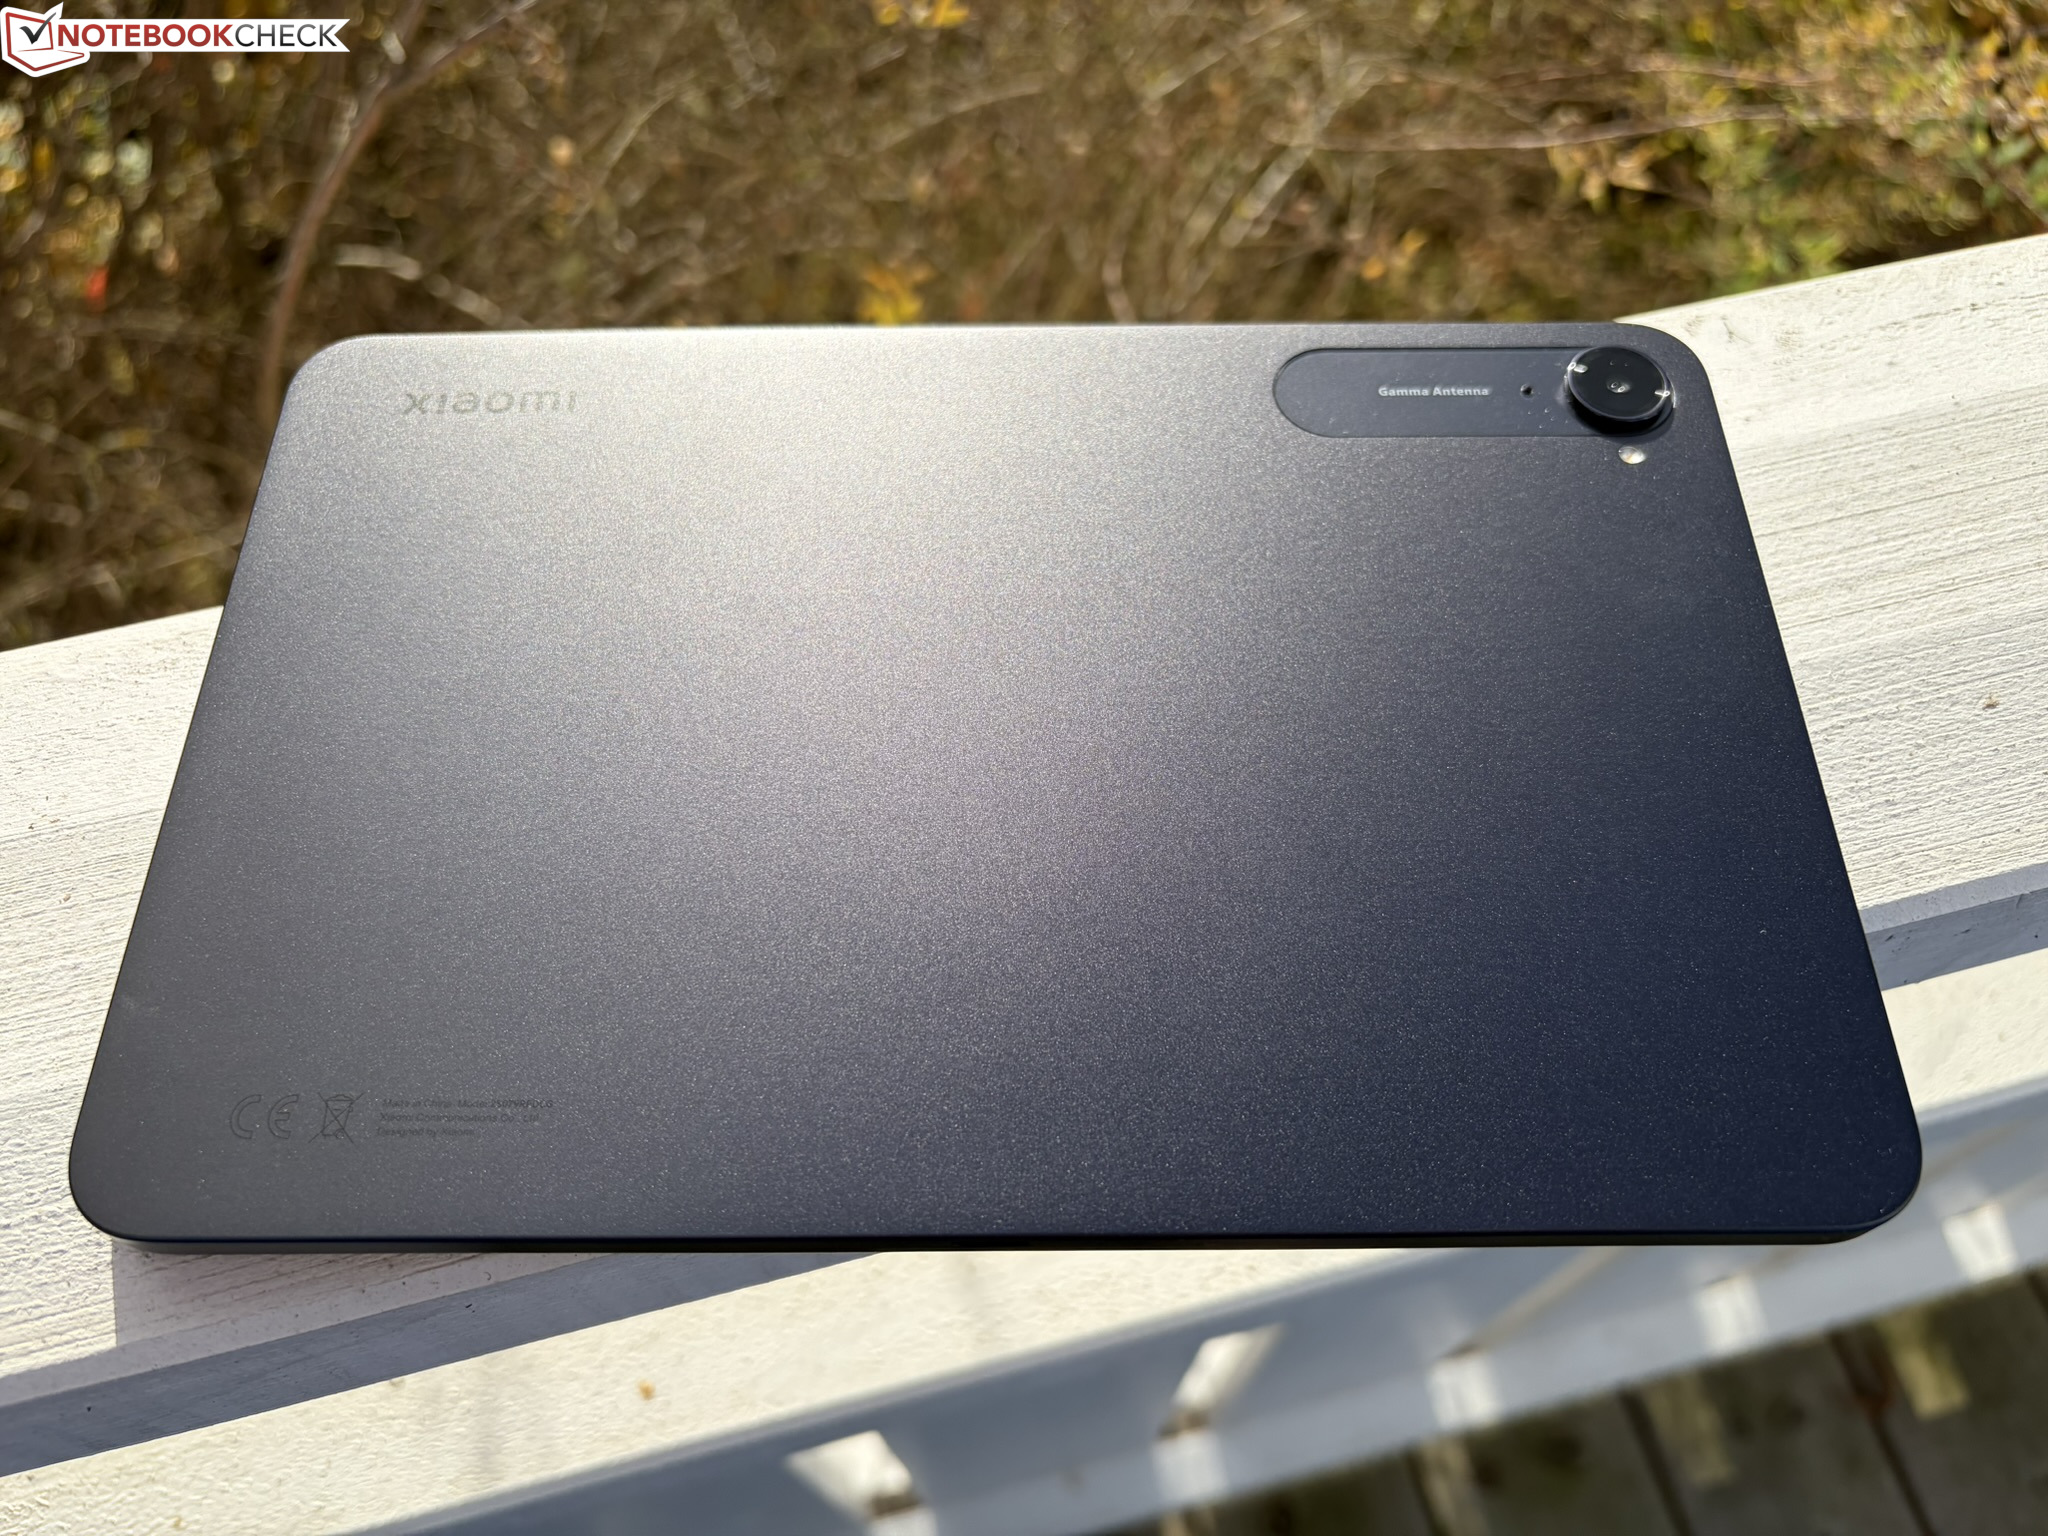
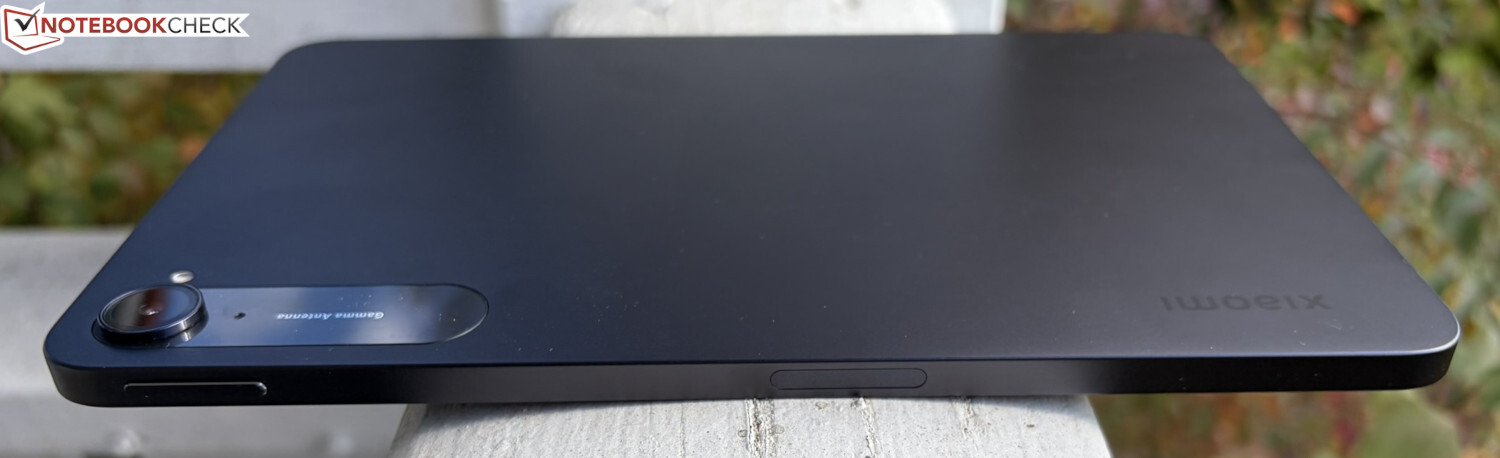
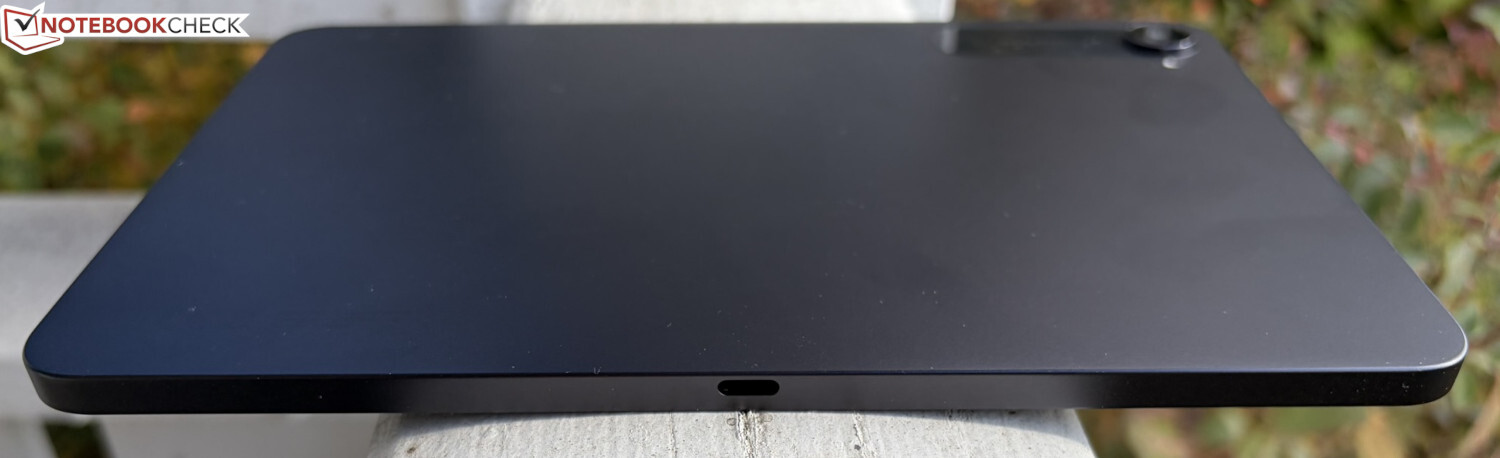
外壳 - 采用轻质金属一体成型机身的小米 Pad Mini
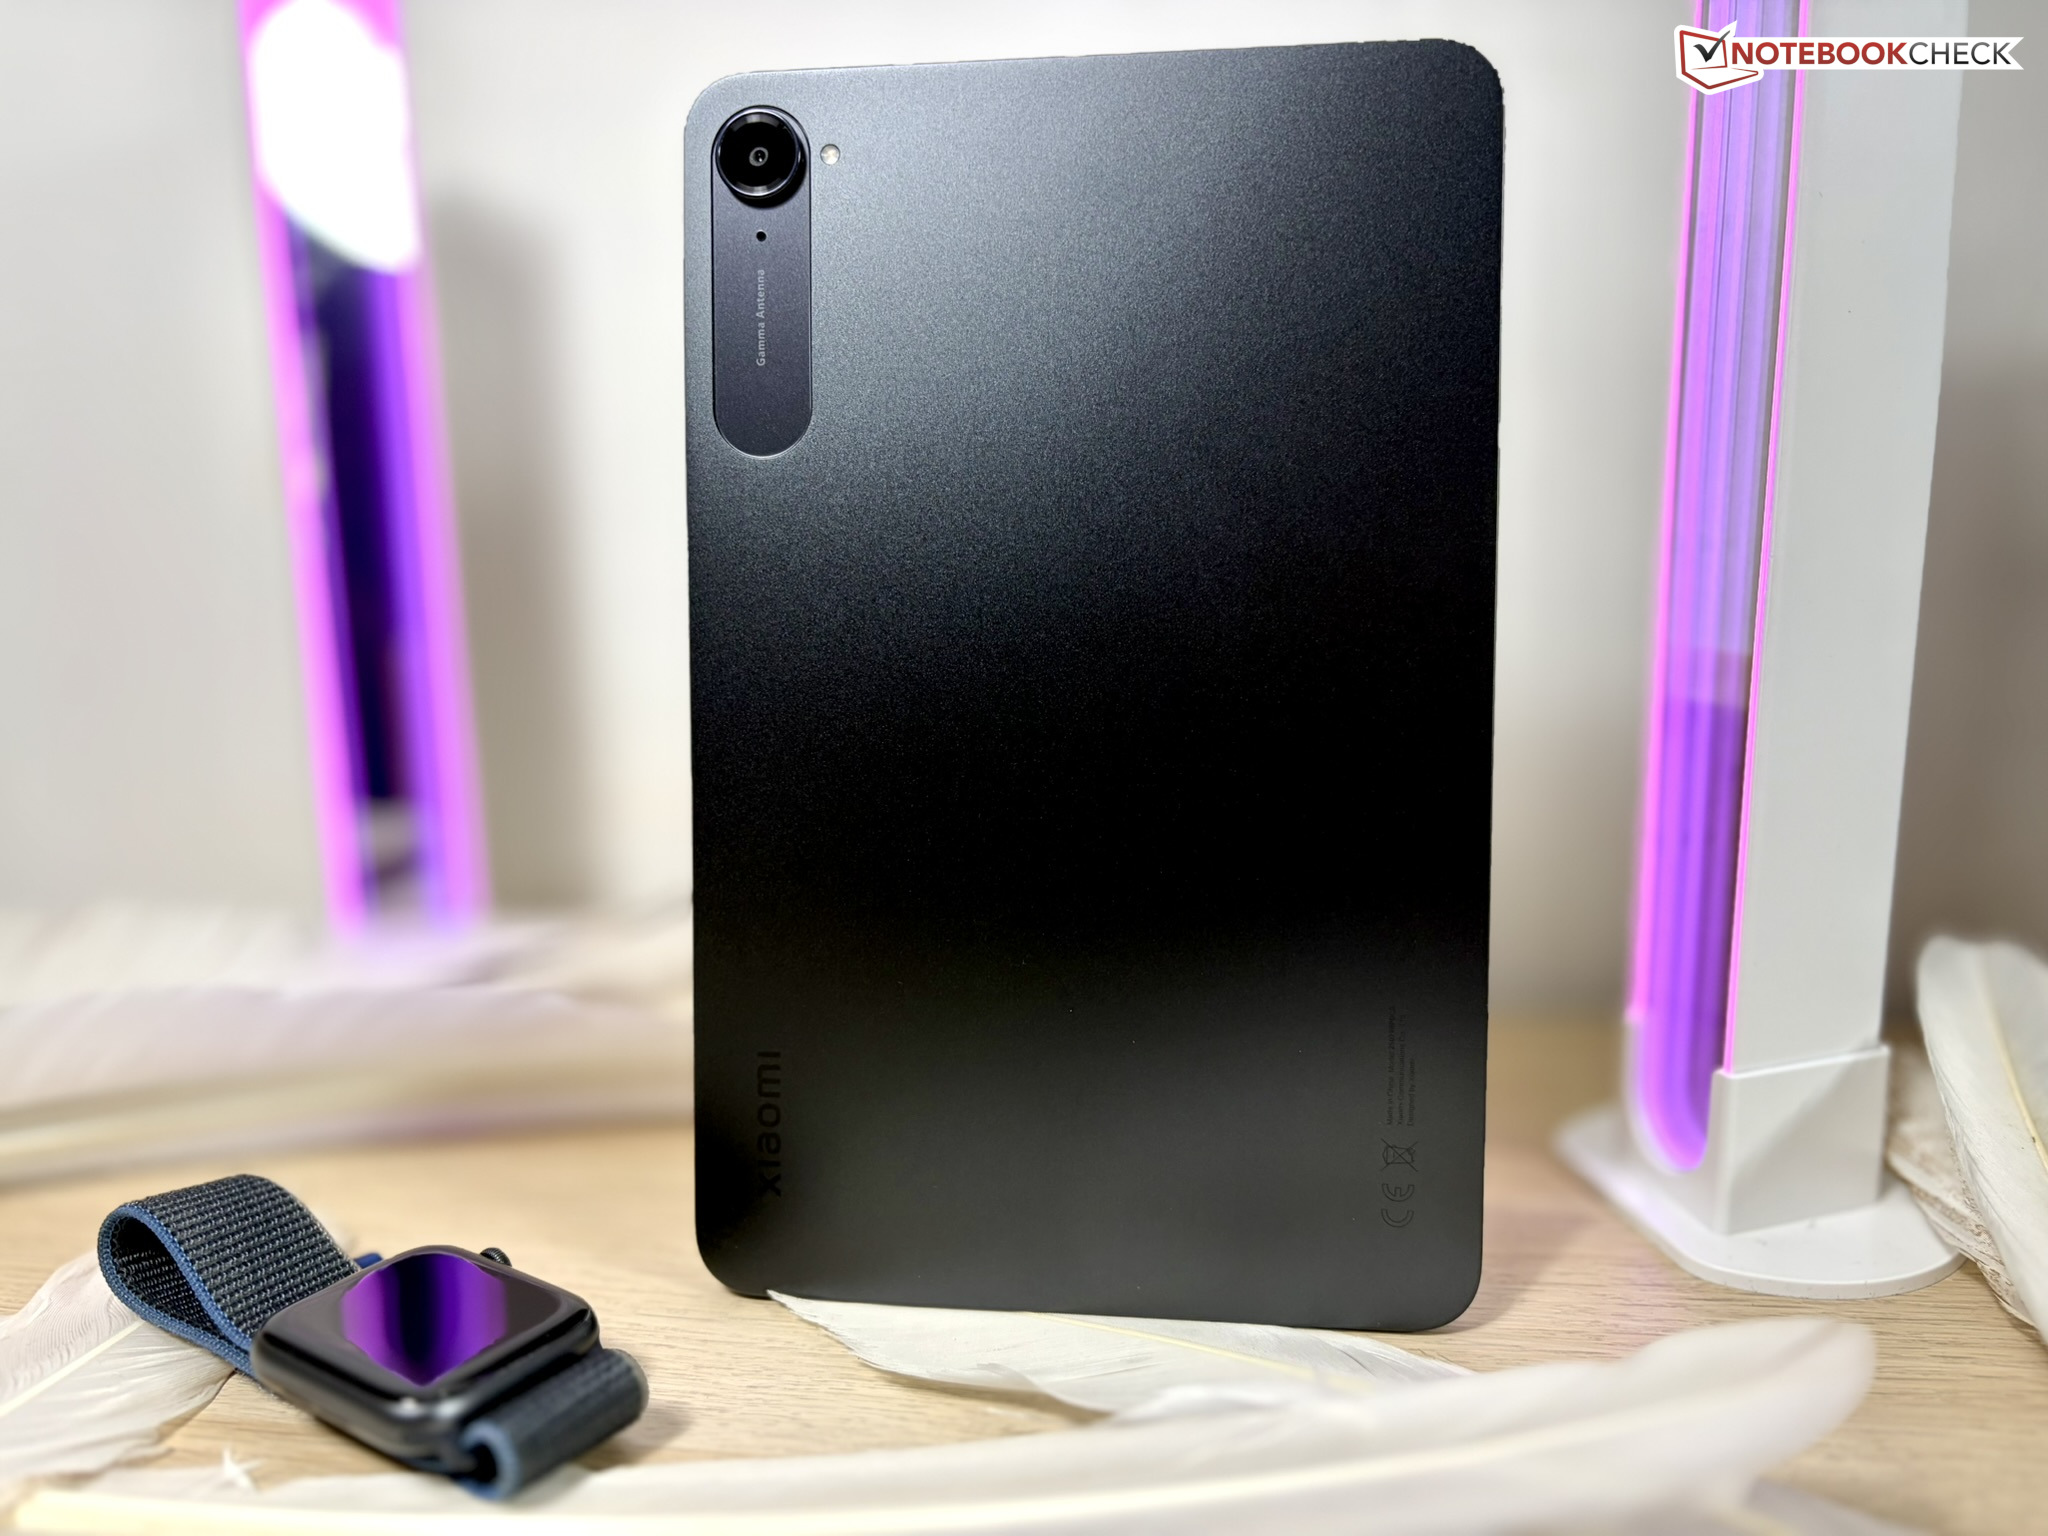
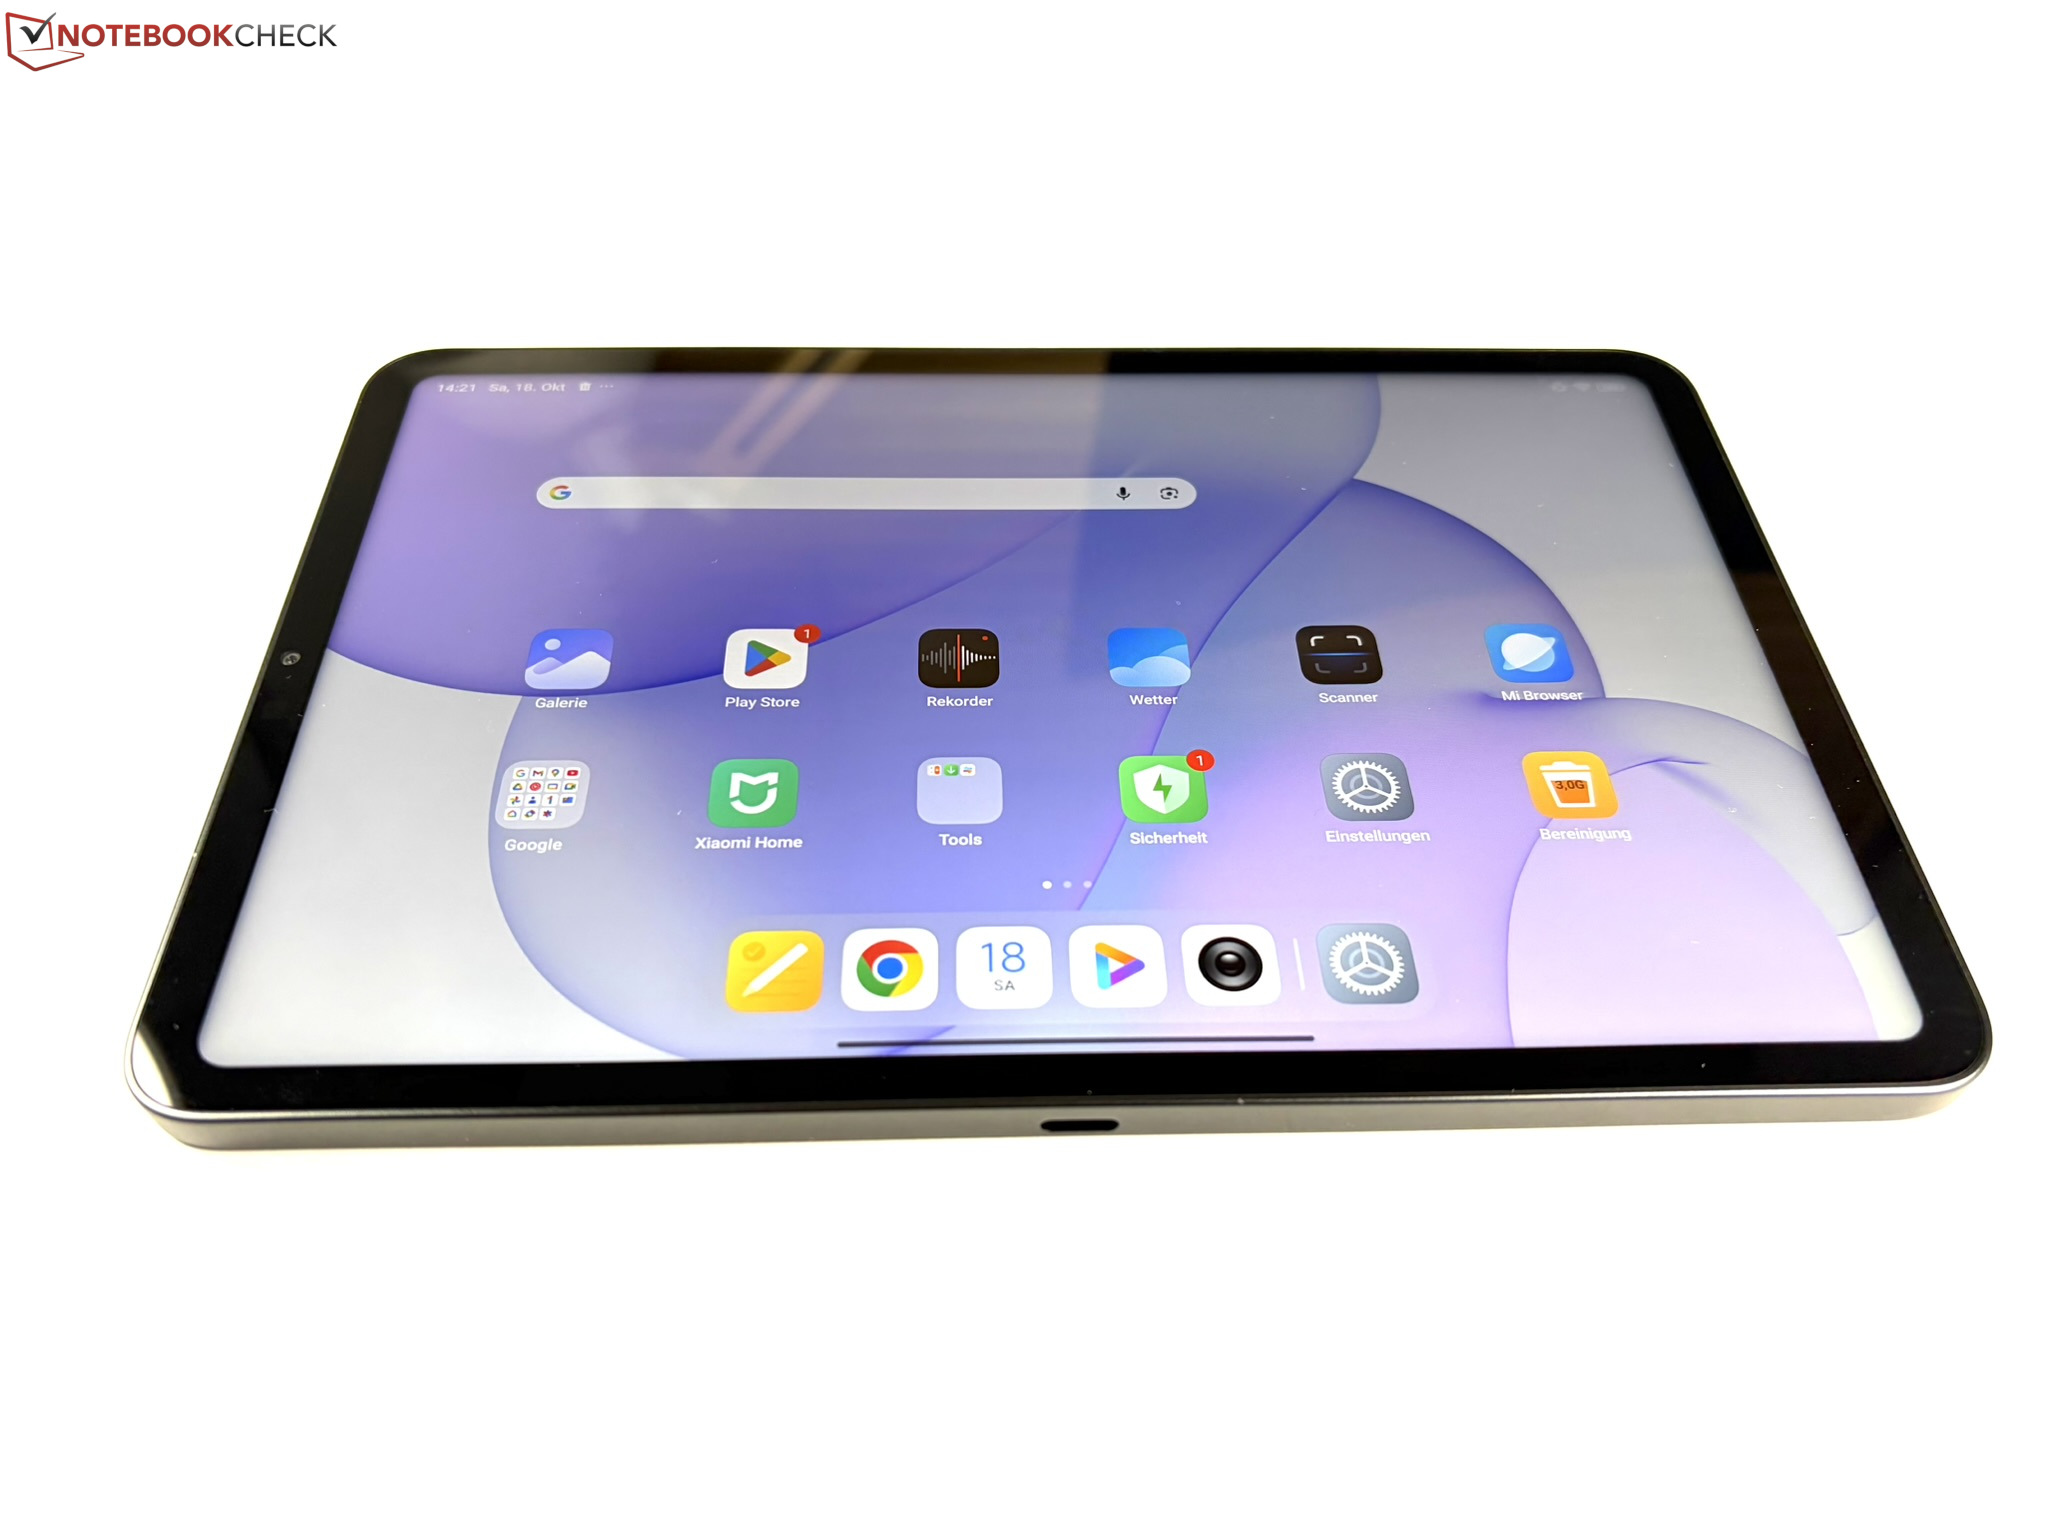
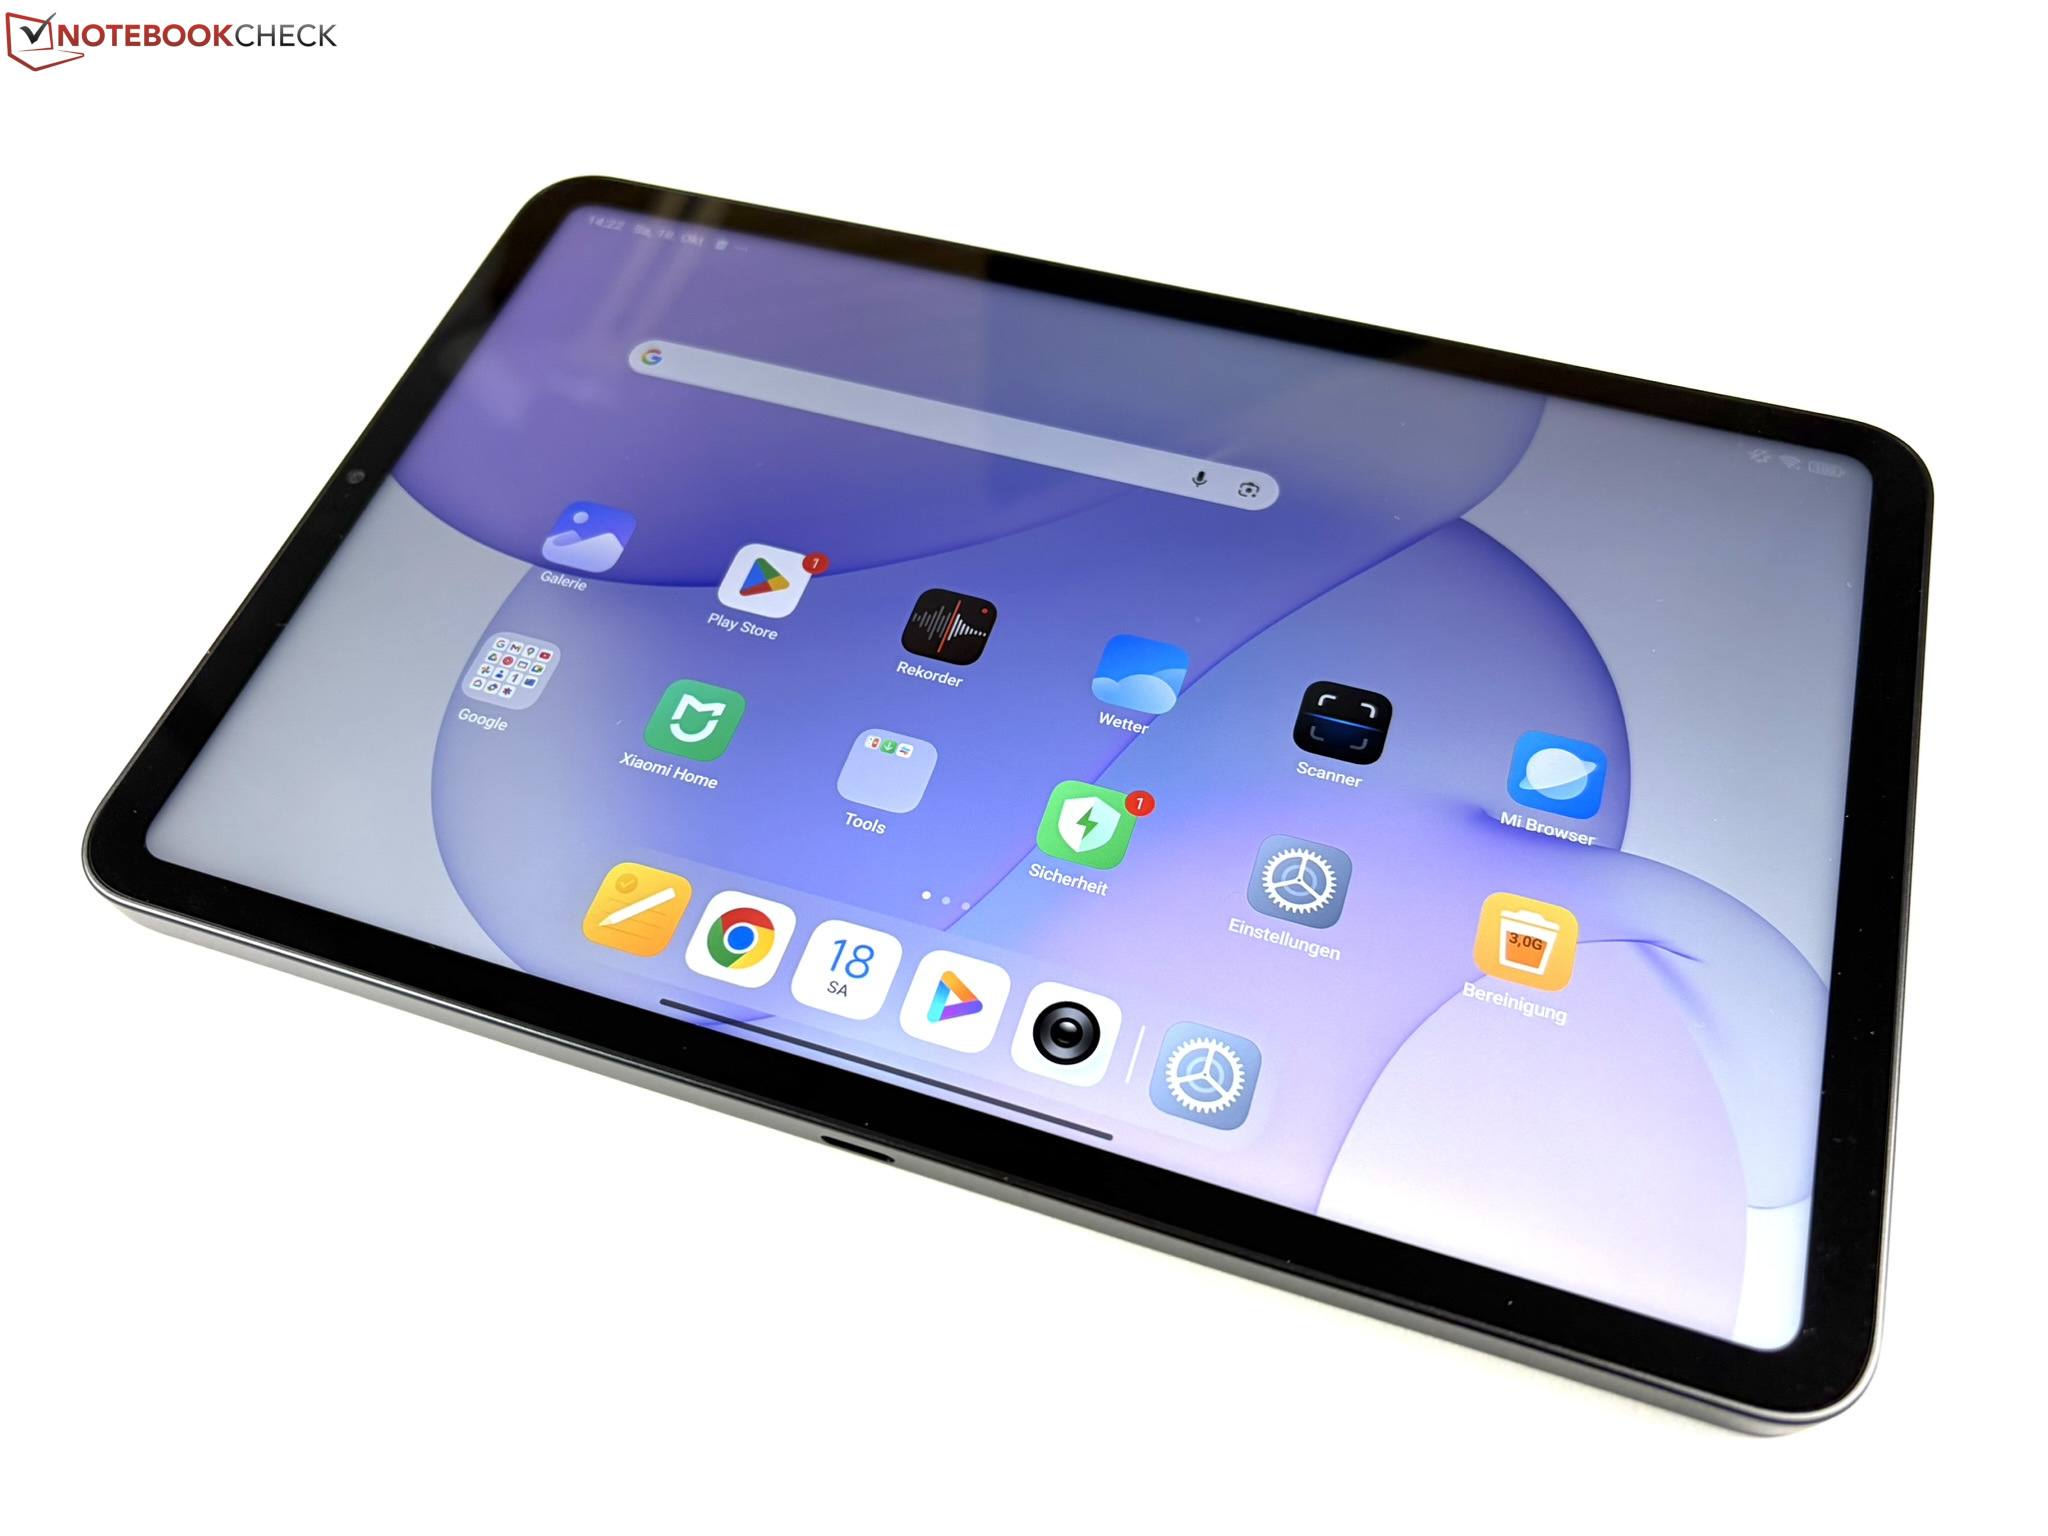
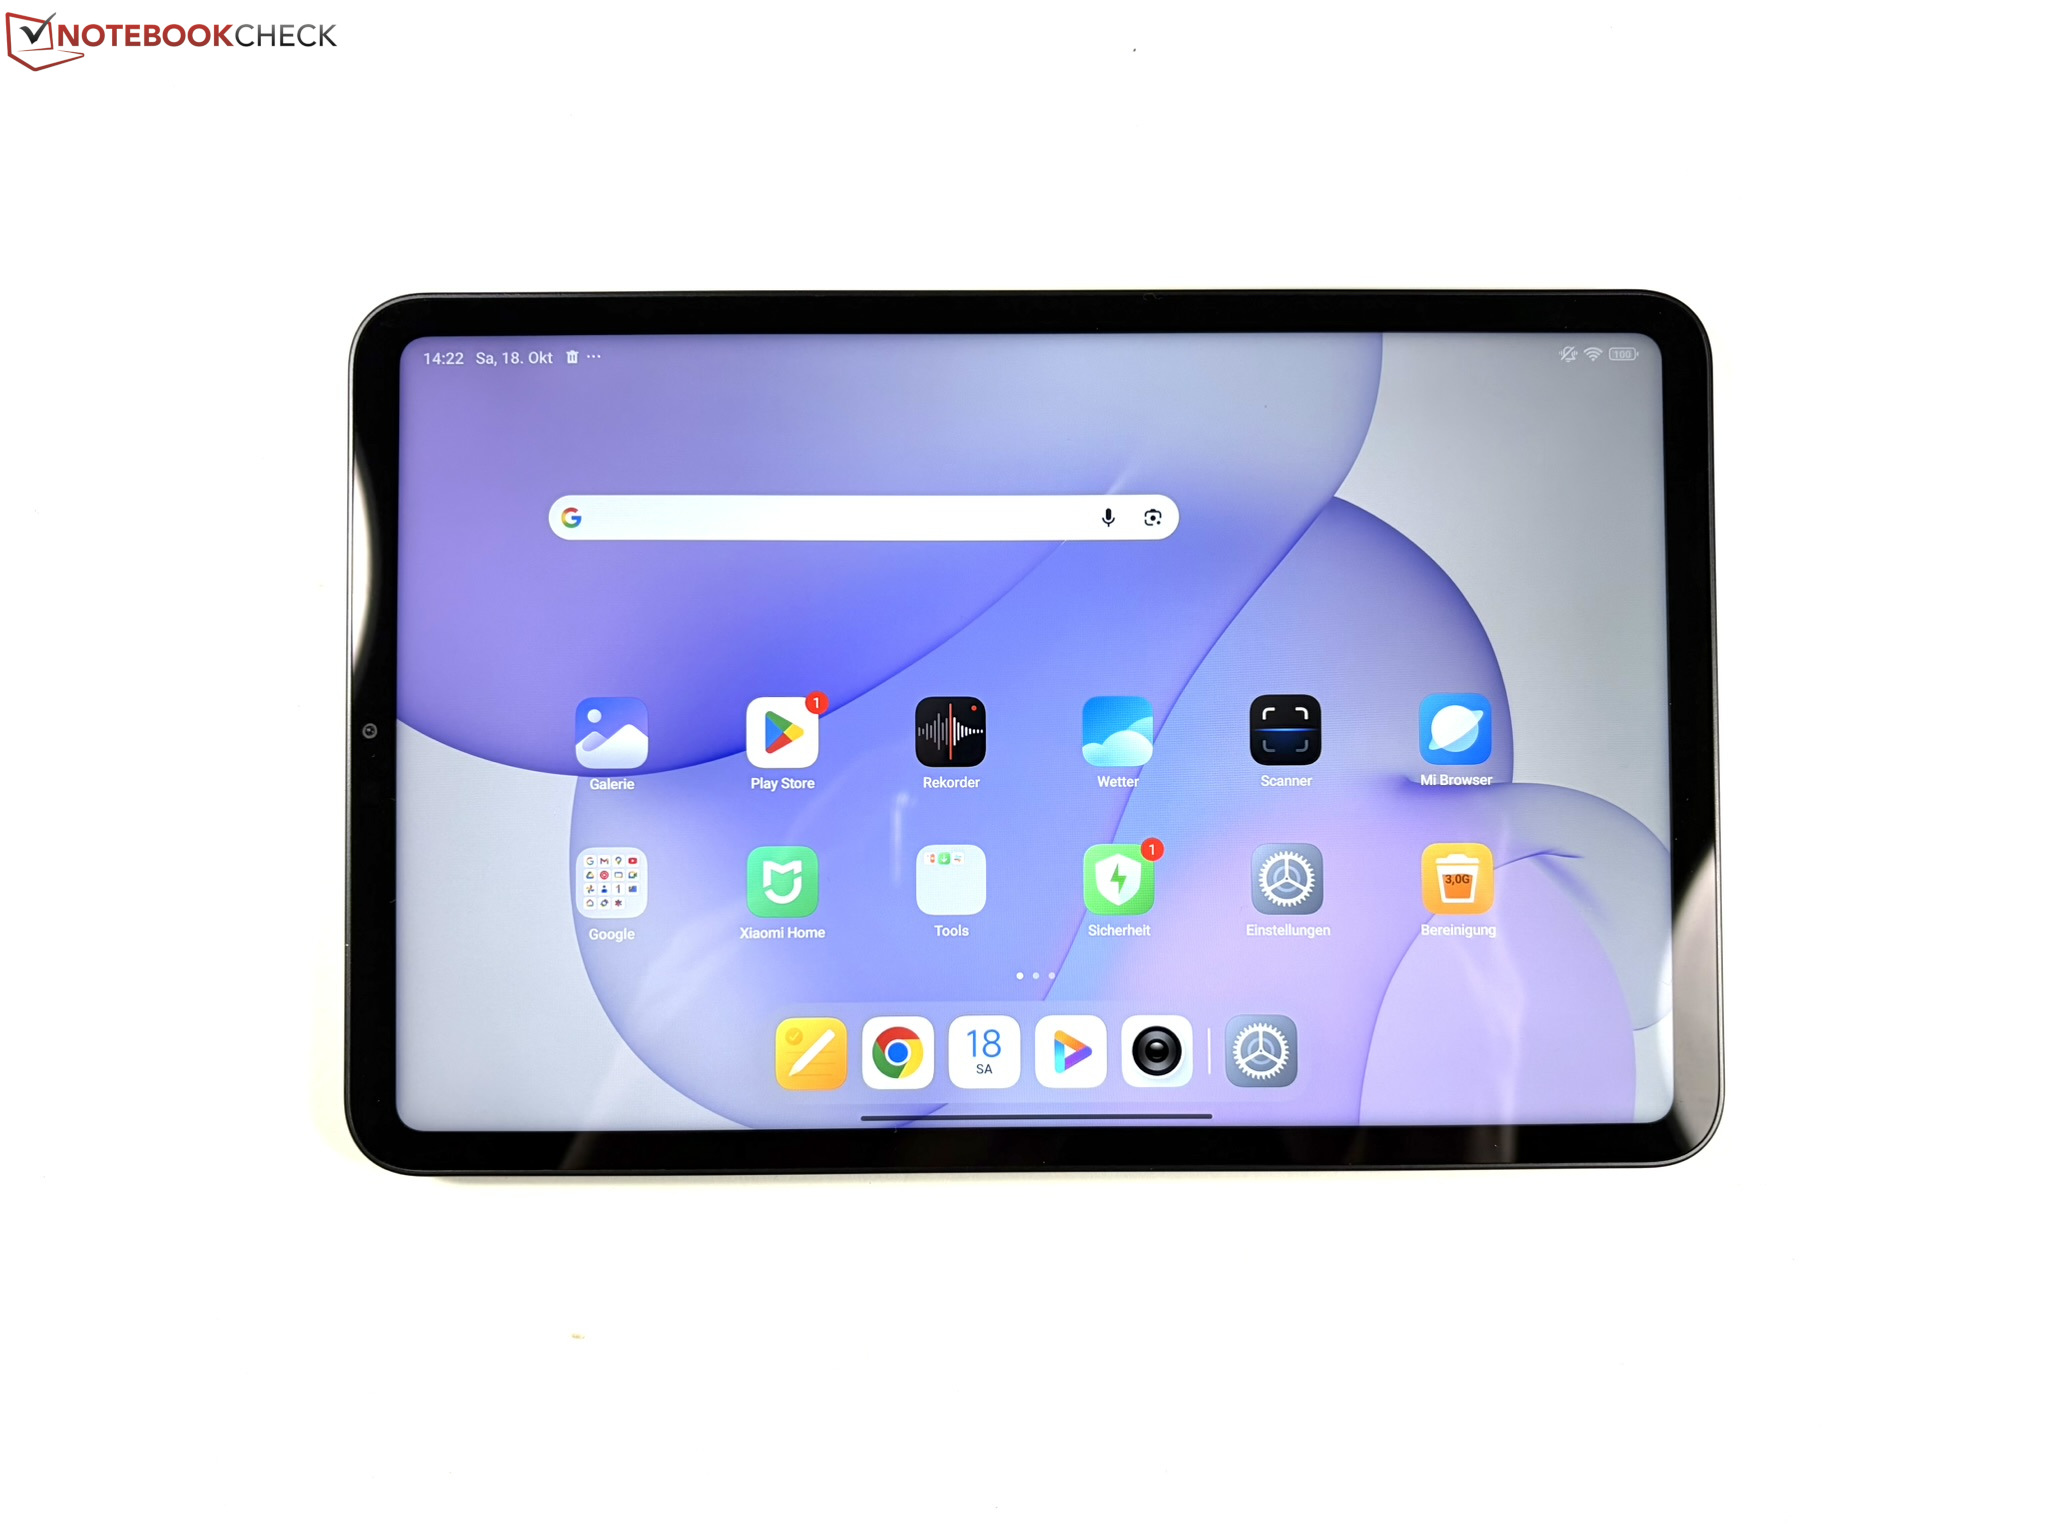
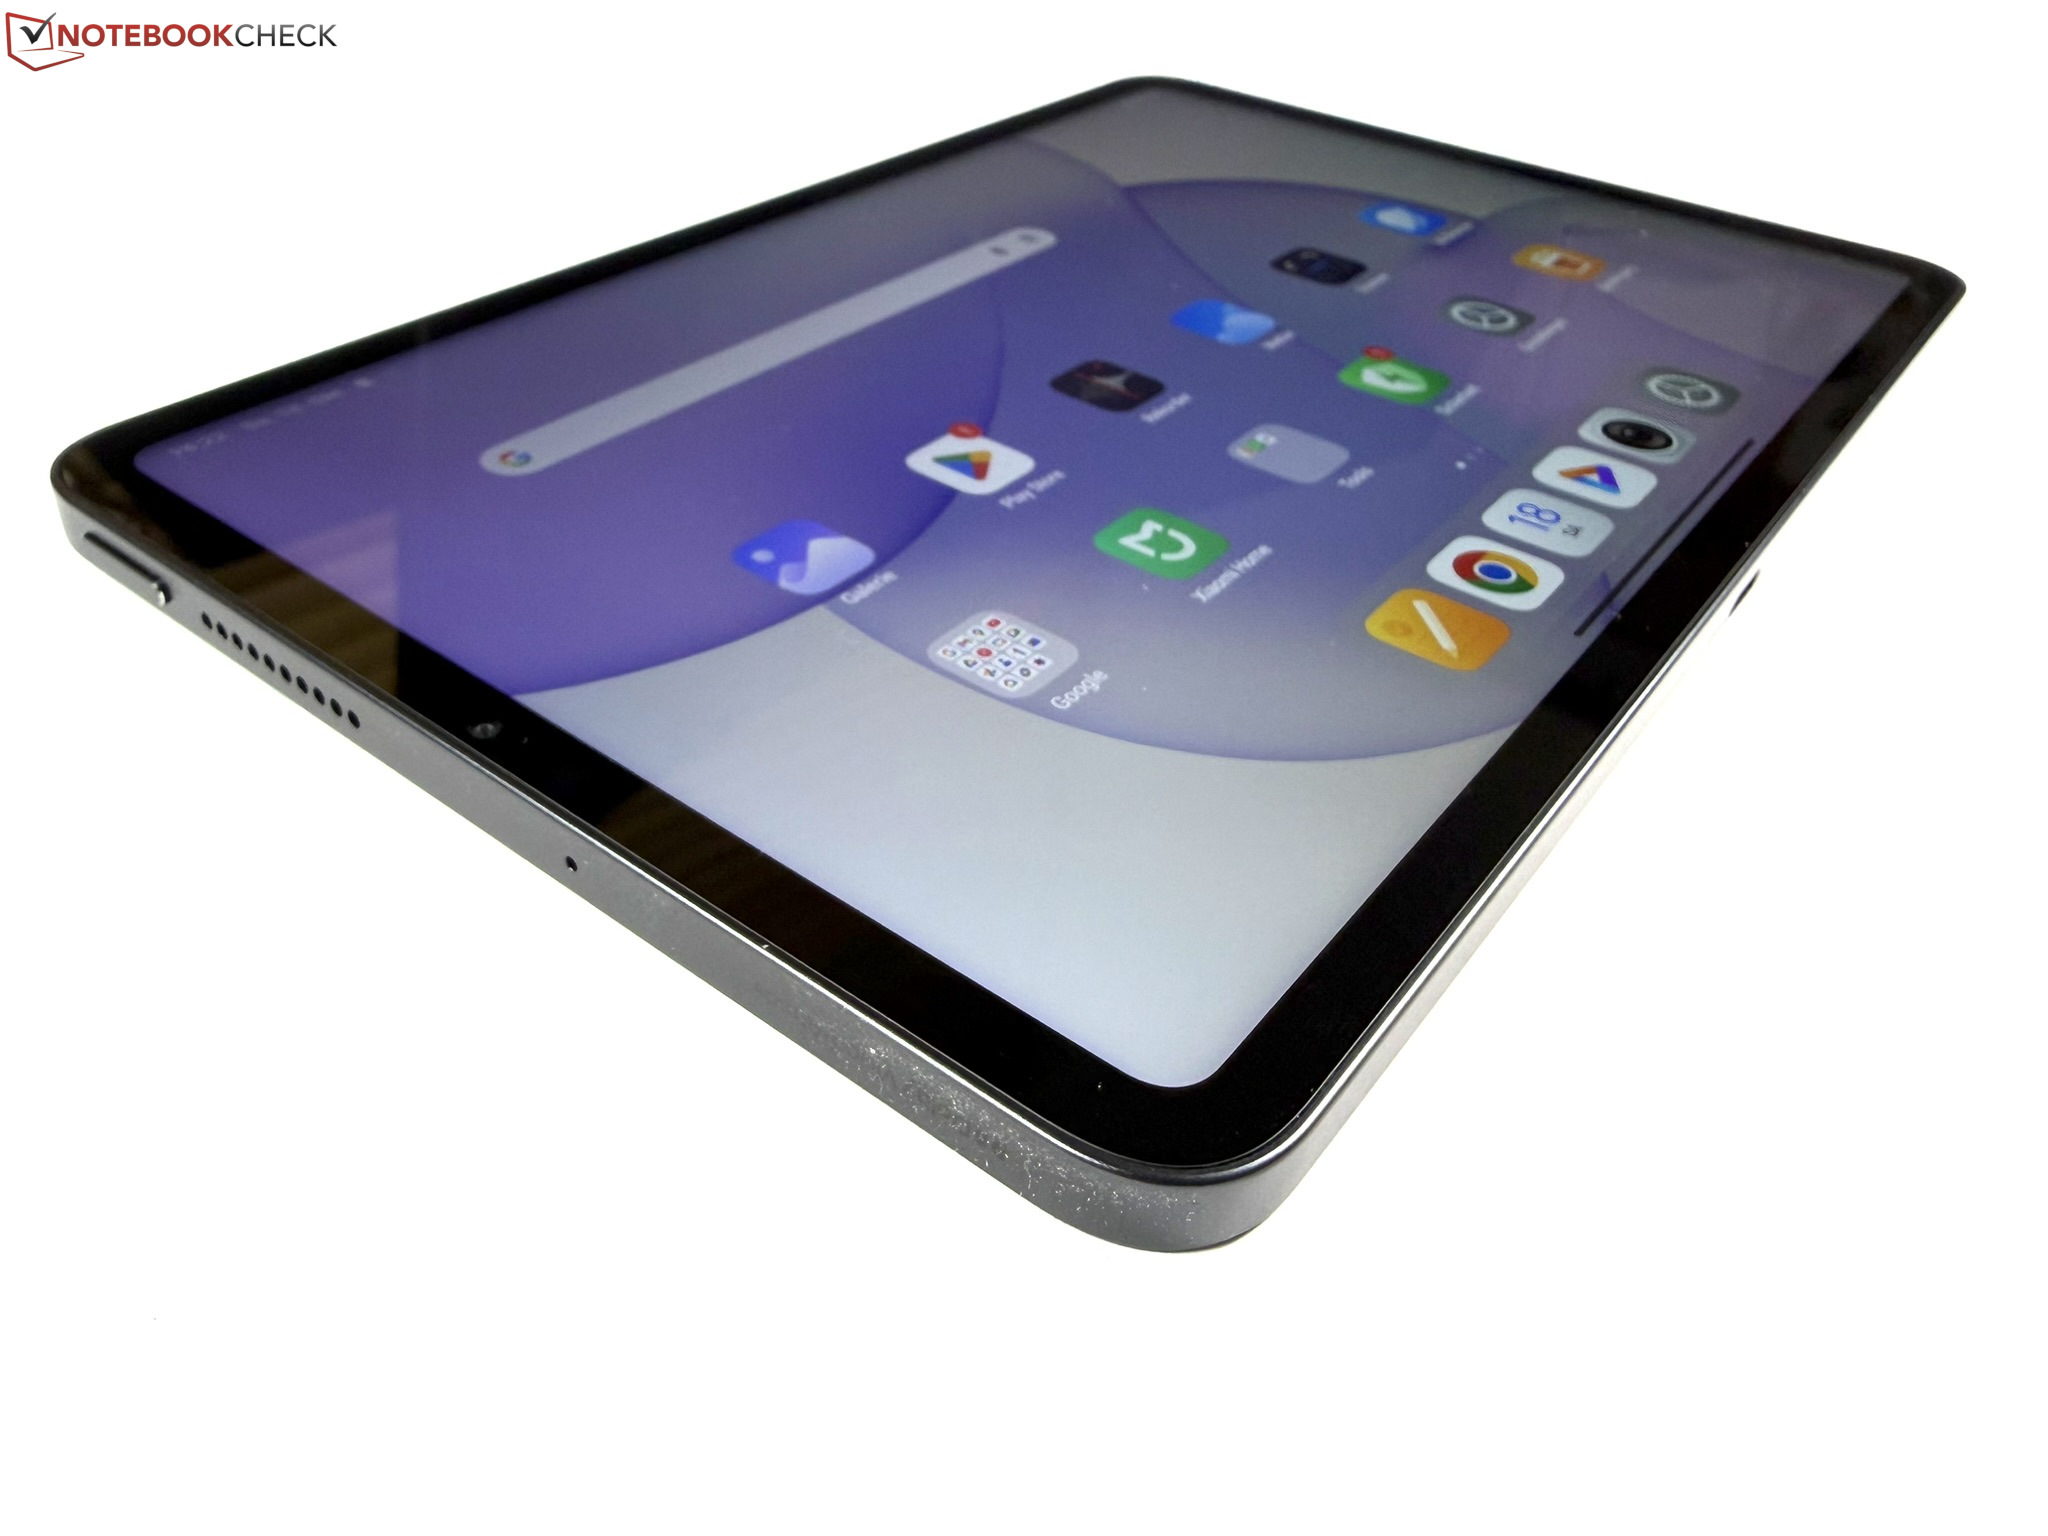
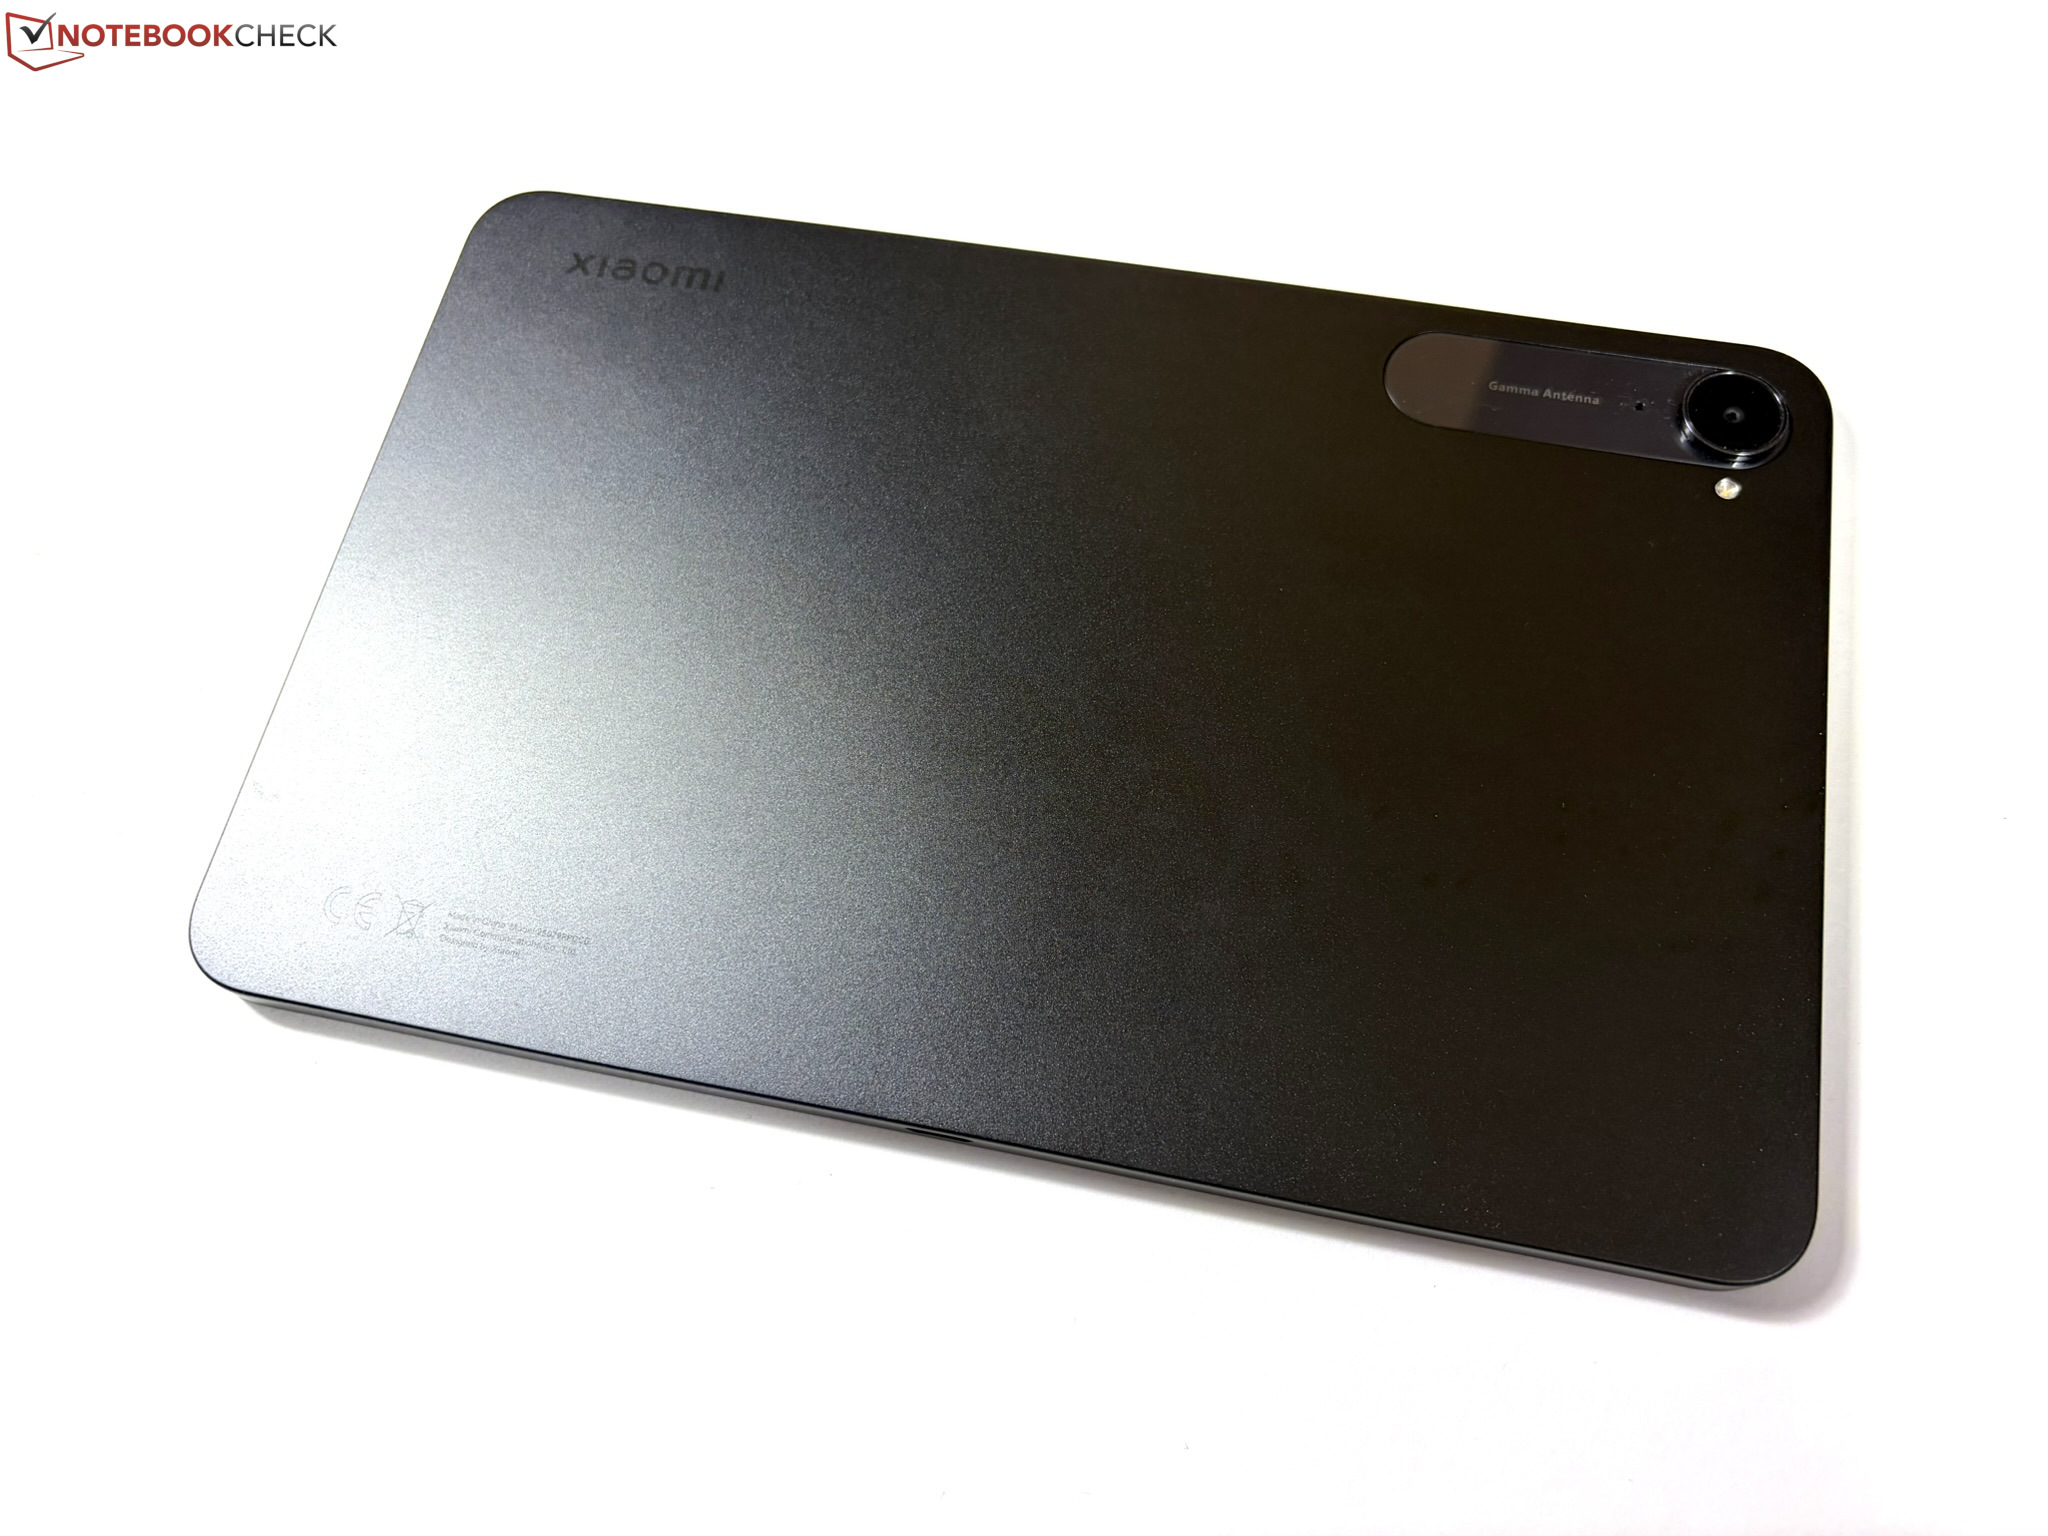
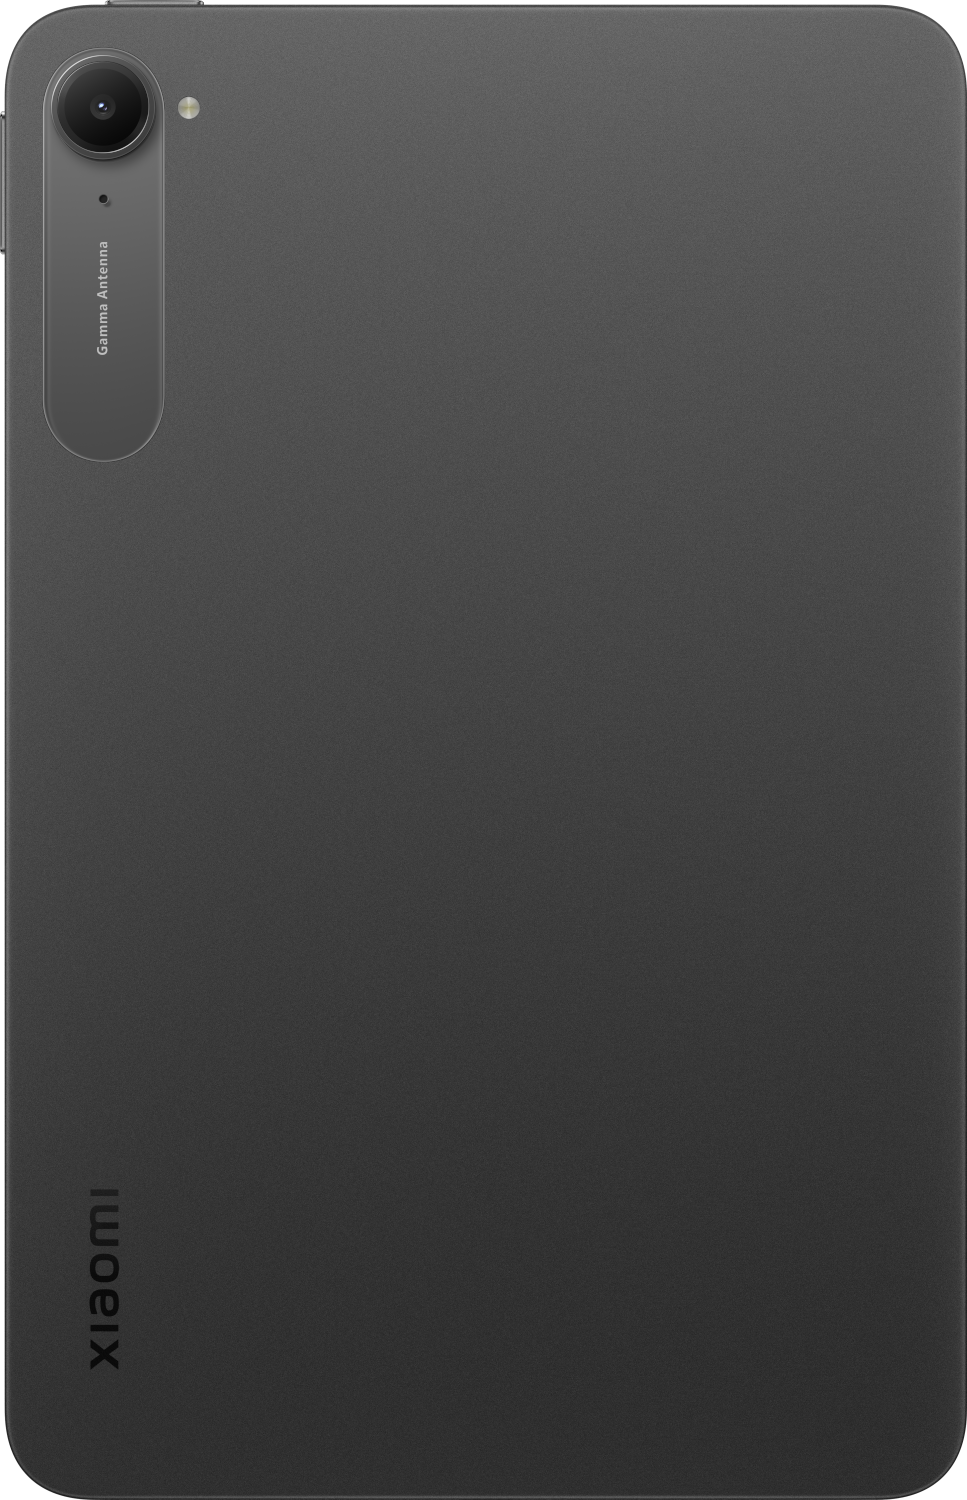
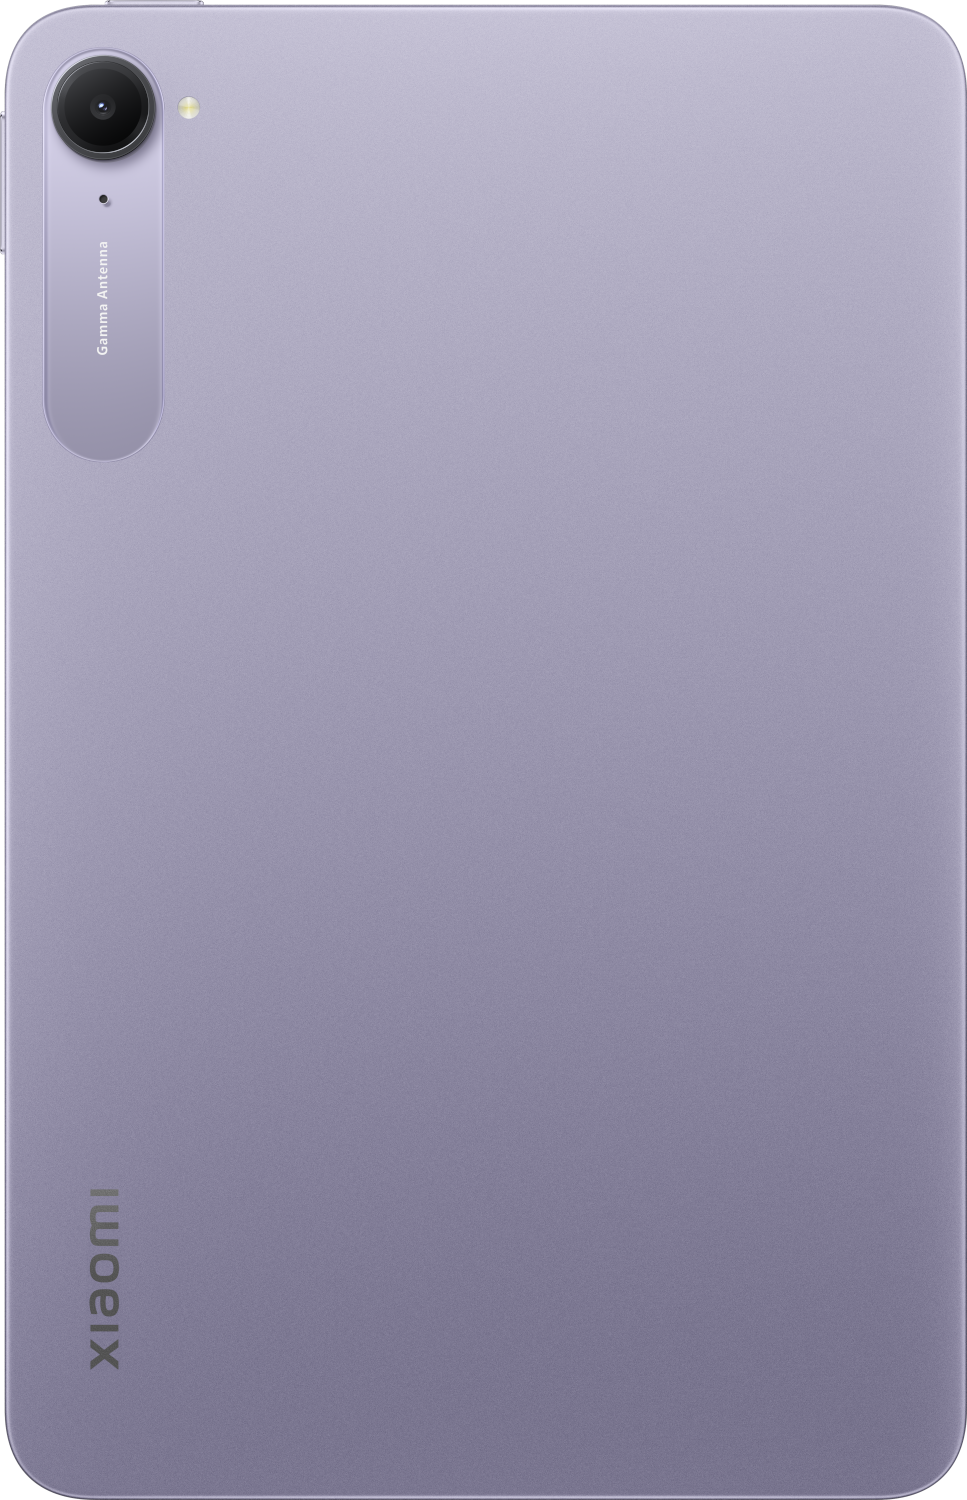
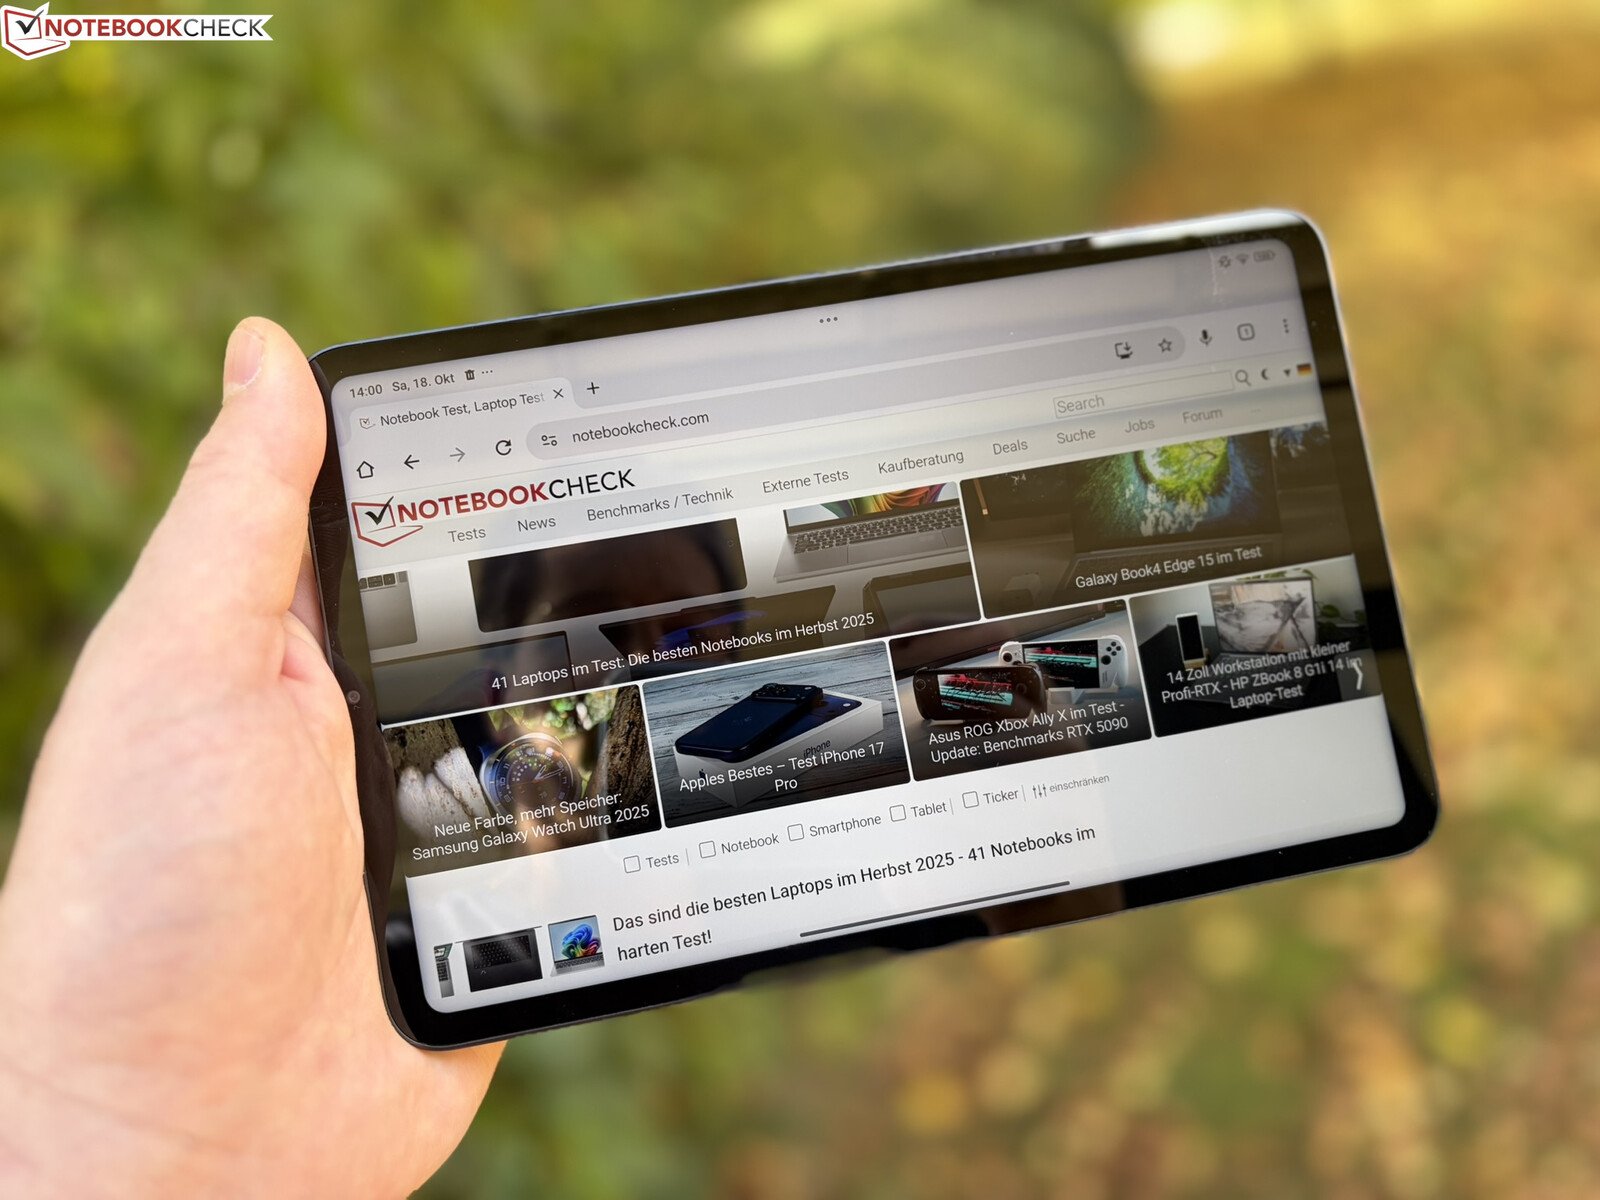
8.8 英寸的小米 Pad Mini 仅重 326 克,感觉非常轻巧。它看起来也比 Apple iPad Mini 7由于它的显示屏边缘很窄,四边大约只有 7 毫米。除了我们的灰色测试机,小米还提供紫色的 Pad Mini。
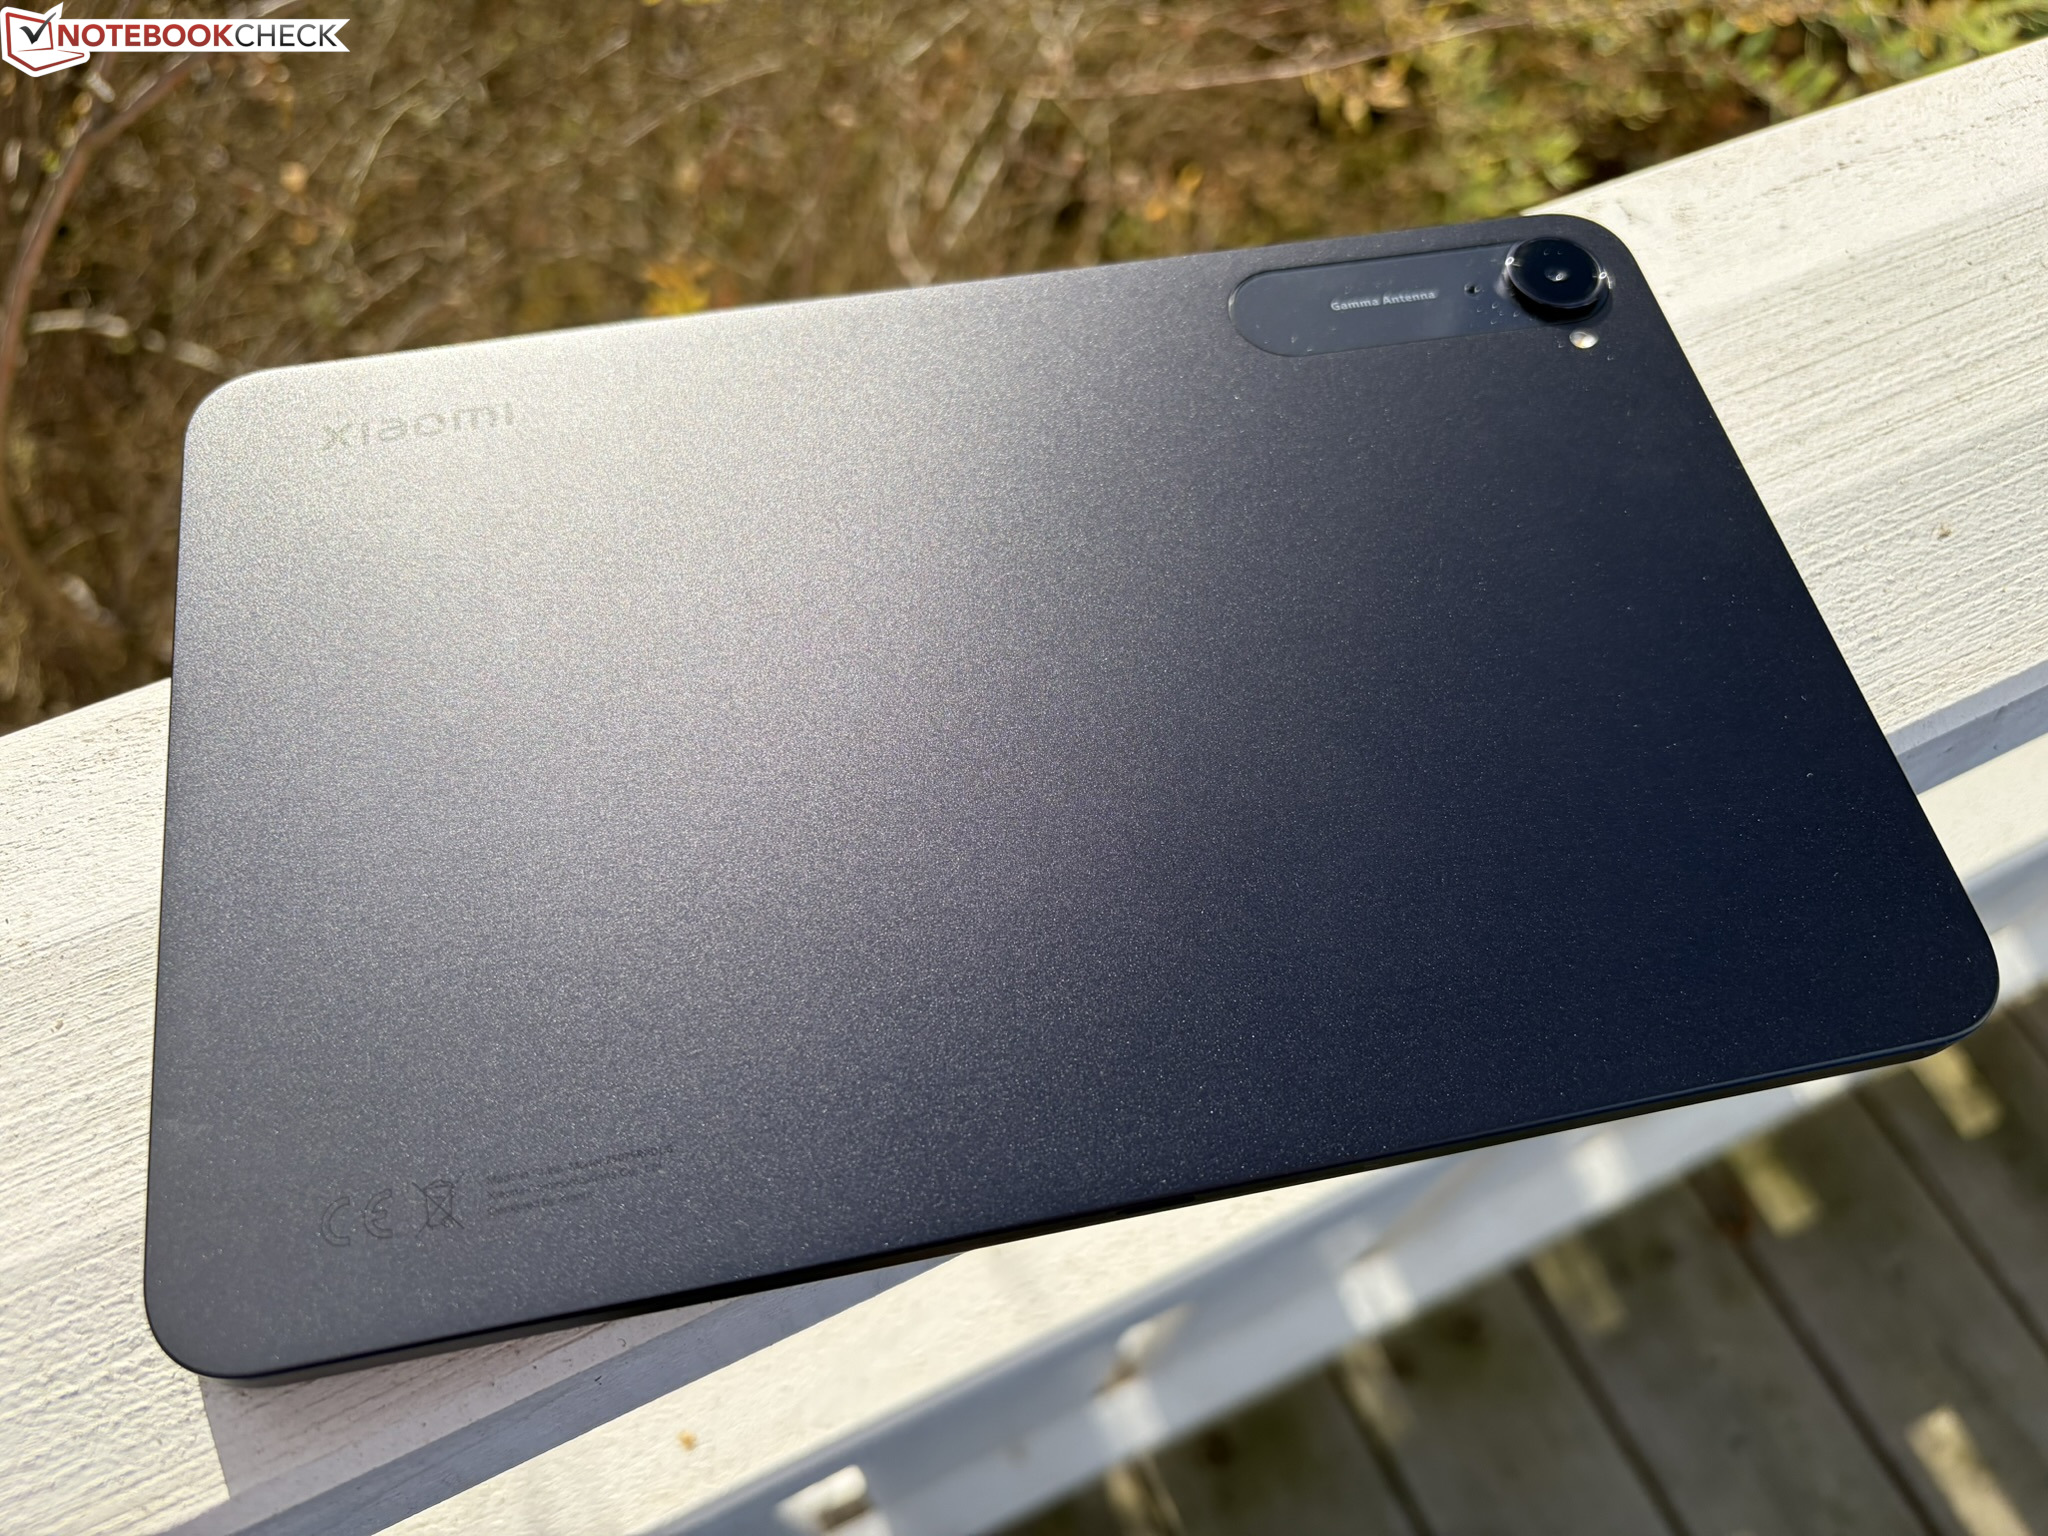
Pad Mini 采用了坚固耐用、做工精良的金属一体成型外壳,表面经过磨砂处理,几乎不会留下任何指纹。这款平板电脑没有 IP 防护等级,小米也没有提供显示屏玻璃防护等级的任何信息。

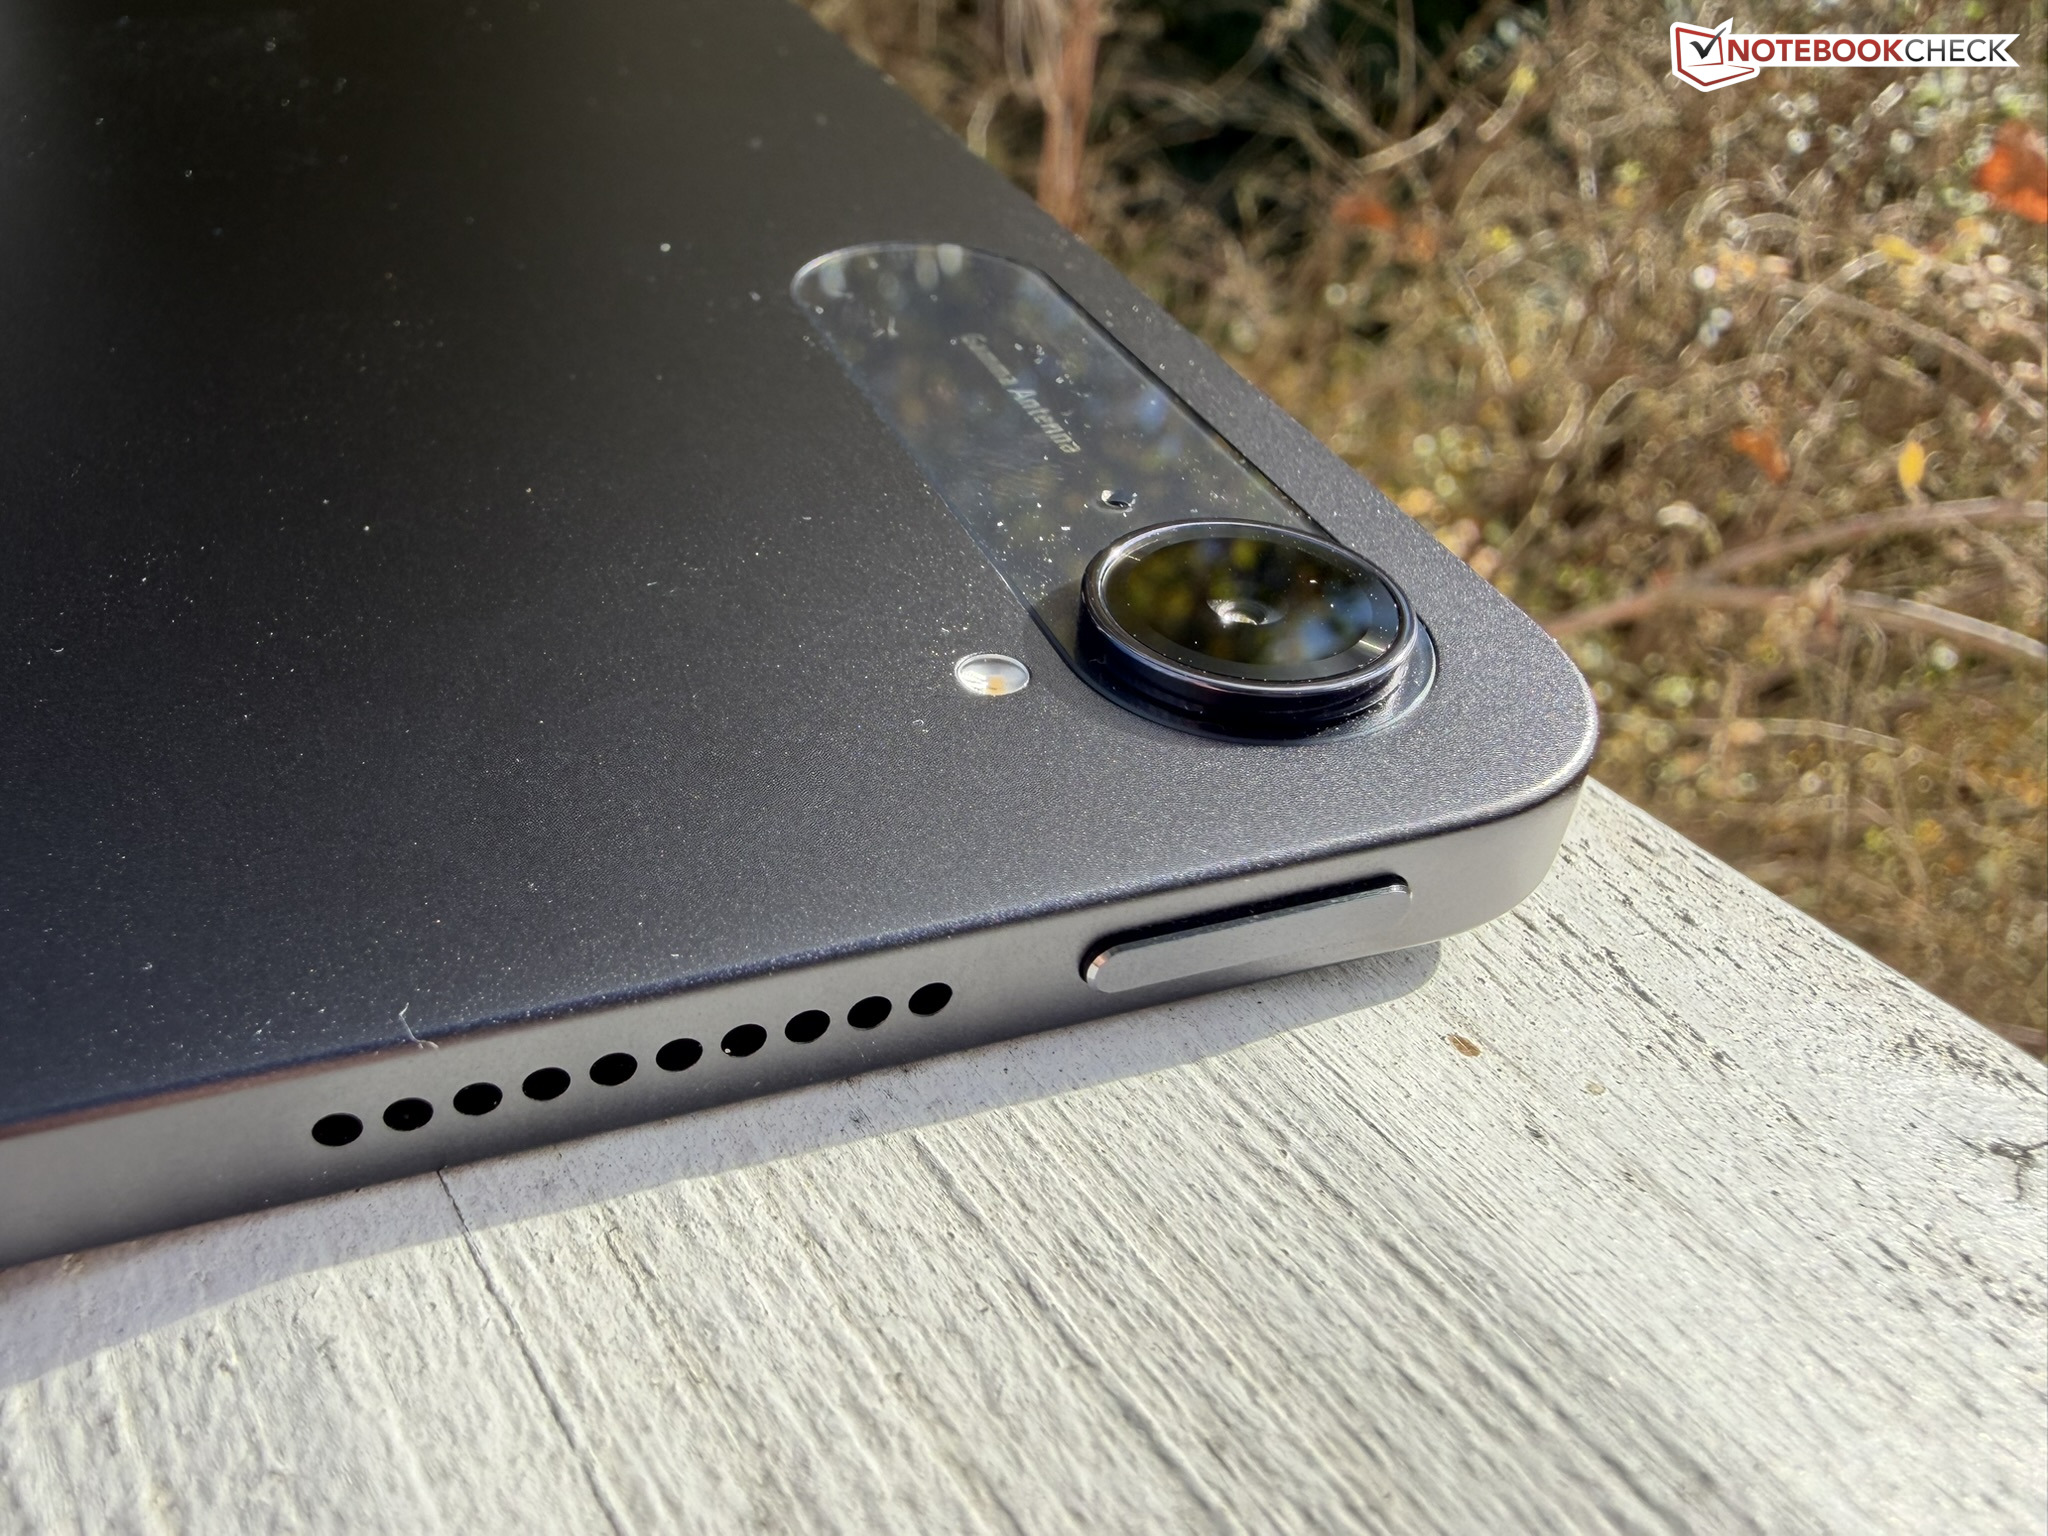
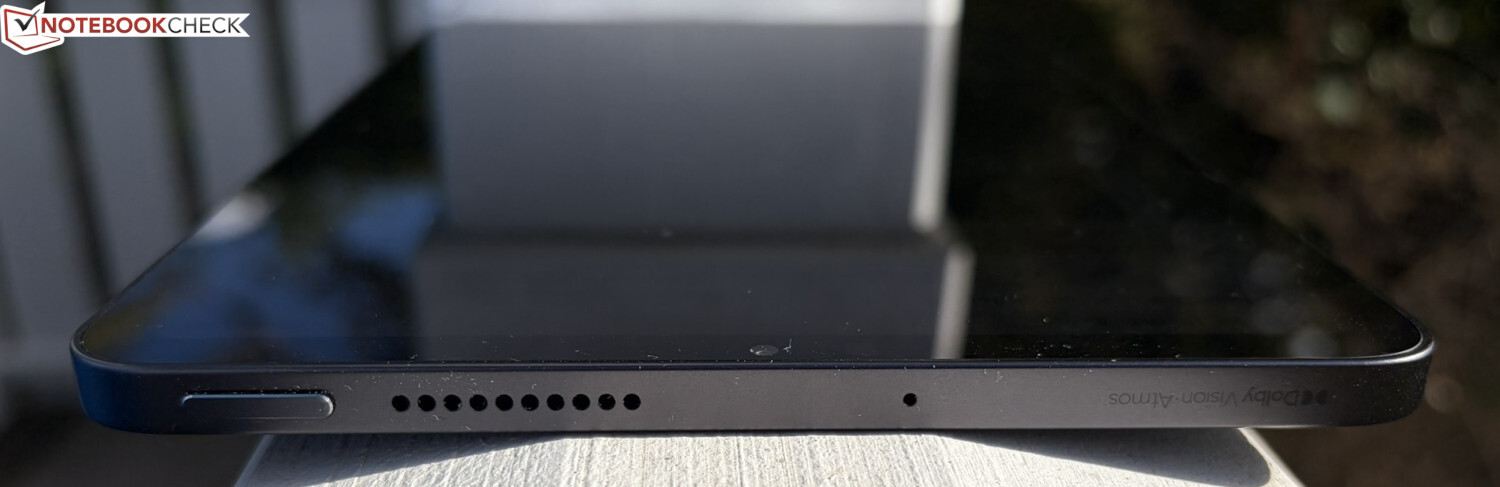
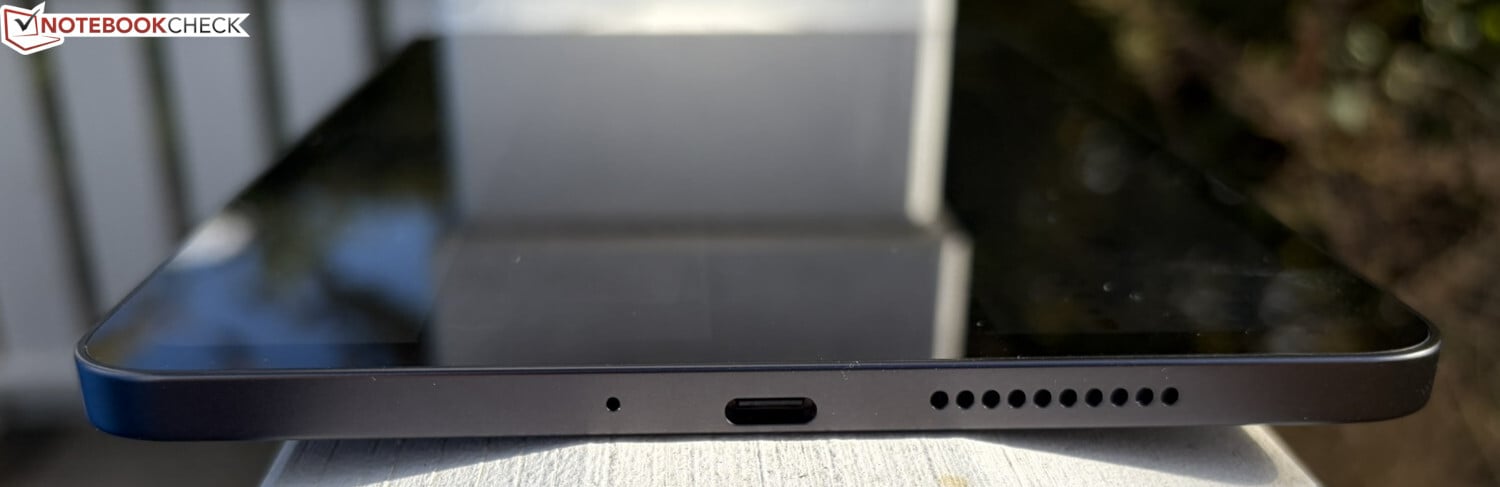
功能 - 配备 2x USB-C 接口的小米 Pad Mini
这款配置精良的小米平板电脑有两个 USB-C 端口,可用于多种用途。例如,外接耳机可以连接到一个端口,而游戏控制器则可以连接到第二个 USB 端口。
底部的 USB-C 端口支持 USB 3.2 Gen.1,除了快速数据传输外,还支持向显示器输出图像。第二个 USB-C 端口位于平板电脑的右侧,运行速度为 USB 2.0。
WiFi Direct 和 Miracast 可用于无线数据传输。小米 Pad Mini 没有音频插孔和 microSD 插槽。
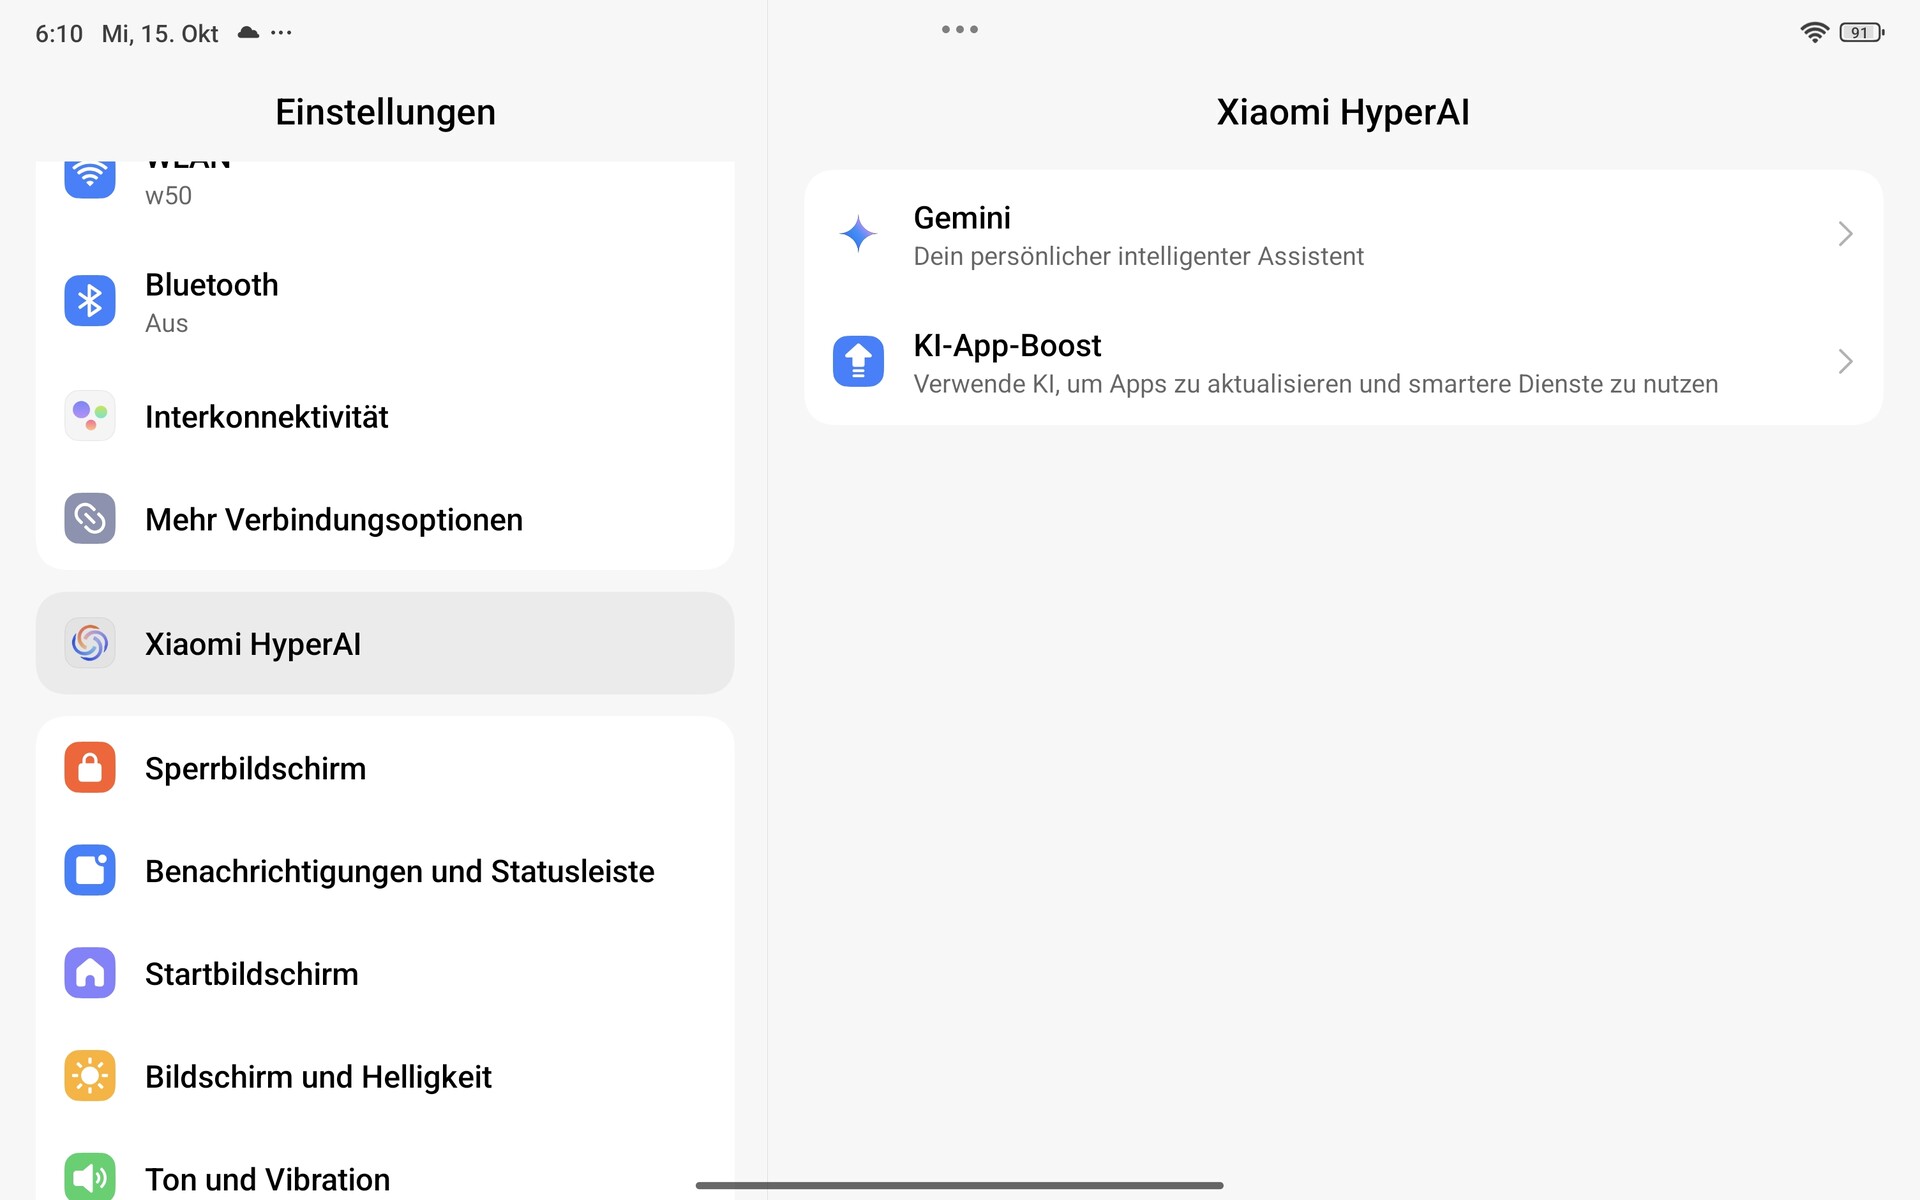
软件 -Android 15,更新至 2028 年
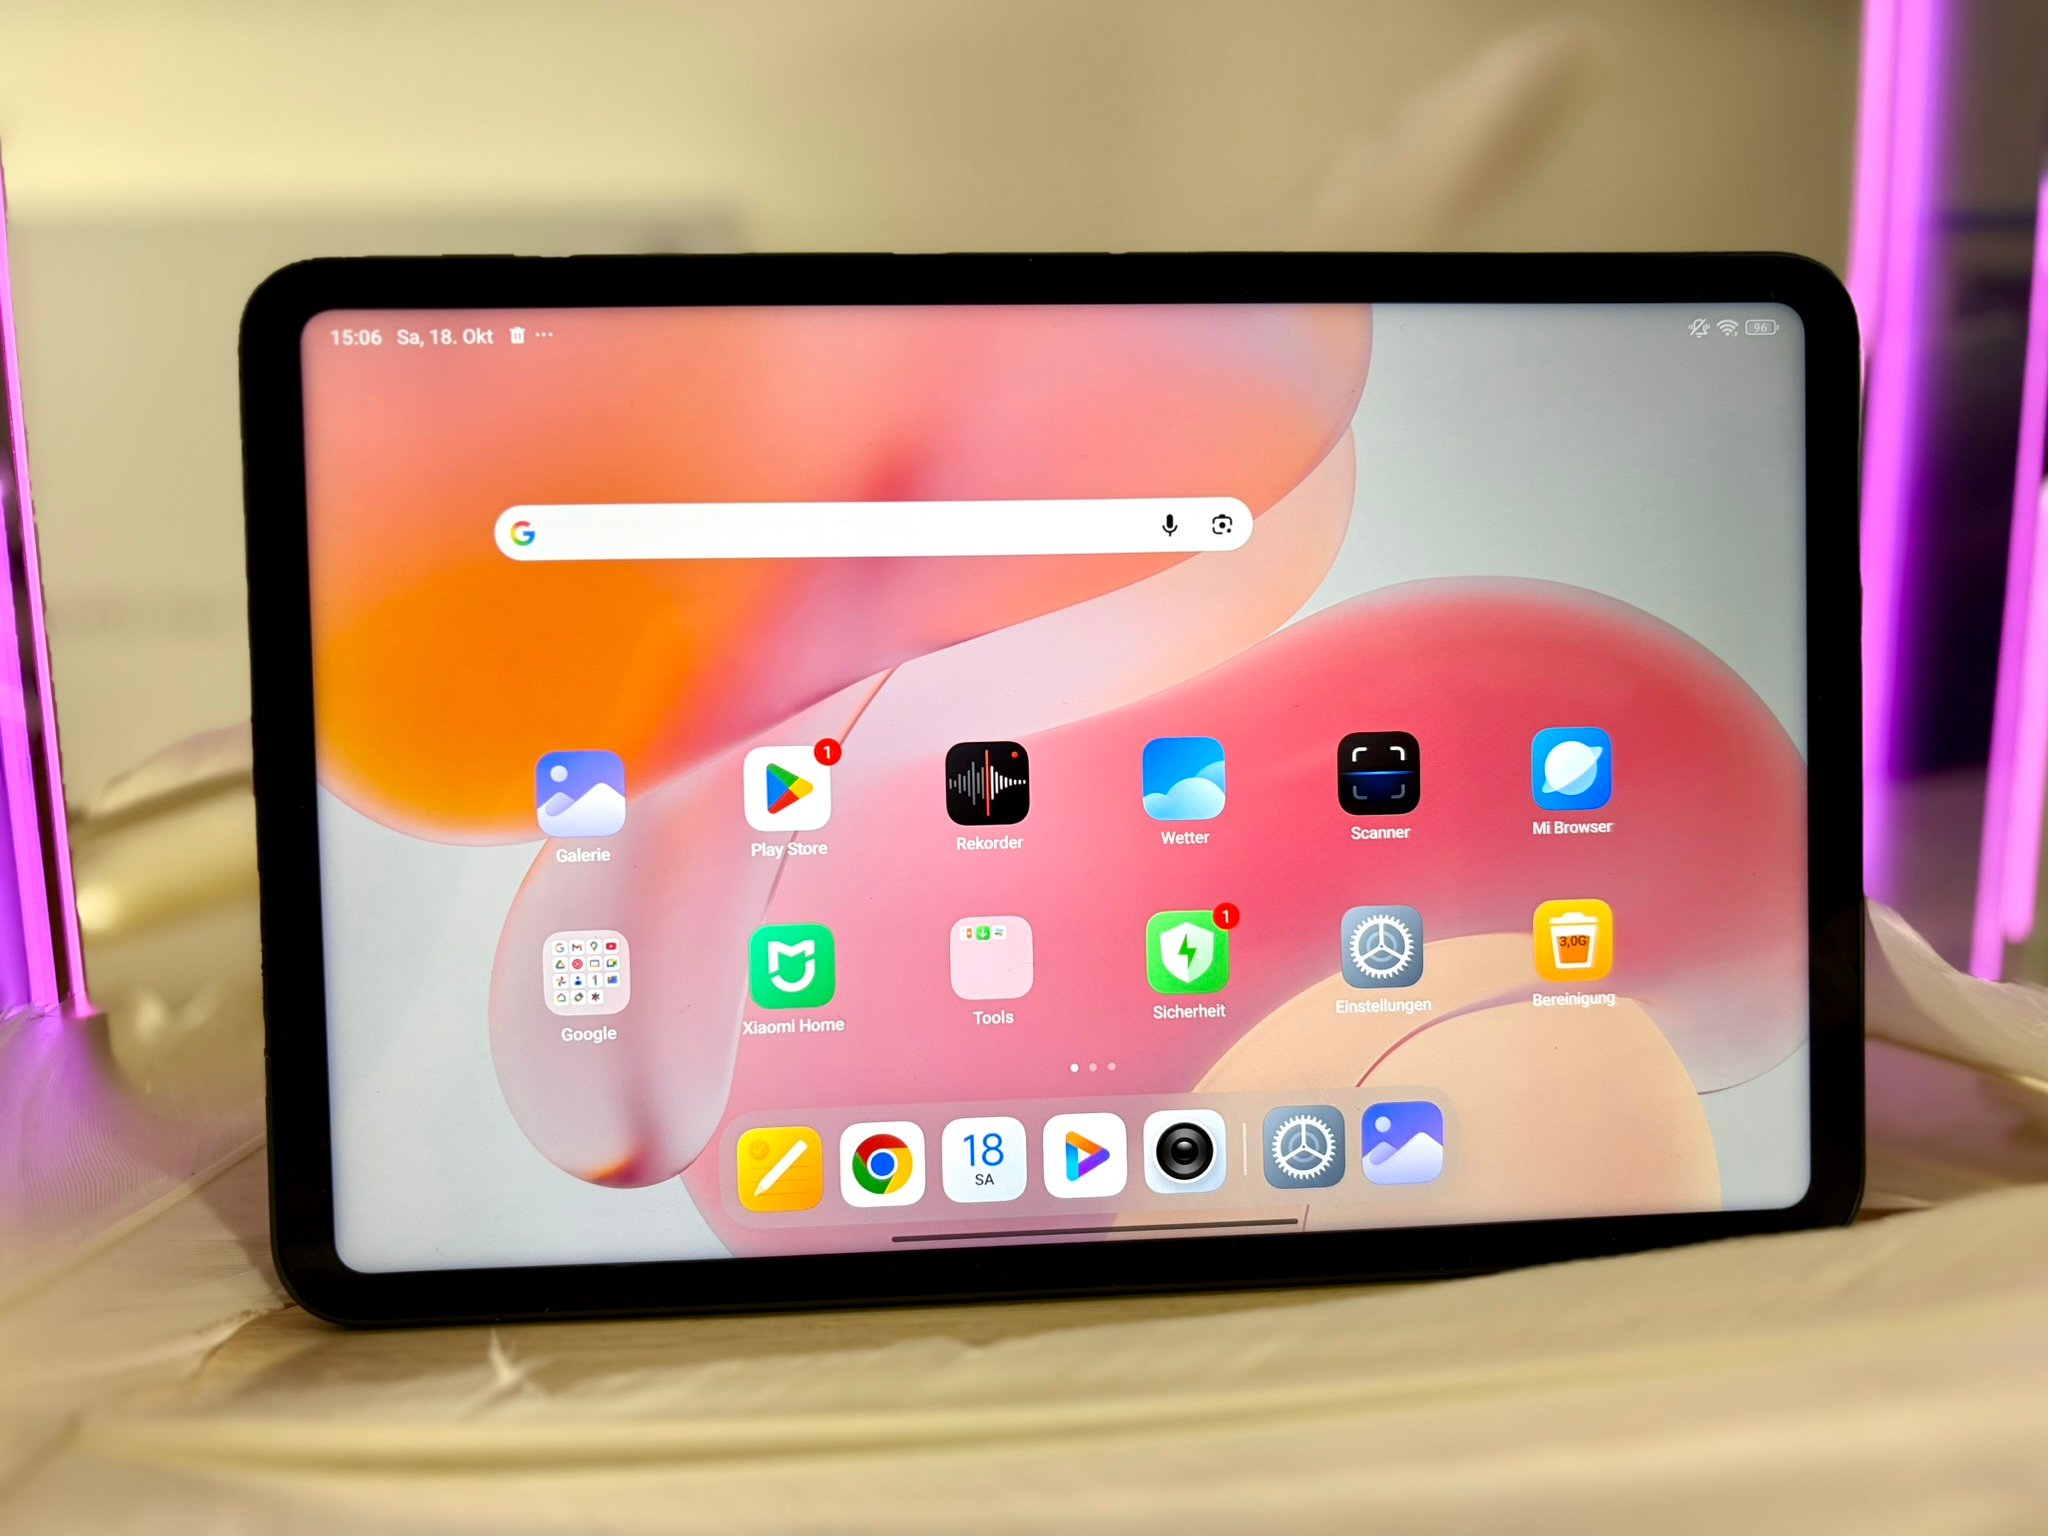
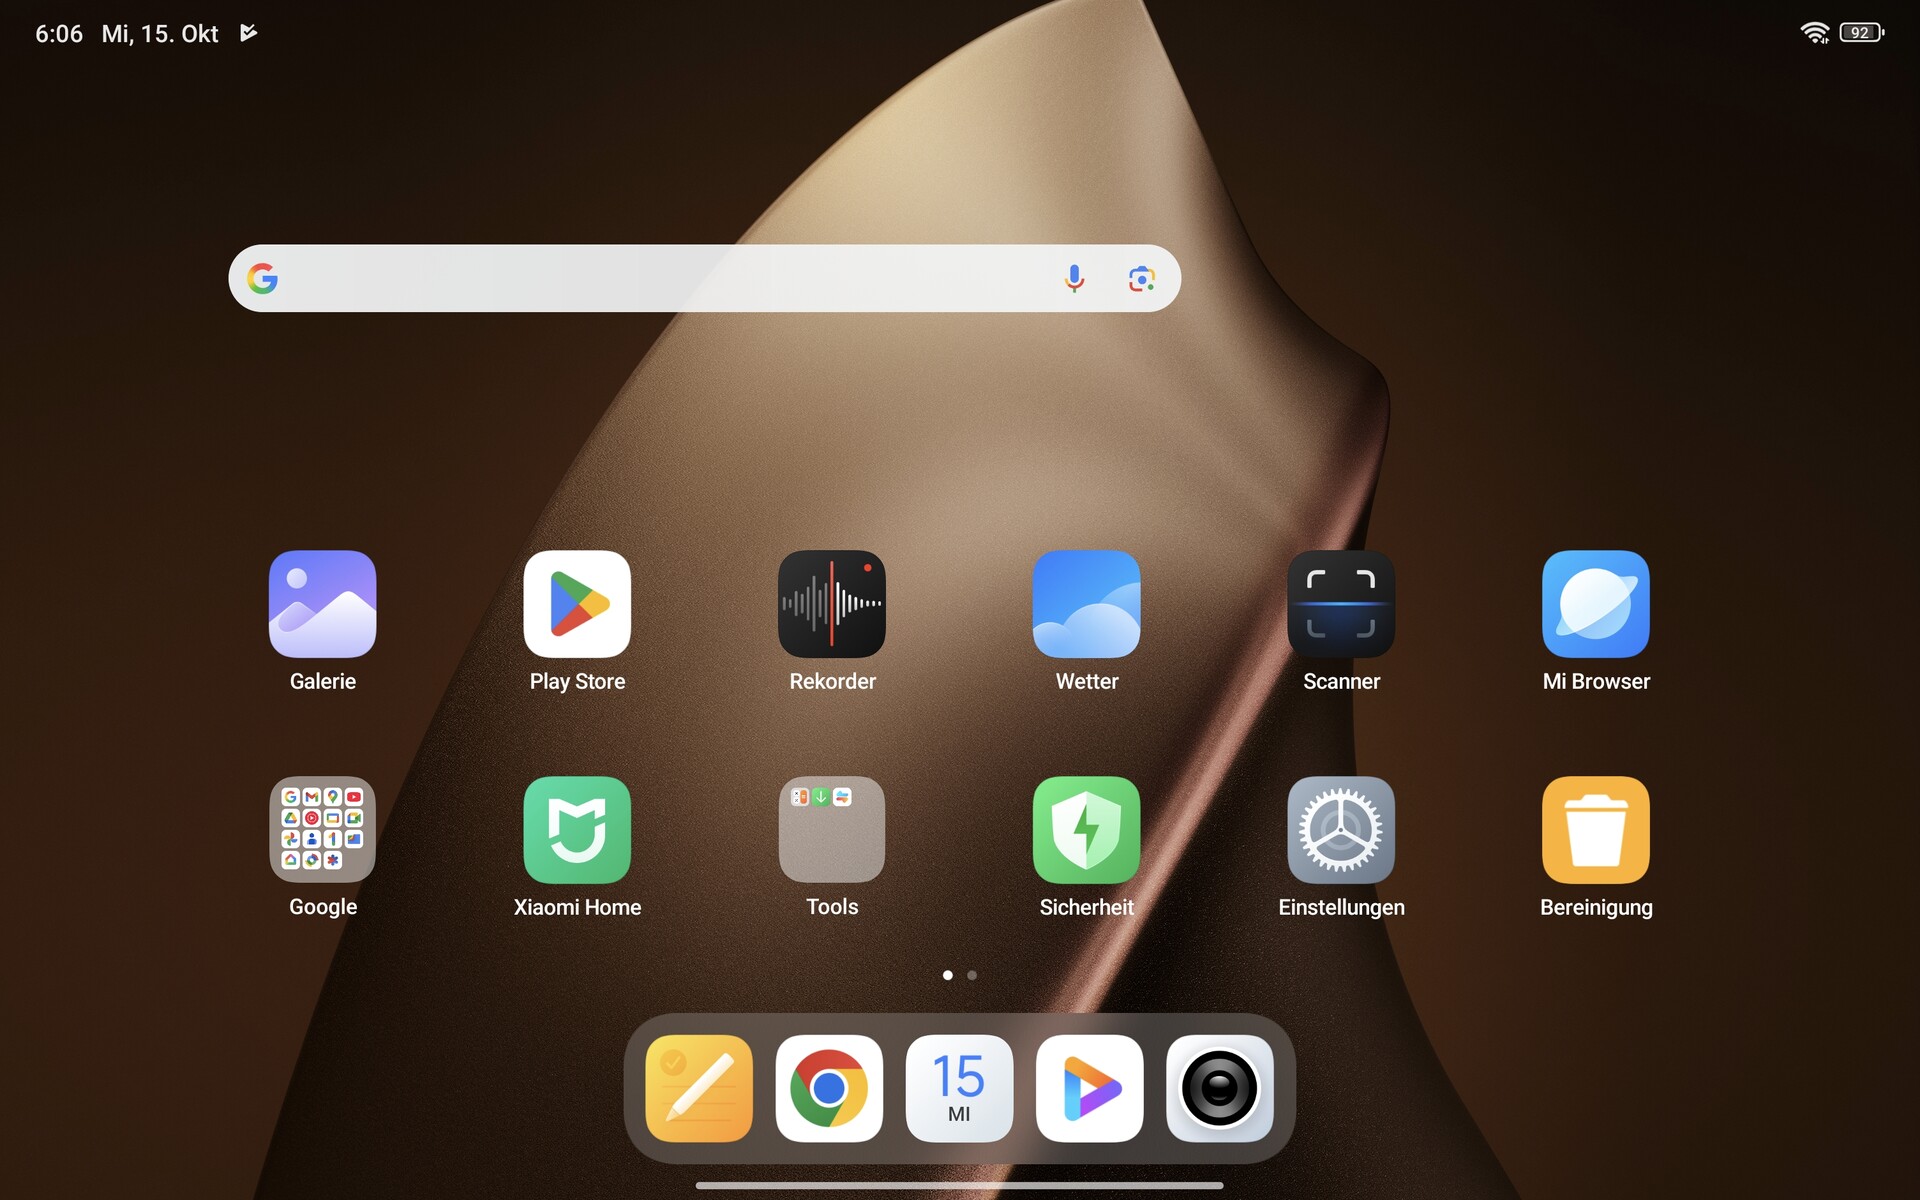
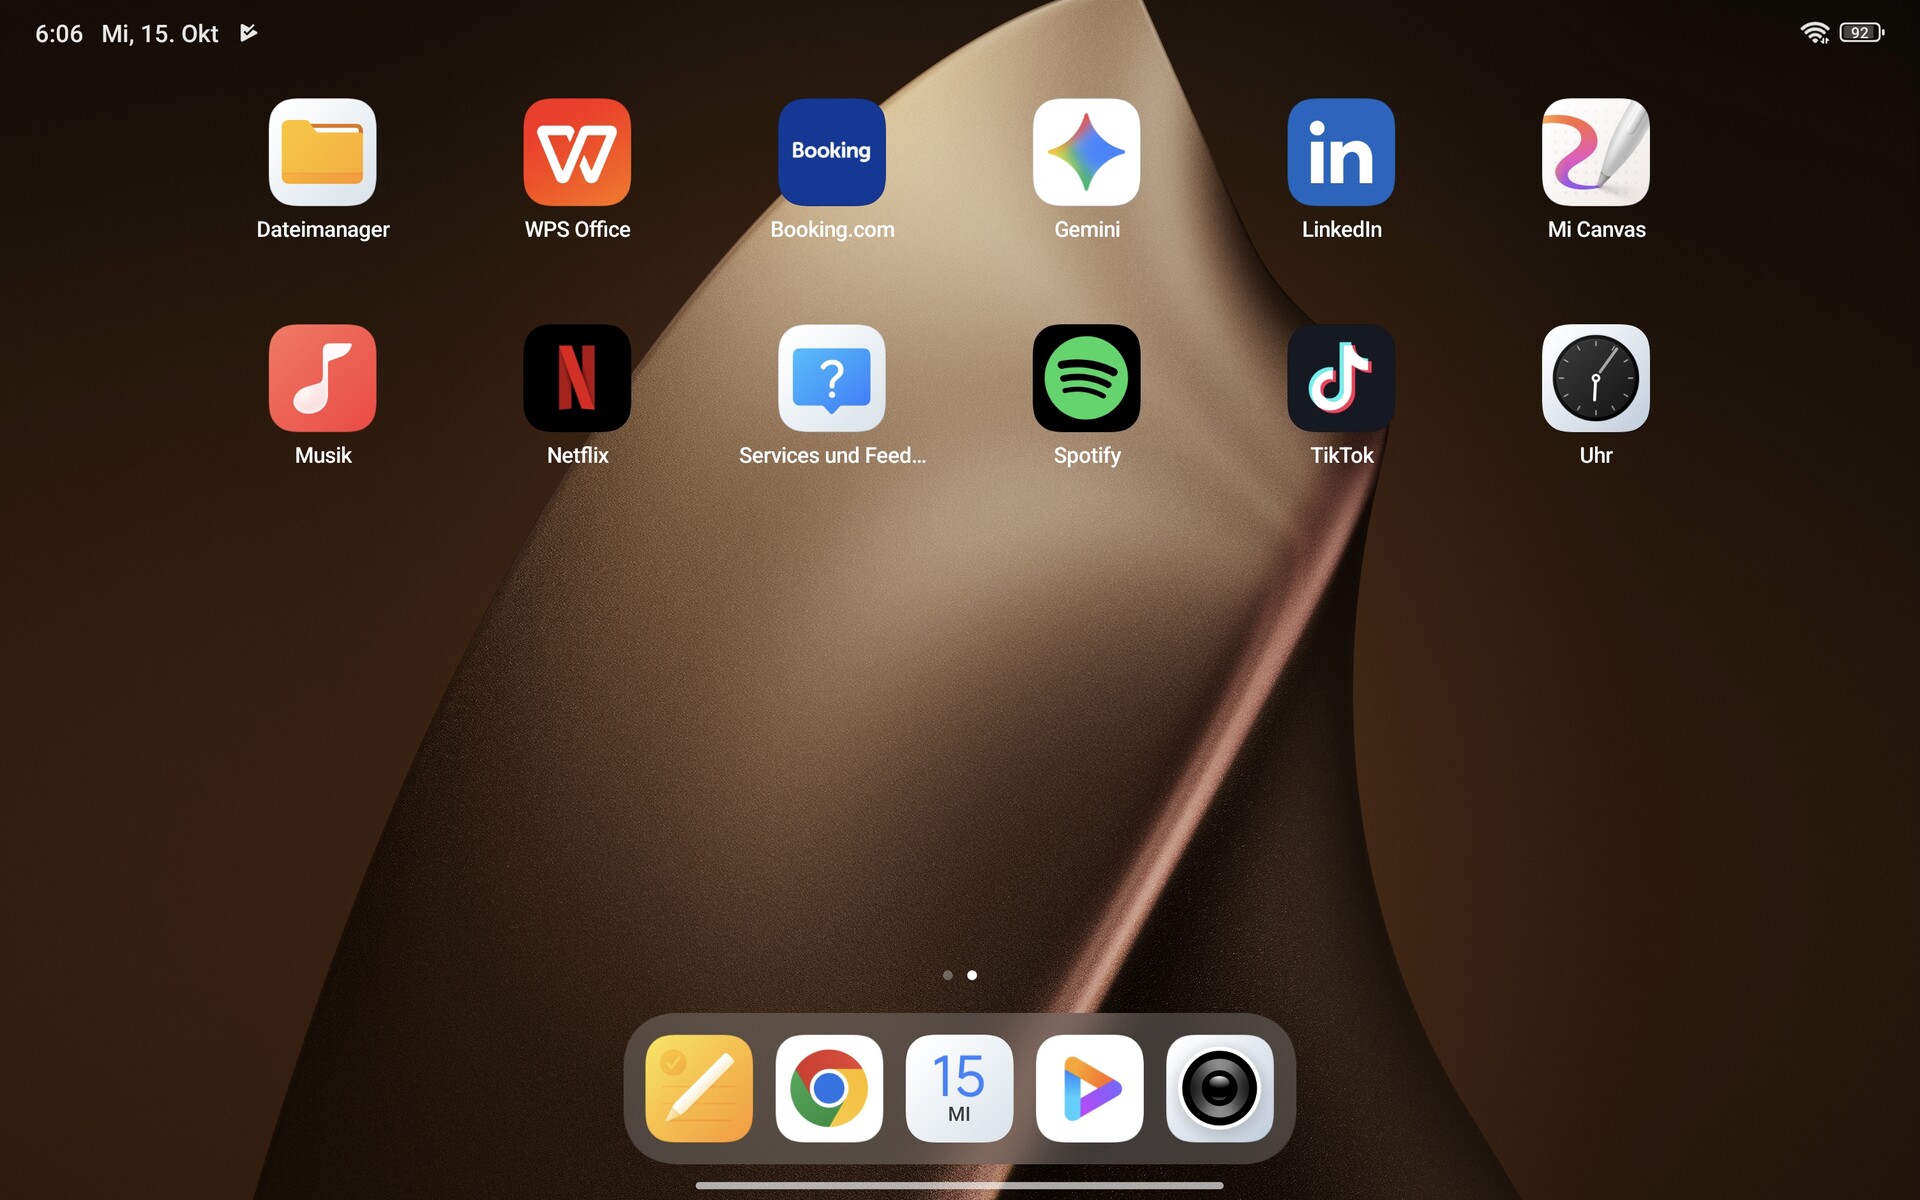
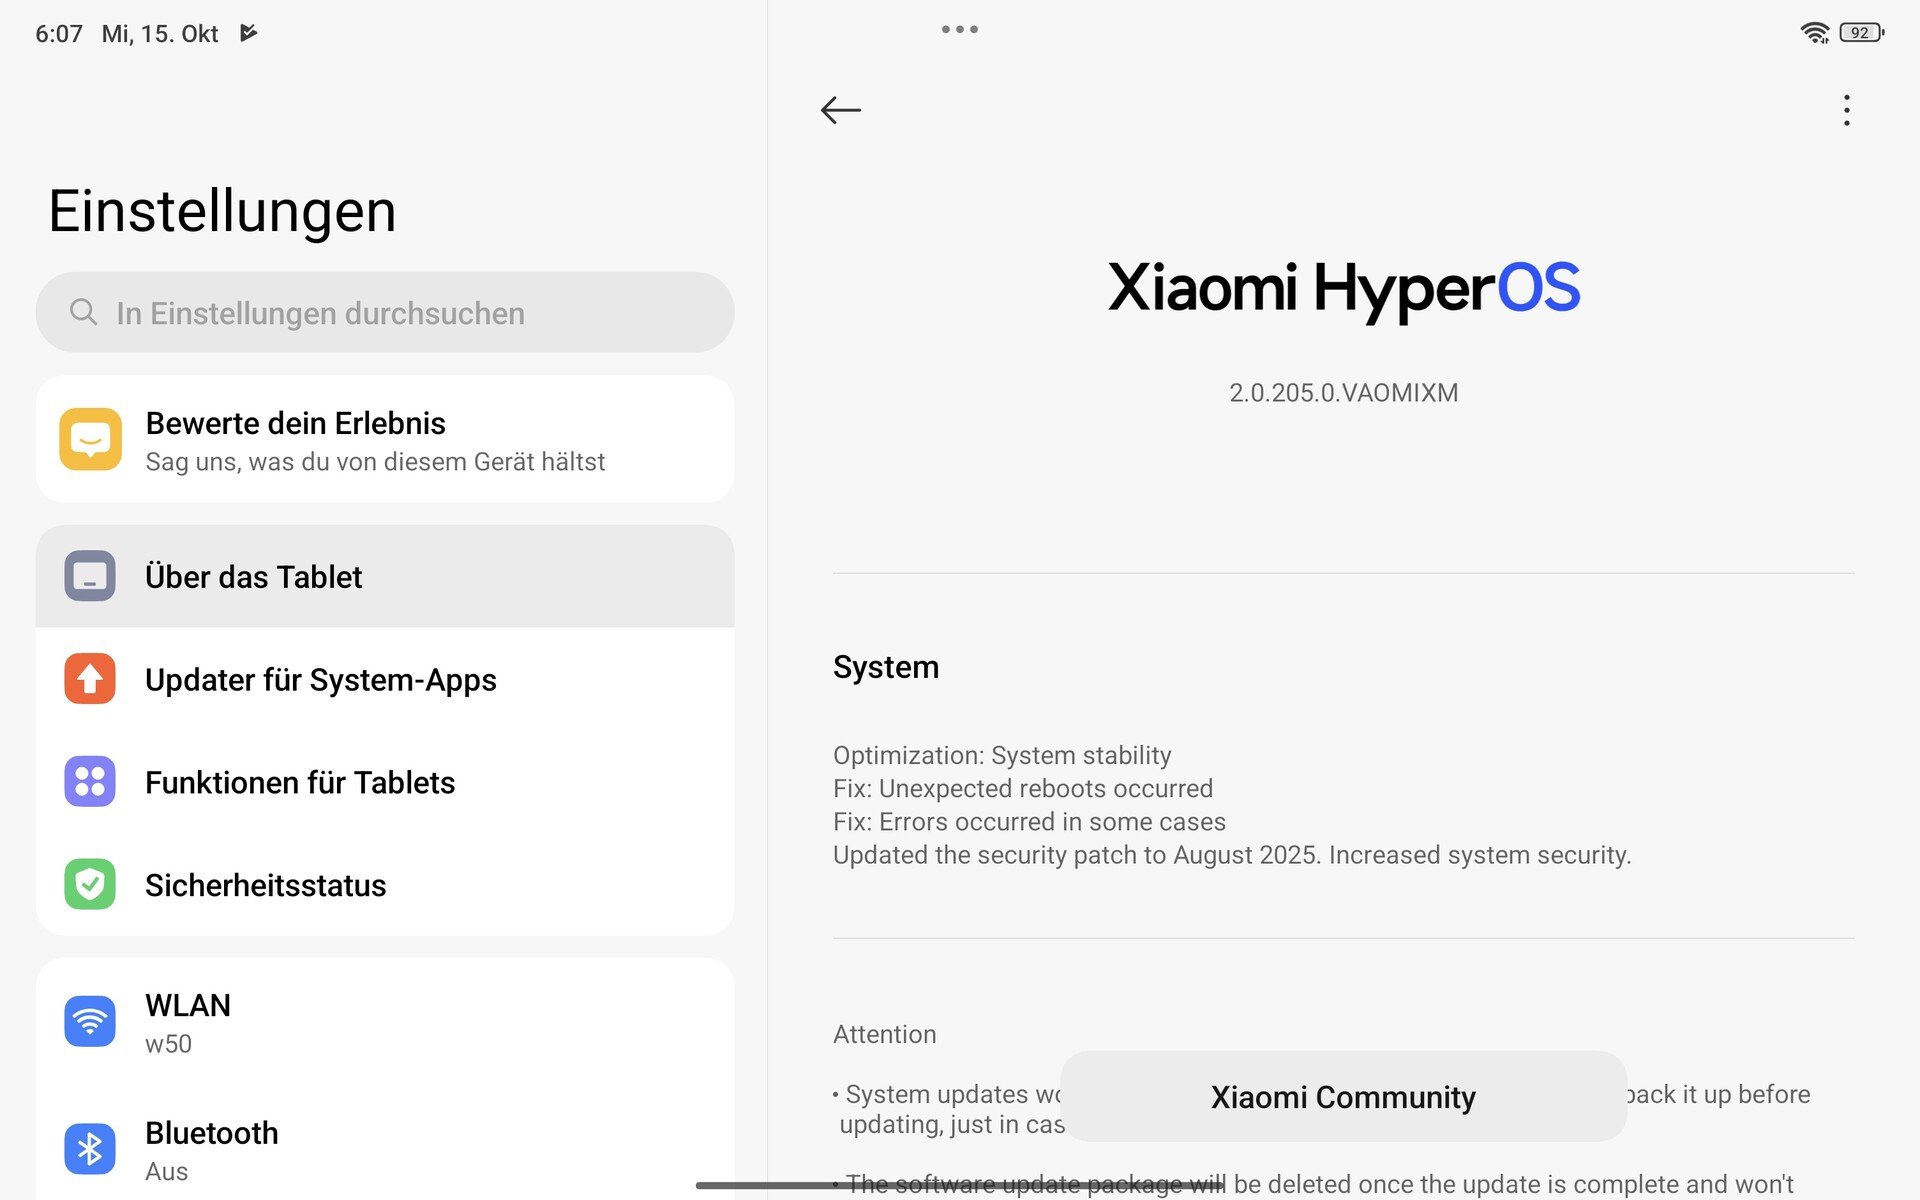
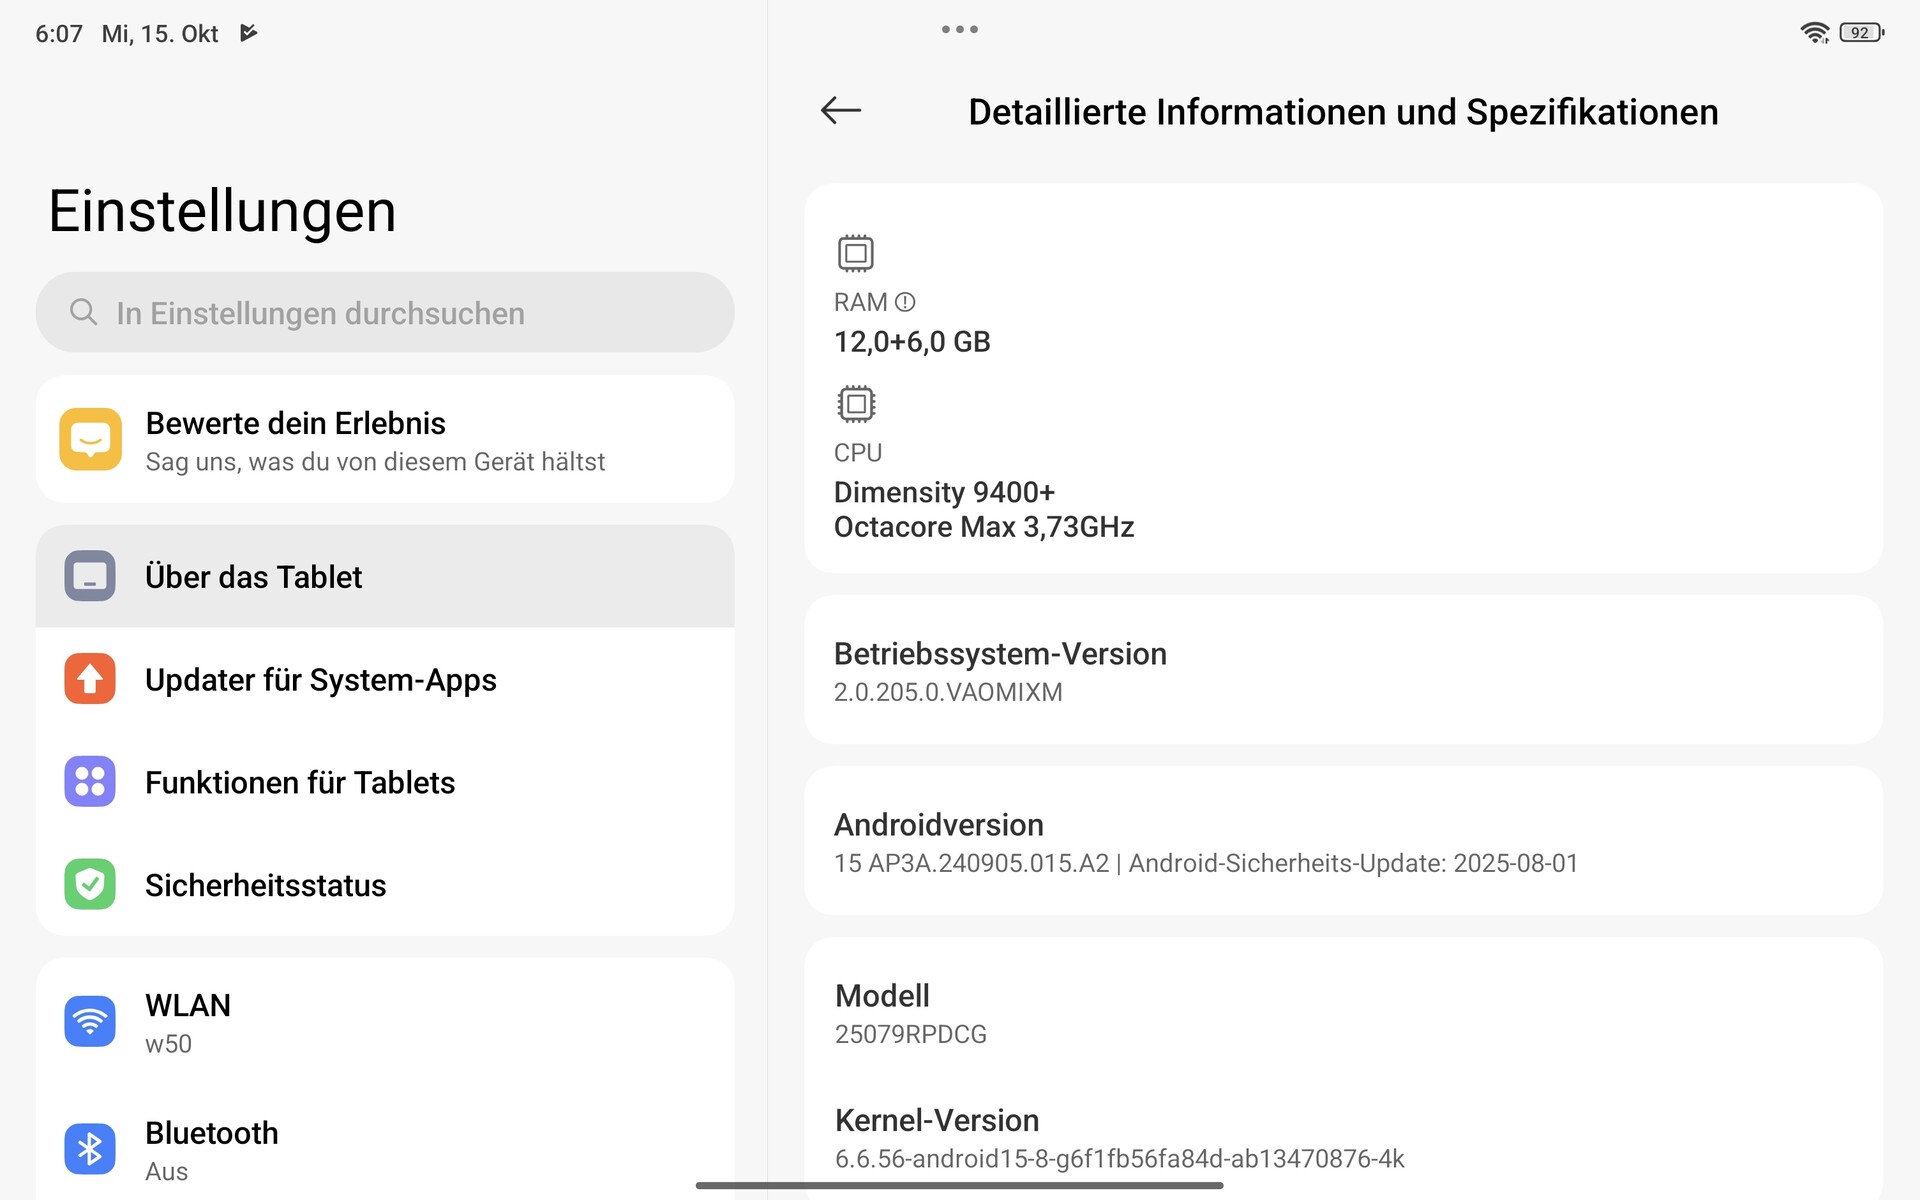
小米 Pad Mini 运行Android 15,配备小米 HyperOS 2.0 用户界面。根据小米信任中心,Pad Mini 的操作系统将升级至Android 17。此外,它还将获得为期 3 年的安全更新,直至 2028 年 9 月。后者将每三个月发布一次。在 10 月中旬进行测试时,该平板电脑运行的是 8 月份的Android 安全补丁,因此是最新的。

可持续性
小米 Pad Mini 采用无塑料包装。制造商没有提供任何有关平板电脑中可回收材料比例的信息。在其网站上,小米提供了以旧换新计划。以旧换新计划。
通信和全球导航卫星系统 - 配备 WiFi 7,但没有移动通信和全球定位系统
小米 Pad Mini 支持 WiFi 7,但不支持 6 GHz 频段。使用我们的参考路由器--华硕 ROG Rapture GT-AXE11000,数据传输仍然快速稳定,最高可达 989 MBit/s。
有趣的是,中国版平板电脑 红米 K Pad在这项测试中取得了更好的成绩,尽管规格完全相同。它在传输数据时与 Pad Mini 大致相当,但在接收测试中却达到了 1657 MBit/s。
Pad Mini 没有 GPS 模块。小米也没有提供移动版平板电脑。
| Networking | |
| Xiaomi Pad Mini | |
| iperf3 transmit AXE11000 | |
| iperf3 receive AXE11000 | |
| Apple iPad Mini 7 (2024) | |
| iperf3 transmit AXE11000 | |
| iperf3 receive AXE11000 | |
| iperf3 transmit AXE11000 6GHz | |
| iperf3 receive AXE11000 6GHz | |
| Alldocube iPlay 70 Mini Ultra | |
| iperf3 transmit AXE11000 | |
| iperf3 receive AXE11000 | |
| Lenovo Legion Tab TB321FU | |
| iperf3 transmit AXE11000 6GHz | |
| iperf3 receive AXE11000 6GHz | |
| Samsung Galaxy Tab A9 | |
| iperf3 transmit AXE11000 | |
| iperf3 receive AXE11000 | |
| Average 802.11 a/b/g/n/ac/ax/be | |
| iperf3 transmit AXE11000 | |
| iperf3 receive AXE11000 | |
| iperf3 transmit AXE11000 6GHz | |
| iperf3 receive AXE11000 6GHz | |
| Average of class Tablet | |
| iperf3 transmit AXE11000 | |
| iperf3 receive AXE11000 | |
| iperf3 transmit AXE11000 6GHz | |
| iperf3 receive AXE11000 6GHz | |
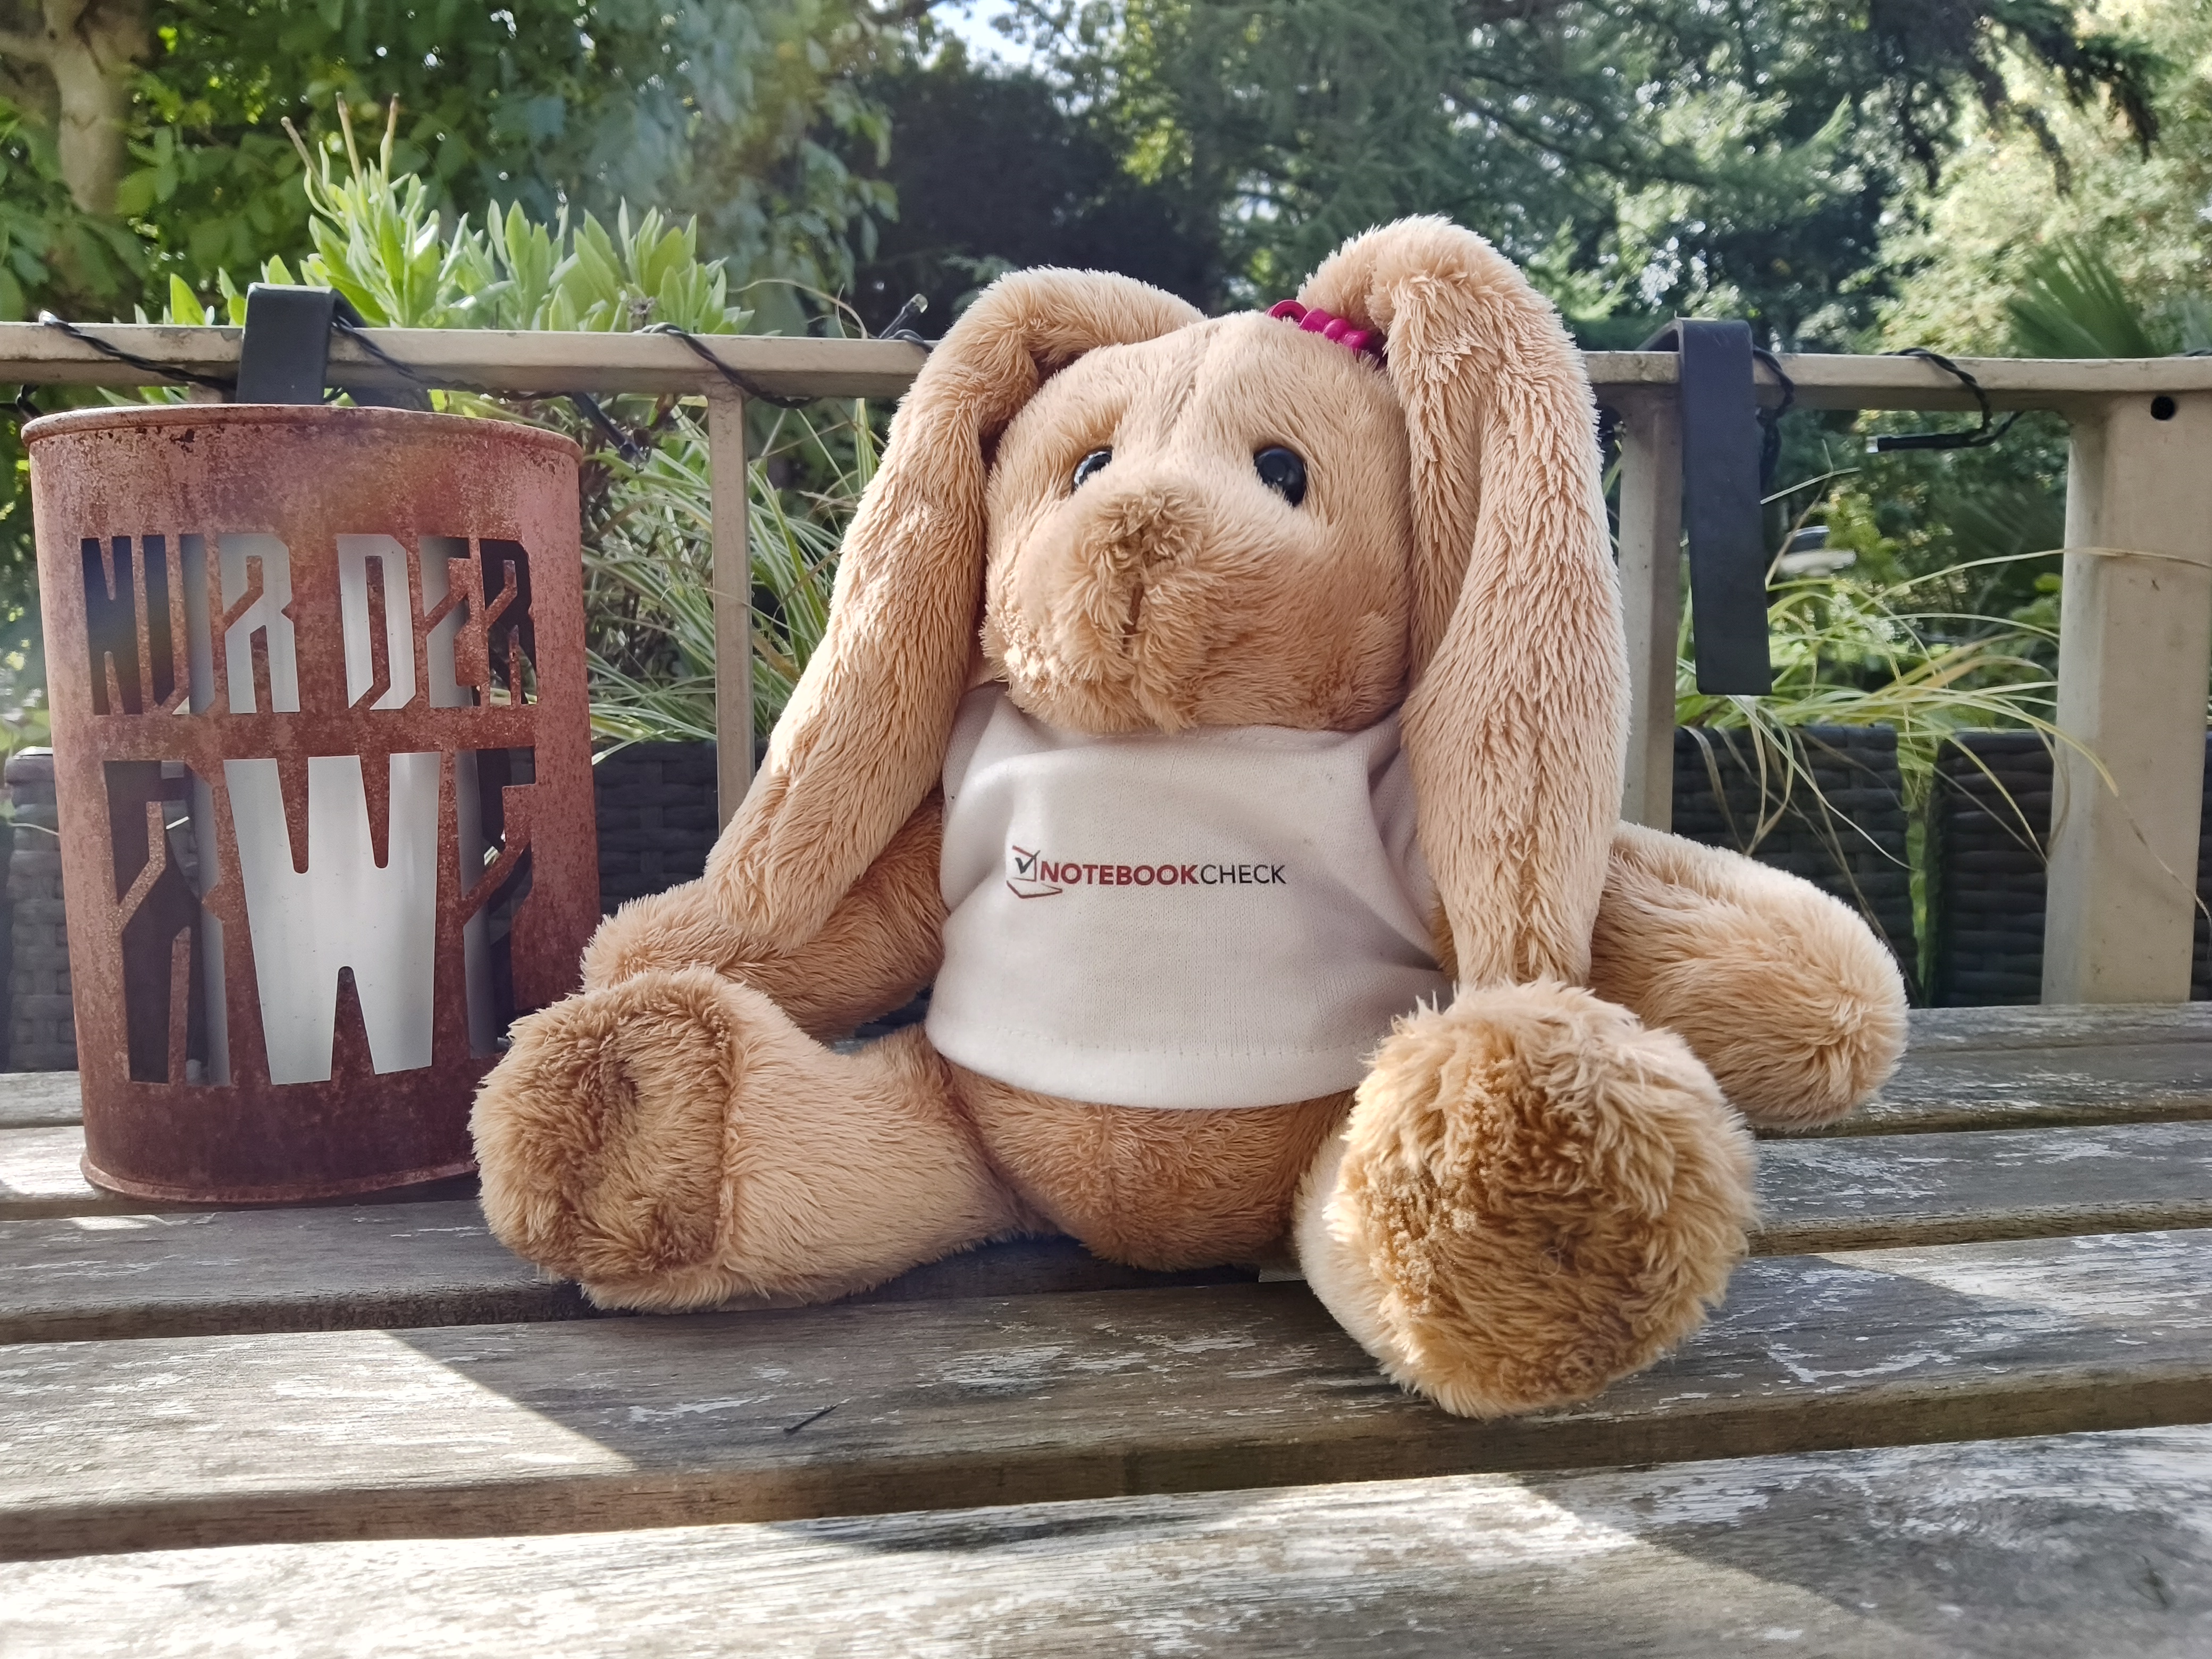
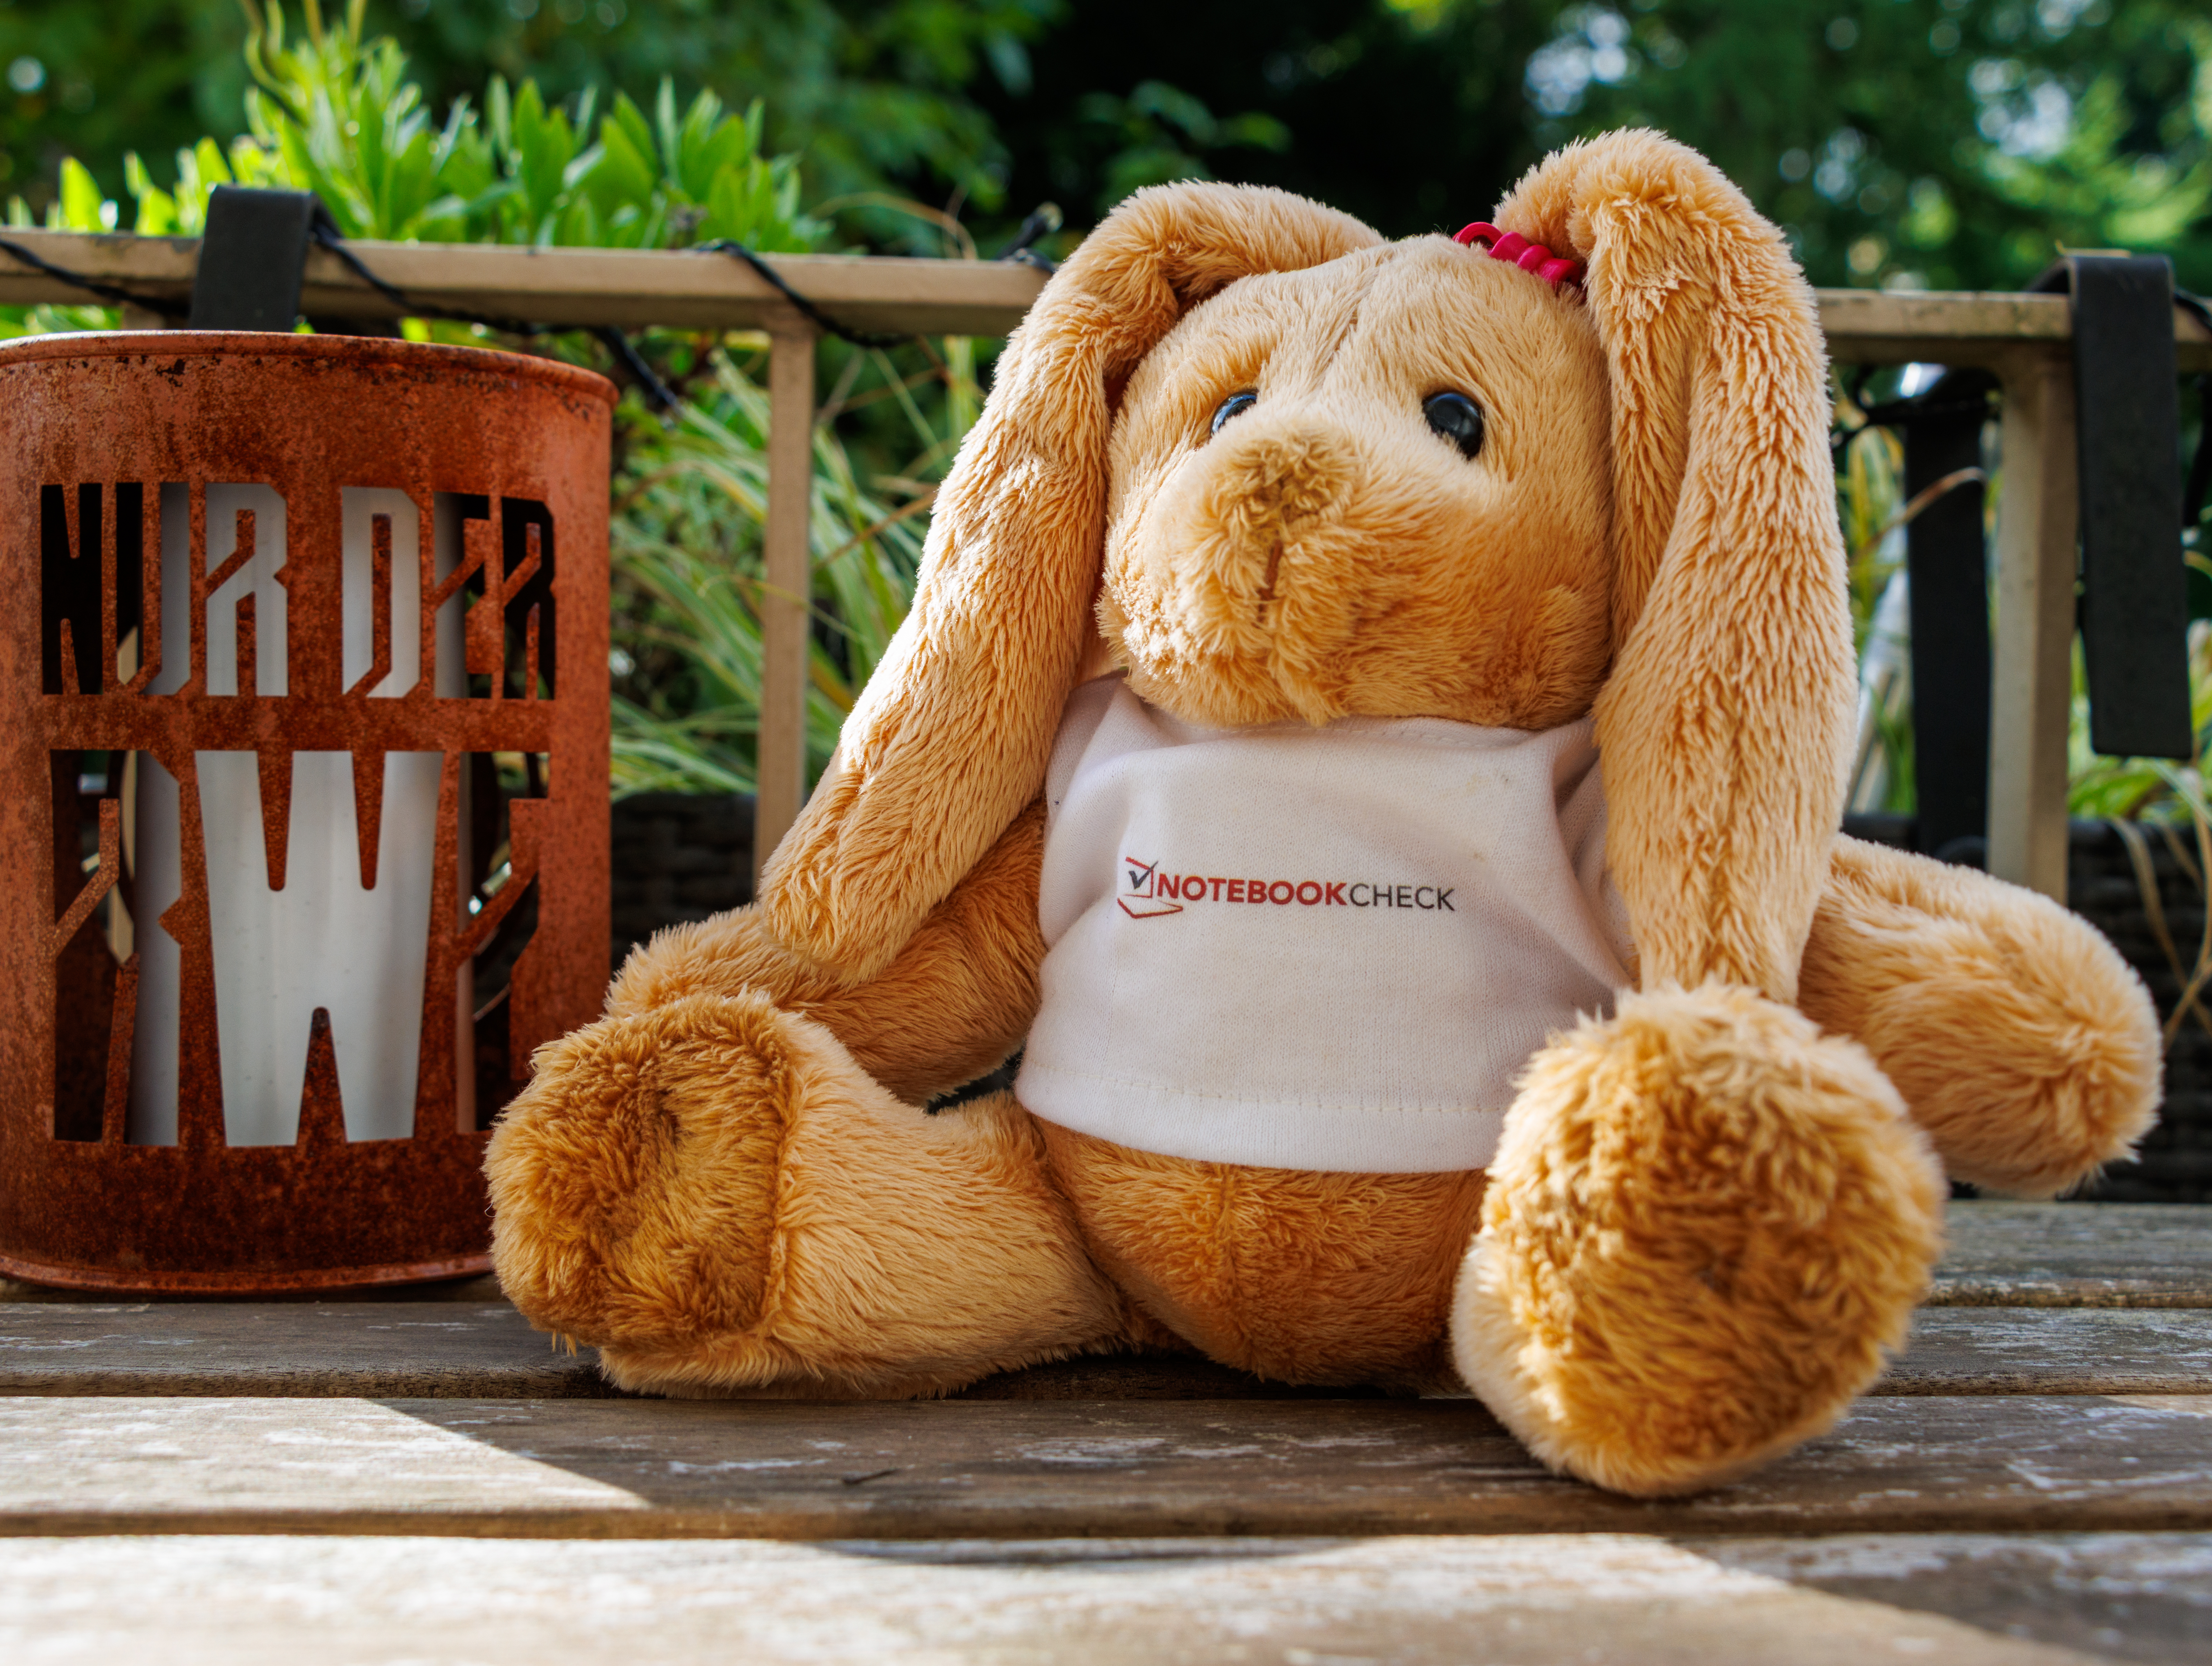
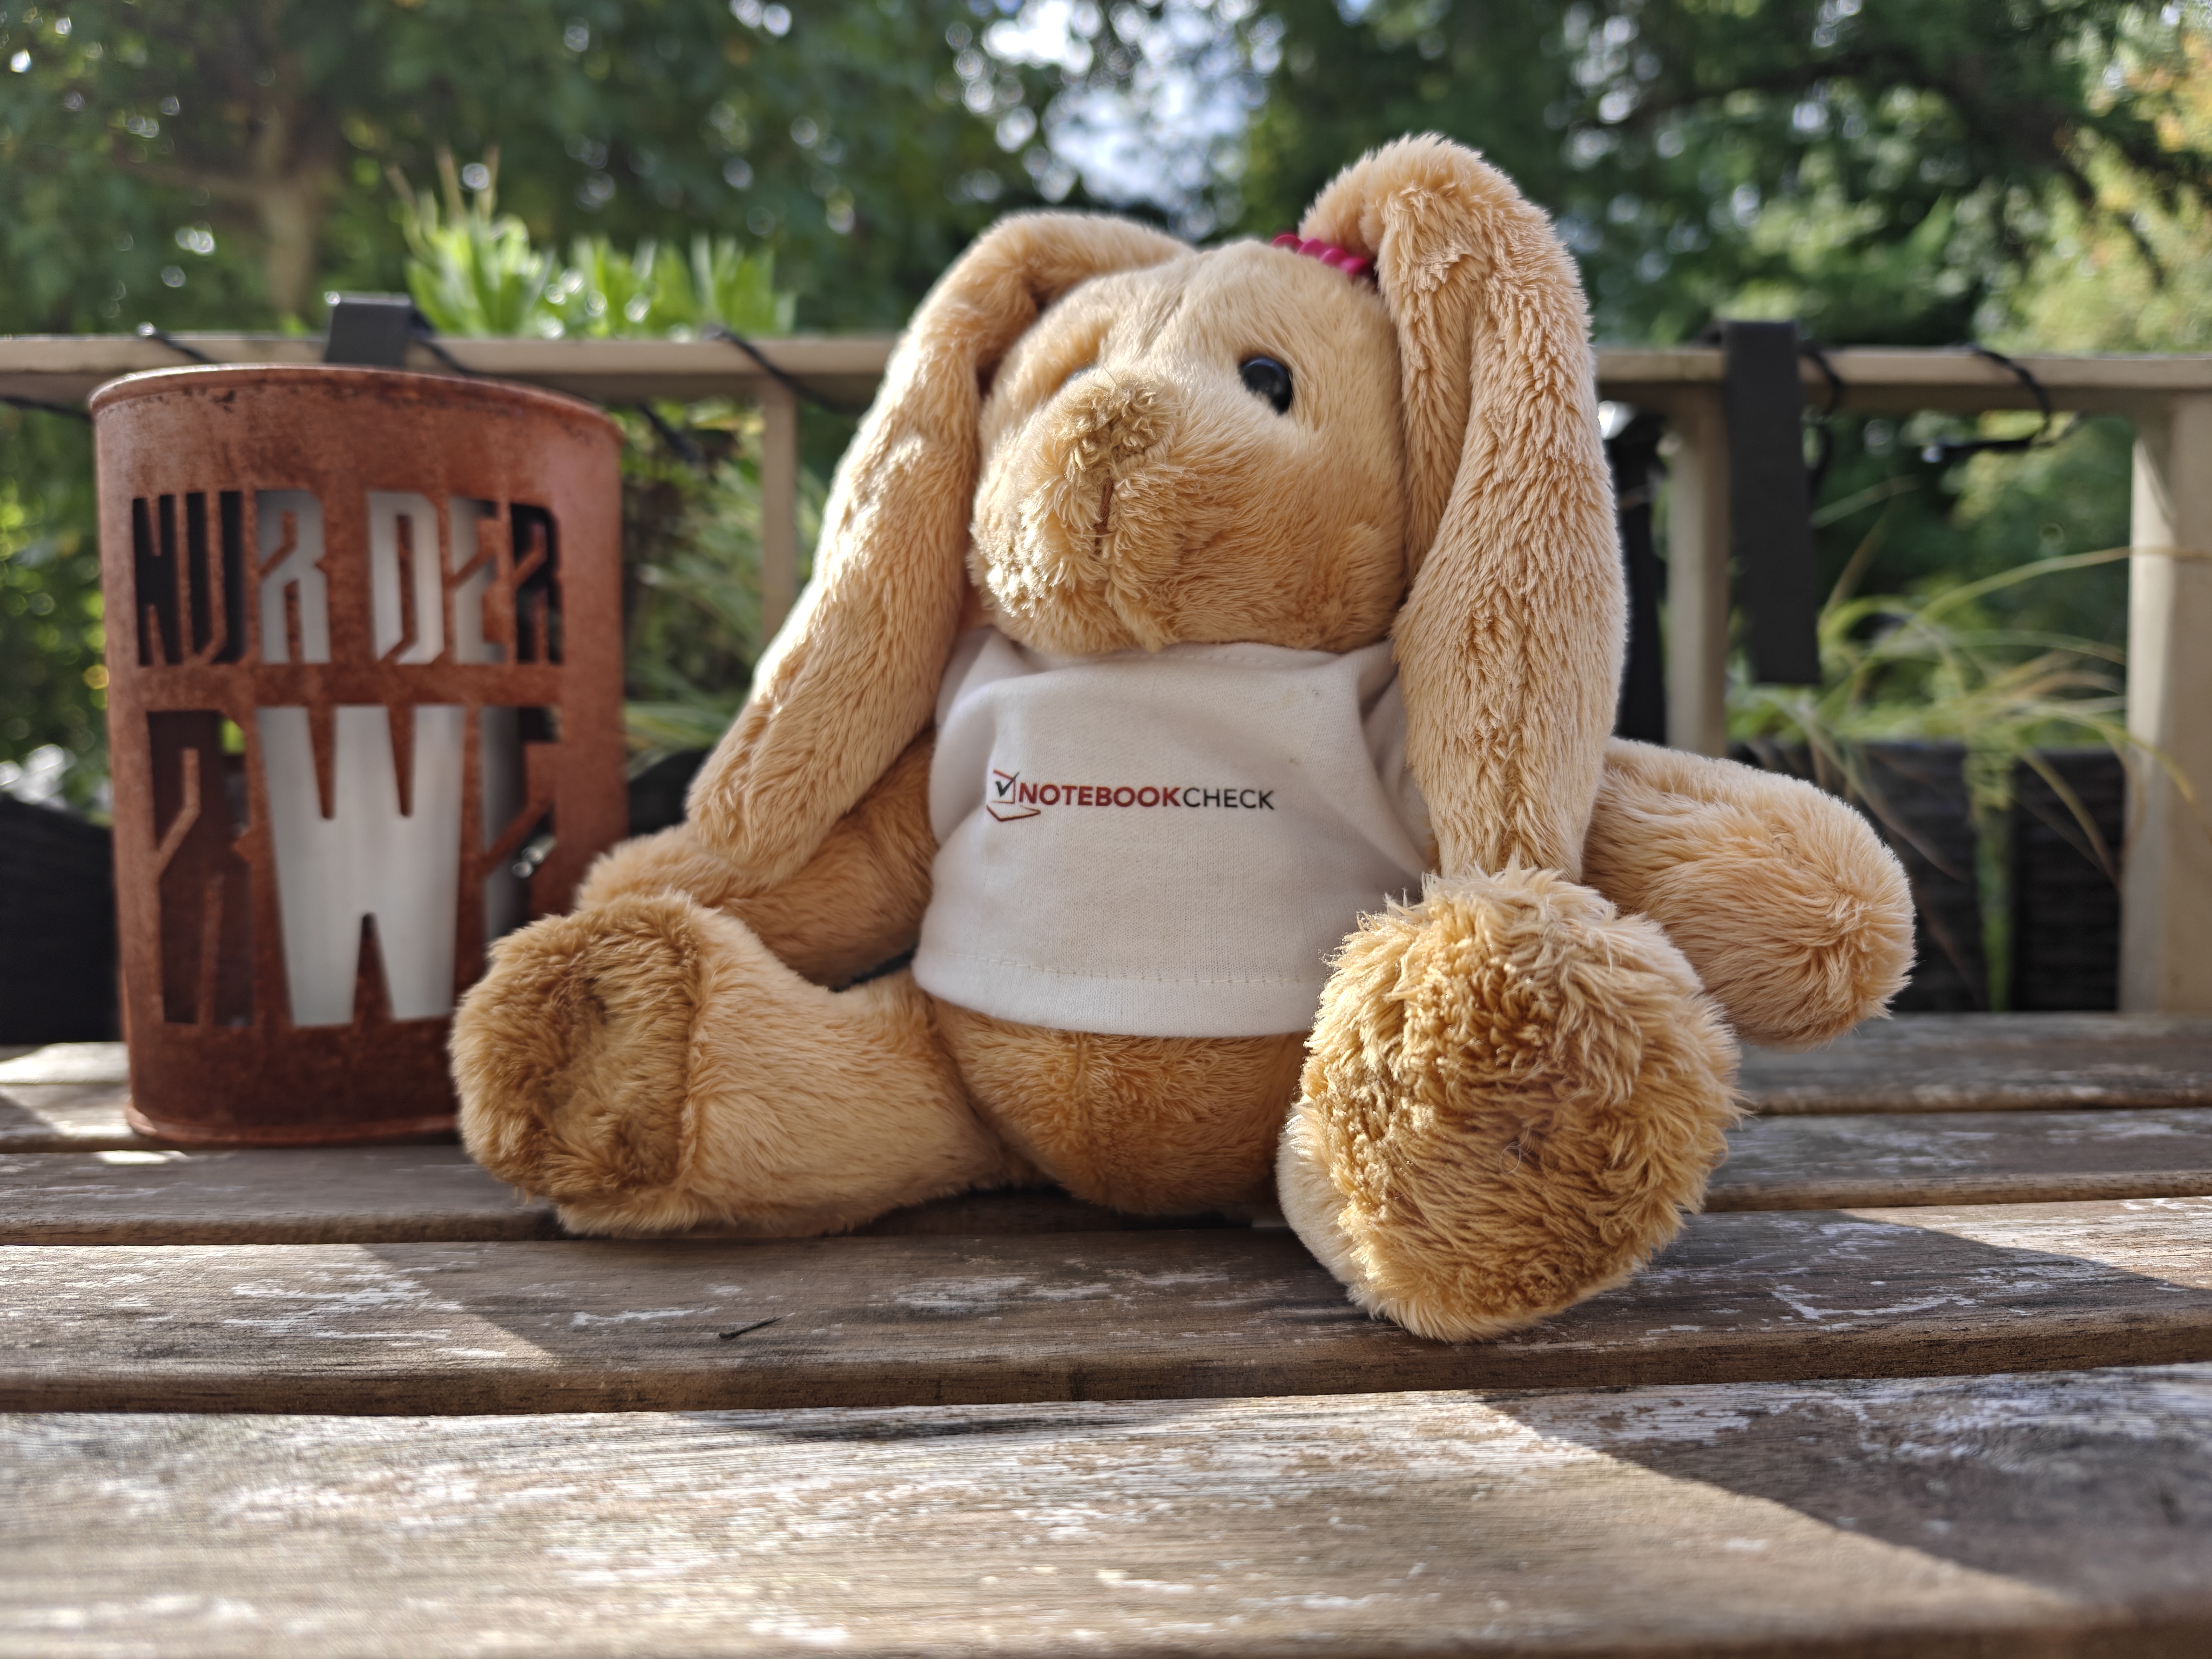
照相机 - 日光下的实用快照

Pad Mini 的 800 万像素前置摄像头可拍摄实用的自拍照,并以高达每秒 30 帧的速度录制 1080p 视频。主摄像头支持自动对焦,像素为 1300 万。它能以每秒 30 帧的速度录制高达 4K 的视频。
主摄像头的拍摄效果只能达到快照的水平,但在日光下看起来一点也不差。而变焦拍摄则比较模糊,弱光条件下也会让相机不堪重负。
测试实验室的测量结果证实了这一实际印象。在光线充足的条件下,主摄像头能准确再现参考色彩。在光线不足的情况下,只能获得暗淡、模糊的图像。
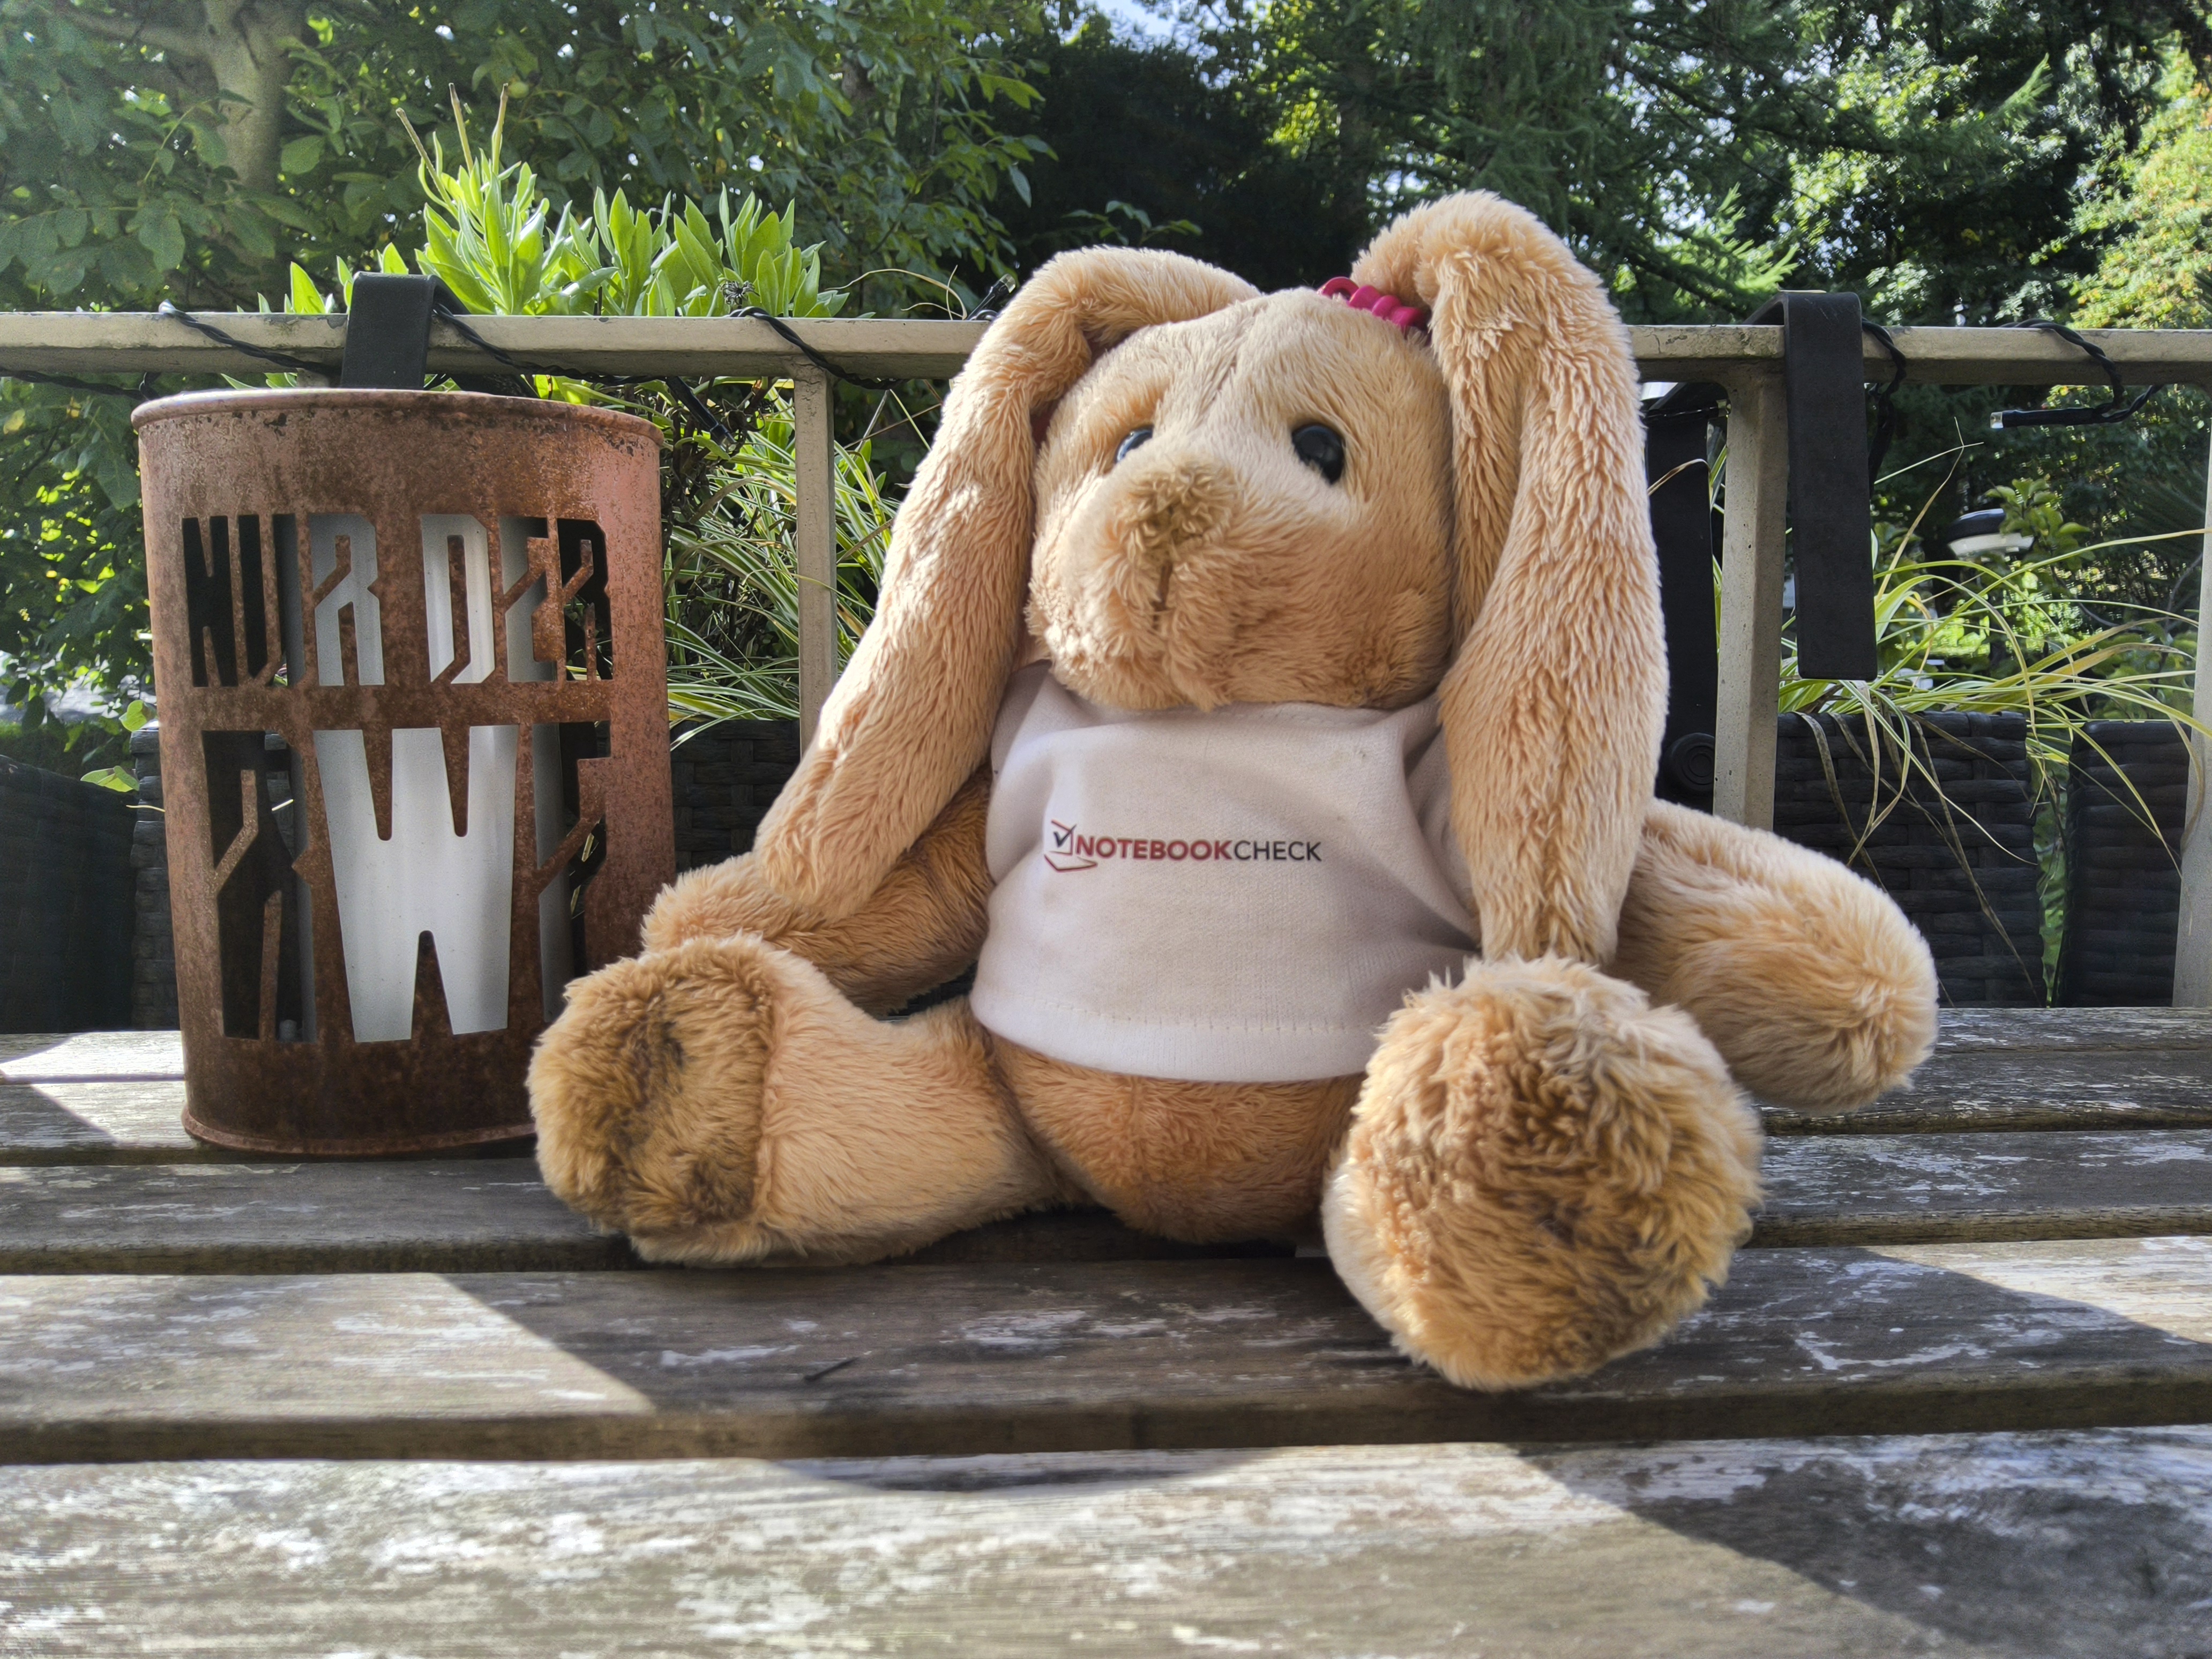
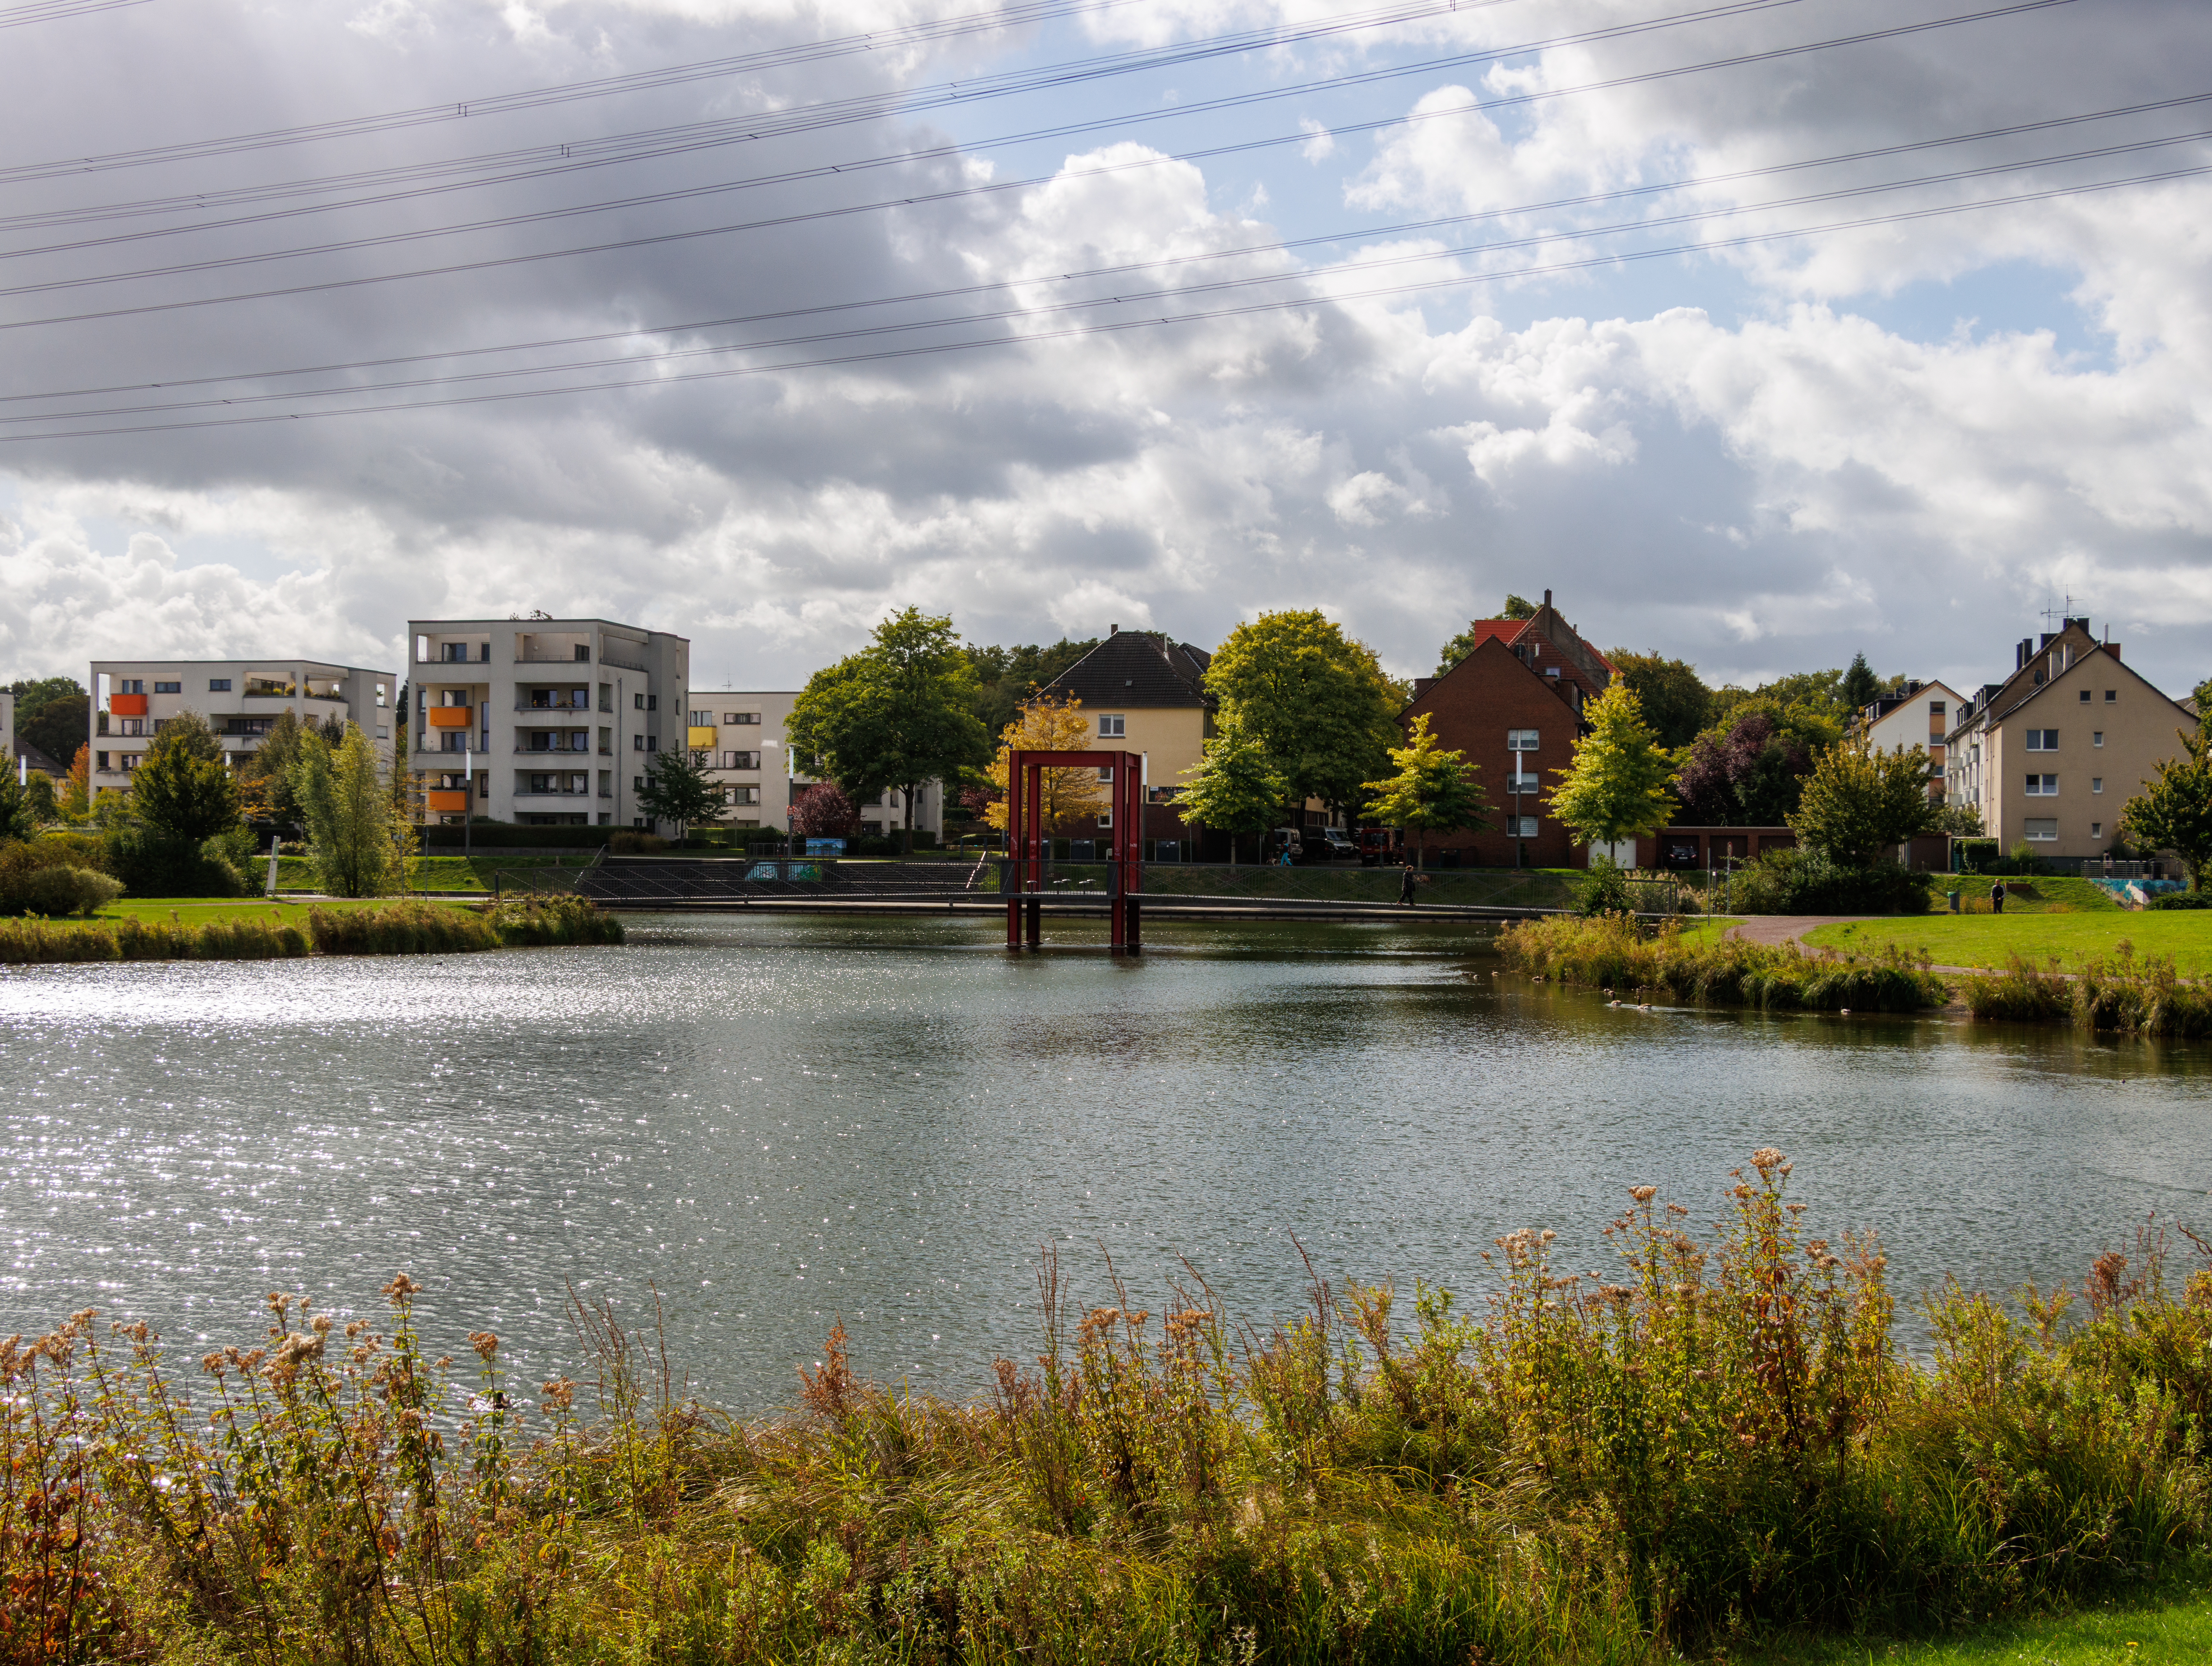
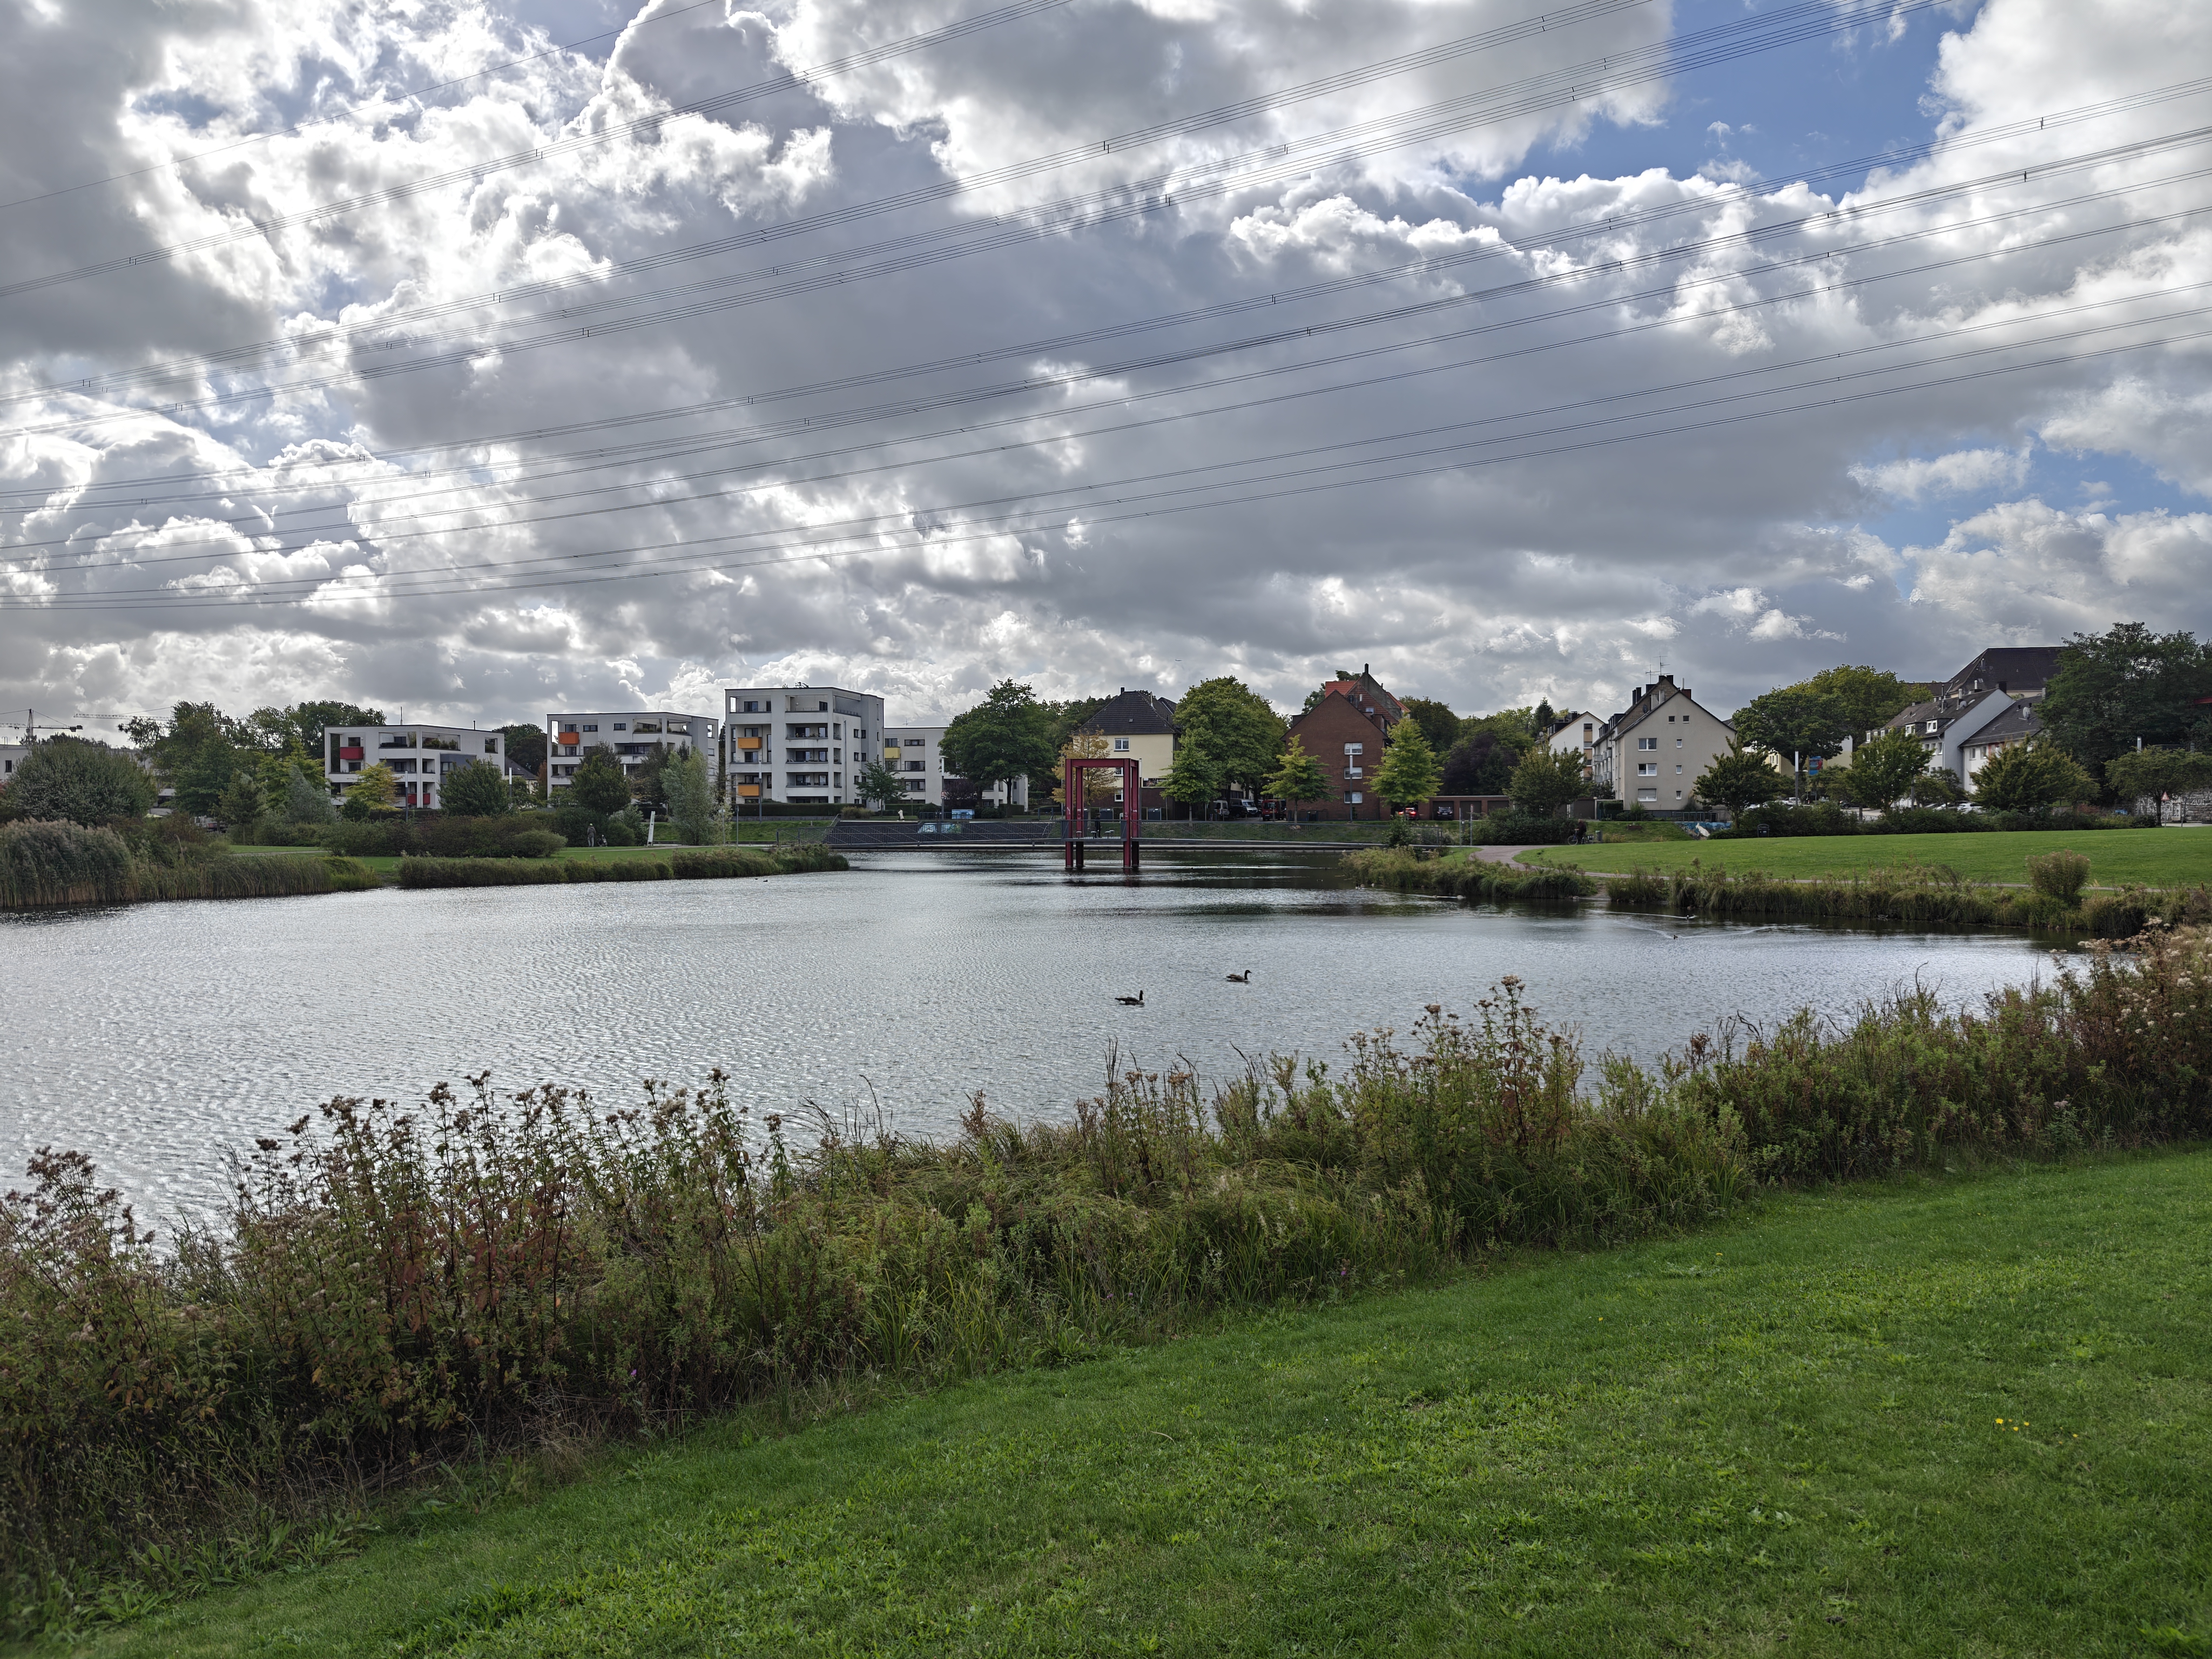
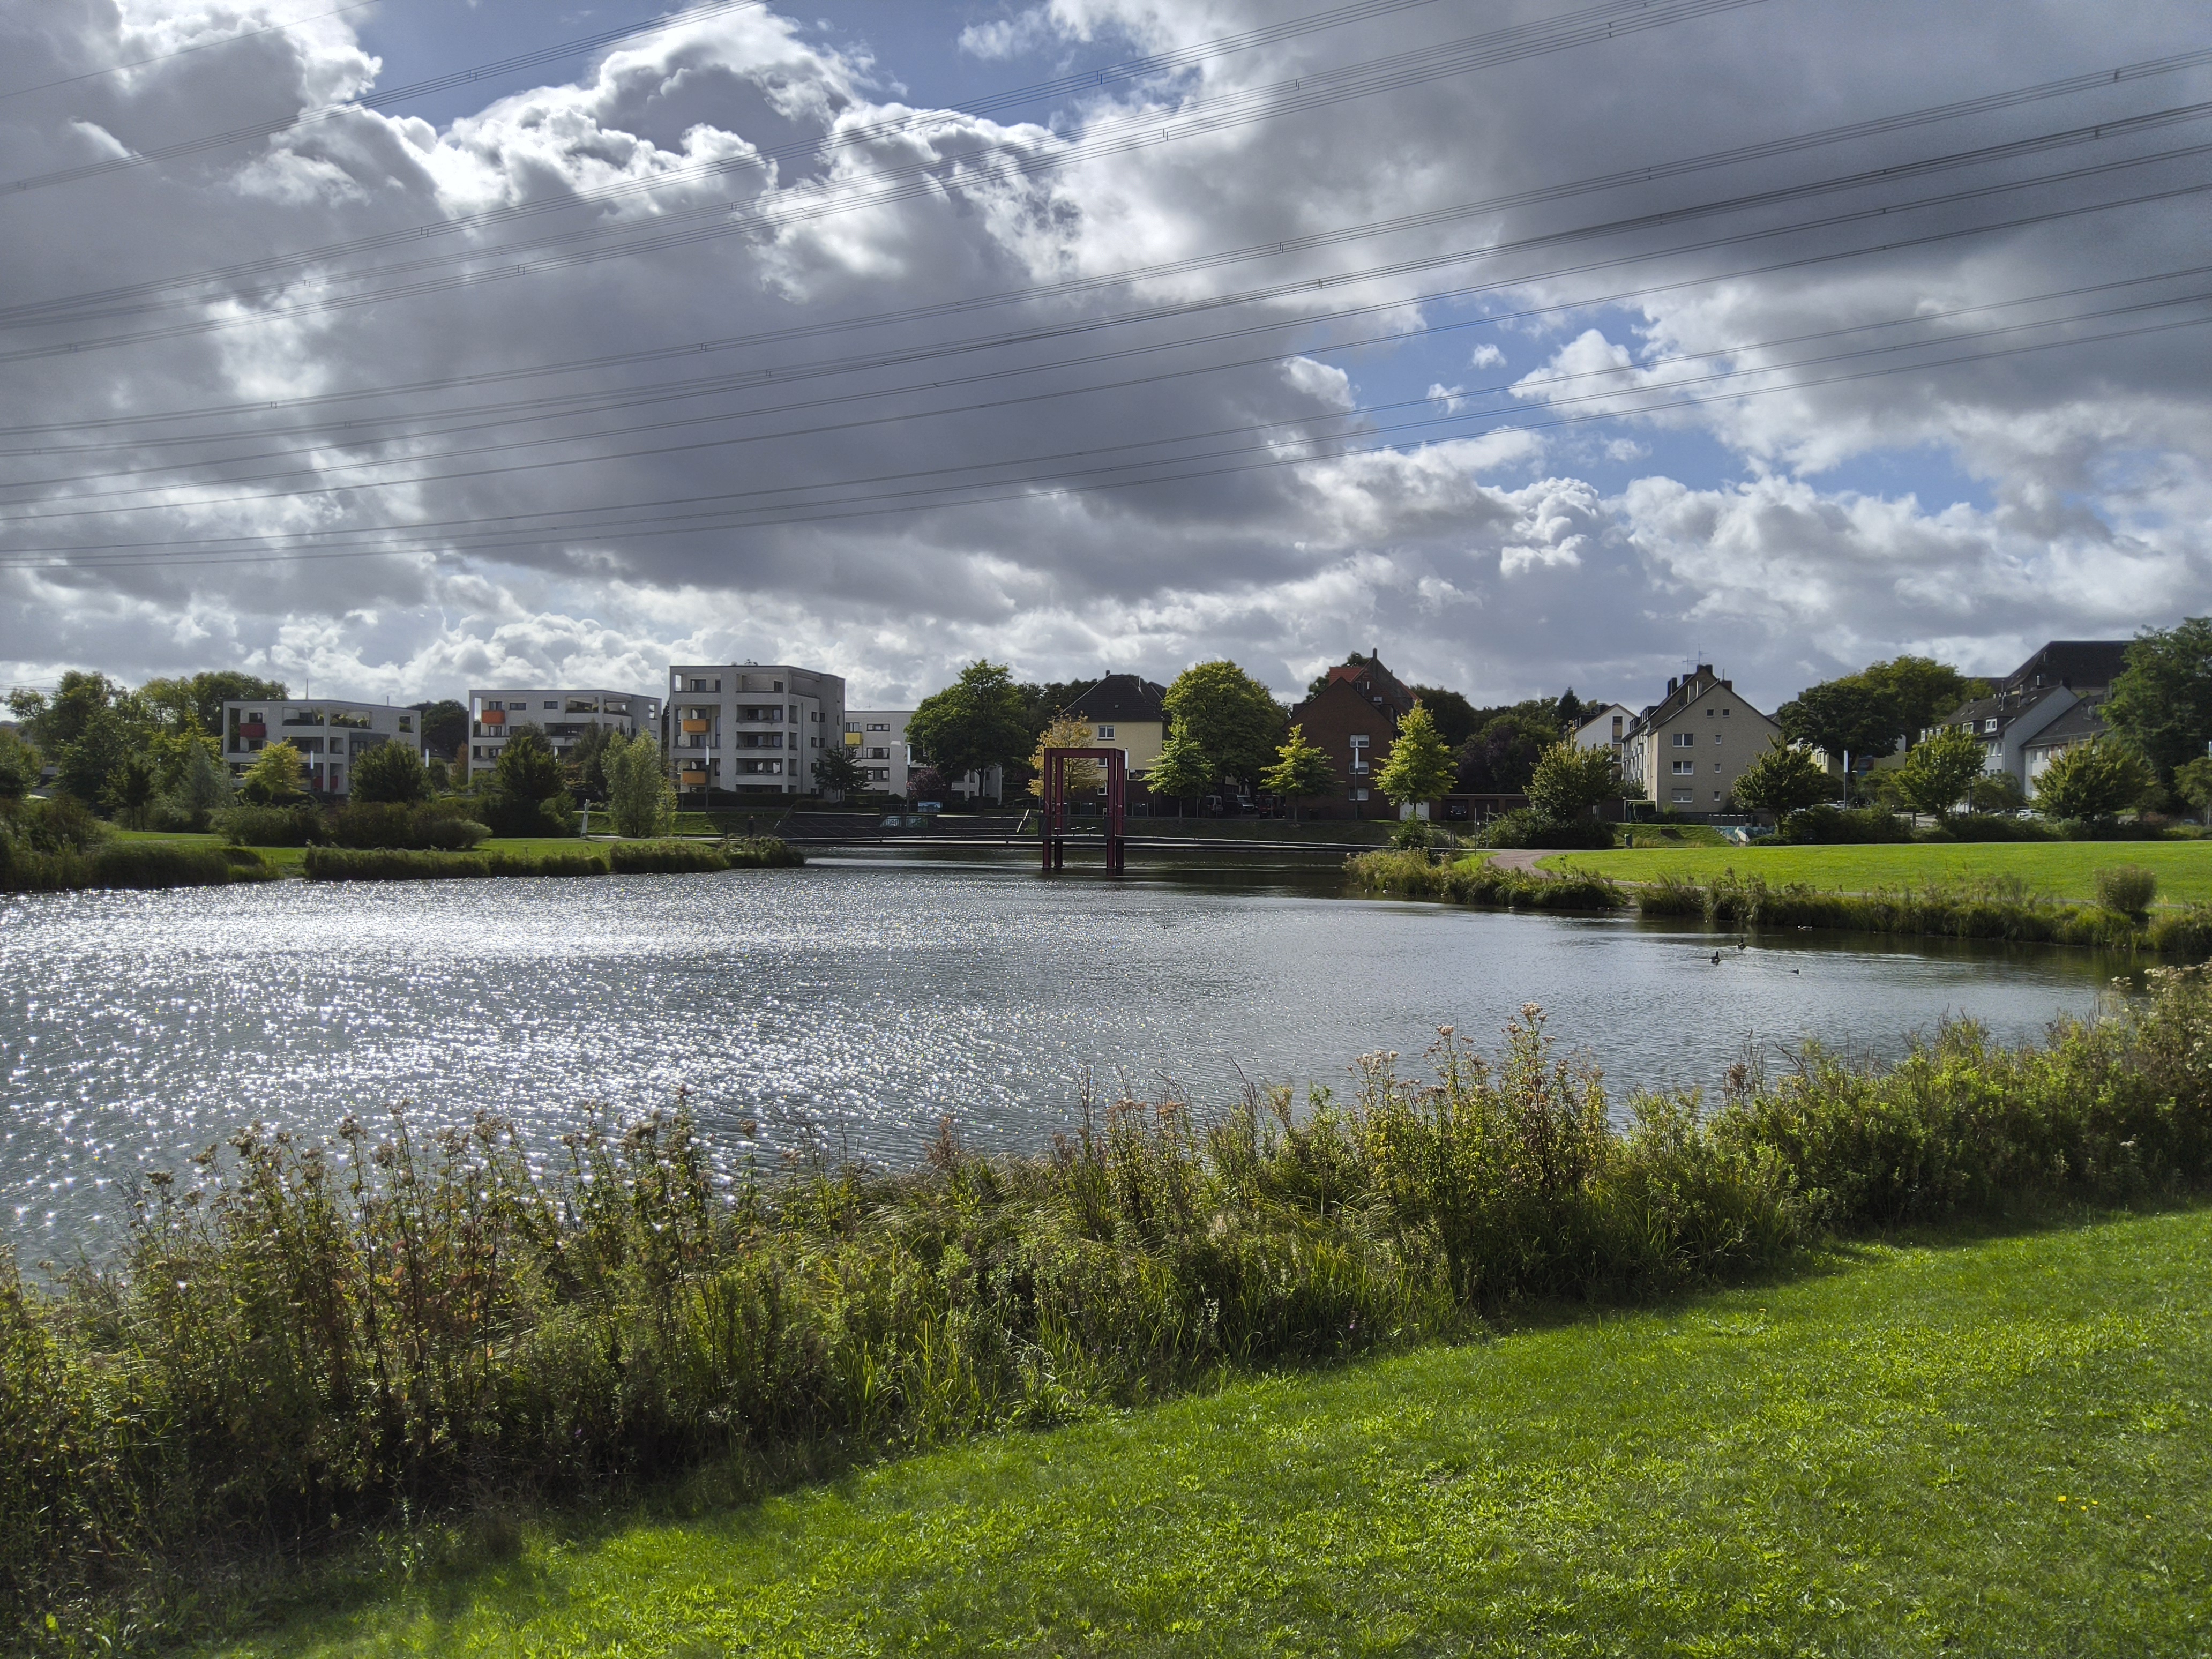
Image comparison
Choose a scene and navigate within the first image. One click changes the position on touchscreens. One click on the zoomed-in image opens the original in a new window. The first image shows the scaled photograph of the test device.
Main cameraMain camera5x zoomLow light


附件和保修 - 带问号的交货范围
我们测试设备的供货范围包括一个 67 瓦的电源装置和一条 USB-C 连接线。如果该平板电脑也在欧盟正式发布,那么很可能会缺少电源适配器。
小米在其全球网站上提供了平板电脑的保护套和屏幕保护膜,但未提及价格。Pad Mini 还支持触控笔,如小米 Focus Pen和红米手写笔.
在欧盟,小米通常提供 24 个月的 保修期保修。进口产品的保修期可能会缩短为 12 个月。
输入设备和操作 - 165 Hz 显示屏和笔支持
得益于高达 165 Hz 的高帧频,小米 Pad Mini 的显示效果极为流畅。凭借 1080 Hz 的最大触摸采样率,它还能非常快速、精确地实现手指和笔的输入。X 轴振动电机提供了良好的触觉反馈,使操作更加流畅。
这款平板电脑没有指纹传感器。只能通过自拍摄像头的 2D 人脸识别功能进行生物识别验证。
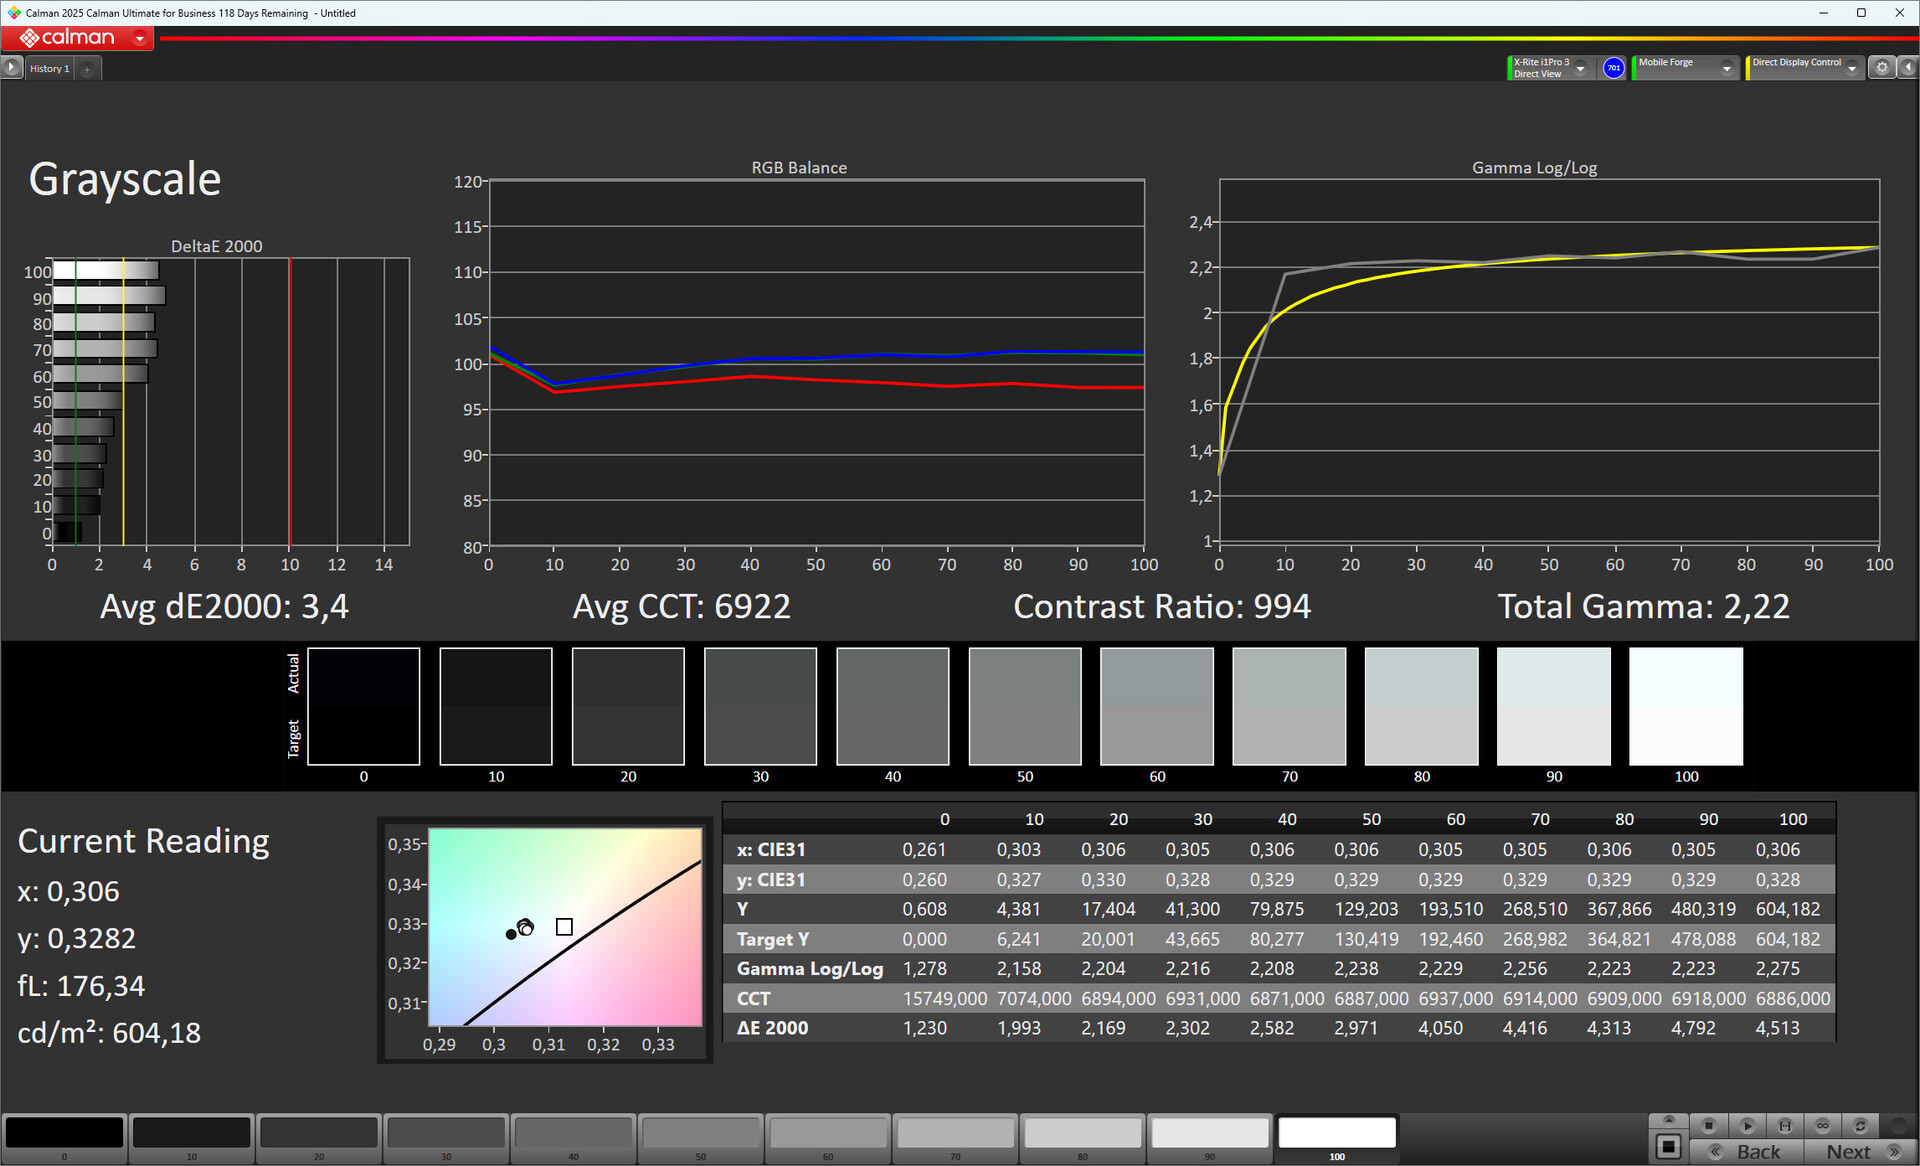
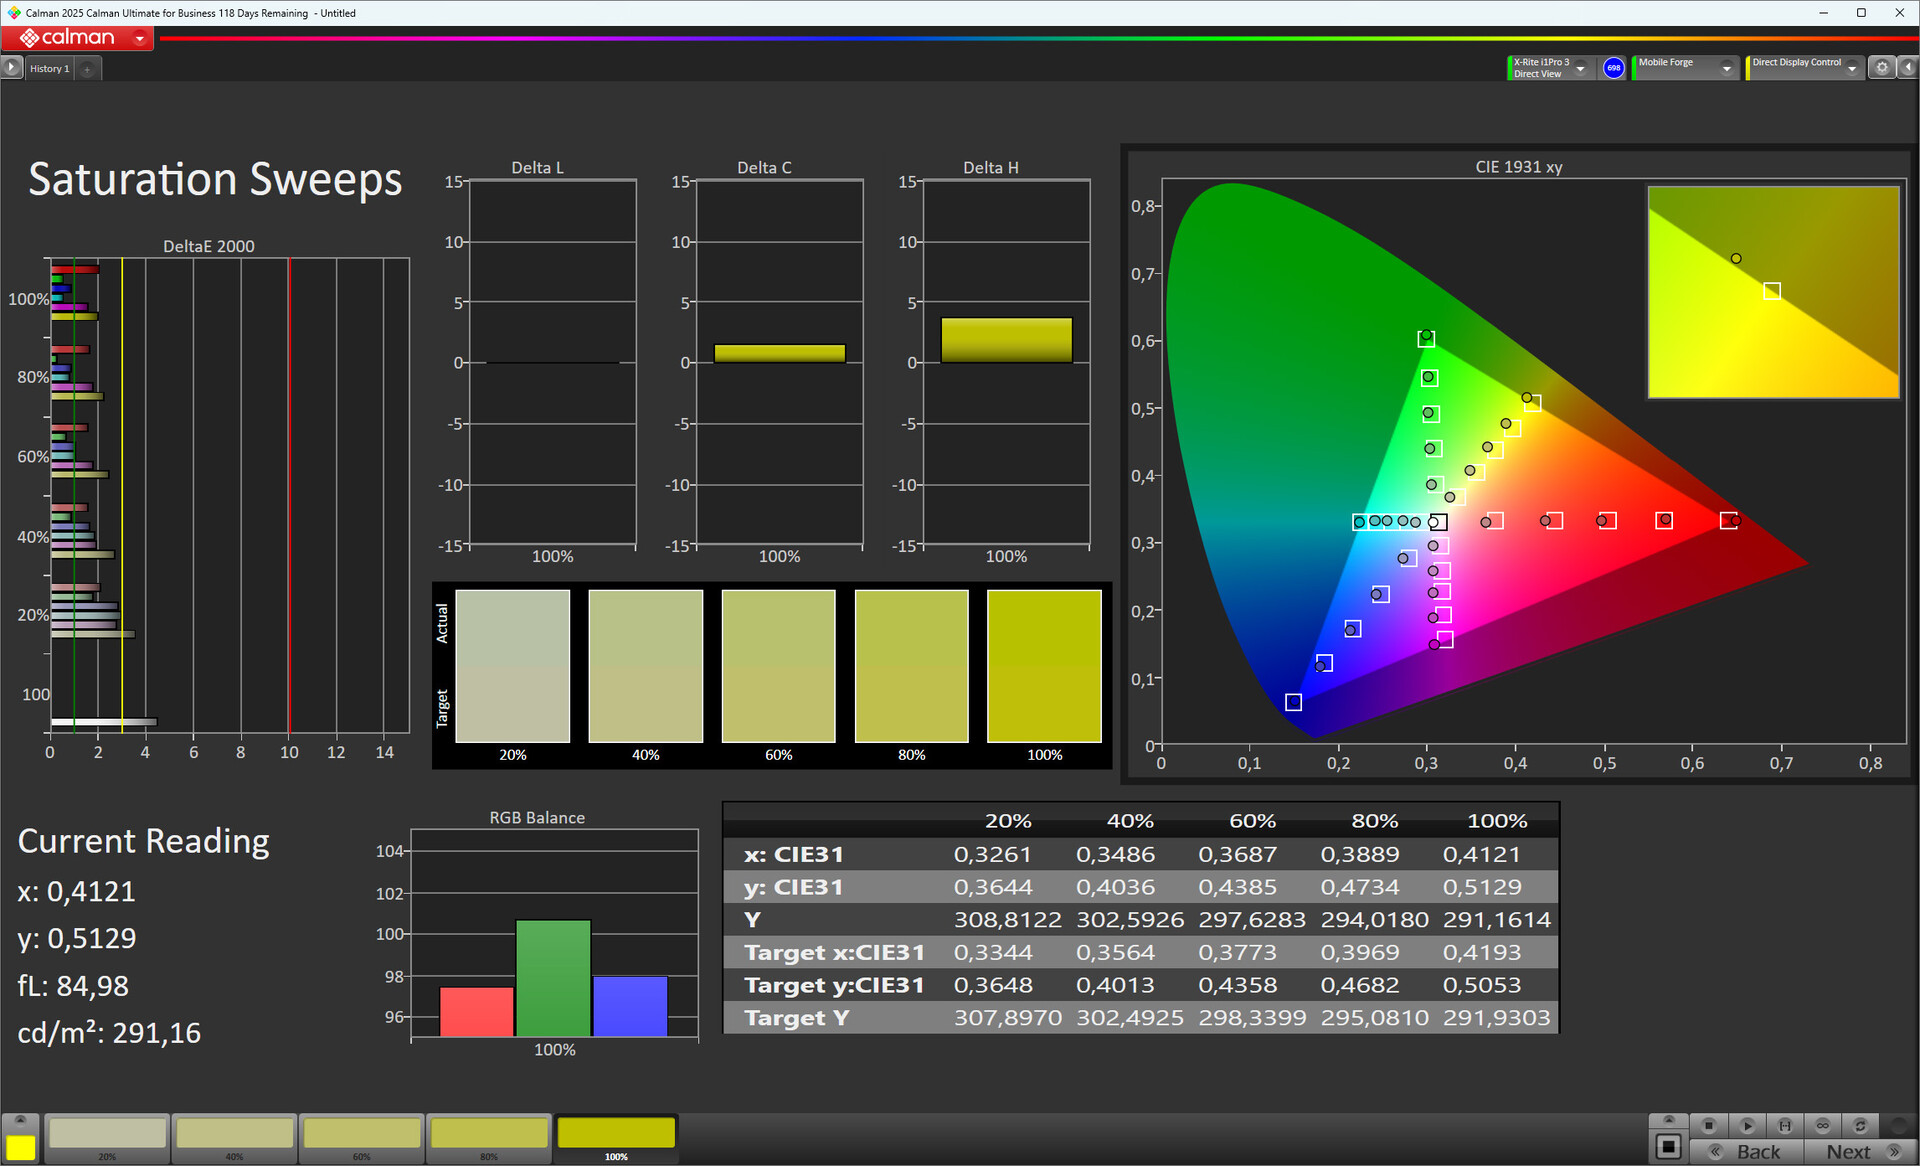
显示屏 - 小米 Pad Mini,3K 分辨率,支持 HDR
在测试(APL18 测量)中,TFT LCD 的最大亮度达到 720 cd/m²,因此亮度值比平常略高。
3K 显示屏的宽高比为 16:10,分辨率为 3008 x 1880 像素。支持 HDR10、HDR10+、HLG 和 Dolby Vision,HDR 支持非常出色。不过,该显示屏在 HDR 模式下最高只能达到 508 cd/m²。
| |||||||||||||||||||||||||
Brightness Distribution: 95 %
Center on Battery: 681 cd/m²
Contrast: 1195:1 (Black: 0.57 cd/m²)
ΔE ColorChecker Calman: 2 | ∀{0.5-29.43 Ø4.71}
ΔE Greyscale Calman: 3.4 | ∀{0.09-98 Ø4.96}
99.8% sRGB (Calman 2D)
Gamma: 2.22
CCT: 6922 K
| Xiaomi Pad Mini TFT-LCD, 3008x1880, 8.8" | Apple iPad Mini 7 (2024) IPS, 2266x1488, 8.3" | Alldocube iPlay 70 Mini Ultra LTPS, 2560x1600, 8.8" | Lenovo Legion Tab TB321FU LTPS, 2560x1600, 8.8" | Samsung Galaxy Tab A9 LCD TFT, 1340x800, 8.7" | |
|---|---|---|---|---|---|
| Screen | -0% | -73% | 9% | -51% | |
| Brightness middle (cd/m²) | 681 | 525 -23% | 555 -19% | 441 -35% | 486 -29% |
| Brightness (cd/m²) | 675 | 512 -24% | 523 -23% | 420 -38% | 462 -32% |
| Brightness Distribution (%) | 95 | 91 -4% | 88 -7% | 91 -4% | 92 -3% |
| Black Level * (cd/m²) | 0.57 | 0.43 25% | 0.46 19% | 0.5 12% | 0.35 39% |
| Contrast (:1) | 1195 | 1221 2% | 1207 1% | 882 -26% | 1389 16% |
| Colorchecker dE 2000 * | 2 | 2 -0% | 6.4 -220% | 1.08 46% | 6.2 -210% |
| Colorchecker dE 2000 max. * | 4.7 | 4.3 9% | 12.6 -168% | 2.52 46% | 10.4 -121% |
| Greyscale dE 2000 * | 3.4 | 3 12% | 9.1 -168% | 1.1 68% | 5.7 -68% |
| Gamma | 2.22 99% | 2.2 100% | 2.31 95% | 2.19 100% | 2.12 104% |
| CCT | 6922 94% | 7109 91% | 9616 68% | 6655 98% | 7911 82% |
* ... smaller is better
Screen Flickering / PWM (Pulse-Width Modulation)
| Screen flickering / PWM not detected | 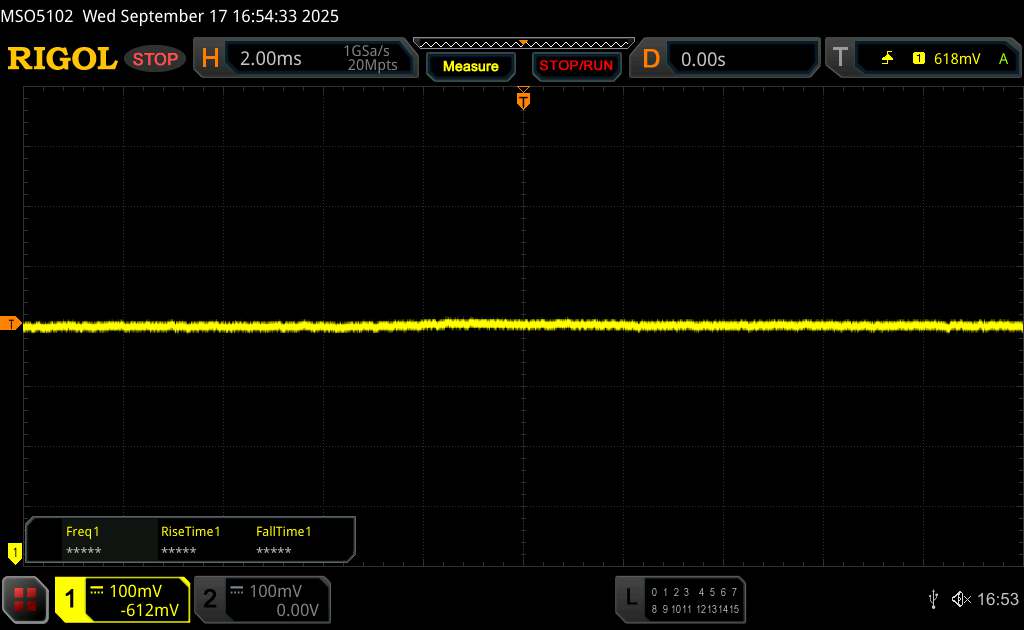 | ||
In comparison: 52 % of all tested devices do not use PWM to dim the display. If PWM was detected, an average of 7747 (minimum: 5 - maximum: 343500) Hz was measured. | |||
TFT 液晶显示屏的对比度高达 1200:1,能准确再现参考色彩。虽然与目标有细微偏差,但这些偏差低于感知阈值,只有在使用光分光计进行分析时才会发现。


Display Response Times
| ↔ Response Time Black to White | ||
|---|---|---|
| 14.89 ms ... rise ↗ and fall ↘ combined | ↗ 4.025 ms rise | 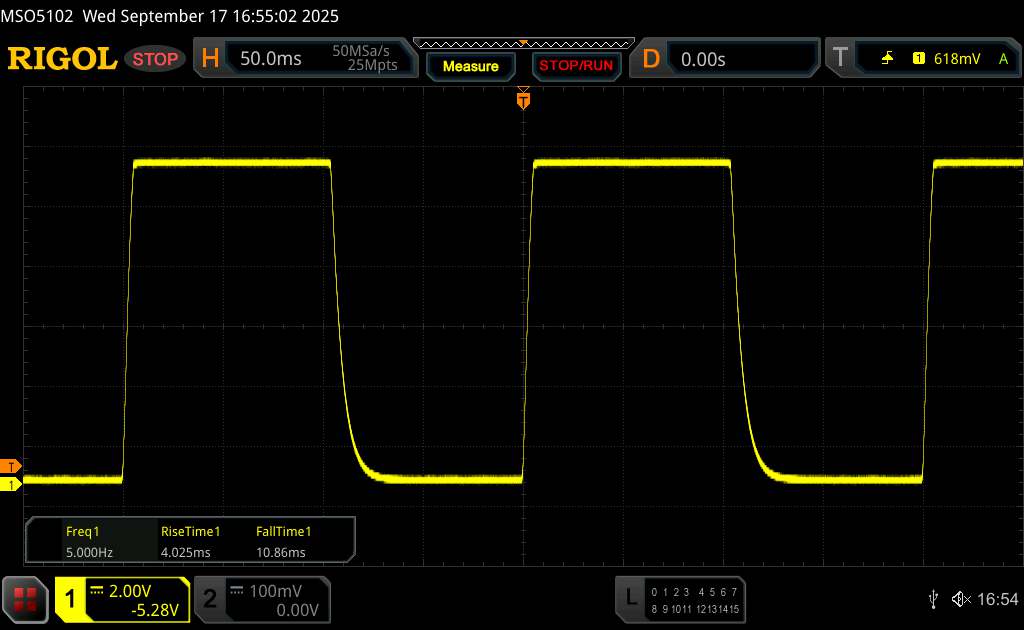 |
| ↘ 10.86 ms fall | ||
| The screen shows good response rates in our tests, but may be too slow for competitive gamers. In comparison, all tested devices range from 0.1 (minimum) to 240 (maximum) ms. » 36 % of all devices are better. This means that the measured response time is better than the average of all tested devices (19.8 ms). | ||
| ↔ Response Time 50% Grey to 80% Grey | ||
| 32.48 ms ... rise ↗ and fall ↘ combined | ↗ 13.65 ms rise | 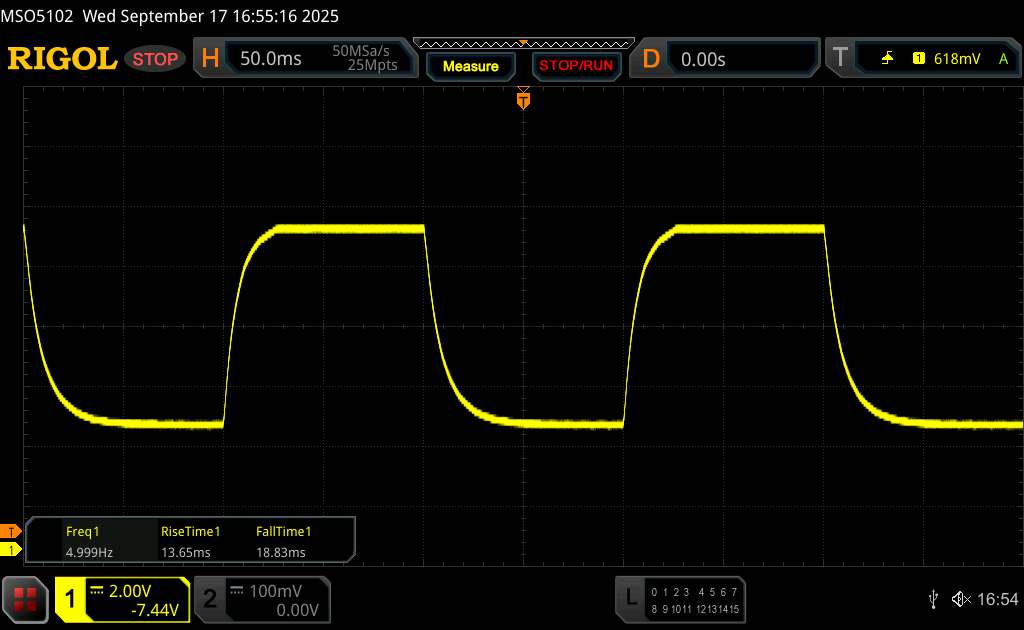 |
| ↘ 18.83 ms fall | ||
| The screen shows slow response rates in our tests and will be unsatisfactory for gamers. In comparison, all tested devices range from 0.165 (minimum) to 636 (maximum) ms. » 44 % of all devices are better. This means that the measured response time is similar to the average of all tested devices (31 ms). | ||
小米平板电脑还可以在户外阴凉处使用。不过,在直射光下,可视角度稳定的 TFT LCD 的亮度几乎不足以弥补玻璃表面的反光。


性能 - 配备高端 SoC 的小米 Pad Mini
小型小米平板电脑在性能方面遥遥领先。配备了 联发科 Dimensity 9400+,Pad Mini 甚至击败了 iPad Mini 7在许多基准测试中。在人工智能测试中,它的表现也非常出色。
只有在浏览器测试中,它远远落后。不过,这在日常使用中并不明显,因为这款小平板电脑可以用来快速浏览网页。
| UL Procyon AI Inference for Android - Overall Score NNAPI | |
| Xiaomi Pad Mini | |
| Average Mediatek Dimensity 9400+ (72895 - 76852, n=4) | |
| Average of class Tablet (3564 - 76852, n=51, last 2 years) | |
| Lenovo Legion Tab TB321FU | |
| Samsung Galaxy Tab A9 | |
| AImark - Score v3.x | |
| Xiaomi Pad Mini | |
| Average Mediatek Dimensity 9400+ (49562 - 50153, n=2) | |
| Average of class Tablet (248 - 50153, n=36, last 2 years) | |
| Lenovo Legion Tab TB321FU | |
| Samsung Galaxy Tab A9 | |
| AI Benchmark - Score V6 | |
| Average Mediatek Dimensity 9400+ (1945 - 12713, n=5) | |
| Average of class Tablet (70.4 - 22476, n=35, last 2 years) | |
| Xiaomi Pad Mini | |
其 Immortalis-G925图形芯片,小米 Pad Mini 还在 GPU 基准测试中获得了惊叹号。iPad Apple iPad Mini 7没有机会,只有 联想Legion Tab TB321FU能在一定程度上跟上。联想平板电脑在 GFXBench 屏幕测试中遥遥领先,但这只是因为小米 Pad Mini 的运行频率为 120 Hz。
GFXBench (DX / GLBenchmark) 2.7: T-Rex Onscreen | 1920x1080 T-Rex Offscreen
GFXBench 3.0: on screen Manhattan Onscreen OGL | 1920x1080 1080p Manhattan Offscreen
GFXBench 3.1: on screen Manhattan ES 3.1 Onscreen | 1920x1080 Manhattan ES 3.1 Offscreen
GFXBench: on screen Car Chase Onscreen | 1920x1080 Car Chase Offscreen | on screen Aztec Ruins High Tier Onscreen | 2560x1440 Aztec Ruins High Tier Offscreen | on screen Aztec Ruins Normal Tier Onscreen | 1920x1080 Aztec Ruins Normal Tier Offscreen | 3840x2160 4K Aztec Ruins High Tier Offscreen
| 3DMark / Wild Life Extreme Unlimited | |
| Xiaomi Pad Mini | |
| Lenovo Legion Tab TB321FU | |
| Apple iPad Mini 7 (2024) | |
| Samsung Galaxy Tab A9 | |
| 3DMark / Wild Life Extreme | |
| Xiaomi Pad Mini | |
| Lenovo Legion Tab TB321FU | |
| Apple iPad Mini 7 (2024) | |
| Samsung Galaxy Tab A9 | |
| 3DMark / Wild Life Unlimited Score | |
| Xiaomi Pad Mini | |
| Lenovo Legion Tab TB321FU | |
| Apple iPad Mini 7 (2024) | |
| Alldocube iPlay 70 Mini Ultra | |
| Samsung Galaxy Tab A9 | |
| 3DMark / Solar Bay Score | |
| Xiaomi Pad Mini | |
| Lenovo Legion Tab TB321FU | |
| Apple iPad Mini 7 (2024) | |
| 3DMark / Solar Bay Unlimited Score | |
| Xiaomi Pad Mini | |
| Lenovo Legion Tab TB321FU | |
| Apple iPad Mini 7 (2024) | |
| 3DMark / Steel Nomad Light Unlimited Score | |
| Xiaomi Pad Mini | |
| Lenovo Legion Tab TB321FU | |
| Apple iPad Mini 7 (2024) | |
| Alldocube iPlay 70 Mini Ultra | |
| 3DMark / Steel Nomad Light Score | |
| Xiaomi Pad Mini | |
| Lenovo Legion Tab TB321FU | |
| Apple iPad Mini 7 (2024) | |
| Alldocube iPlay 70 Mini Ultra | |
| GFXBench (DX / GLBenchmark) 2.7 / T-Rex Onscreen | |
| Lenovo Legion Tab TB321FU | |
| Xiaomi Pad Mini | |
| Apple iPad Mini 7 (2024) | |
| Samsung Galaxy Tab A9 | |
| GFXBench (DX / GLBenchmark) 2.7 / T-Rex Offscreen | |
| Xiaomi Pad Mini | |
| Lenovo Legion Tab TB321FU | |
| Apple iPad Mini 7 (2024) | |
| Samsung Galaxy Tab A9 | |
| GFXBench 3.0 / Manhattan Onscreen OGL | |
| Lenovo Legion Tab TB321FU | |
| Xiaomi Pad Mini | |
| Apple iPad Mini 7 (2024) | |
| Samsung Galaxy Tab A9 | |
| GFXBench 3.0 / 1080p Manhattan Offscreen | |
| Xiaomi Pad Mini | |
| Lenovo Legion Tab TB321FU | |
| Apple iPad Mini 7 (2024) | |
| Samsung Galaxy Tab A9 | |
| GFXBench 3.1 / Manhattan ES 3.1 Onscreen | |
| Lenovo Legion Tab TB321FU | |
| Xiaomi Pad Mini | |
| Apple iPad Mini 7 (2024) | |
| Samsung Galaxy Tab A9 | |
| GFXBench 3.1 / Manhattan ES 3.1 Offscreen | |
| Xiaomi Pad Mini | |
| Lenovo Legion Tab TB321FU | |
| Apple iPad Mini 7 (2024) | |
| Samsung Galaxy Tab A9 | |
| GFXBench / Car Chase Onscreen | |
| Lenovo Legion Tab TB321FU | |
| Xiaomi Pad Mini | |
| Apple iPad Mini 7 (2024) | |
| Samsung Galaxy Tab A9 | |
| GFXBench / Car Chase Offscreen | |
| Xiaomi Pad Mini | |
| Lenovo Legion Tab TB321FU | |
| Apple iPad Mini 7 (2024) | |
| Samsung Galaxy Tab A9 | |
| GFXBench / Aztec Ruins High Tier Onscreen | |
| Xiaomi Pad Mini | |
| Lenovo Legion Tab TB321FU | |
| Apple iPad Mini 7 (2024) | |
| Alldocube iPlay 70 Mini Ultra | |
| Samsung Galaxy Tab A9 | |
| GFXBench / Aztec Ruins High Tier Offscreen | |
| Xiaomi Pad Mini | |
| Lenovo Legion Tab TB321FU | |
| Alldocube iPlay 70 Mini Ultra | |
| Apple iPad Mini 7 (2024) | |
| Samsung Galaxy Tab A9 | |
| GFXBench / Aztec Ruins Normal Tier Onscreen | |
| Lenovo Legion Tab TB321FU | |
| Xiaomi Pad Mini | |
| Alldocube iPlay 70 Mini Ultra | |
| Apple iPad Mini 7 (2024) | |
| Samsung Galaxy Tab A9 | |
| GFXBench / Aztec Ruins Normal Tier Offscreen | |
| Xiaomi Pad Mini | |
| Lenovo Legion Tab TB321FU | |
| Alldocube iPlay 70 Mini Ultra | |
| Apple iPad Mini 7 (2024) | |
| Samsung Galaxy Tab A9 | |
| GFXBench / 4K Aztec Ruins High Tier Offscreen | |
| Xiaomi Pad Mini | |
| Lenovo Legion Tab TB321FU | |
| Alldocube iPlay 70 Mini Ultra | |
| Apple iPad Mini 7 (2024) | |
| Samsung Galaxy Tab A9 | |
| Jetstream 2 - 2.0 Total | |
| Apple iPad Mini 7 (2024) (Safari Mobile 18.1.1) | |
| Alldocube iPlay 70 Mini Ultra (Chrome 137) | |
| Lenovo Legion Tab TB321FU (Chrome 135) | |
| Average Mediatek Dimensity 9400+ (125.3 - 272, n=3) | |
| Average of class Tablet (35.8 - 420, n=55, last 2 years) | |
| Xiaomi Pad Mini (Chrome 141.0.7390.71) | |
| Samsung Galaxy Tab A9 (Chrome 212) | |
| Speedometer 2.0 - Result 2.0 | |
| Apple iPad Mini 7 (2024) (Safari Mobile 18.1.1) | |
| Average of class Tablet (6.8 - 790, n=33, last 2 years) | |
| Xiaomi Pad Mini (Chrome 141.0.7390.71) | |
| Average Mediatek Dimensity 9400+ (n=1) | |
| Samsung Galaxy Tab A9 (Chrome 212) | |
| Speedometer 3 - Score 3.0 | |
| Apple iPad Mini 7 (2024) (Safari Mobile 18.1.1) | |
| Lenovo Legion Tab TB321FU (Chrome 135) | |
| Average of class Tablet (1.25 - 49.1, n=49, last 2 years) | |
| Average Mediatek Dimensity 9400+ (9.67 - 25.8, n=3) | |
| Xiaomi Pad Mini (Chrome 141.0.7390.71) | |
| WebXPRT 4 - Overall | |
| Apple iPad Mini 7 (2024) (Safari Mobile 18.1.1) | |
| Lenovo Legion Tab TB321FU (Chrome 135) | |
| Average Mediatek Dimensity 9400+ (109 - 235, n=5) | |
| Average of class Tablet (39 - 376, n=54, last 2 years) | |
| Xiaomi Pad Mini (Chrome 141.0.7390.71) | |
| Samsung Galaxy Tab A9 (Chrome 212) | |
| Octane V2 - Total Score | |
| Apple iPad Mini 7 (2024) (Safari Mobile 18.1.1) | |
| Lenovo Legion Tab TB321FU (Chrome 135) | |
| Average Mediatek Dimensity 9400+ (33868 - 94555, n=5) | |
| Average of class Tablet (1633 - 138481, n=70, last 2 years) | |
| Xiaomi Pad Mini (Chrome 141.0.7390.71) | |
| Samsung Galaxy Tab A9 (Chrome 212) | |
| Mozilla Kraken 1.1 - Total | |
| Samsung Galaxy Tab A9 (Chrome 212) | |
| Average of class Tablet (243 - 16233, n=64, last 2 years) | |
| Xiaomi Pad Mini (Chrome 141.0.7390.71) | |
| Average Mediatek Dimensity 9400+ (391 - 1140, n=5) | |
| Lenovo Legion Tab TB321FU (Chrome 135) | |
| Apple iPad Mini 7 (2024) (Safari Mobile 18.1.1) | |
* ... smaller is better
| Xiaomi Pad Mini | Alldocube iPlay 70 Mini Ultra | Lenovo Legion Tab TB321FU | Samsung Galaxy Tab A9 | Average 512 GB UFS 4.1 Flash | Average of class Tablet | |
|---|---|---|---|---|---|---|
| AndroBench 3-5 | 214% | 255% | -10% | 250% | 122% | |
| Sequential Read 256KB (MB/s) | 3585.32 | 1996.56 -44% | 3984.3 11% | 916.45 -74% | 3633 ? 1% | 2048 ? -43% |
| Sequential Write 256KB (MB/s) | 1573.27 | 1866.05 19% | 3483.56 121% | 398.32 -75% | 3189 ? 103% | 1640 ? 4% |
| Random Read 4KB (MB/s) | 411.55 | 392.27 -5% | 355.12 -14% | 182.74 -56% | 413 ? 0% | 273 ? -34% |
| Random Write 4KB (MB/s) | 48.23 | 474.41 884% | 483.73 903% | 128.92 167% | 480 ? 895% | 319 ? 561% |
排放 - 多为酷平板电脑,扬声器性能良好
温度
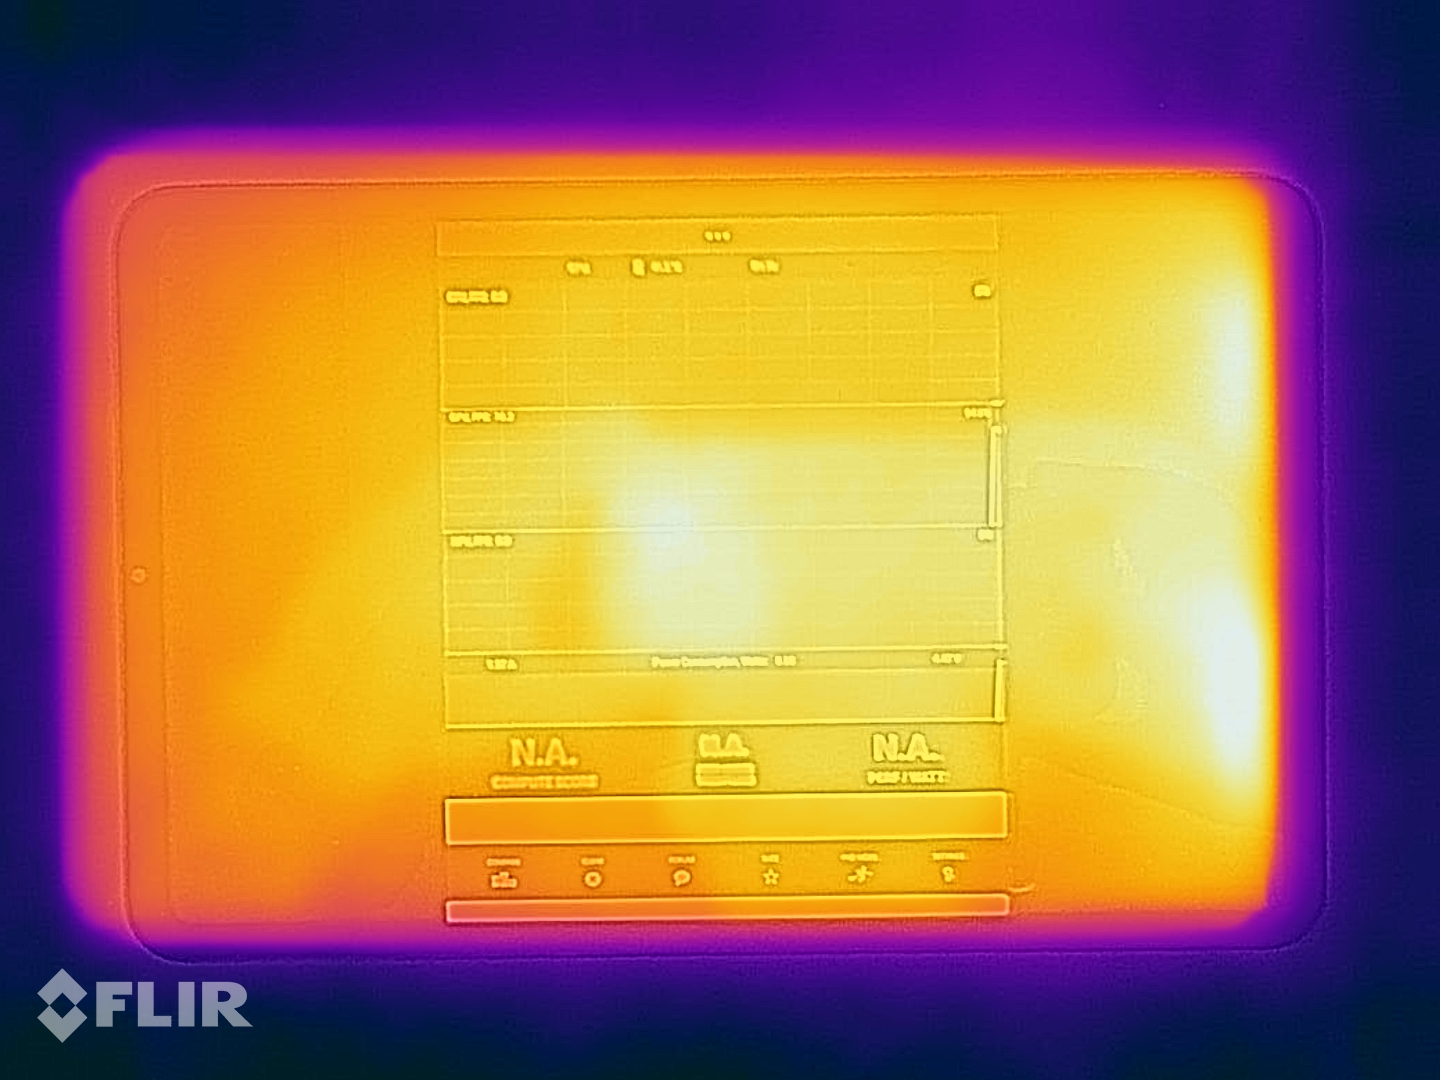
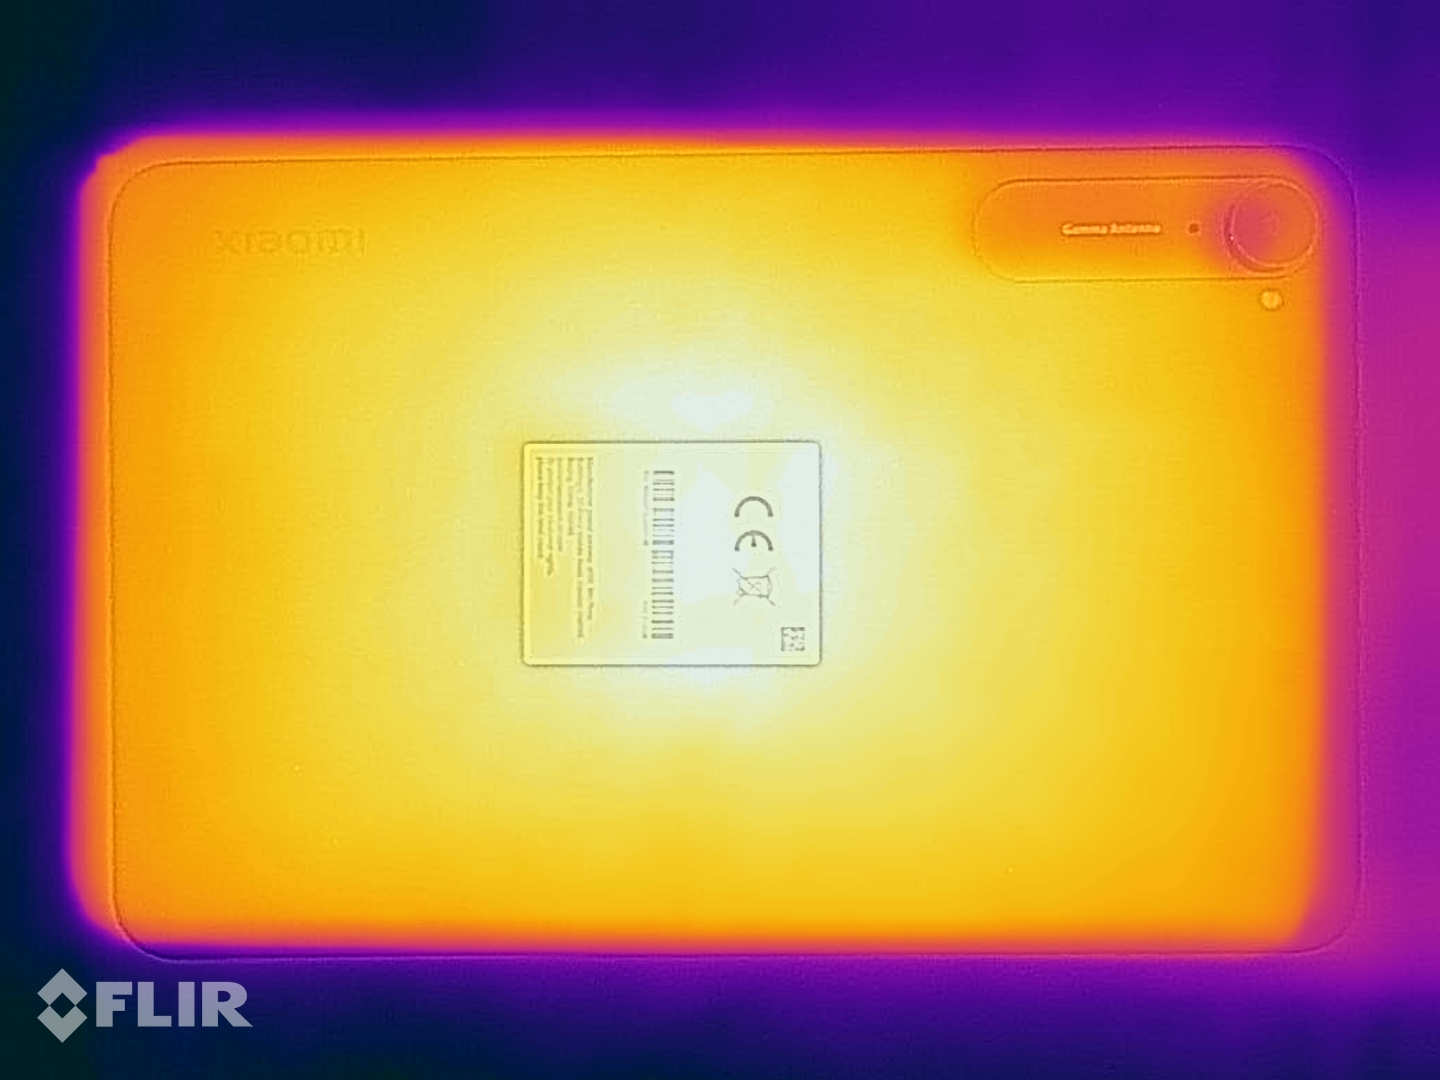
在日常使用中,小米 Pad Mini 的外壳几乎不会发热。只有在长时间的负载情况下,例如进行烧毁基准测试时,其表面温度才会明显升高。即使在这种情况下,手持它也不会感到不舒服。在 3DMark 压力测试中,平板电脑的性能保持了很长时间,然后才会根据不同的情况下降到 71%。
(±) The maximum temperature on the upper side is 41.9 °C / 107 F, compared to the average of 33.7 °C / 93 F, ranging from 20.7 to 53.2 °C for the class Tablet.
(±) The bottom heats up to a maximum of 40.8 °C / 105 F, compared to the average of 33.2 °C / 92 F
(+) In idle usage, the average temperature for the upper side is 25.1 °C / 77 F, compared to the device average of 30 °C / 86 F.
3DMark 压力测试
| 3DMark | |
| Wild Life Stress Test Stability | |
| Samsung Galaxy Tab A9 | |
| Alldocube iPlay 70 Mini Ultra | |
| Apple iPad Mini 7 (2024) | |
| Lenovo Legion Tab TB321FU | |
| Xiaomi Pad Mini | |
| Wild Life Extreme Stress Test | |
| Samsung Galaxy Tab A9 | |
| Lenovo Legion Tab TB321FU | |
| Apple iPad Mini 7 (2024) | |
| Xiaomi Pad Mini | |
| Solar Bay Stress Test Stability | |
| Apple iPad Mini 7 (2024) | |
| Lenovo Legion Tab TB321FU | |
| Xiaomi Pad Mini | |
| Steel Nomad Light Stress Test Stability | |
| Alldocube iPlay 70 Mini Ultra | |
| Lenovo Legion Tab TB321FU | |
| Apple iPad Mini 7 (2024) | |
| Xiaomi Pad Mini | |
发言人
立体声扬声器通过线性的中音和高音产生非常好的音效,甚至在混音中也能听到较低的频率。外部音频设备可通过两个 USB-C 端口或蓝牙 5.4 连接。
Xiaomi Pad Mini audio analysis
(+) | speakers can play relatively loud (88 dB)
Bass 100 - 315 Hz
(±) | reduced bass - on average 14.5% lower than median
(±) | linearity of bass is average (11.6% delta to prev. frequency)
Mids 400 - 2000 Hz
(±) | higher mids - on average 6.1% higher than median
(+) | mids are linear (4.6% delta to prev. frequency)
Highs 2 - 16 kHz
(+) | balanced highs - only 4.2% away from median
(+) | highs are linear (4.2% delta to prev. frequency)
Overall 100 - 16.000 Hz
(±) | linearity of overall sound is average (15% difference to median)
Compared to same class
» 33% of all tested devices in this class were better, 3% similar, 64% worse
» The best had a delta of 7%, average was 20%, worst was 129%
Compared to all devices tested
» 21% of all tested devices were better, 4% similar, 75% worse
» The best had a delta of 4%, average was 23%, worst was 134%
Samsung Galaxy Tab A9 audio analysis
(+) | speakers can play relatively loud (86.6 dB)
Bass 100 - 315 Hz
(-) | nearly no bass - on average 26.5% lower than median
(±) | linearity of bass is average (10.1% delta to prev. frequency)
Mids 400 - 2000 Hz
(±) | higher mids - on average 6.9% higher than median
(+) | mids are linear (6.8% delta to prev. frequency)
Highs 2 - 16 kHz
(±) | higher highs - on average 7.2% higher than median
(+) | highs are linear (3.5% delta to prev. frequency)
Overall 100 - 16.000 Hz
(±) | linearity of overall sound is average (24.4% difference to median)
Compared to same class
» 76% of all tested devices in this class were better, 6% similar, 18% worse
» The best had a delta of 7%, average was 20%, worst was 129%
Compared to all devices tested
» 74% of all tested devices were better, 6% similar, 20% worse
» The best had a delta of 4%, average was 23%, worst was 134%
电池寿命 - 持久耐用,可在 1 小时内完成充电
耗电量
7500 毫安时电池的充电功率可达 67 瓦。使用小米电源装置,一个完整的充电周期大约需要一个小时。甚至还支持 18 瓦的反向充电。
| Off / Standby | |
| Idle | |
| Load |
|
Key:
min: | |
| Xiaomi Pad Mini 7500 mAh | Apple iPad Mini 7 (2024) 5078 mAh | Alldocube iPlay 70 Mini Ultra 7300 mAh | Lenovo Legion Tab TB321FU 6550 mAh | Samsung Galaxy Tab A9 5100 mAh | Average Mediatek Dimensity 9400+ | Average of class Tablet | |
|---|---|---|---|---|---|---|---|
| Power Consumption | 5% | -9% | 21% | 30% | -23% | -24% | |
| Idle Minimum * (Watt) | 1.08 | 0.95 12% | 1.36 -26% | 1.4 -30% | 0.7 35% | 2.21 ? -105% | 2.21 ? -105% |
| Idle Average * (Watt) | 4.13 | 3.76 9% | 4.16 -1% | 1.9 54% | 2.94 29% | 4.02 ? 3% | 4.01 ? 3% |
| Idle Maximum * (Watt) | 4.15 | 3.79 9% | 4.21 -1% | 2.6 37% | 3.03 27% | 4.17 ? -0% | 4.4 ? -6% |
| Load Average * (Watt) | 10.69 | 6.75 37% | 6.6 38% | 7.49 30% | 10.2 ? 5% | 8.92 ? 17% | |
| Load Maximum * (Watt) | 11.08 | 15.56 -40% | 10.4 6% | 8.02 28% | 13.2 ? -19% | 14.4 ? -30% |
* ... smaller is better
功耗:Geekbench (150 cd/m²)
功耗:GFXbench (150 cd/m²)
电池寿命
虽然小米 Pad Mini 的功耗有时明显高于对比设备,但在电池续航时间方面却不占优势。在 WLAN 测试中,这款小型平板电脑的续航时间接近 20 小时,甚至超过了 Apple iPad Mini 7甩在了后面。
Notebookcheck 总体评分
在测试中,小米 Pad Mini 给人留下了深刻印象,它是一款设备齐全、功能强大的平板电脑,与Apple iPad Mini 7 等竞争对手相比,小米 Pad Mini 难占上风。不过,由于这款 8.8 英寸的小米平板电脑尚未在欧盟正式发售,因此在测试时也很难买到。
Xiaomi Pad Mini
- 10/24/2025 v8
Manuel Masiero
 Total Sustainability Score:
 可比较的替代品
Image | Model / Review | Price | Weight | Drive | Display |
|---|---|---|---|---|---|
1. 88.5%  | Xiaomi Pad Mini Mediatek Dimensity 9400+ ⎘ ARM Immortalis-G925 MC12 ⎘ 12 GB Memory, 512 GB UFS 4.x | Amazon: 1. $199.87 XIAOMI Redmi Pad 2 9.7" Only... 2. $425.00 XIAOMI Pad 8 Ai WiFi Version... 3. $377.50 XIAOMI Pad 8 Ai WiFi Version... List Price: 500€ | 326 g | 512 GB UFS 4.1 Flash | 8.80" 3008x1880 403 PPI TFT-LCD |
2. 86.6%  | Apple iPad Mini 7 (2024) Apple A17 Pro ⎘ Apple A17 Pro GPU ⎘ 8 GB Memory, 512 GB SSD | Amazon: List Price: 1149€ | 297 g | Apple 512GB NVMe | 8.30" 2266x1488 327 PPI IPS |
3. 84%  | Alldocube iPlay 70 Mini Ultra Qualcomm Snapdragon 7+ Gen 3 ⎘ Qualcomm Adreno 732 ⎘ 12 GB Memory, 256 GB UFS 3.1 | Amazon: List Price: 400€ | 335 g | 256 GB UFS 3.1 Flash | 8.80" 2560x1600 343 PPI LTPS |
4. 86.5%  | Lenovo Legion Tab TB321FU Qualcomm Snapdragon 8 Gen 3 ⎘ Qualcomm Adreno 750 ⎘ 12 GB Memory, 256 GB UFS 4.x | Amazon: List Price: 599€ | 350 g | 256 GB UFS 4.0 Flash | 8.80" 2560x1600 343 PPI LTPS |
5. 84.1% v7 (old)  | Samsung Galaxy Tab A9 Mediatek Helio G99 ⎘ ARM Mali-G57 MP2 ⎘ 4 GB Memory, 64 GB UFS 2.2 | Amazon: List Price: 179€ | 332 g | 64 GB UFS 2.2 Flash | 8.70" 1340x800 179 PPI LCD TFT |
Transparency
The selection of devices to be reviewed is made by our editorial team. The test sample was provided to the author as a loan by the manufacturer or retailer for the purpose of this review. The lender had no influence on this review, nor did the manufacturer receive a copy of this review before publication. There was no obligation to publish this review. As an independent media company, Notebookcheck is not subjected to the authority of manufacturers, retailers or publishers.
This is how Notebookcheck is testing
Every year, Notebookcheck independently reviews hundreds of laptops and smartphones using standardized procedures to ensure that all results are comparable. We have continuously developed our test methods for around 20 years and set industry standards in the process. In our test labs, high-quality measuring equipment is utilized by experienced technicians and editors. These tests involve a multi-stage validation process. Our complex rating system is based on hundreds of well-founded measurements and benchmarks, which maintains objectivity. Further information on our test methods can be found here.
