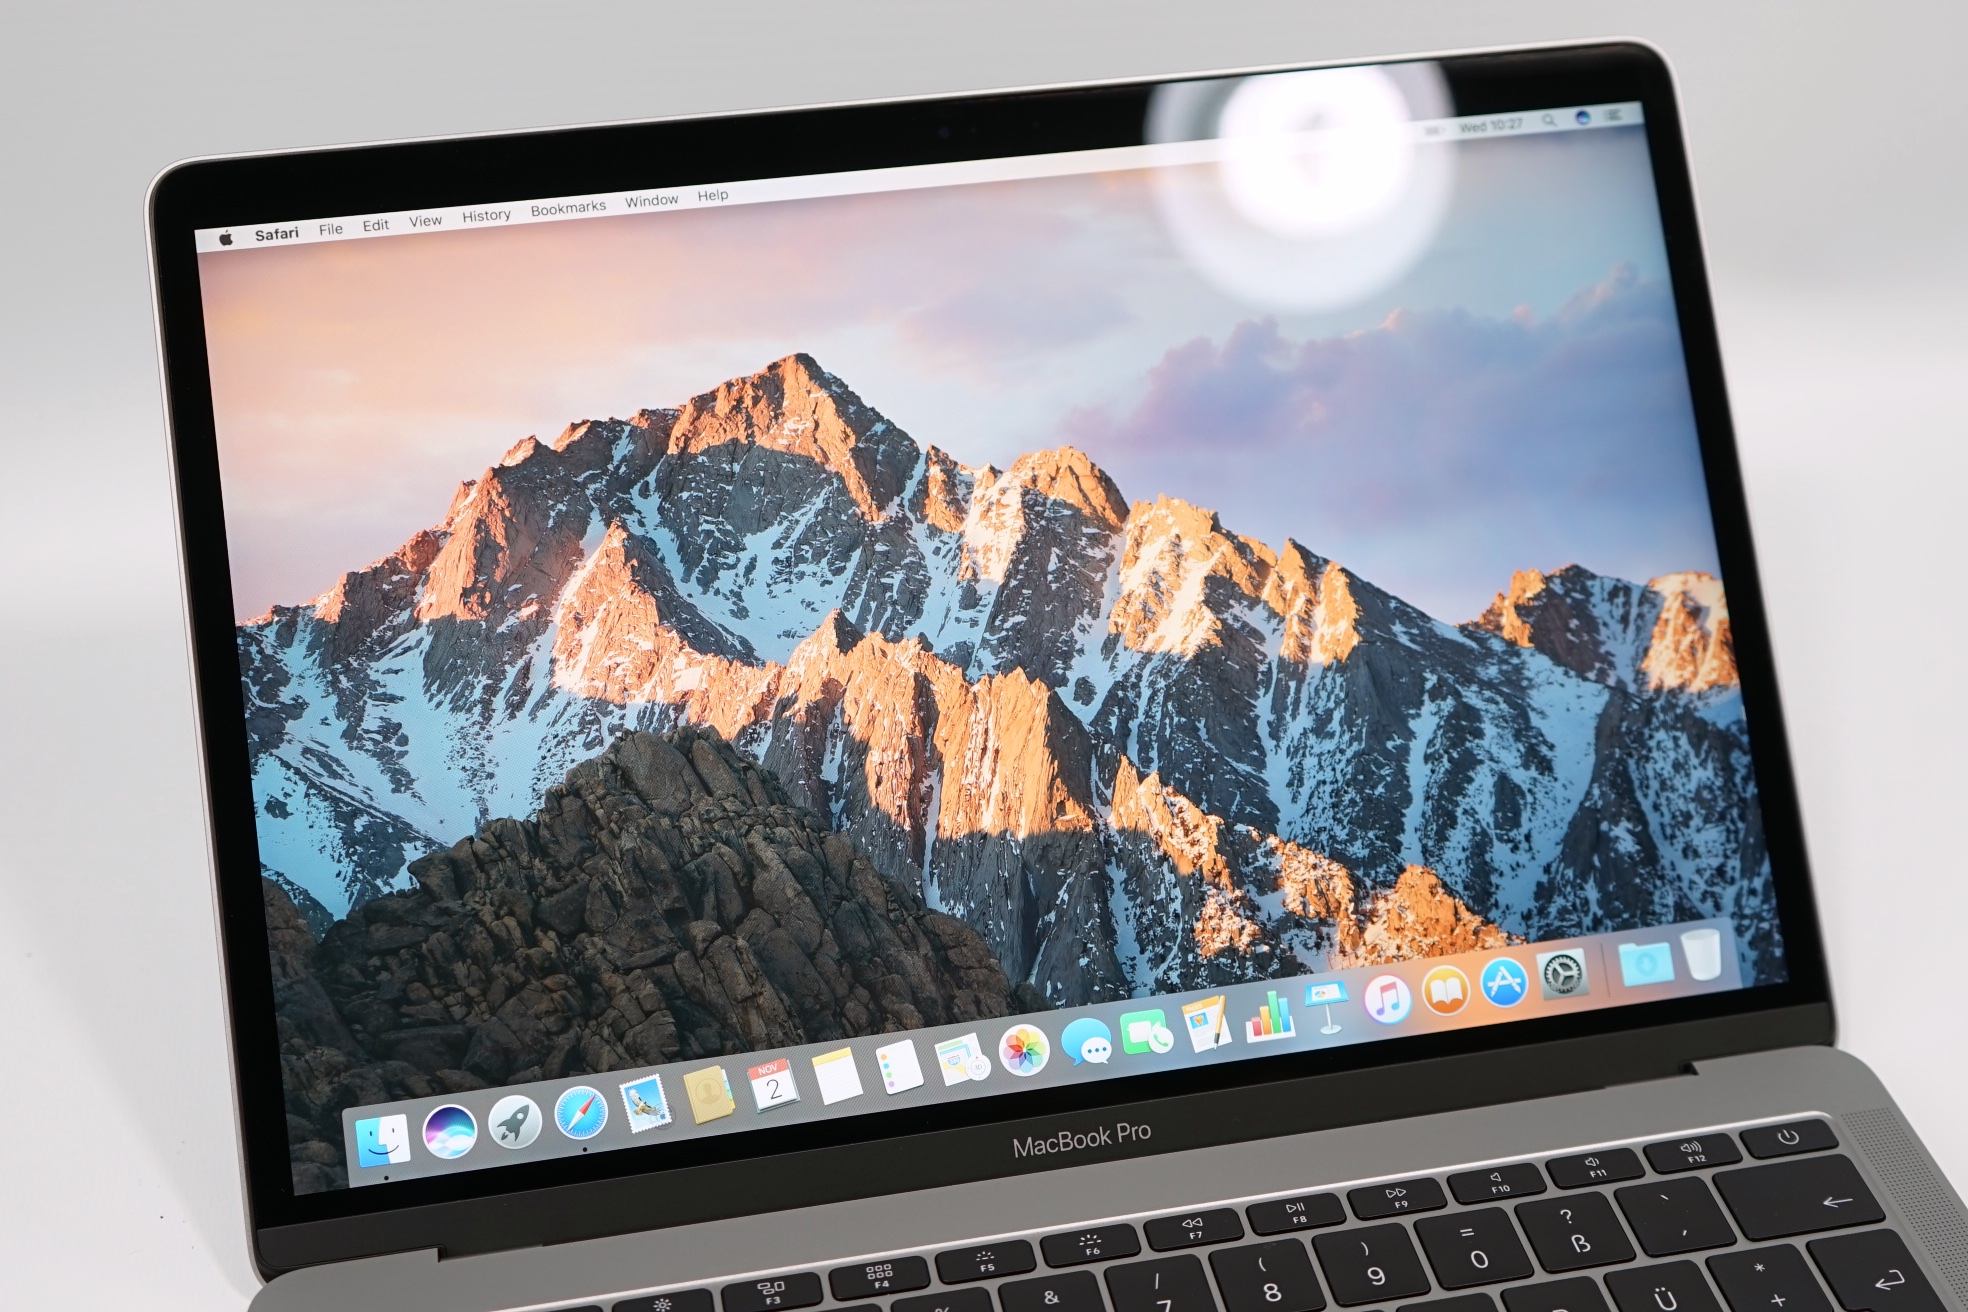
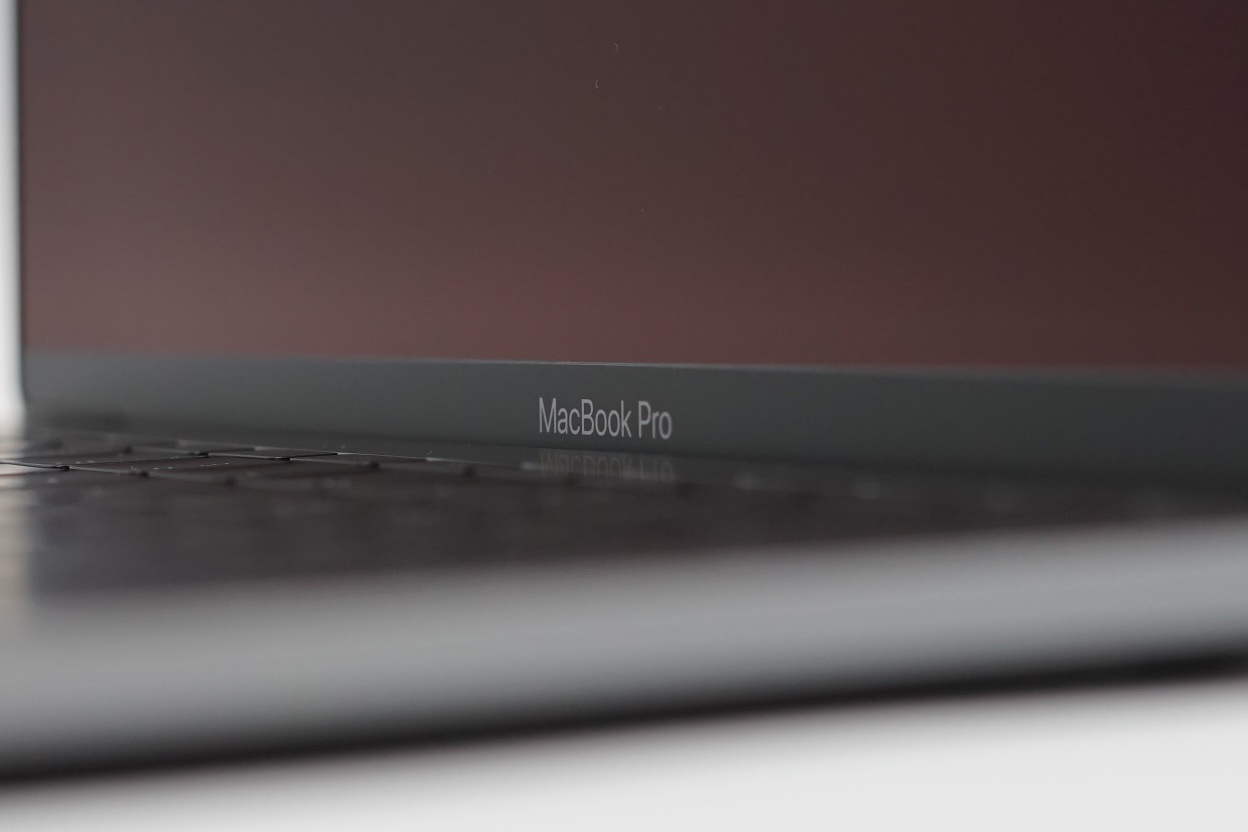
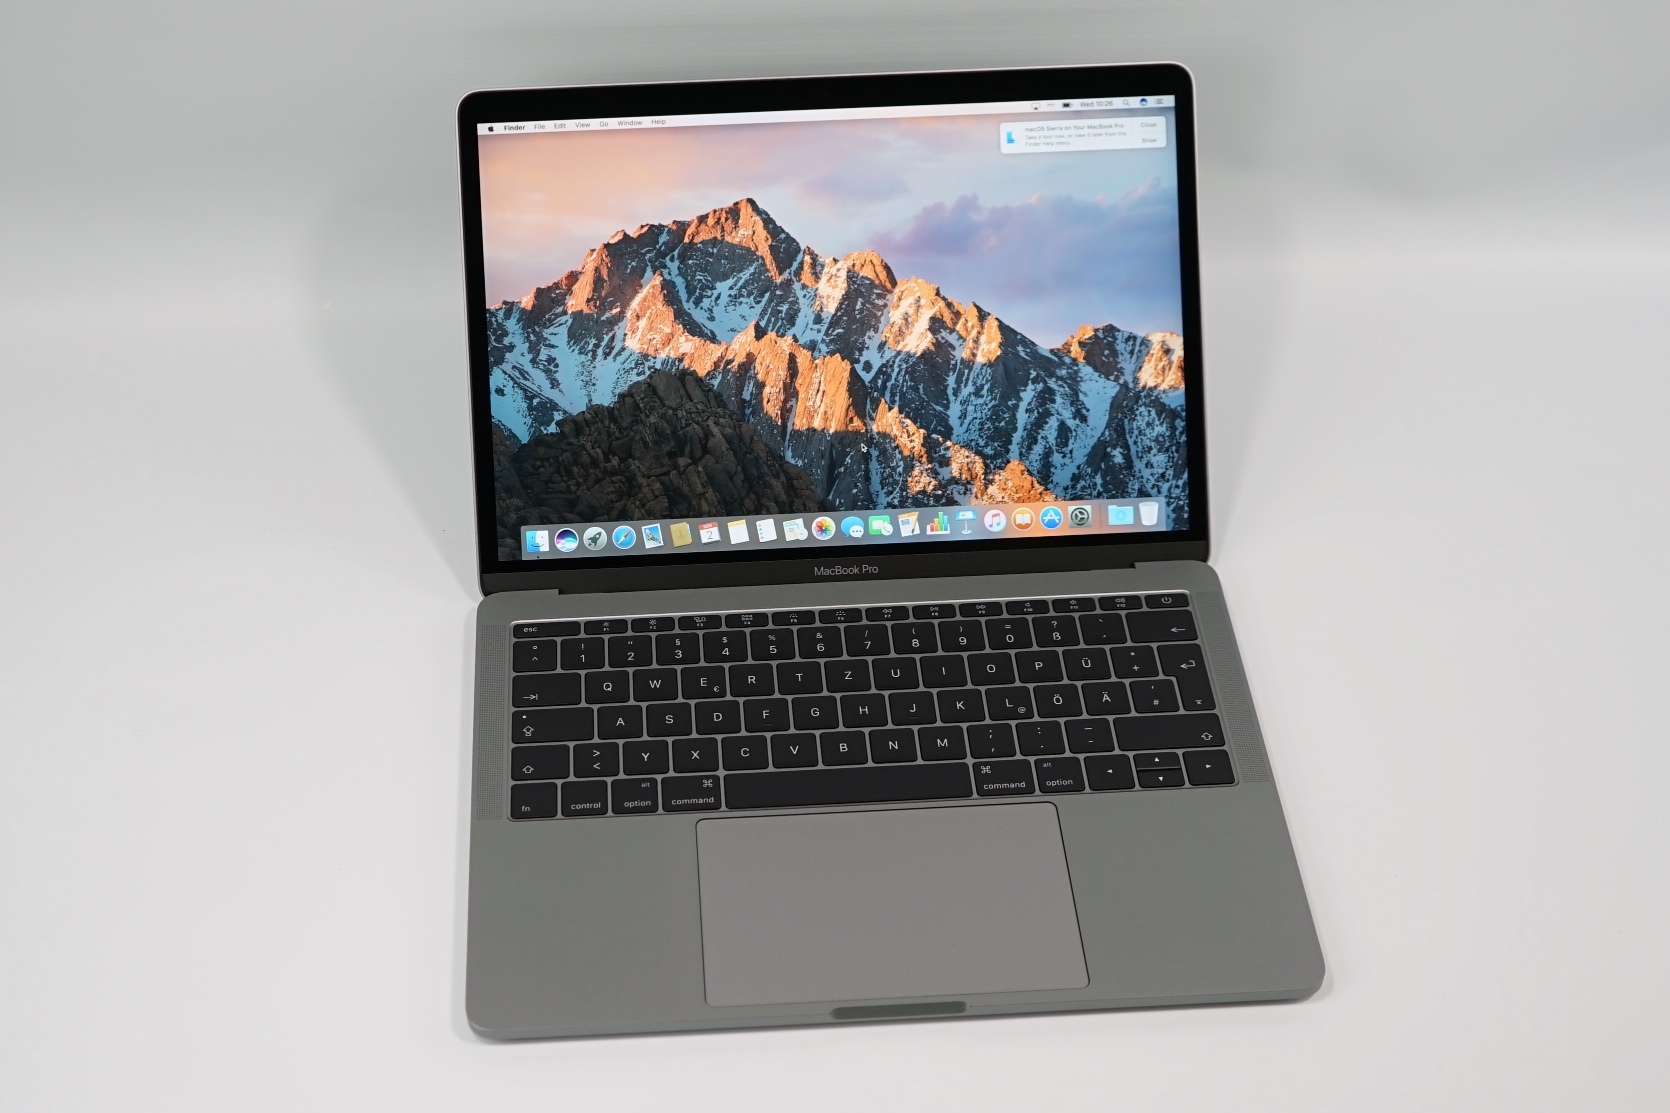
Apple MacBook Pro 13 (Mid 2017, i5, 无Touch Bar) 简短评测
Apple MacBook Pro 13 2017 (MacBook Pro 13 2017 Series)
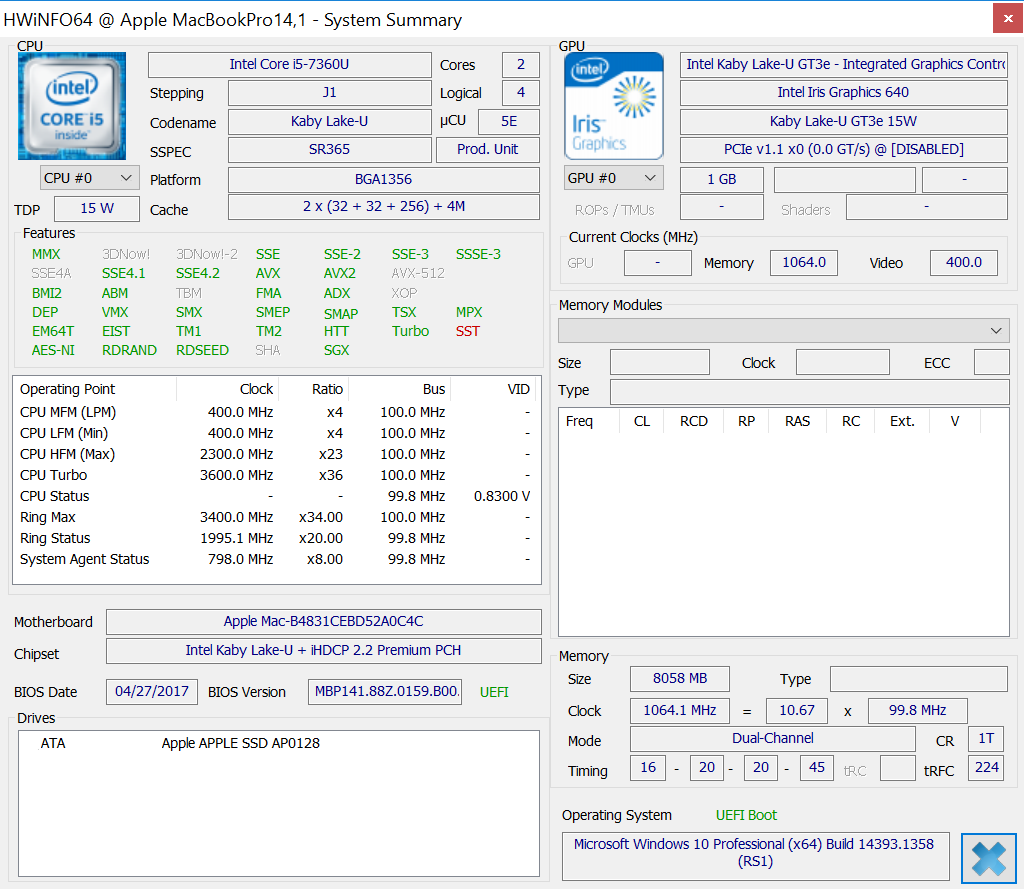
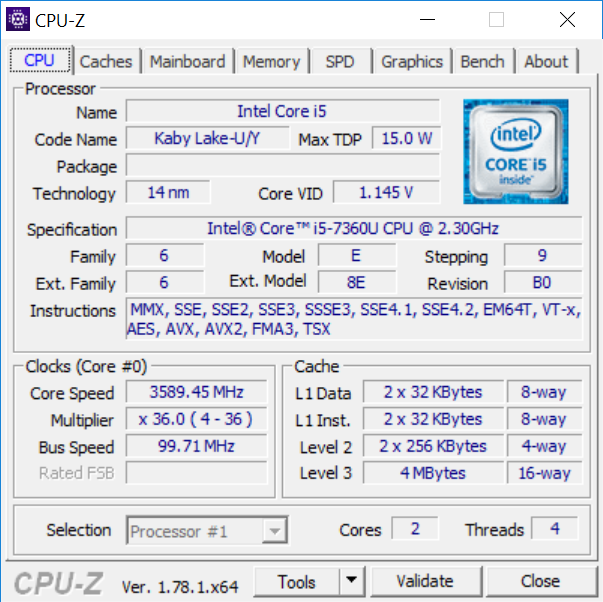
Processor
Intel Core i5-7360U 2c/4t 2 x 2.3 - 3.6 GHz, Kaby Lake
Graphics adapter
Intel Iris Plus Graphics 640, Core: 950 MHz, RAM: 1066 MHz
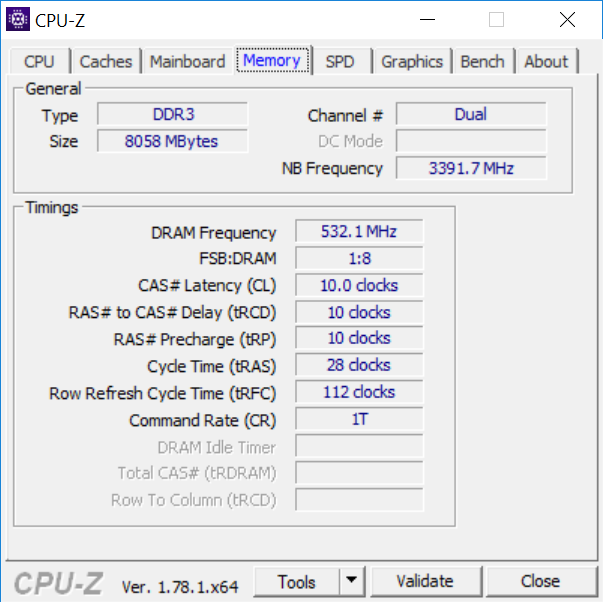
Memory
8 GB
, LPDDR3-2133, 双通道
Display
13.30 inch 16:10, 2560 x 1600 pixel 227 PPI, APPA033, IPS, glossy: yes
Mainboard
Intel Kaby Lake-U iHDCP 2.2 Premium PCH
Storage
Apple SSD AP0128, 128 GB
Weight
1.37 kg
Price
1499 Euro
Links
Note: The manufacturer may use components from different suppliers including display panels, drives or memory sticks with similar specifications.
| |||||||||||||||||||||||||
APPA033 tested with X-Rite i1Pro 2
Maximum: 588 cd/m² (Nits) Average: 561.2 cd/m² Minimum: 4.8 cd/m²Brightness Distribution: 92 %
Center on Battery: 588 cd/m²
Contrast: 1307:1 (Black: 0.45 cd/m²)
ΔE ColorChecker Calman: 1.7 | ∀{0.5-29.43 Ø4.71}
ΔE Greyscale Calman: 1.9 | ∀{0.09-98 Ø4.96}
99.94% sRGB (Argyll 1.6.3 3D)
77.92% AdobeRGB 1998 (Argyll 1.6.3 3D)
87.1% AdobeRGB 1998 (Argyll 3D)
99.9% sRGB (Argyll 3D)
99.2% Display P3 (Argyll 3D)
Gamma: 2.33
CCT: 6738 K
| Apple MacBook Pro 13 2017 APPA033, , 2560x1600, 13.3" | Apple MacBook Pro 13 2016 APPA034, , 2560x1600, 13.3" | Apple MacBook Pro 13 2017 Touchbar i5 APPA034, , 2560x1600, 13.3" | Lenovo ThinkPad X1 Carbon 2017-20HR0021GE B140HAN03_1, , 1920x1080, 14" | Razer Blade Stealth QHD i7-7500U Sharp SHP142F (LQ125T1JW02), , 2560x1440, 12.5" | Dell XPS 13 9360 QHD+ i7 Sharp SHP144A, , 3200x1800, 13.3" | |
|---|---|---|---|---|---|---|
| Display | -1% | -1% | -26% | -18% | -25% | |
| Display P3 Coverage (%) | 99.2 | 97.1 -2% | 98.6 -1% | 61.6 -38% | 68.7 -31% | 62.8 -37% |
| sRGB Coverage (%) | 99.9 | 99.8 0% | 100 0% | 87.6 -12% | 95.8 -4% | 89.4 -11% |
| AdobeRGB 1998 Coverage (%) | 87.1 | 86.7 0% | 86.5 -1% | 62.6 -28% | 69.9 -20% | 64.6 -26% |
| Response Times | -45% | -15% | -9% | -1% | -2% | |
| Response Time Grey 50% / Grey 80% * (ms) | 42.8 ? | 47.2 ? -10% | 48 ? -12% | 48 ? -12% | 37 ? 14% | 43.6 ? -2% |
| Response Time Black / White * (ms) | 28.8 ? | 51.6 ? -79% | 33.6 ? -17% | 30.4 ? -6% | 33.4 ? -16% | 29.2 ? -1% |
| PWM Frequency (Hz) | 119000 ? | 200 ? | ||||
| Screen | -3% | 15% | -42% | -48% | -43% | |
| Brightness middle (cd/m²) | 588 | 600 2% | 551 -6% | 278 -53% | 402 -32% | 396.2 -33% |
| Brightness (cd/m²) | 561 | 564 1% | 514 -8% | 271 -52% | 382 -32% | 357 -36% |
| Brightness Distribution (%) | 92 | 89 -3% | 88 -4% | 91 -1% | 88 -4% | 84 -9% |
| Black Level * (cd/m²) | 0.45 | 0.57 -27% | 0.48 -7% | 0.16 64% | 0.45 -0% | 0.266 41% |
| Contrast (:1) | 1307 | 1053 -19% | 1148 -12% | 1738 33% | 893 -32% | 1489 14% |
| Colorchecker dE 2000 * | 1.7 | 1.5 12% | 0.8 53% | 4.5 -165% | 3.6 -112% | 3.9 -129% |
| Colorchecker dE 2000 max. * | 3.5 | 2.9 17% | 1.4 60% | 8.4 -140% | 7.5 -114% | 7.58 -117% |
| Greyscale dE 2000 * | 1.9 | 2 -5% | 1 47% | 3.2 -68% | 4.3 -126% | 4.16 -119% |
| Gamma | 2.33 94% | 2.27 97% | 2.16 102% | 2.02 109% | 2.1 105% | 2.31 95% |
| CCT | 6738 96% | 6855 95% | 6672 97% | 7042 92% | 6572 99% | 6514 100% |
| Color Space (Percent of AdobeRGB 1998) (%) | 77.92 | 77 -1% | 57 -27% | 62.3 -20% | 57.5 -26% | |
| Color Space (Percent of sRGB) (%) | 99.94 | 92 -8% | 87.5 -12% | 95.7 -4% | 88.7 -11% | |
| Total Average (Program / Settings) | -16% /
-8% | -0% /
7% | -26% /
-34% | -22% /
-36% | -23% /
-33% |
* ... smaller is better

Cinebench R15 CPU Multi 64 Bit
Noise level
| Idle |
| 30.2 / 30.2 / 30.2 dB(A) |
| Load |
| 32.9 / 39.3 dB(A) |
 | ||
30 dB silent 40 dB(A) audible 50 dB(A) loud |
||
min: | ||
(±) The average temperature for the upper side under maximal load is 37.7 °C / 100 F, compared to the average of 30.8 °C / 87 F for the devices in the class Subnotebook.
(±) The maximum temperature on the upper side is 43.5 °C / 110 F, compared to the average of 35.9 °C / 97 F, ranging from 21.4 to 59 °C for the class Subnotebook.
(±) The bottom heats up to a maximum of 40.6 °C / 105 F, compared to the average of 39.2 °C / 103 F
(+) In idle usage, the average temperature for the upper side is 26.1 °C / 79 F, compared to the device average of 30.8 °C / 87 F.
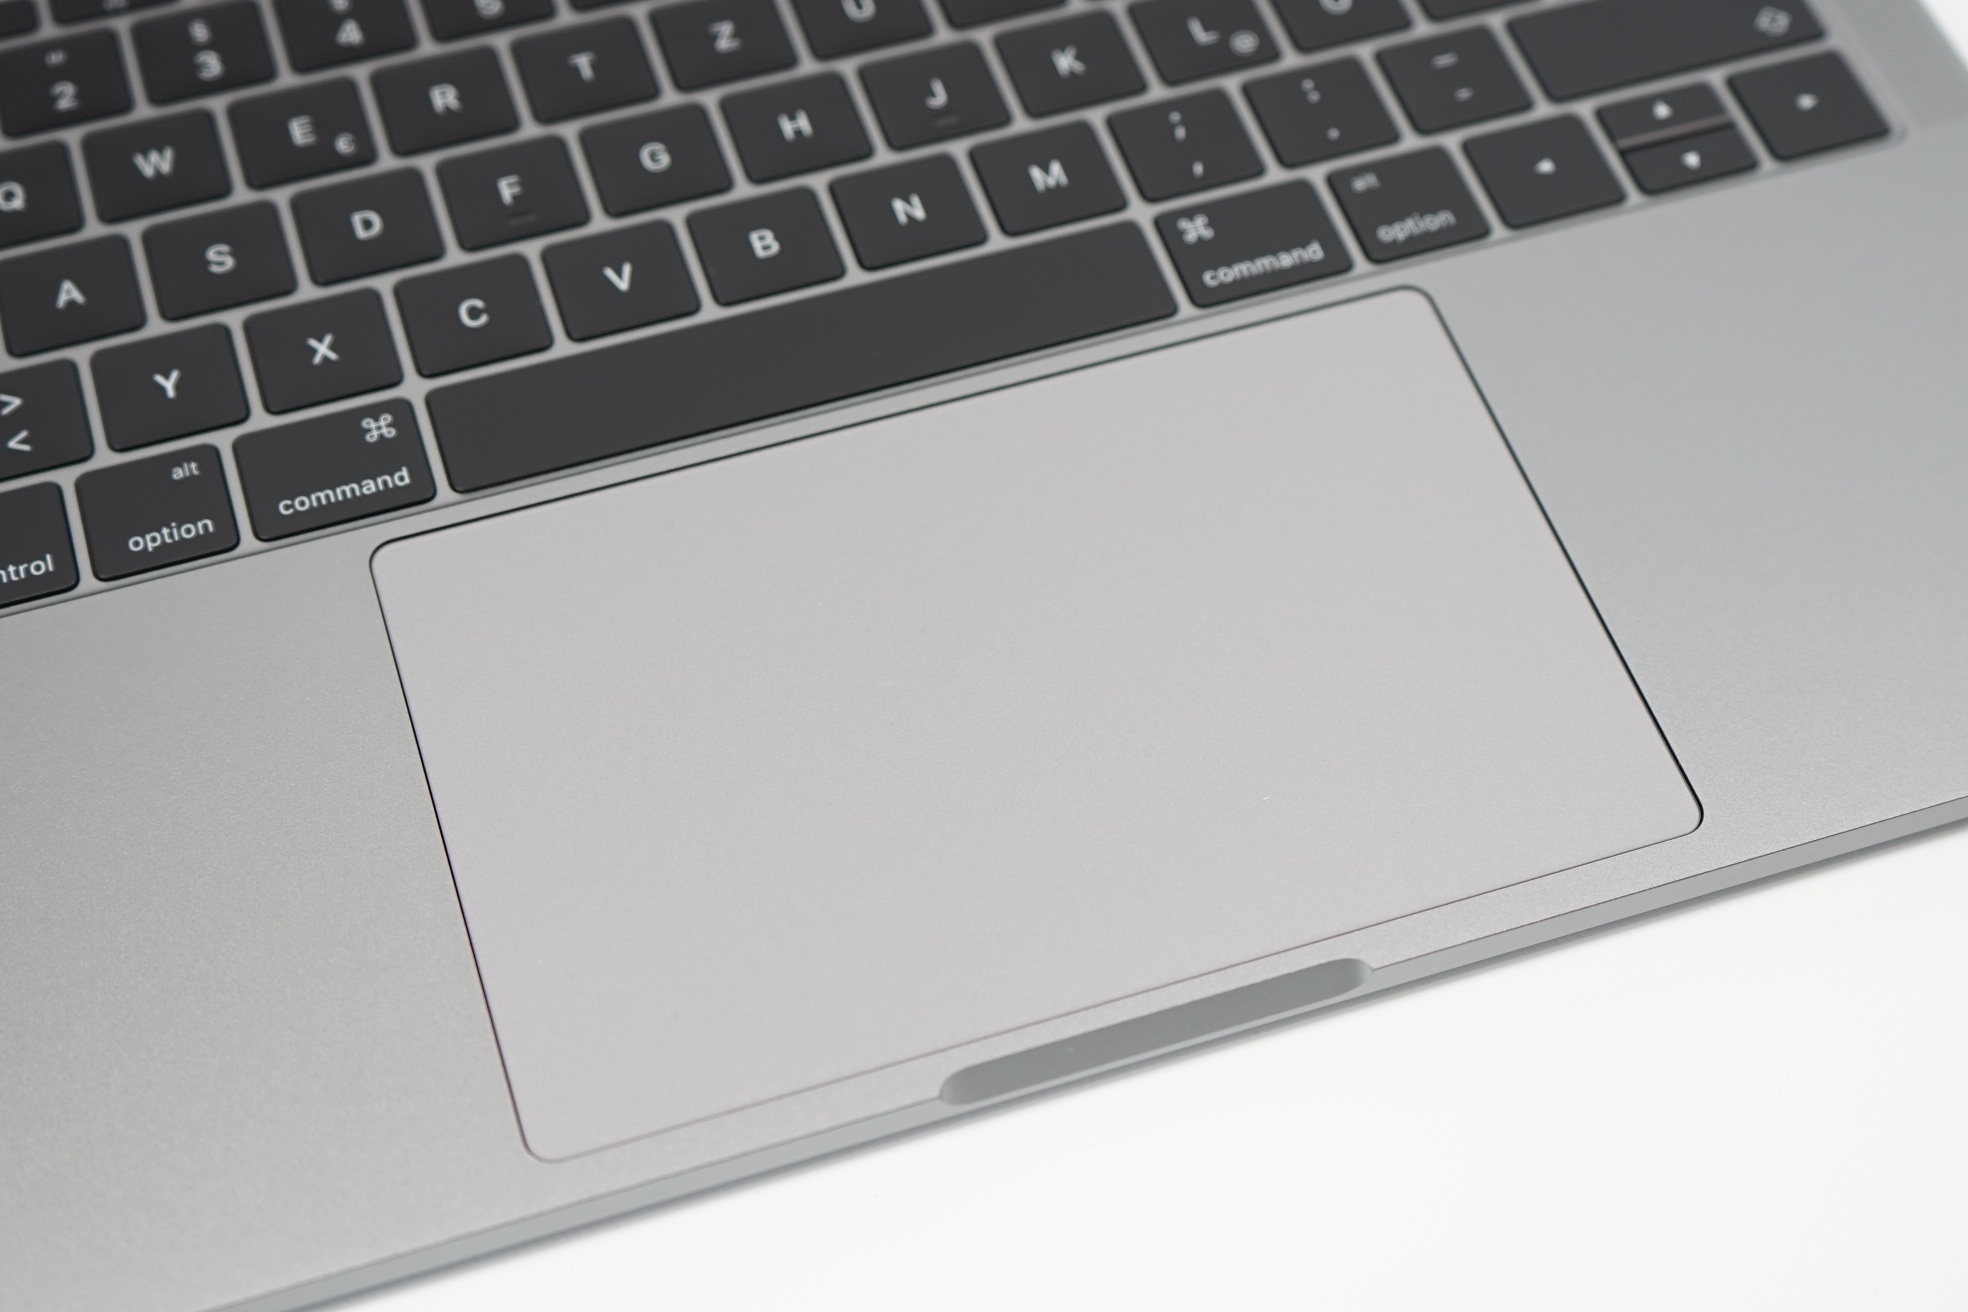
(+) The palmrests and touchpad are reaching skin temperature as a maximum (32.7 °C / 90.9 F) and are therefore not hot.
(-) The average temperature of the palmrest area of similar devices was 28.2 °C / 82.8 F (-4.5 °C / -8.1 F).
(±) The maximum temperature on the upper side is 43.5 °C / 110 F, compared to the average of 35.9 °C / 97 F, ranging from 21.4 to 59 °C for the class Subnotebook.
(±) The bottom heats up to a maximum of 40.6 °C / 105 F, compared to the average of 39.2 °C / 103 F
(+) In idle usage, the average temperature for the upper side is 26.1 °C / 79 F, compared to the device average of 30.8 °C / 87 F.
(+) The palmrests and touchpad are reaching skin temperature as a maximum (32.7 °C / 90.9 F) and are therefore not hot.
(-) The average temperature of the palmrest area of similar devices was 28.2 °C / 82.8 F (-4.5 °C / -8.1 F).
| Apple MacBook Pro 13 2017 i5-7360U, Iris Plus Graphics 640, 54.5 Wh | Apple MacBook Pro 13 2016 6360U, Iris Graphics 540, 54 Wh | Dell XPS 13 9360 QHD+ i7 i7-7500U, HD Graphics 620, 60 Wh | Apple MacBook Pro 13 2017 Touchbar i5 i5-7267U, Iris Plus Graphics 650, 49.2 Wh | Apple MacBook Pro 15 2017 (2.8 GHz, 555) i7-7700HQ, Radeon Pro 555, 76 Wh | Lenovo ThinkPad X1 Carbon 2017-20HR0021GE i5-7200U, HD Graphics 620, 57 Wh | |
|---|---|---|---|---|---|---|
| Battery runtime | 0% | -25% | -24% | -6% | -20% | |
| WiFi v1.3 (h) | 11.4 | 11.4 0% | 8.6 -25% | 8.7 -24% | 10.7 -6% | 9.1 -20% |
| Witcher 3 ultra (h) | 1.5 |
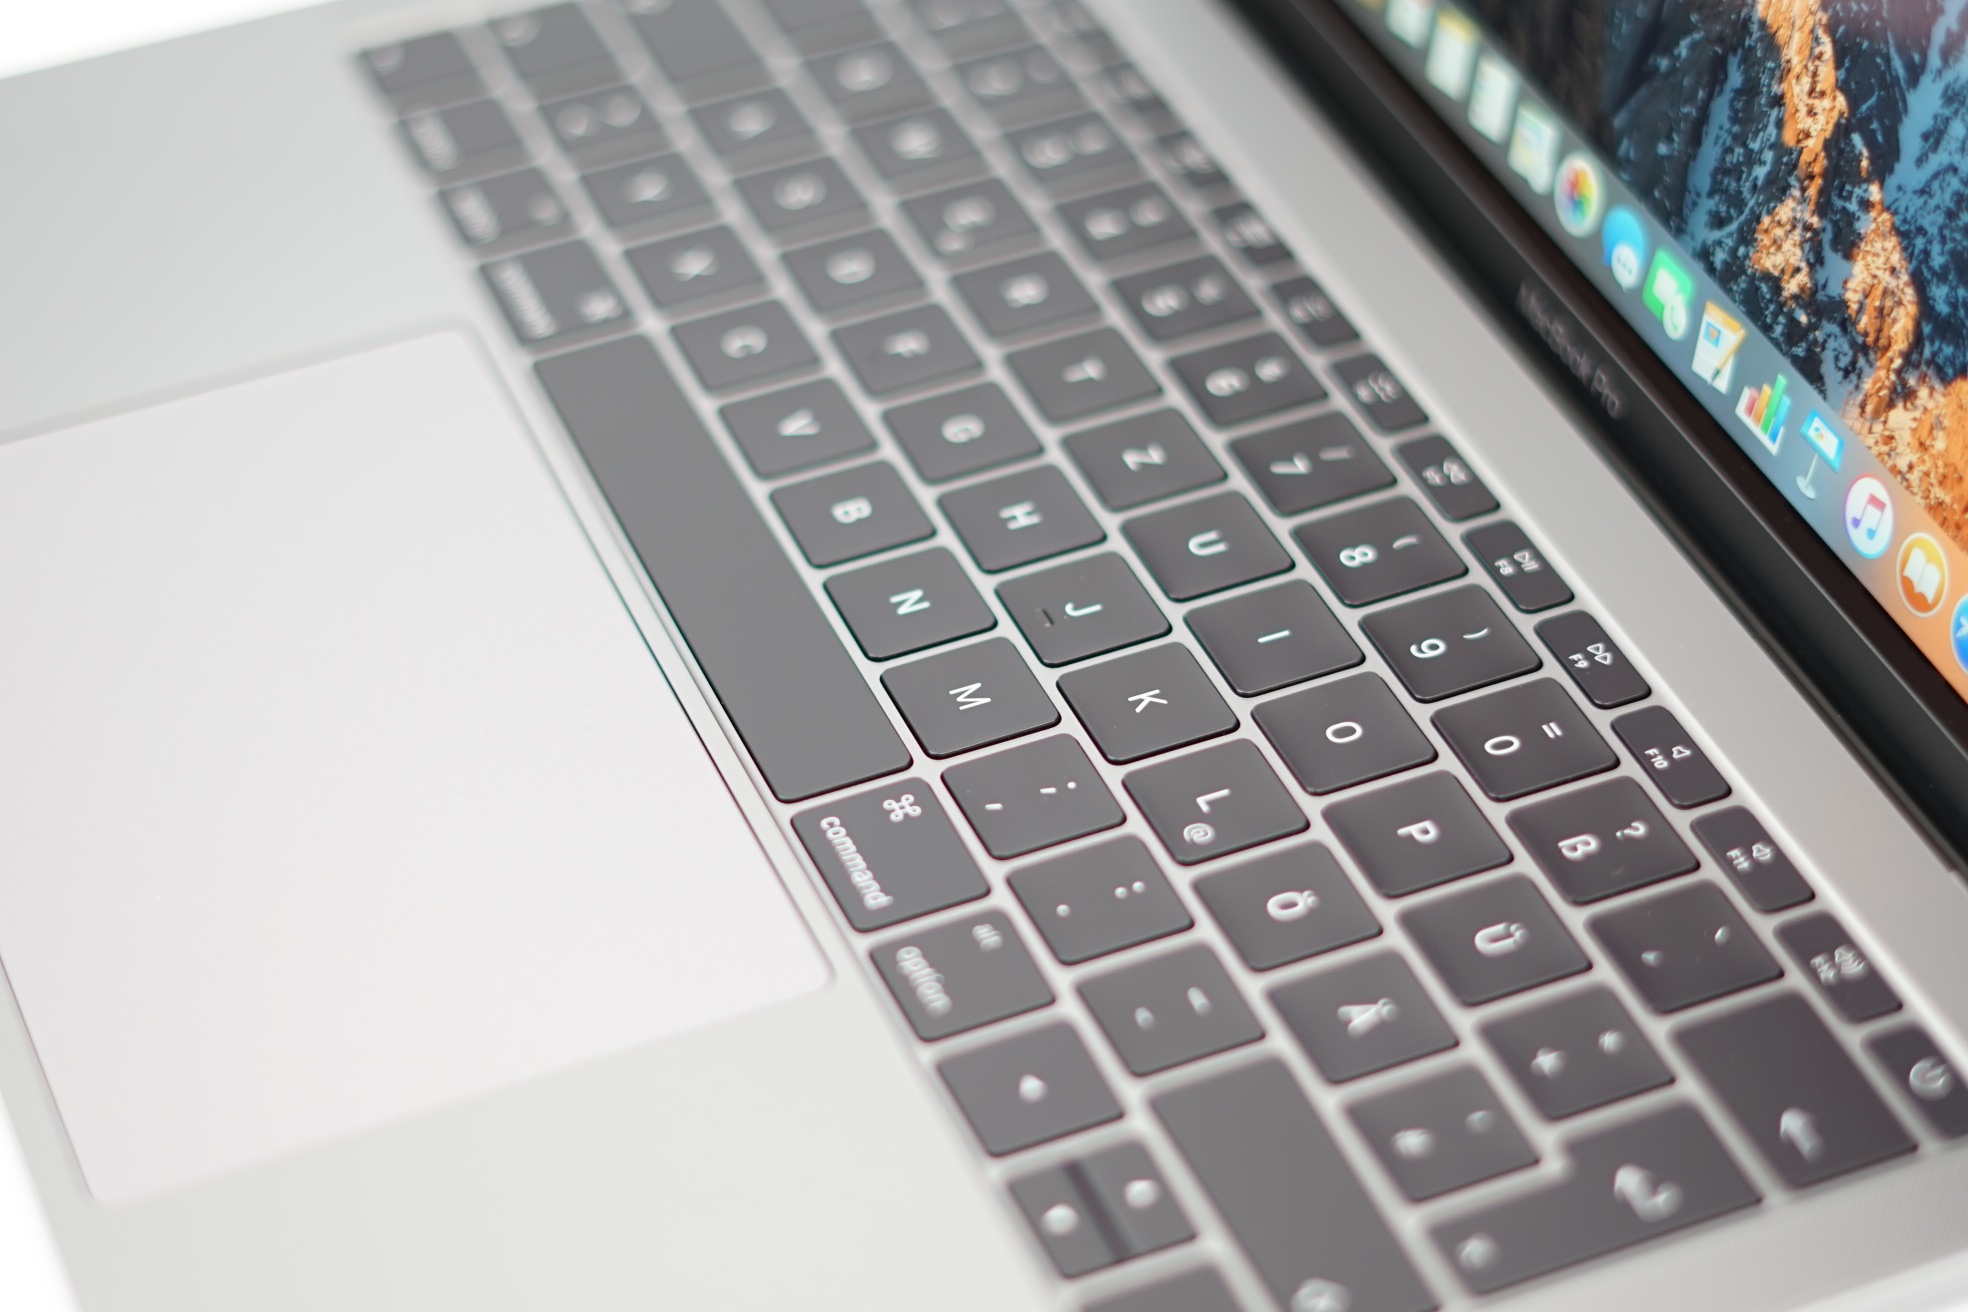
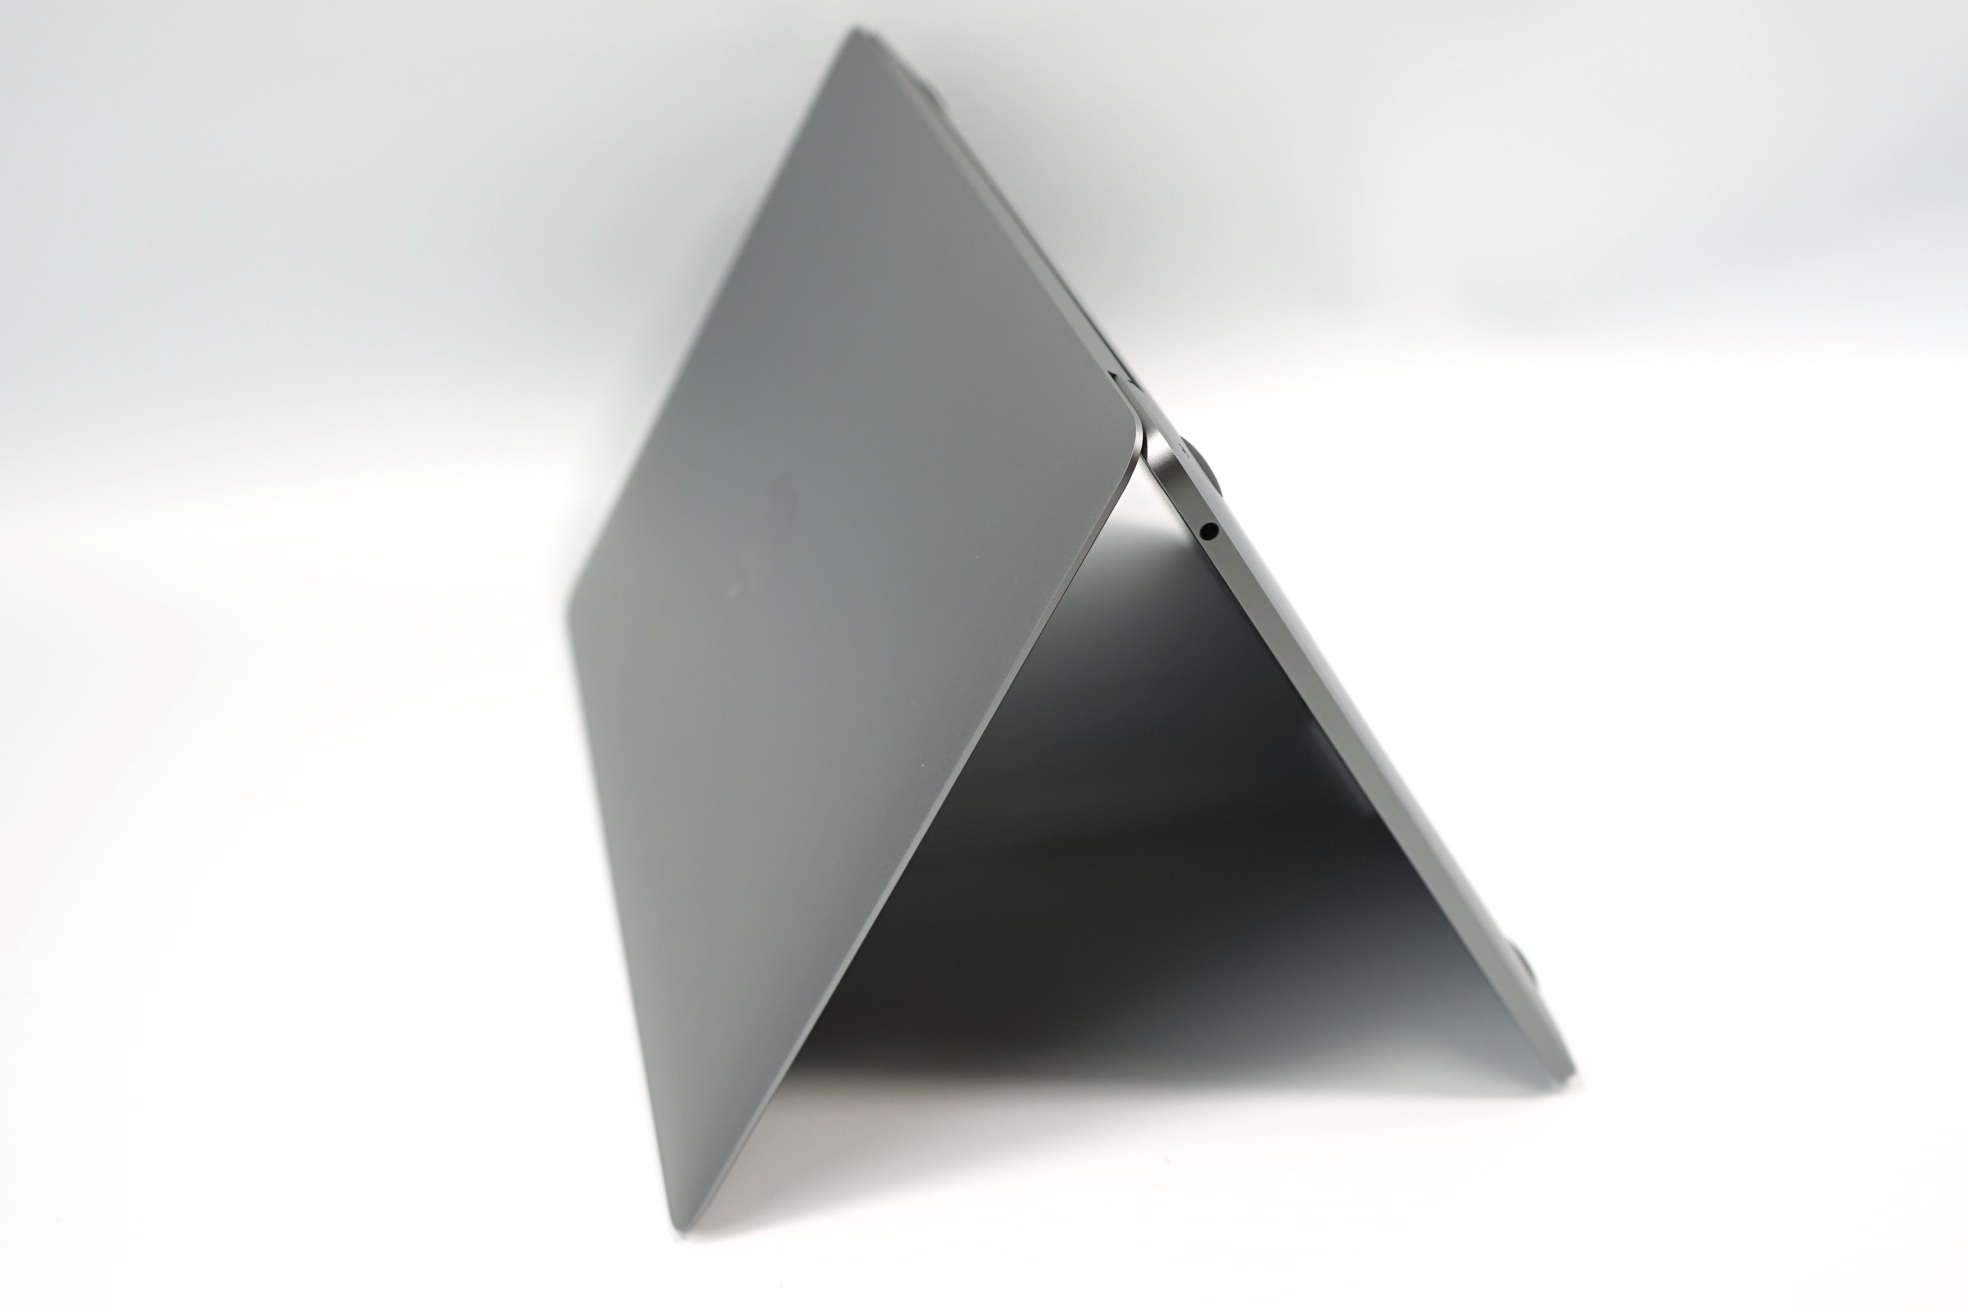
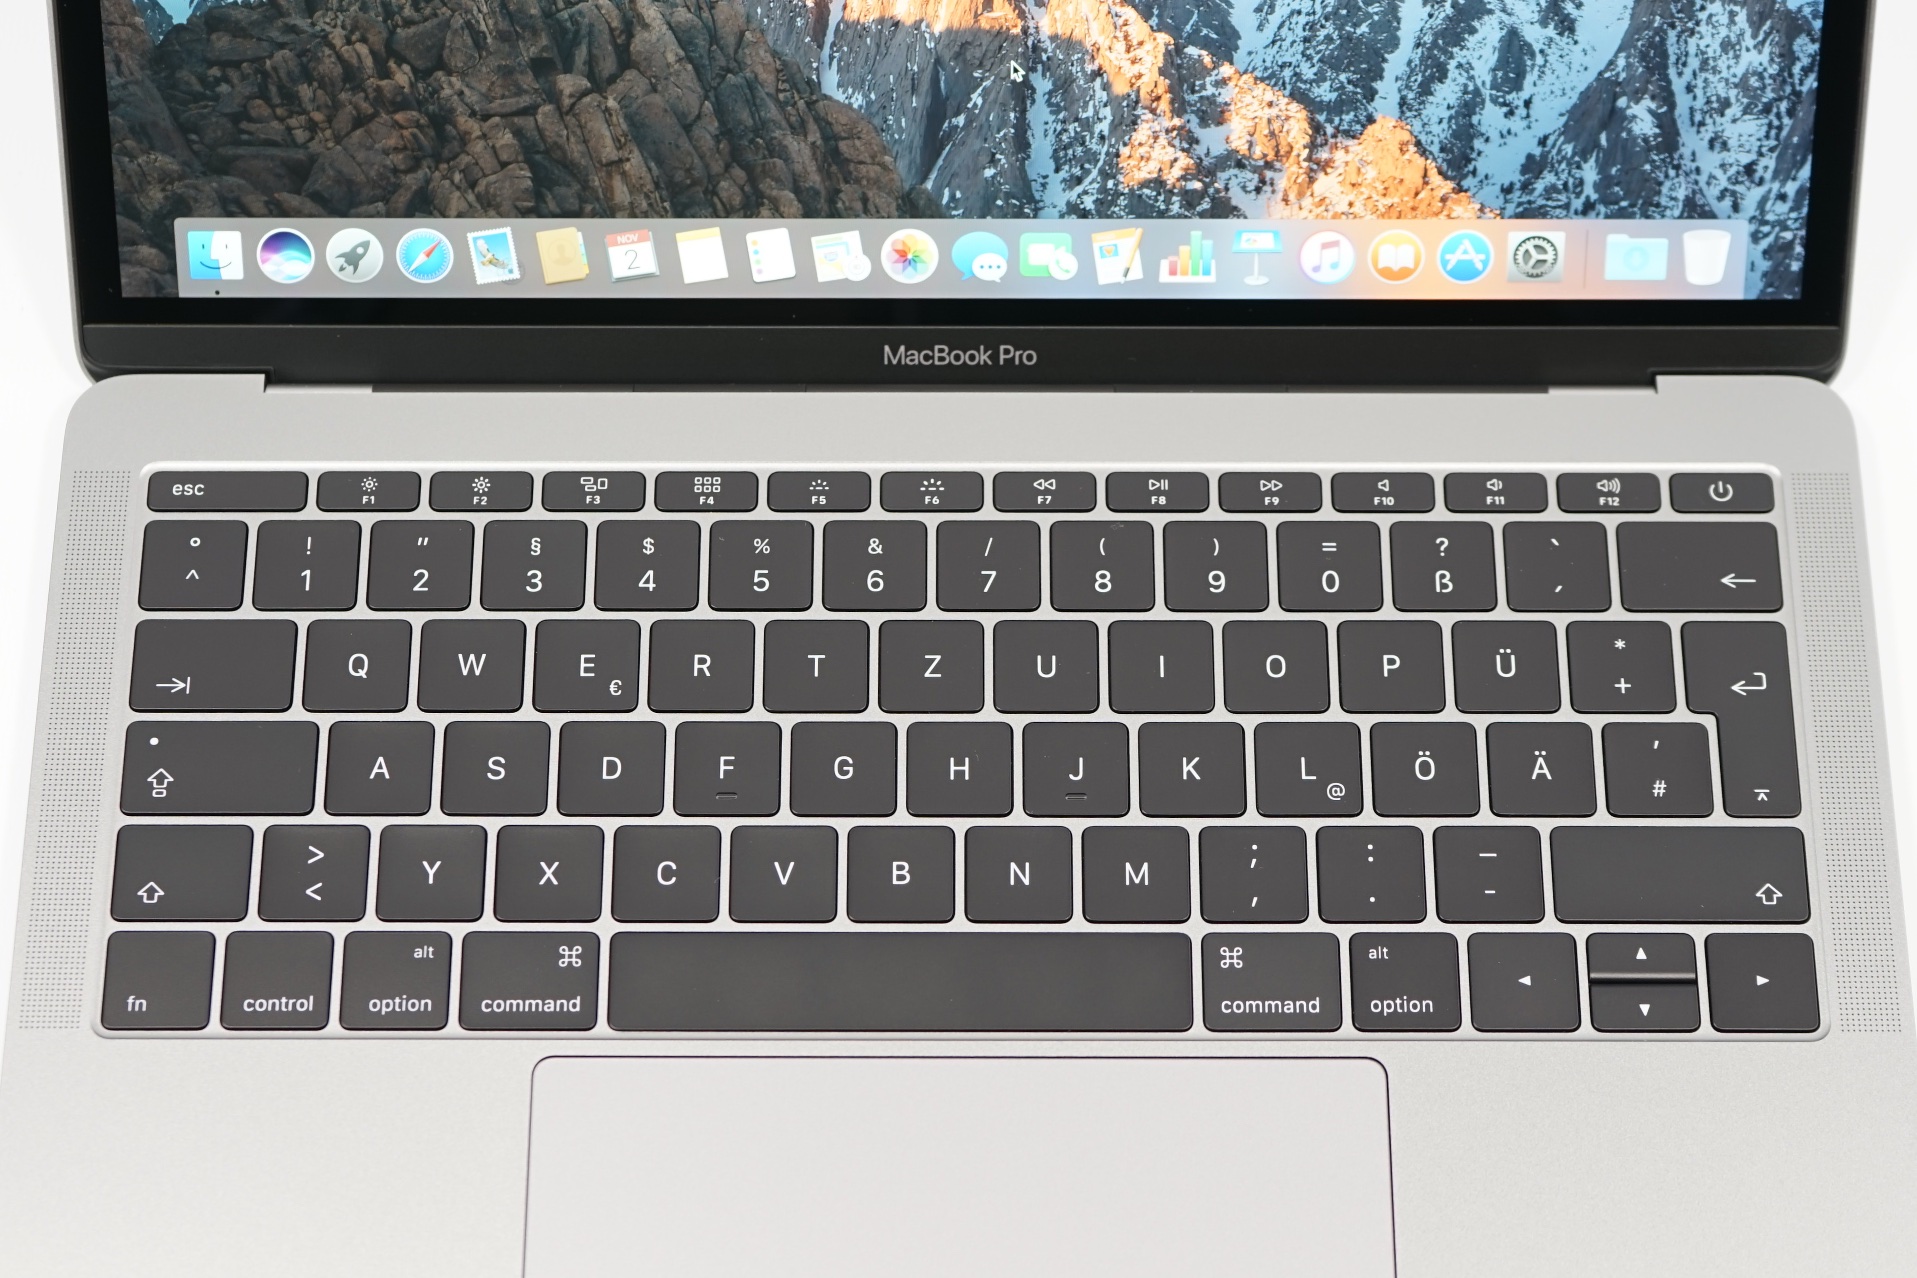
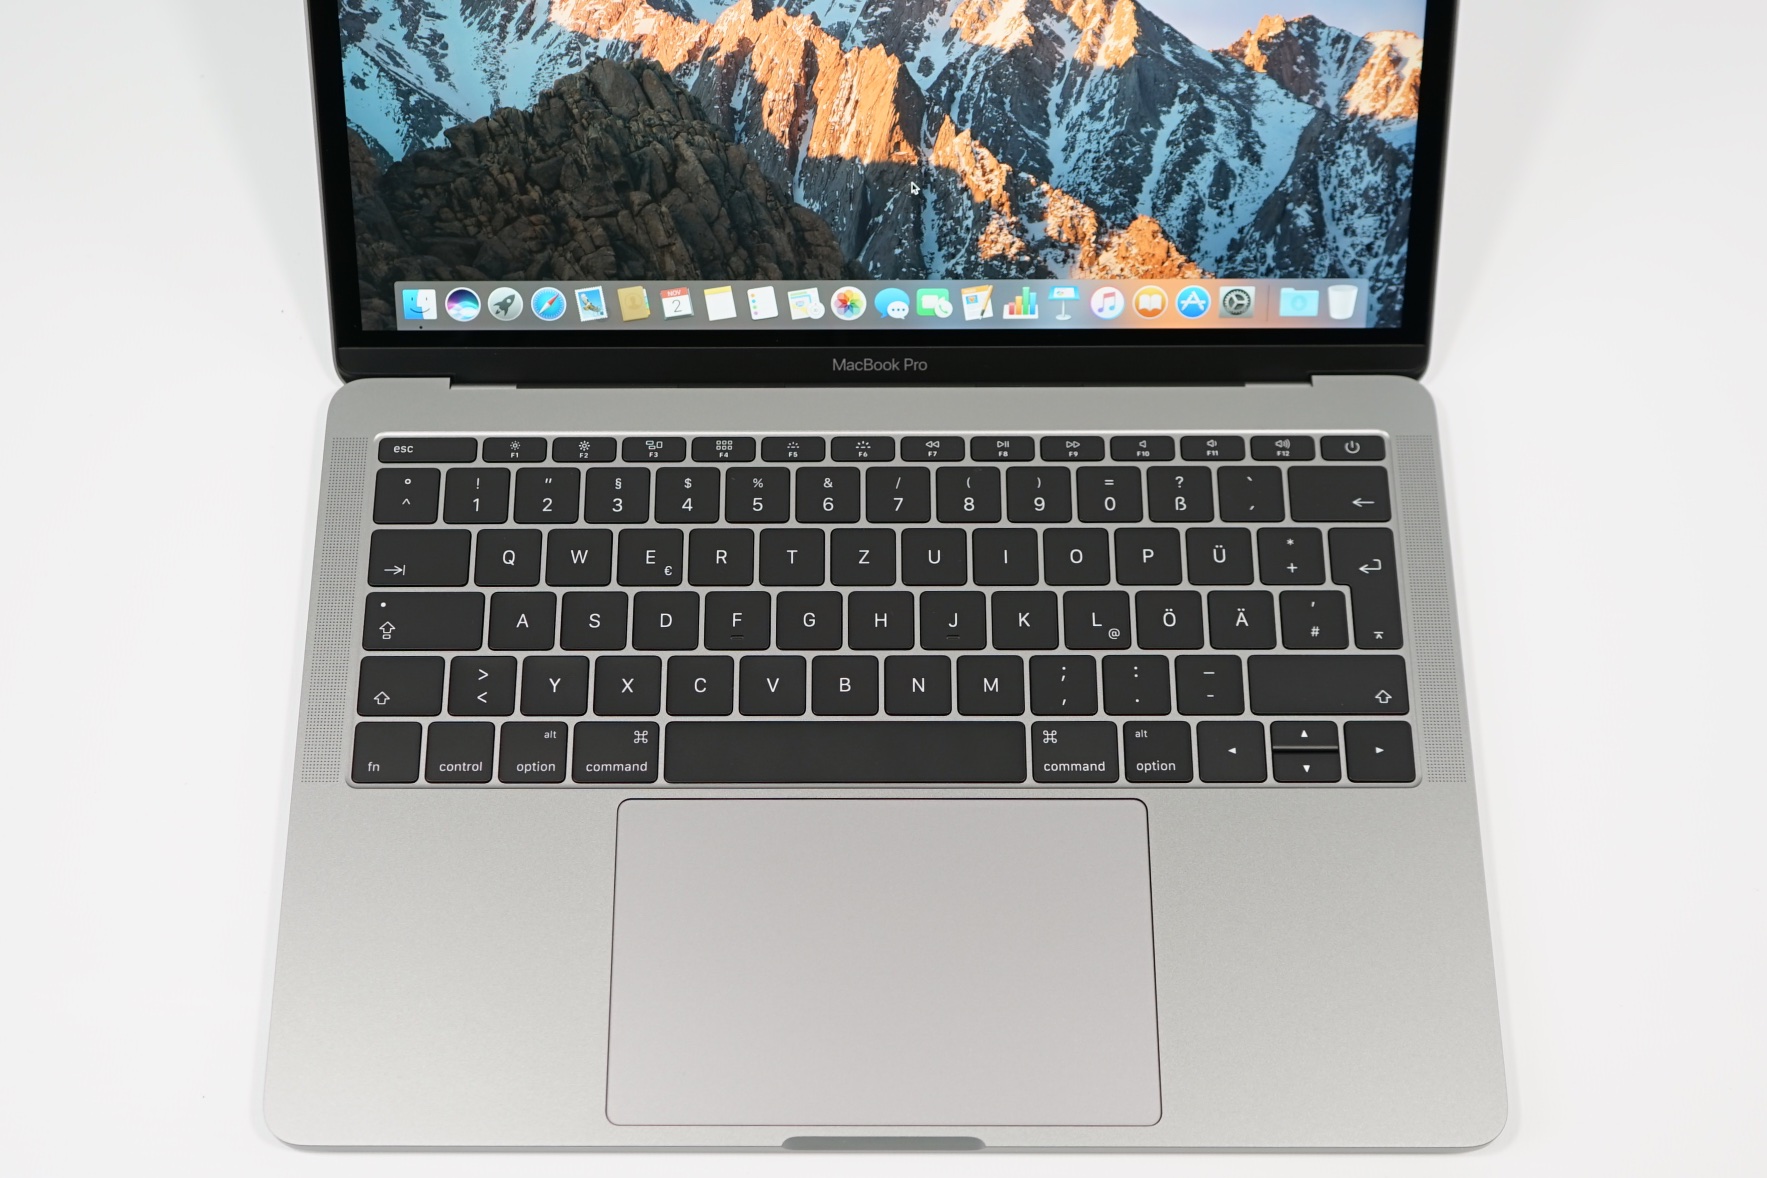
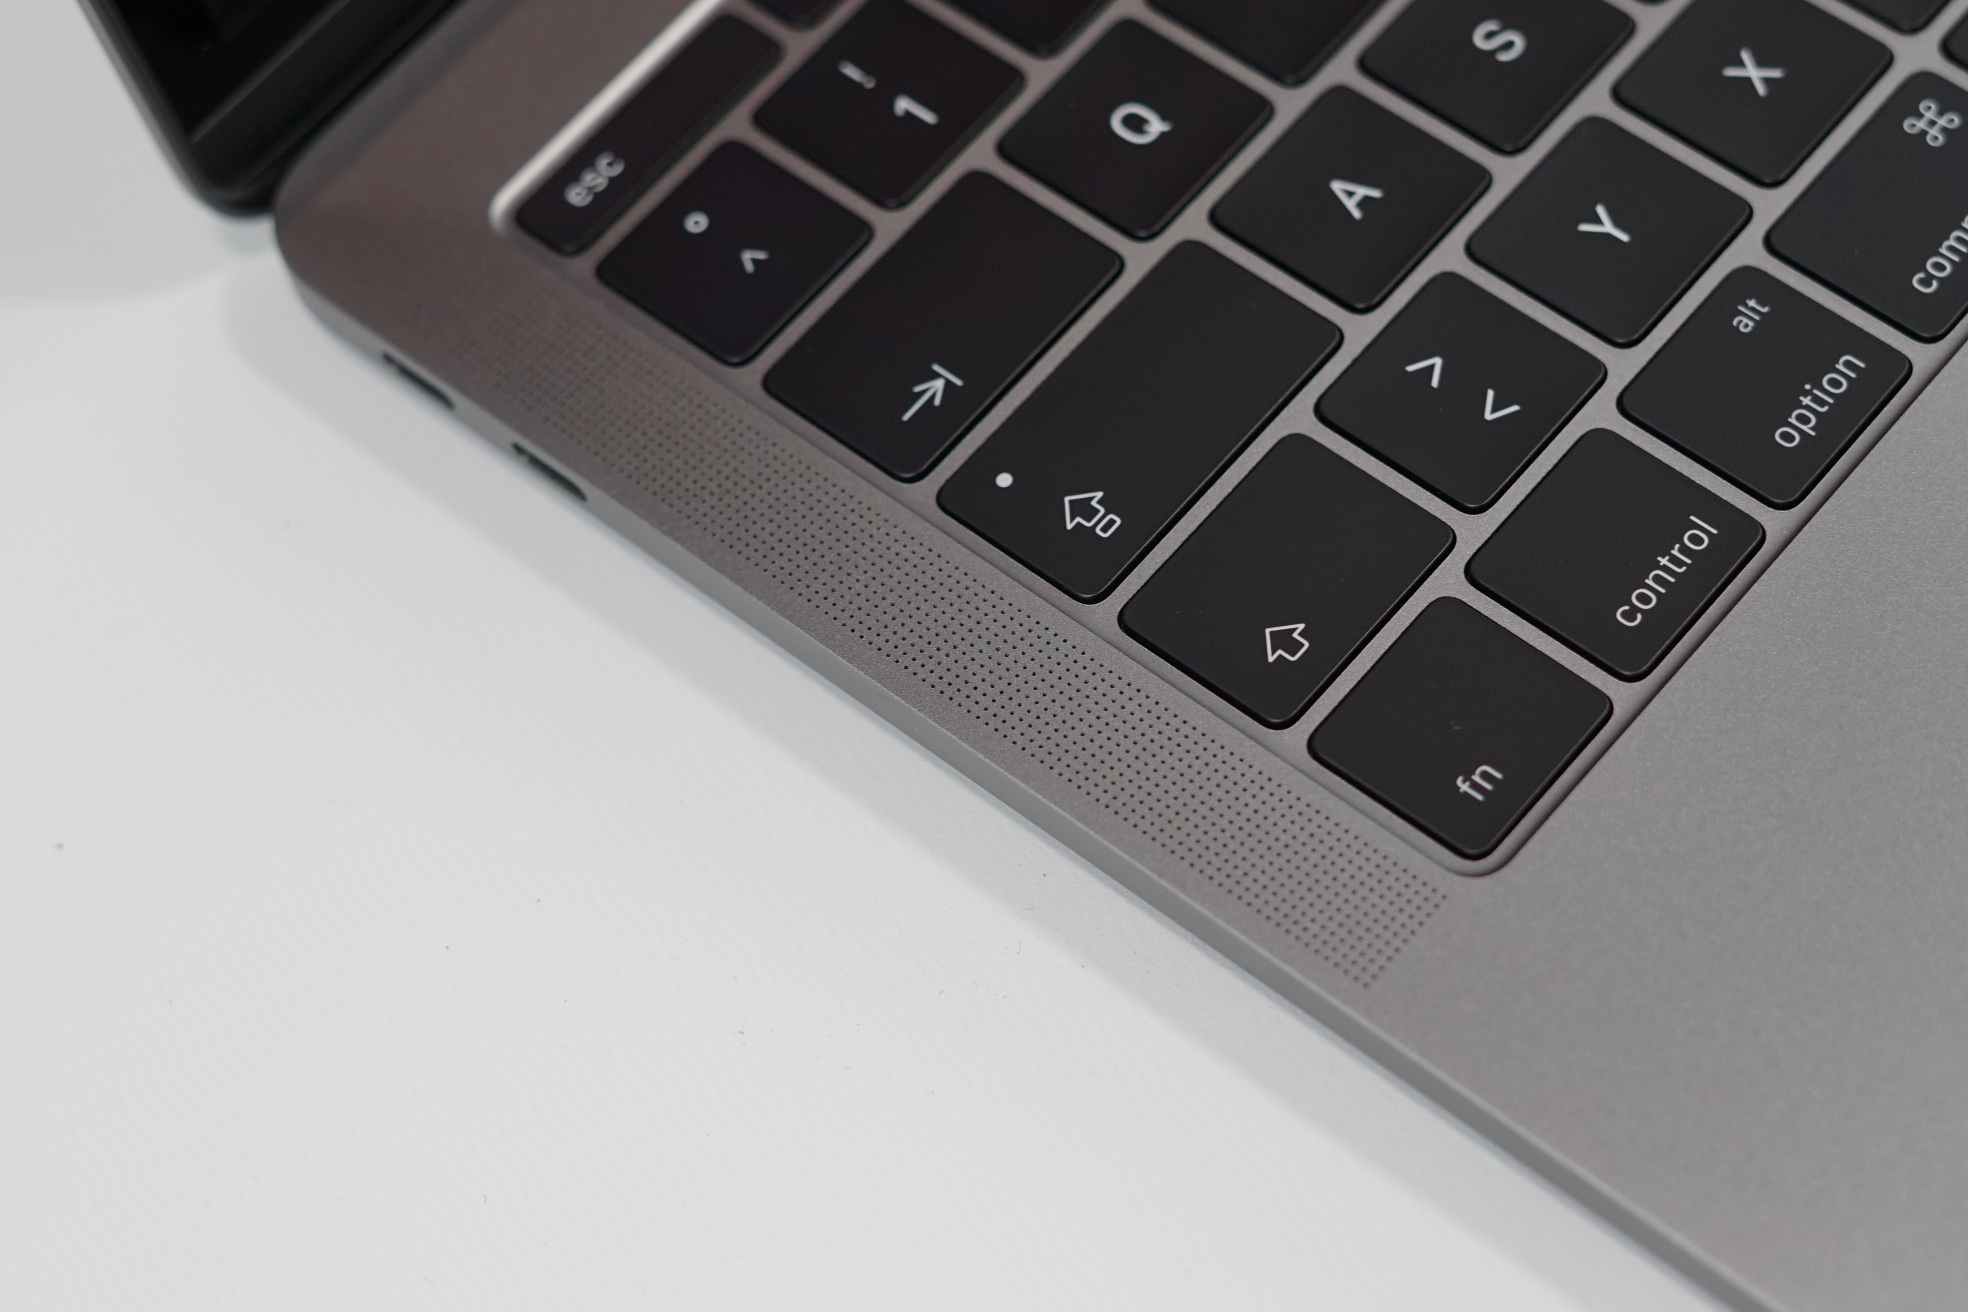
目前在售的两款13寸Apple MacBook Pro机型最大的区别是在于屏幕上方的Touch Bar,以及散热系统。售价更高的机型有双风扇的更高效散热系统,而售价较低的这台测试机只配有一个风扇。在实际使用中这通常不会造成任何问题,因为大部分时间风扇都处于静止状态,不过在负载提高后,你将会明显听到它的小风扇开始转动。我们不太喜欢它的尖锐噪音,这让它尽管音量不高却十分烦人。
我们也可以在无线上网续航时间测试中看到它的不小优势。我们也将会测试它在其他使用情况下的续航时间。在目前看来,对于日常应用如上网浏览或书写邮件这款售价更低的机型可能反而是个更好的选择。
注:本文是基于完整评测的缩减版本,阅读完整的英文评测,请点击这里。
Price comparison
