




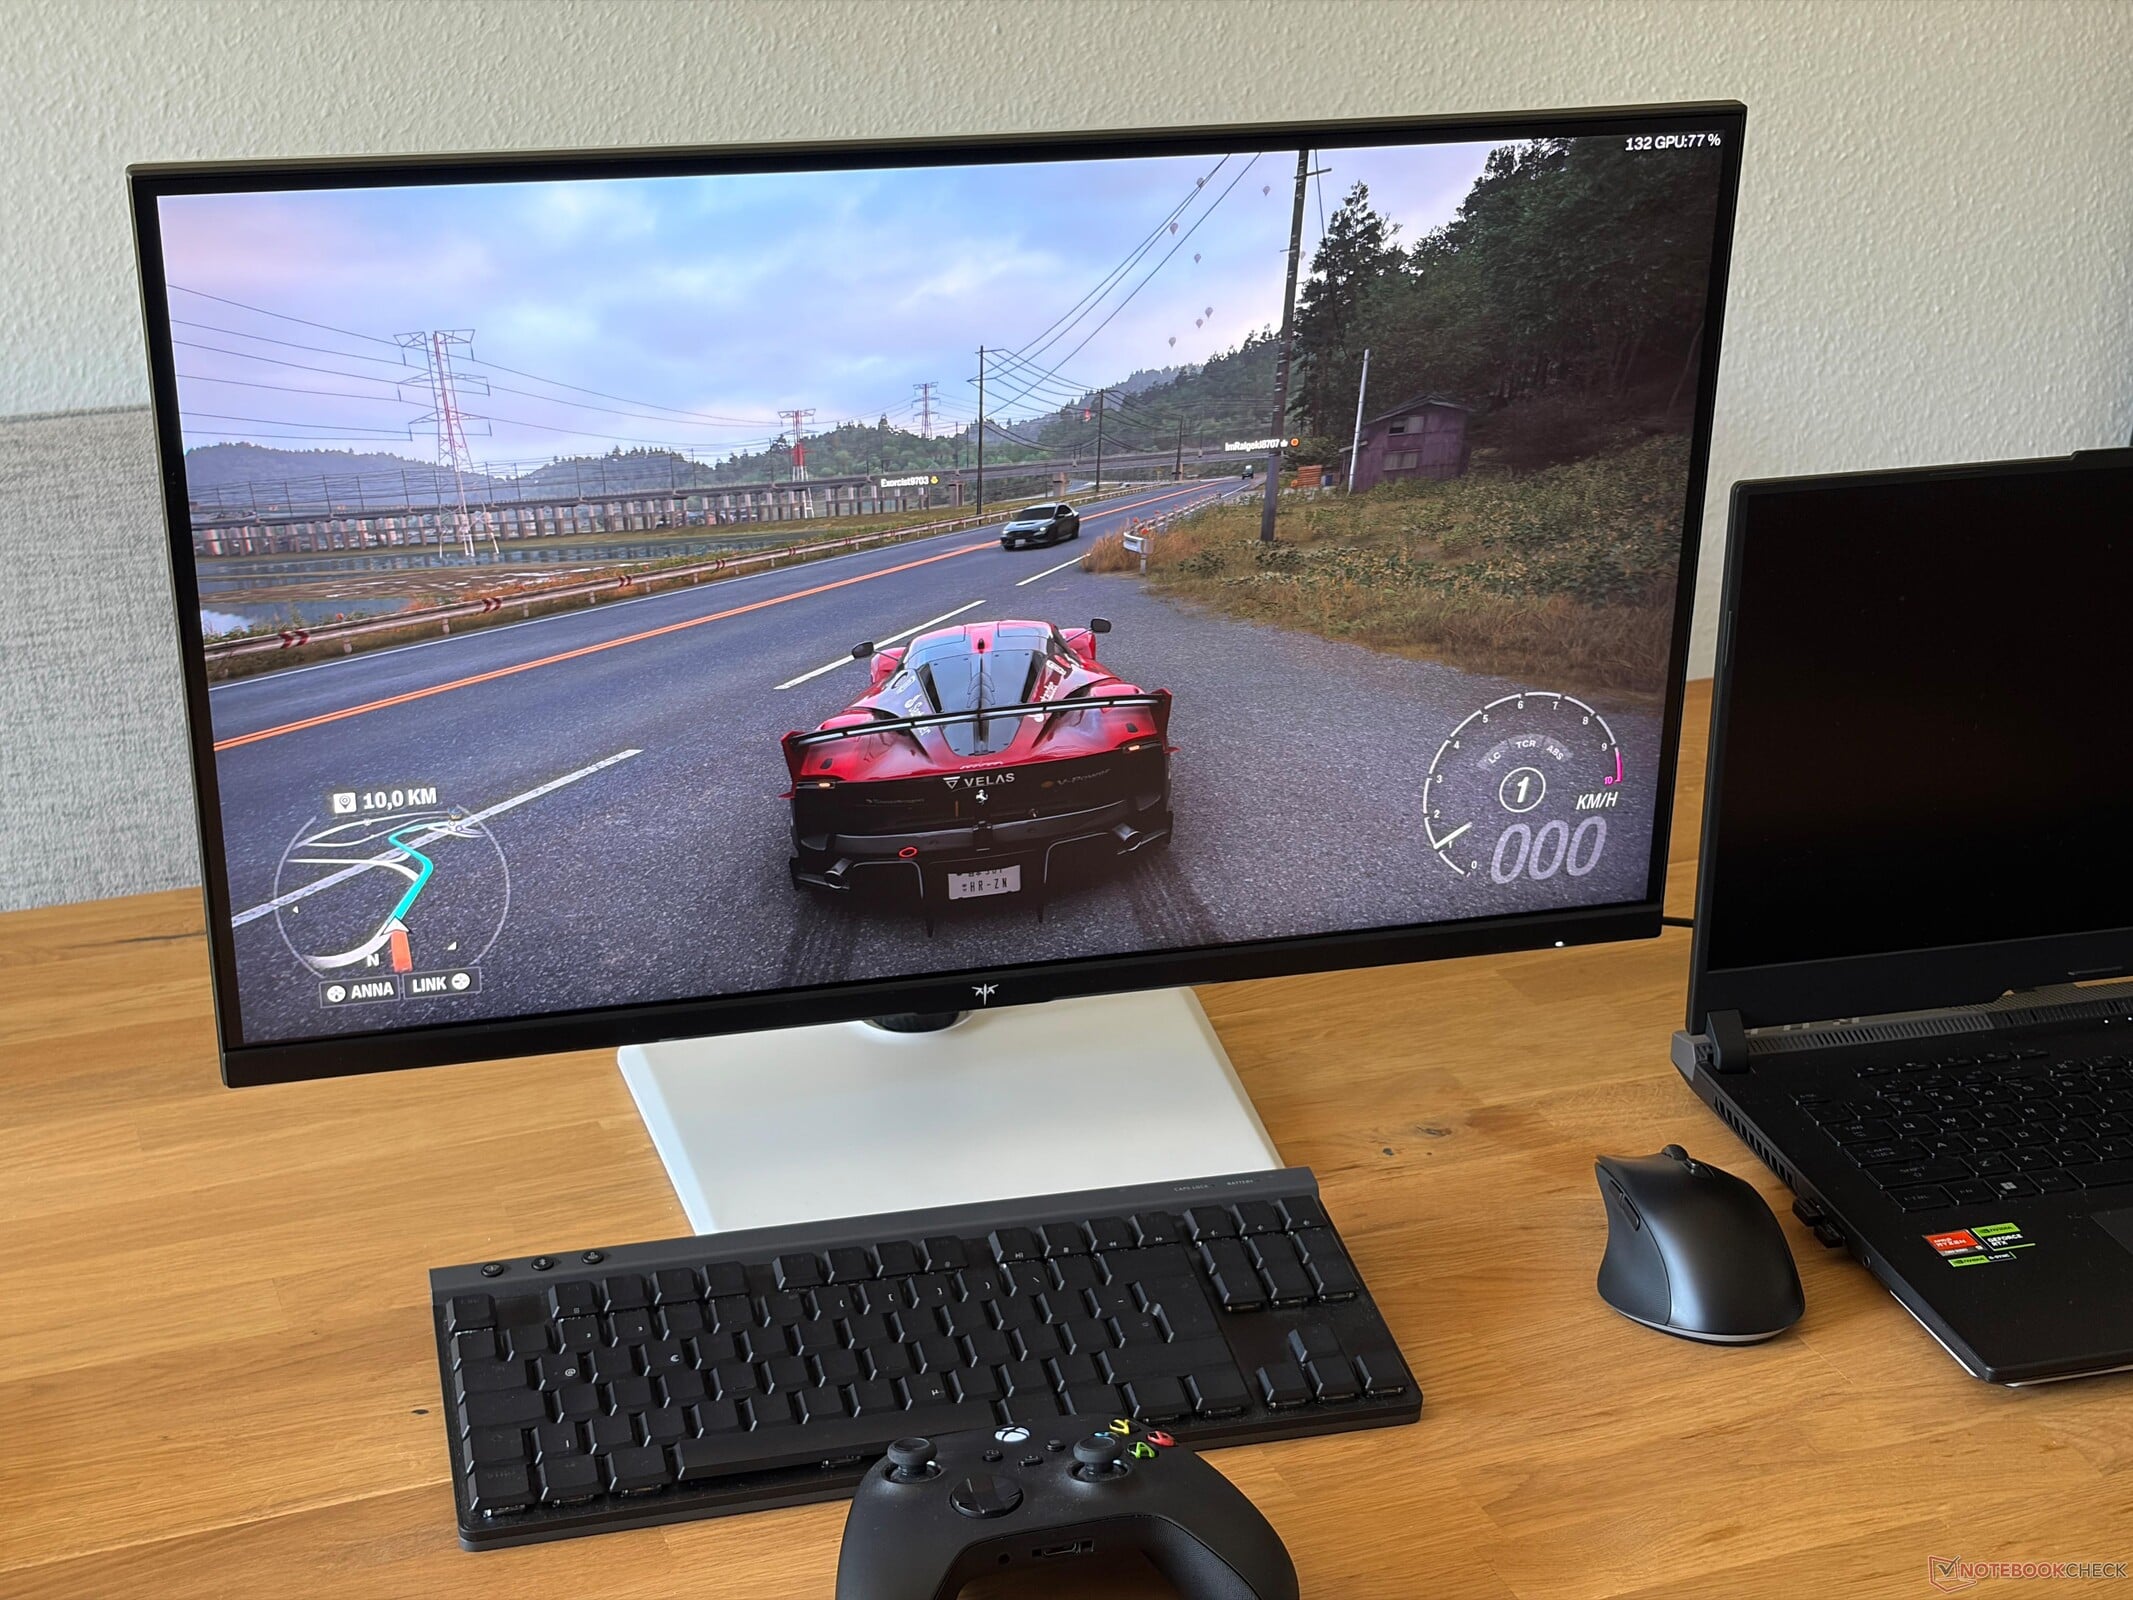
配备 240 Hz IPS 面板、G-Sync 技术及精准色彩的 27 英寸显示器:KTC H27E6S 评测
不仅面向游戏玩家。
售价240欧元的KTC H27E6S是一款配备G-Sync技术、刷新率达240 Hz的高速27英寸QHD显示器。不过,得益于其哑光屏幕表面和精准的色彩还原,它也适用于游戏以外的其他用途。Andreas Osthoff, 👁 Andreas Osthoff (translated by DeepL / Ninh Duy) Published 🇺🇸 🇩🇪 ...
结论:价格实惠的27英寸240 Hz显示器
在测试中,KTC H27E6S 表现令人印象深刻。其 27 英寸 IPS 面板拥有高达 240 Hz 的刷新率和快速的响应时间,无论在 PC 还是游戏主机上,都能轻松应对节奏最快的射击游戏。 然而,HDR 游戏体验并不理想,因为 IPS 面板的亮度不足以呈现出令人满意的 HDR 效果。
得益于出色的亮度、哑光屏幕表面以及无 PWM 闪烁的特性,这款显示器也非常适合办公生产力工作,尤其是屏幕支持旋转至竖屏模式。 随附的支架提供了丰富的调节选项,但在背光灯效方面则较为匮乏。
即使使用出厂设置,H27E6S 在 sRGB 色彩空间内也能呈现准确的色彩还原,这也使其适合图像编辑。 总体而言,这是一款性价比不错的全能型显示器。不过,如果您只是偶尔玩游戏,那么那些刷新率较低但功能更丰富的竞品(例如支持 USB-C 电源传输或 KVM 切换功能的产品)可能会更具吸引力。
Pros
Cons

KTC推出的H27E6S是一款价格亲民的27英寸显示器,采用IPS面板并具备240 Hz刷新率,主要面向游戏玩家。不过,得益于其精准的色彩表现和哑光面板,该显示器也适用于办公生产力任务。
规格
| 尺寸 | ,27英寸 |
| 分辨率 | ,2,560 x 1,440 像素(16:9) |
| 刷新率 | ,240 Hz(超频至275 Hz) |
| 面板 | ,Fast IPS(8位) |
| 输入接口 | ,2个HDMI 2.0接口,2个DisplayPort 1.4接口,1个USB 2.0接口(仅用于固件更新) |
| 输出接口 | ,3.5毫米音频接口 |
设计与功能
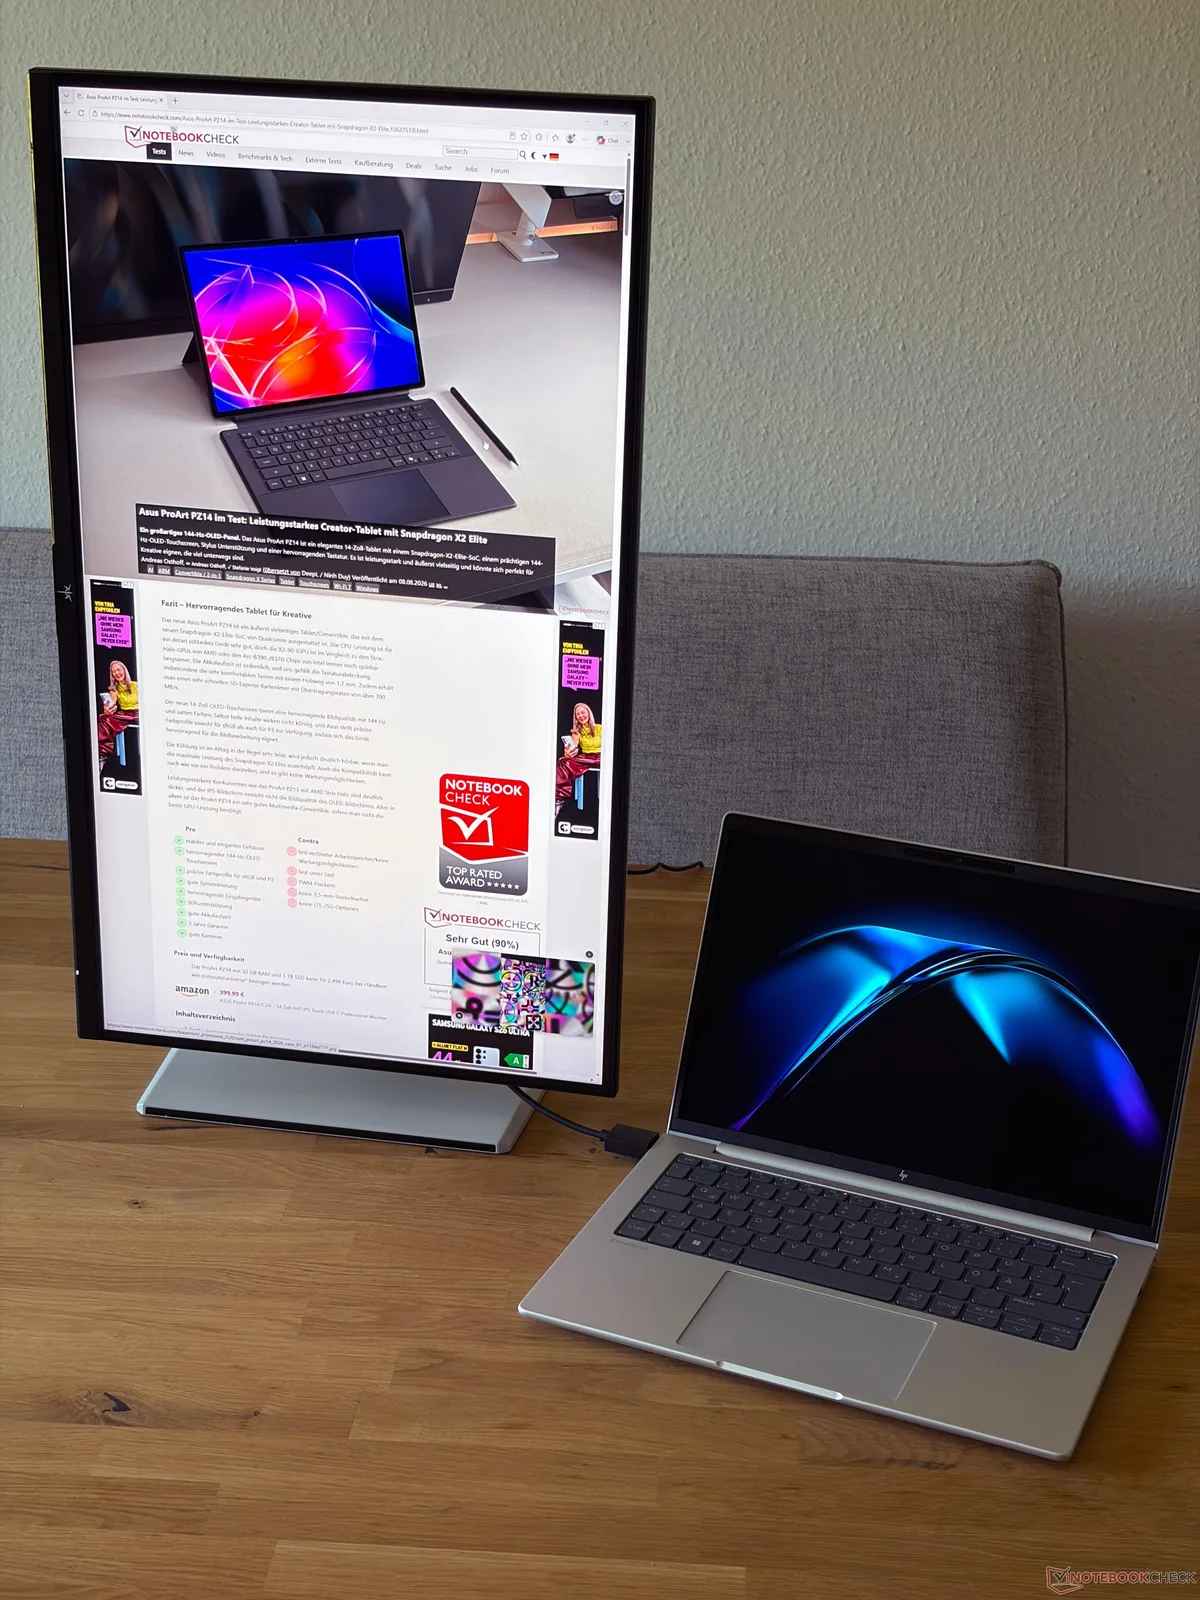
双色机身外观精美,整体做工也相当出色。尤其是底座,非常稳固,且提供丰富的调节选项。其机械结构运转非常顺畅,显示器还可以旋转 90 度以竖屏模式使用。我们在下方的图片中展示了调节范围。
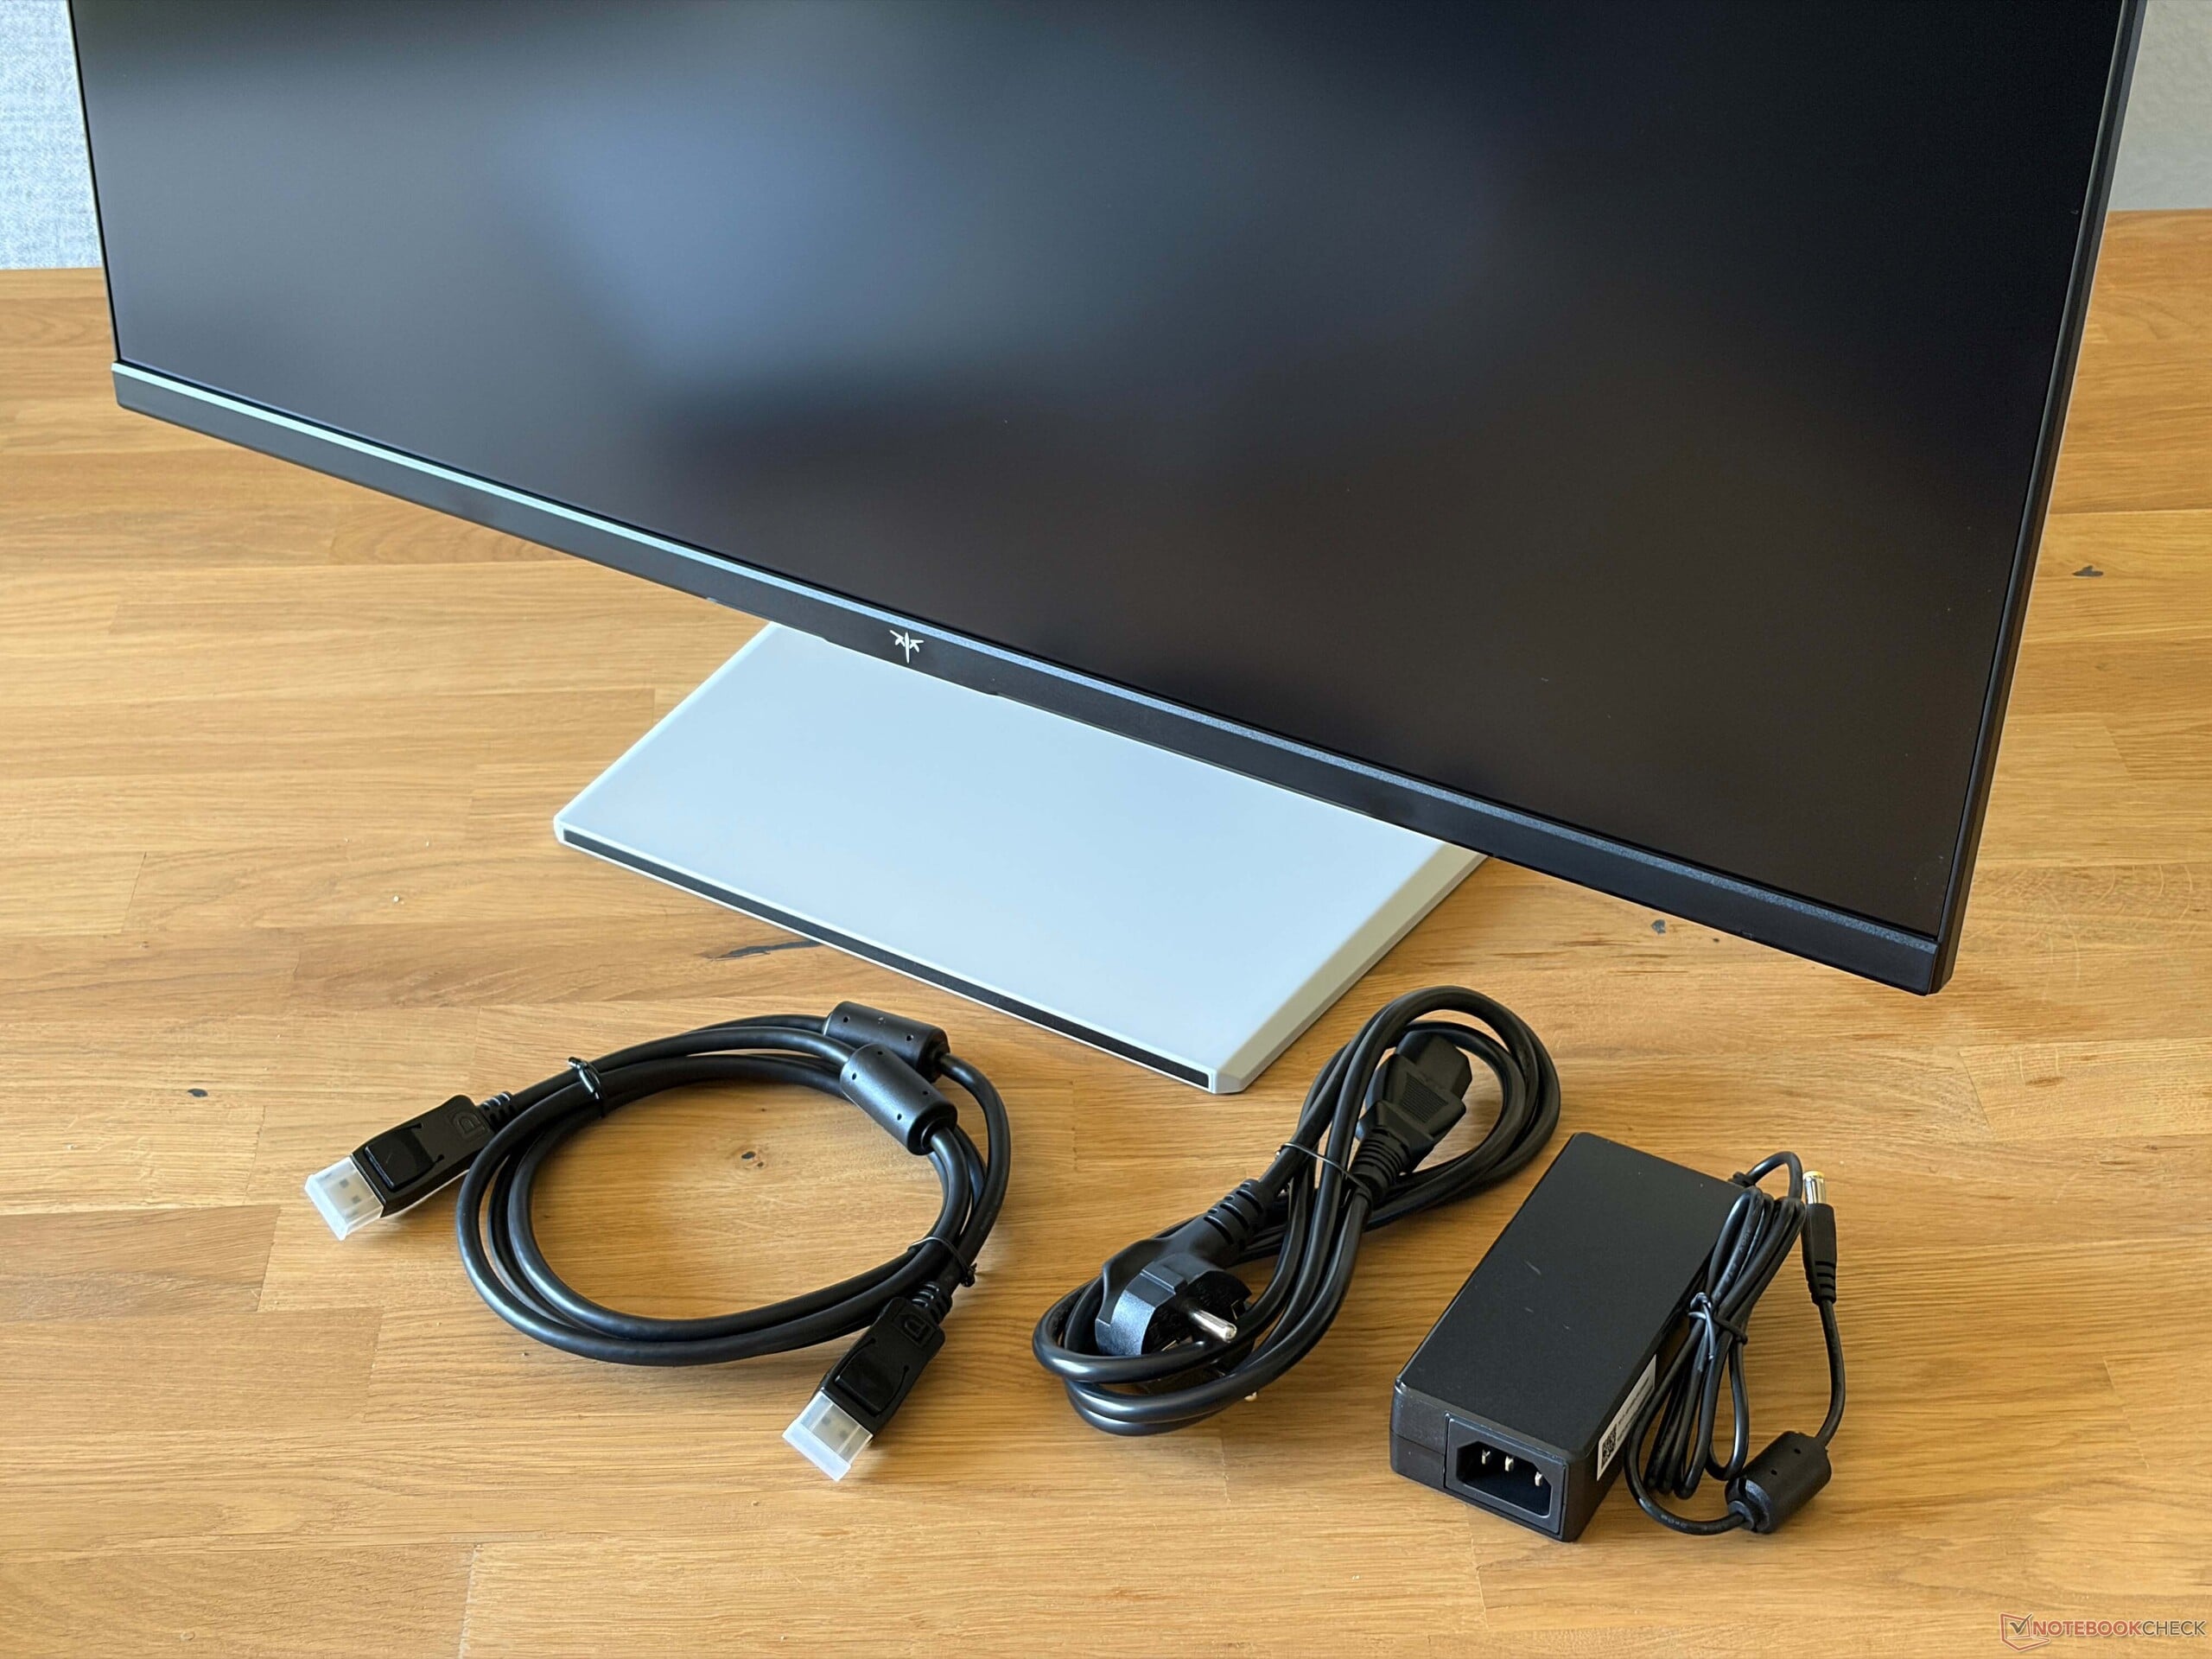
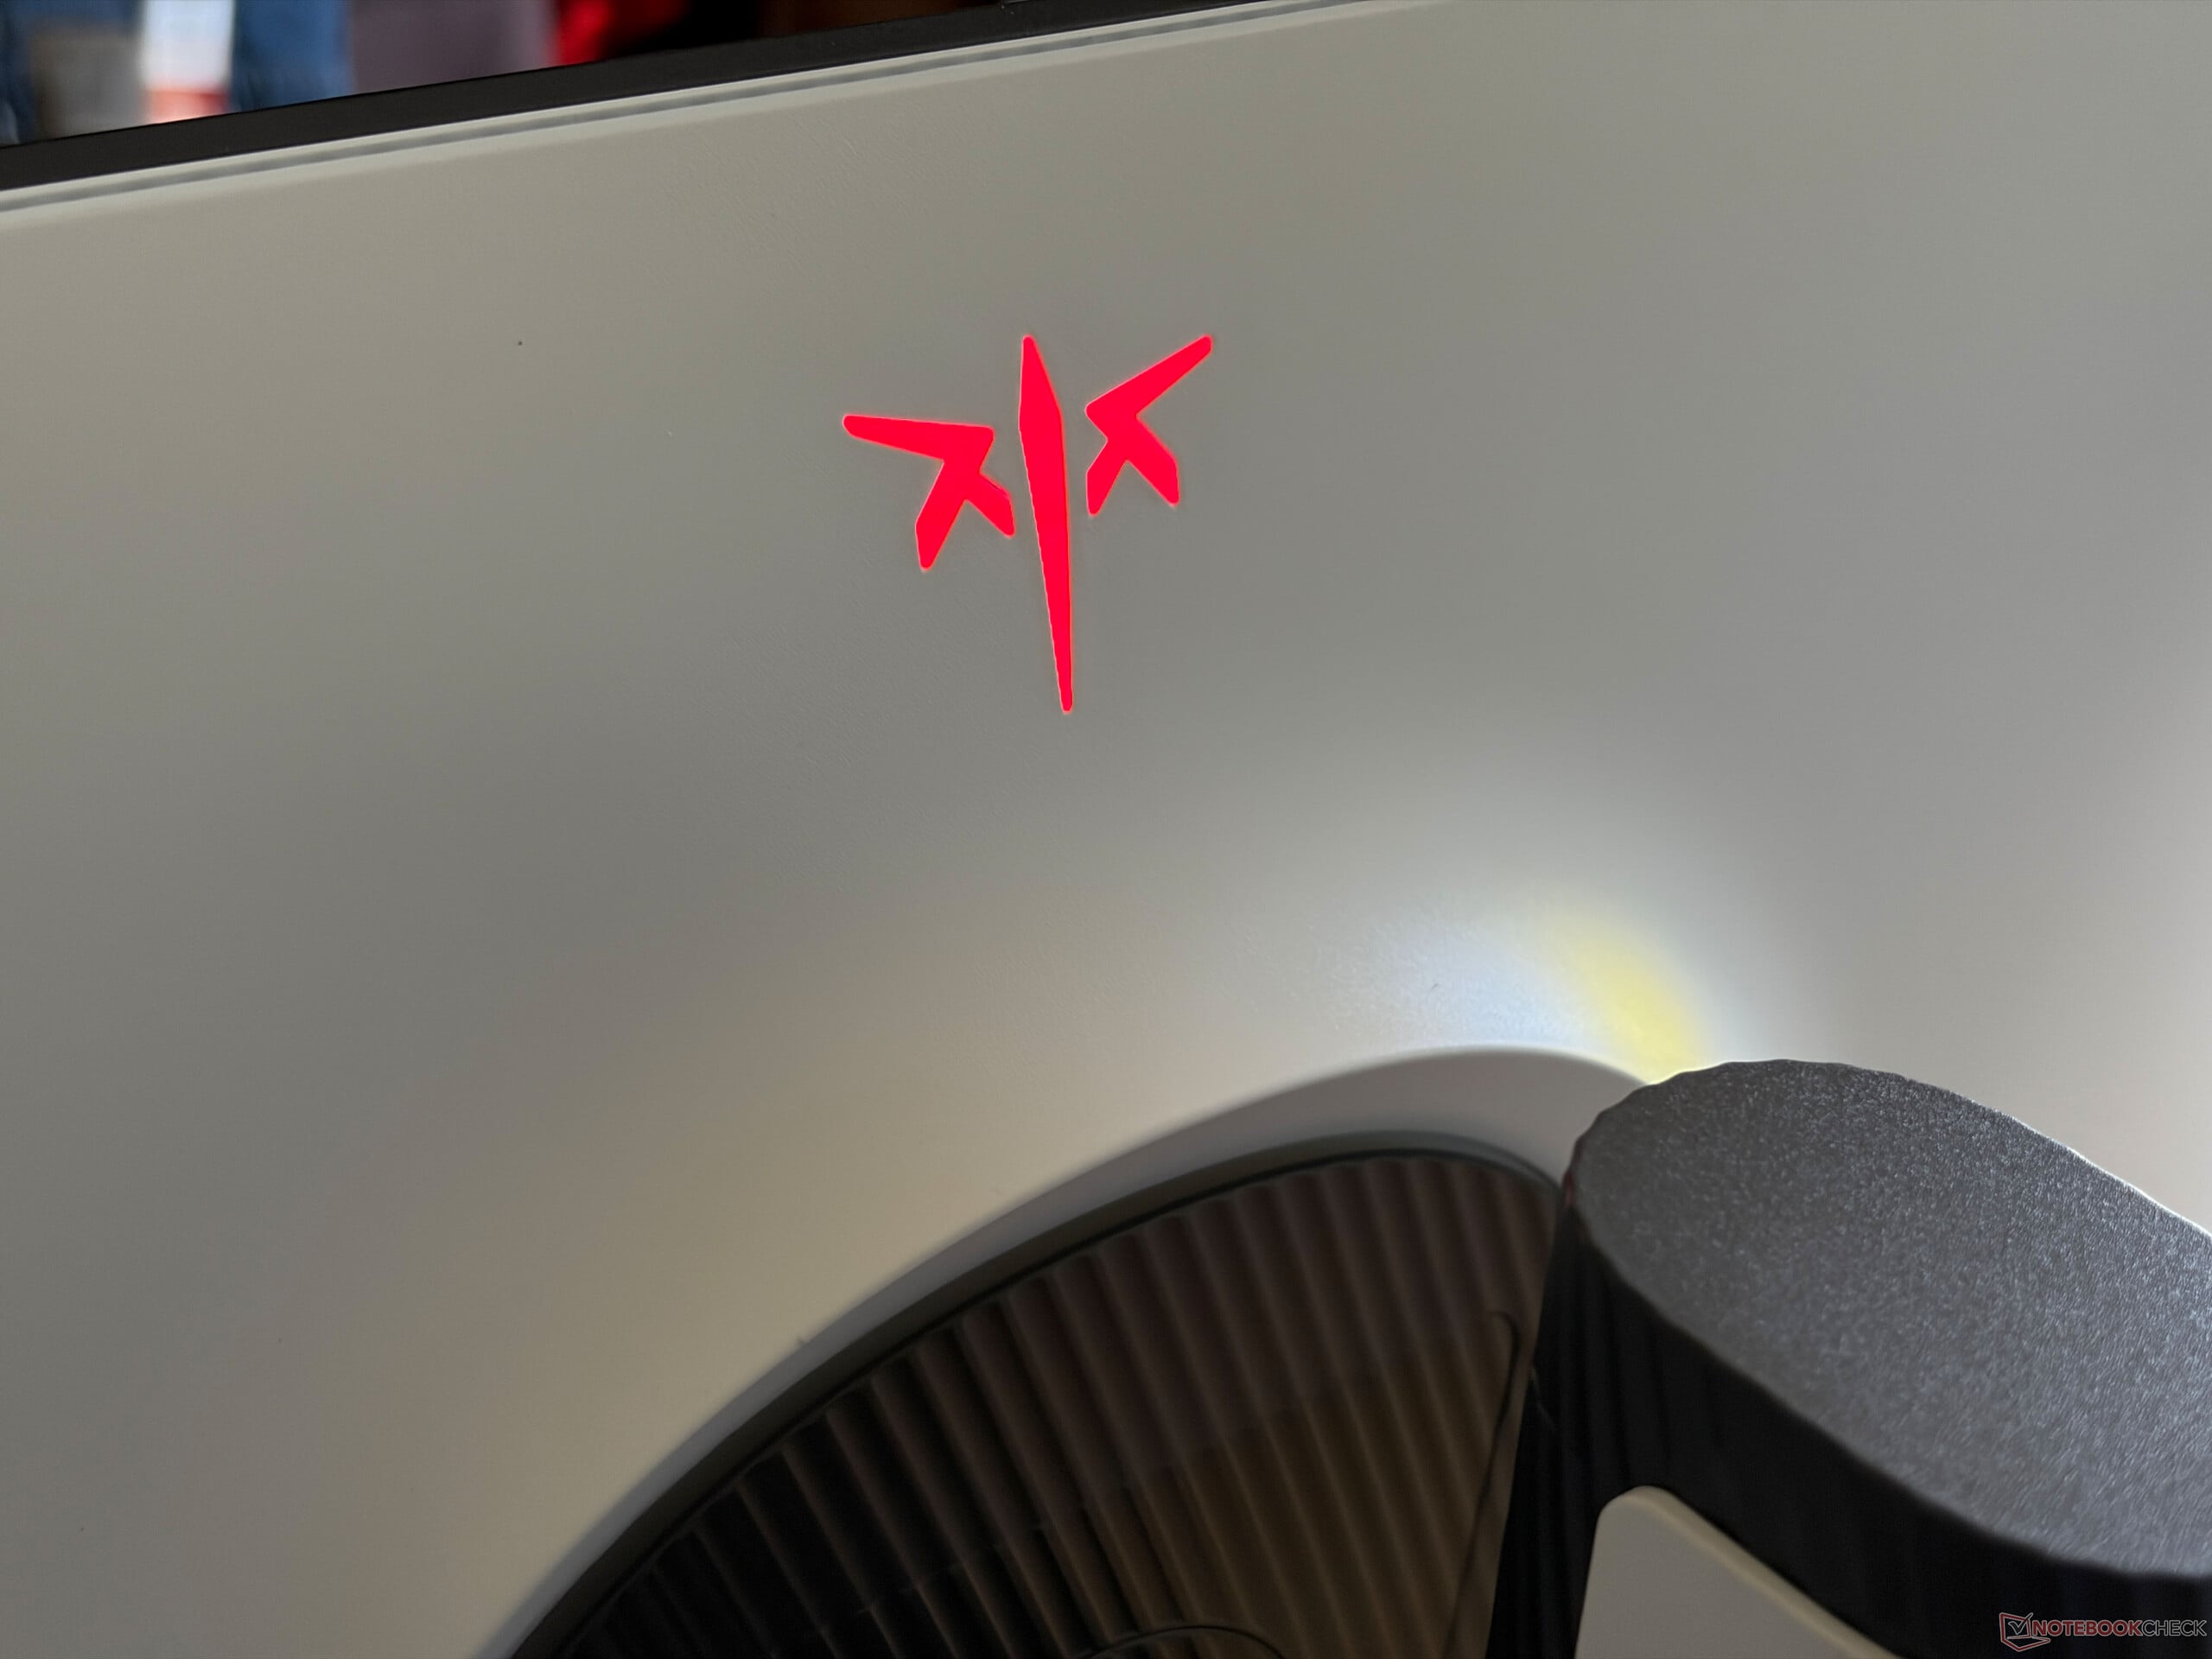
后面板上部中央附近还设有发光徽标,其颜色可自定义。显示器重量为5.98千克(含底座),而外置的65瓦电源适配器则额外增加427克。 包装盒内还附带了一根 DisplayPort 线缆。此外,通过其 100 x 100 毫米的 VESA 安装孔,该显示器可轻松安装在其他支架或显示器臂上。
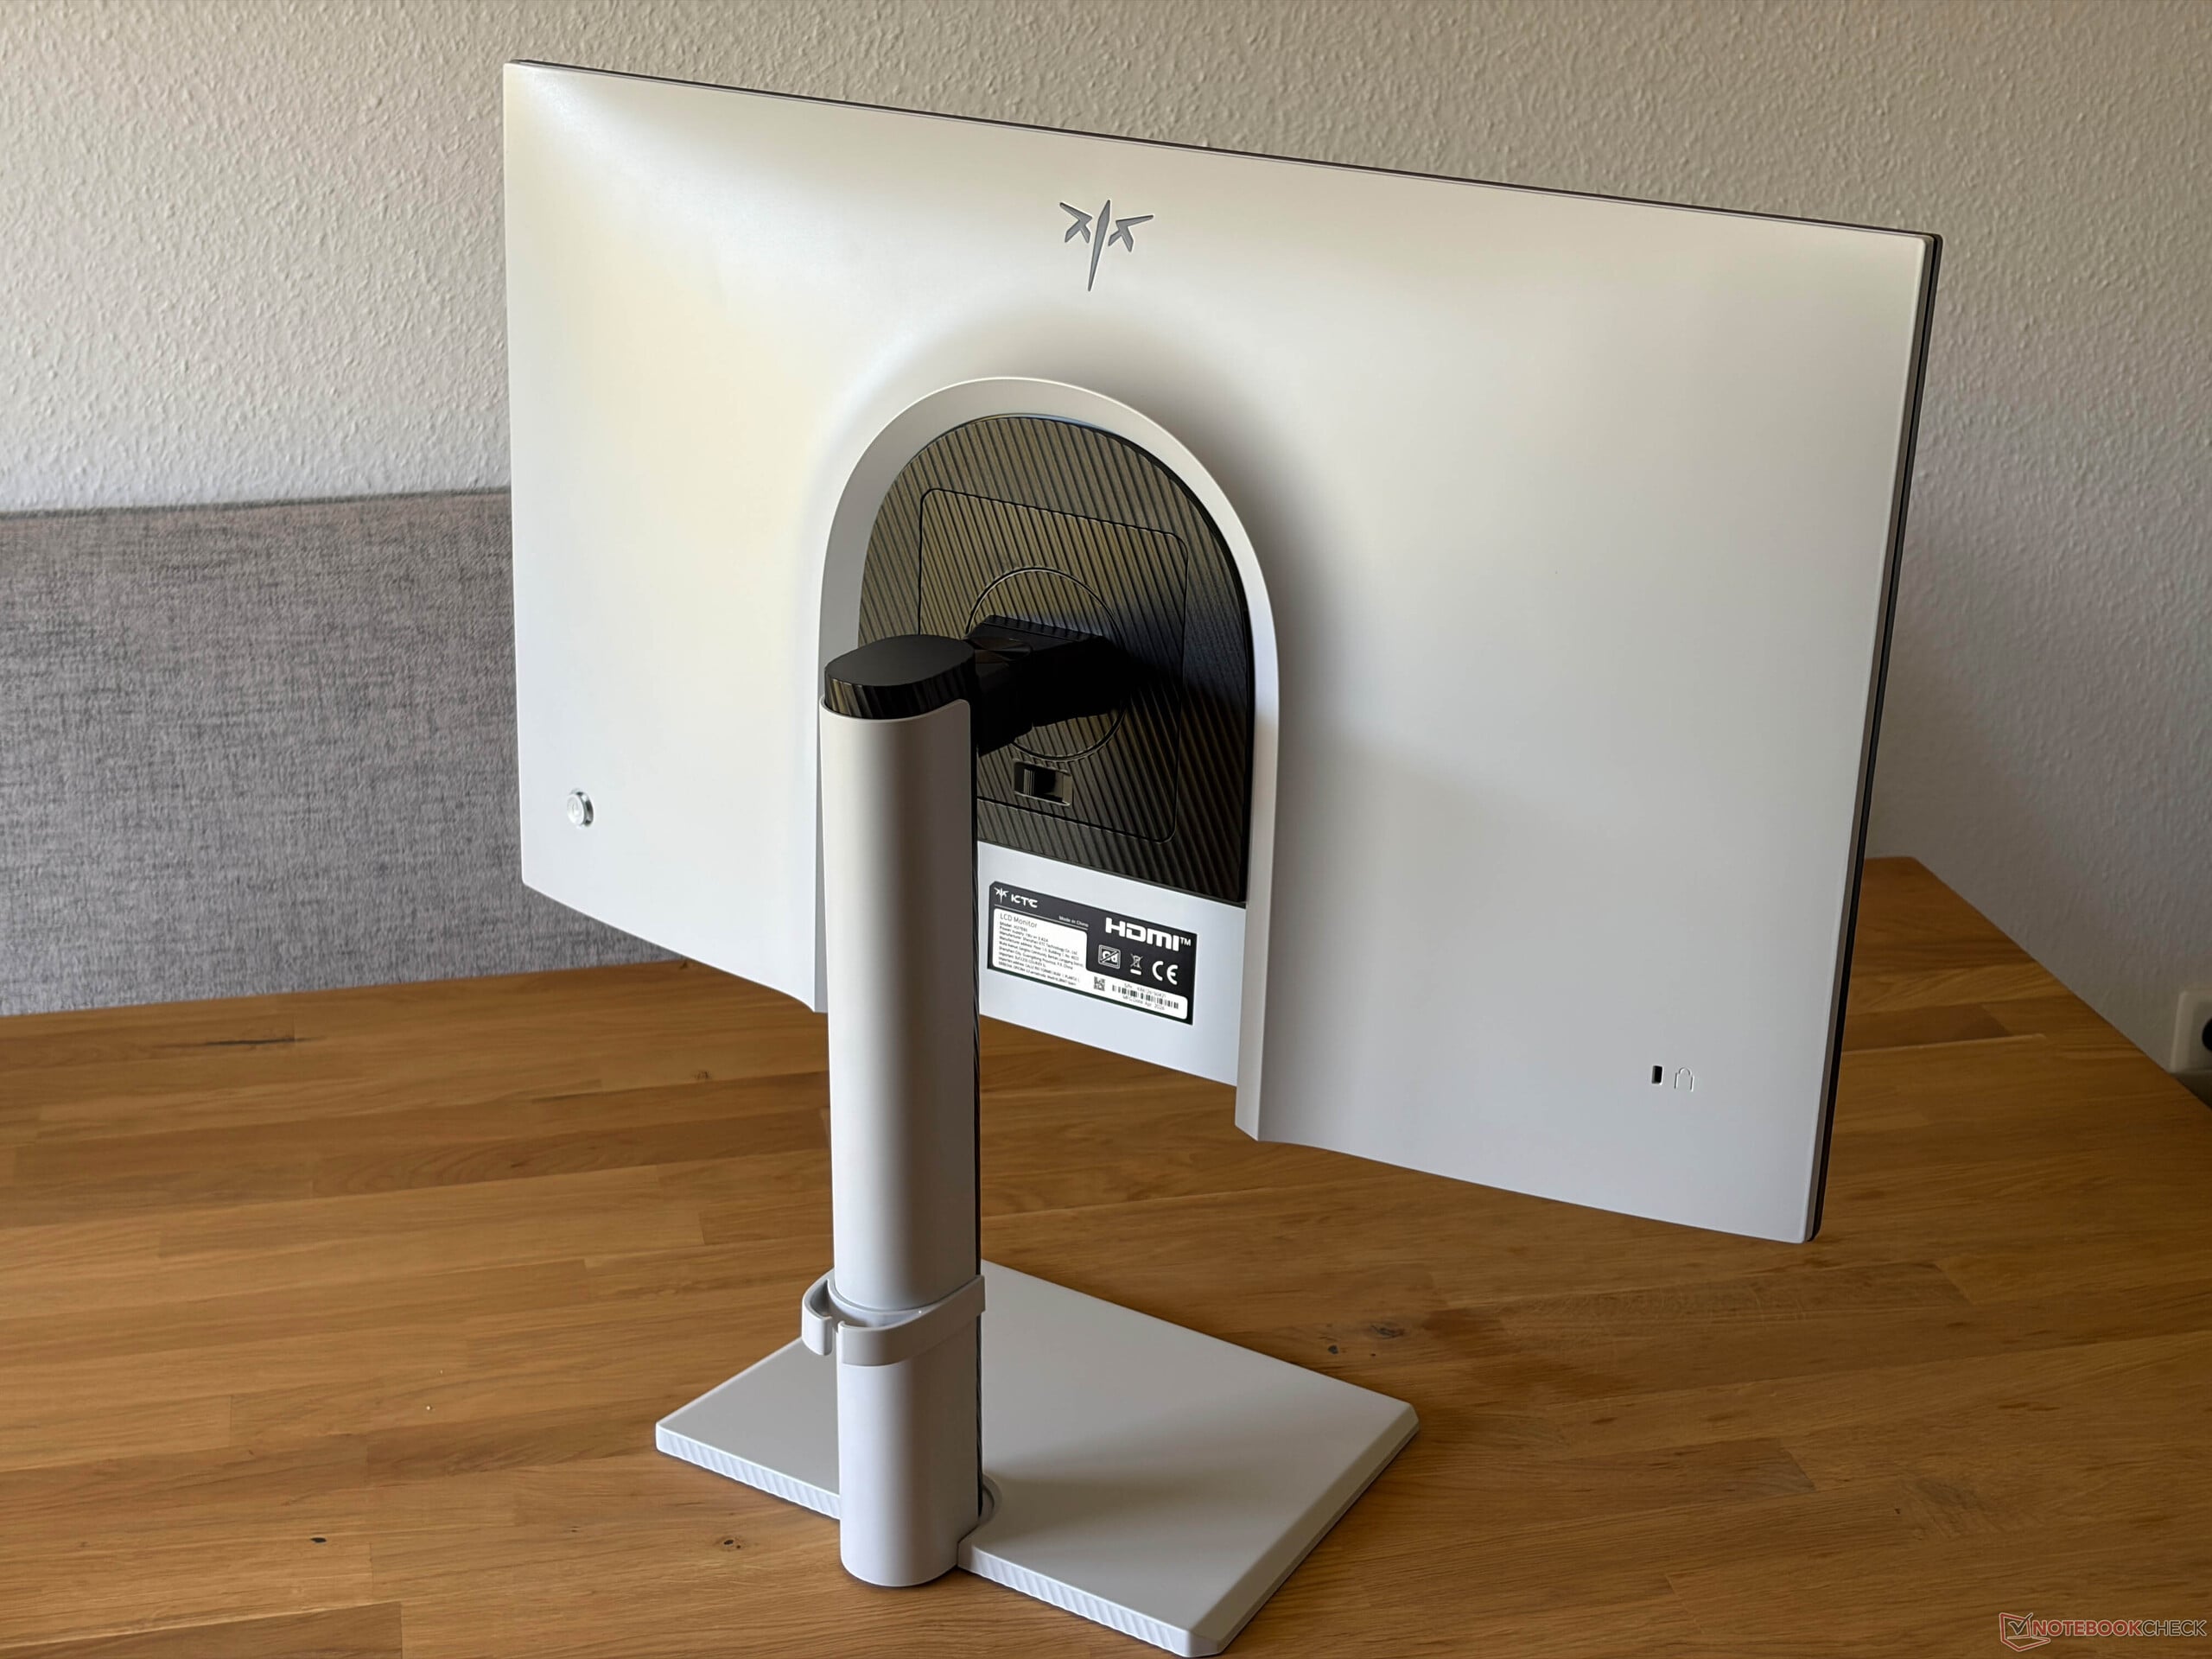
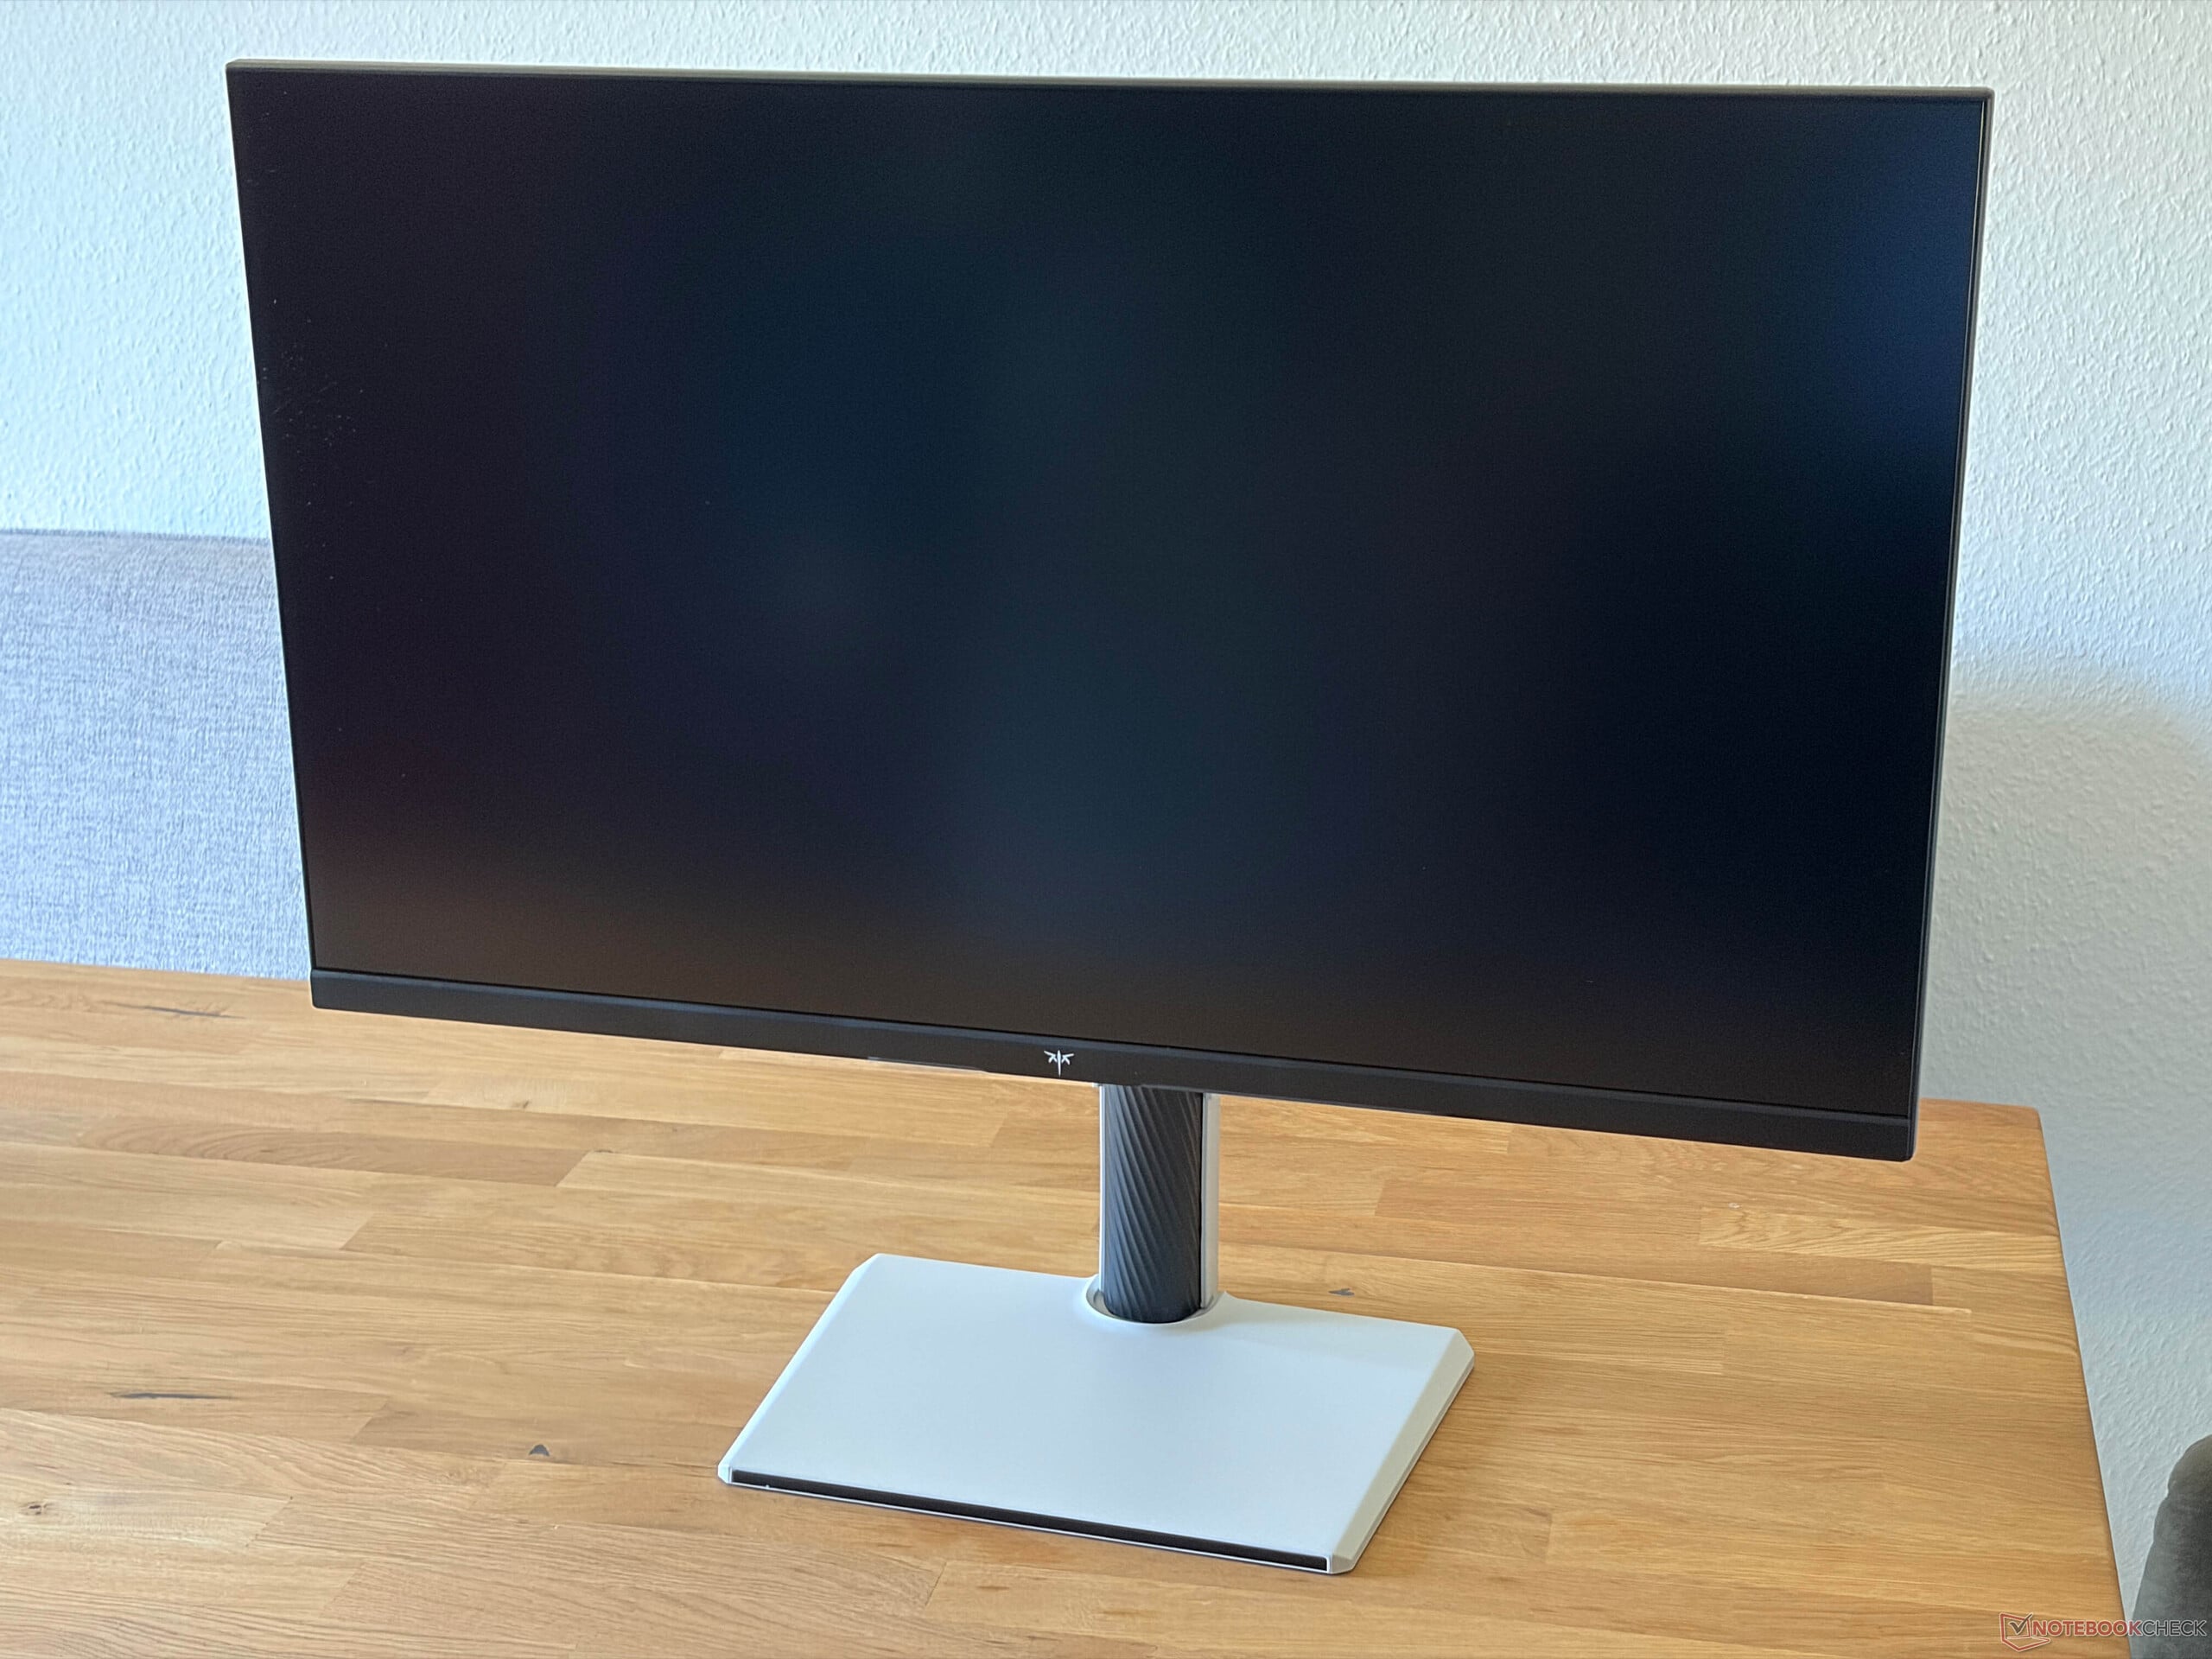
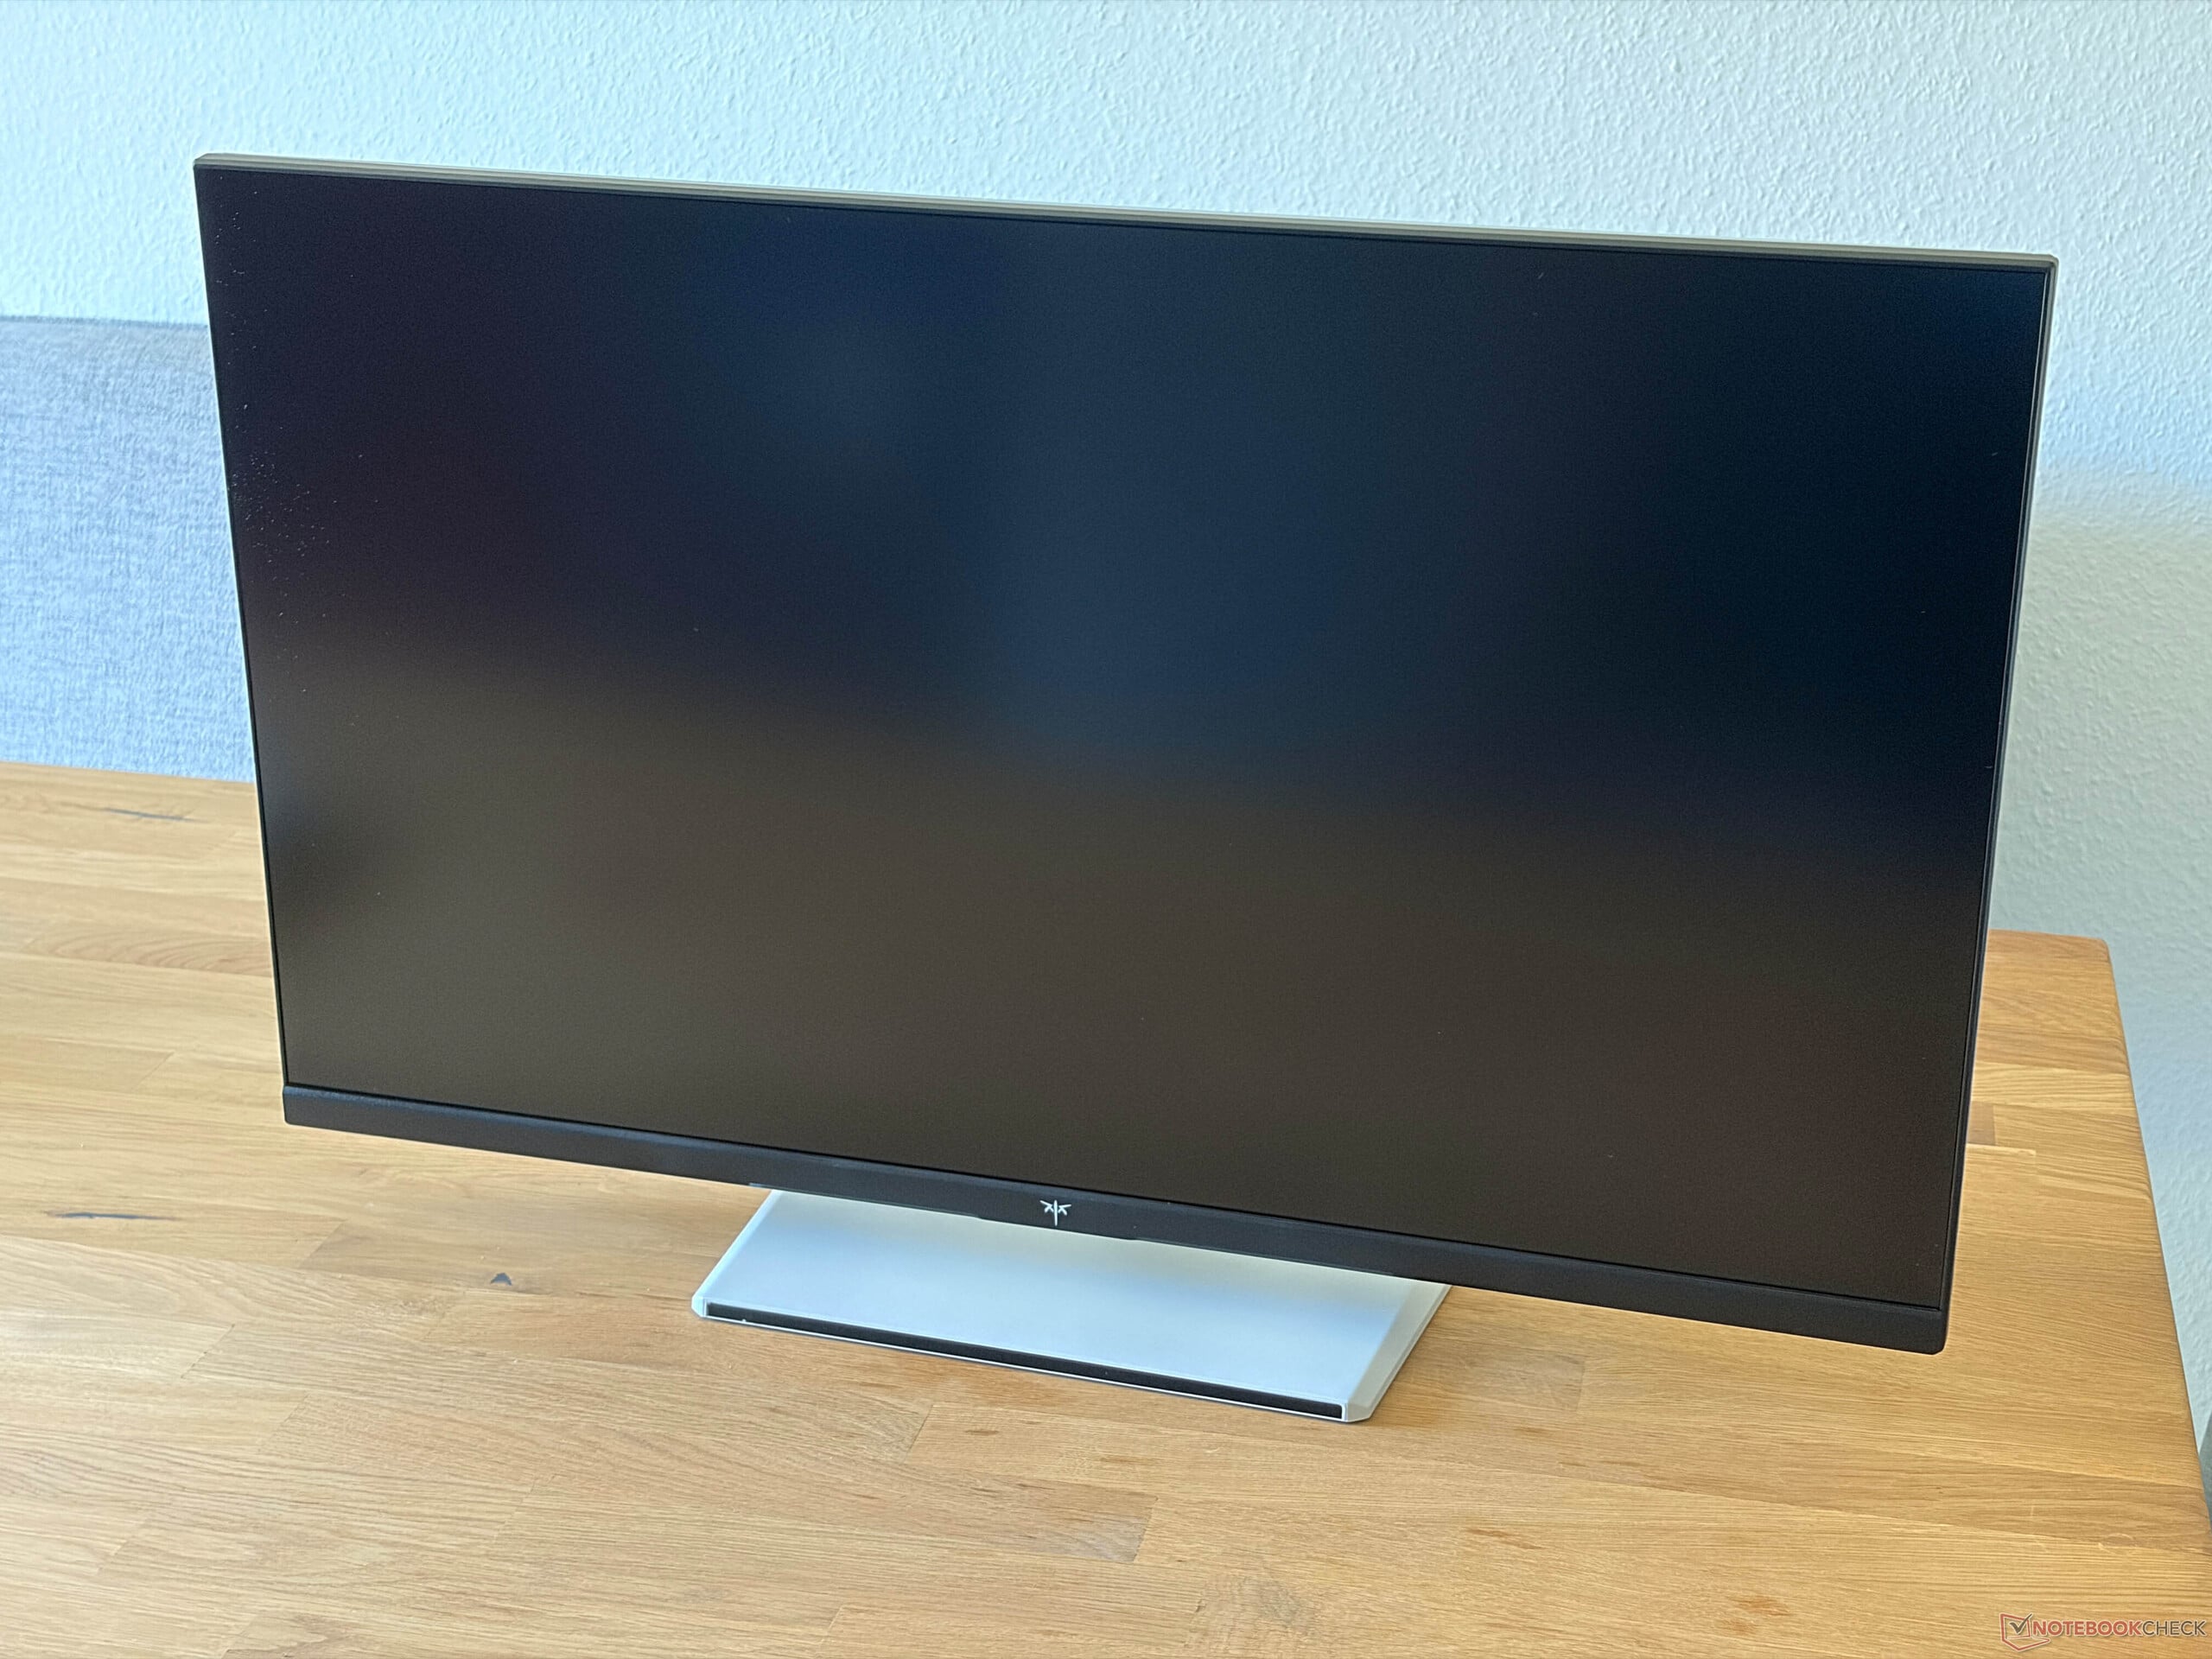
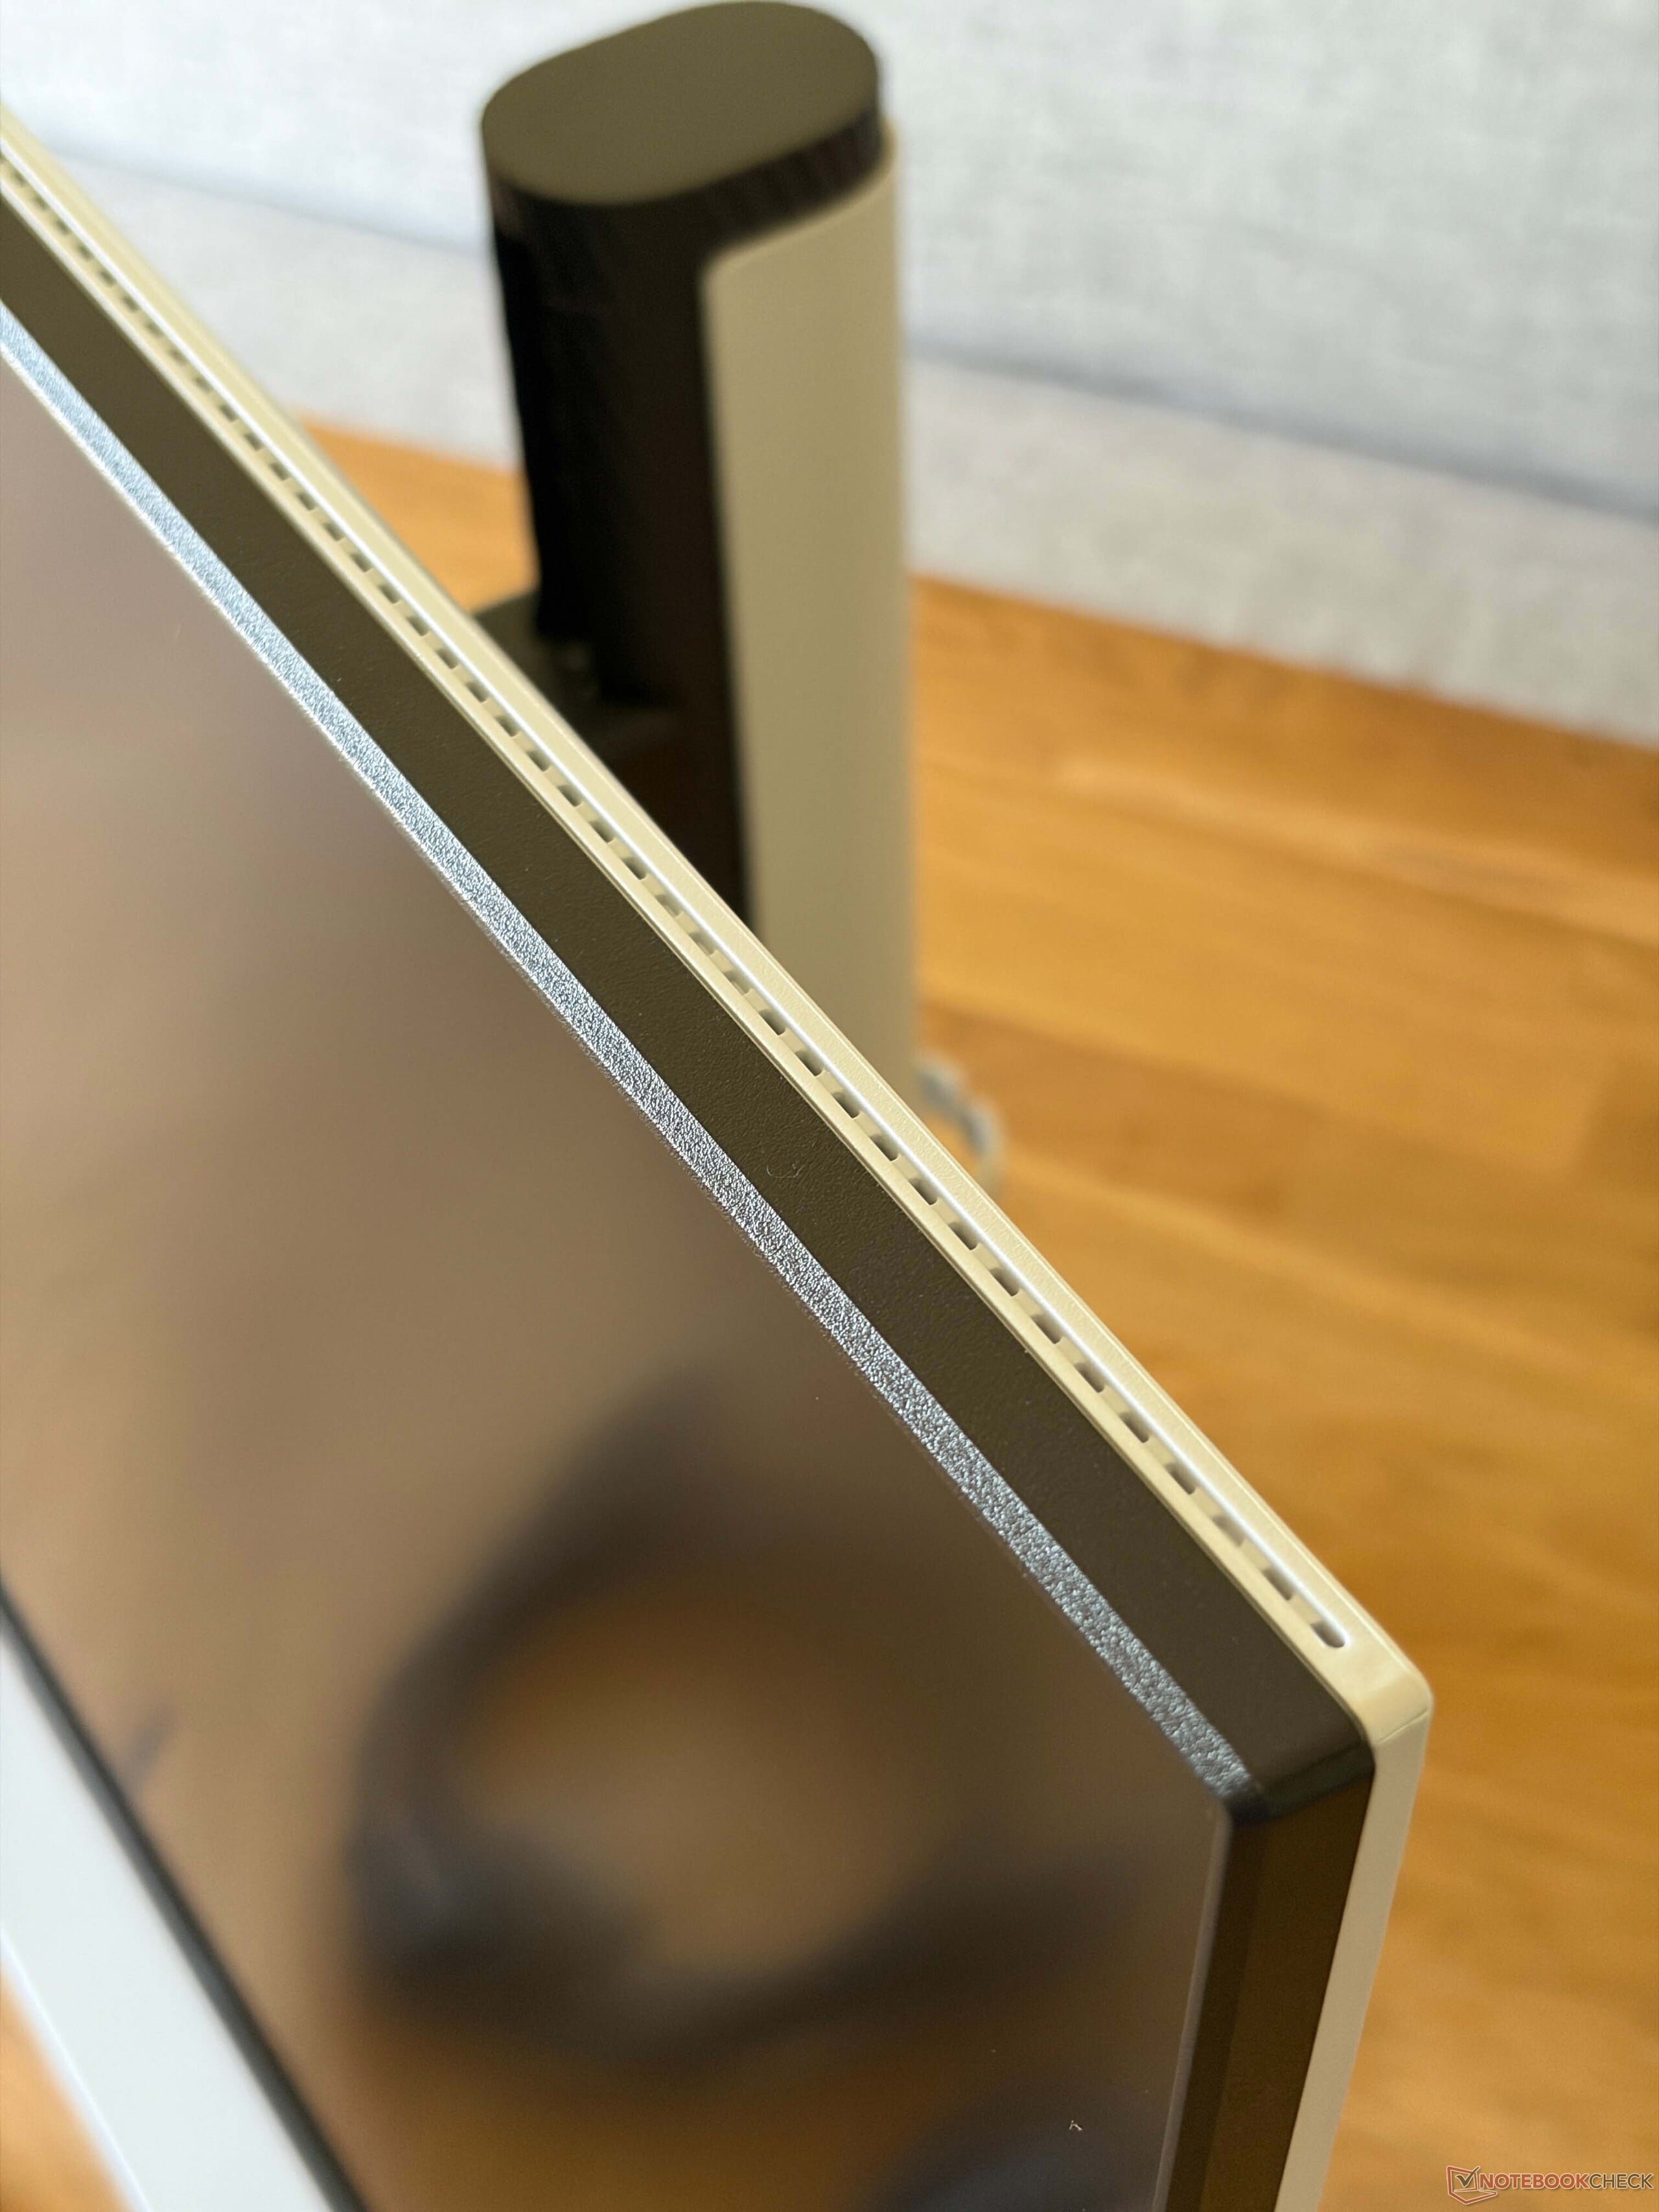
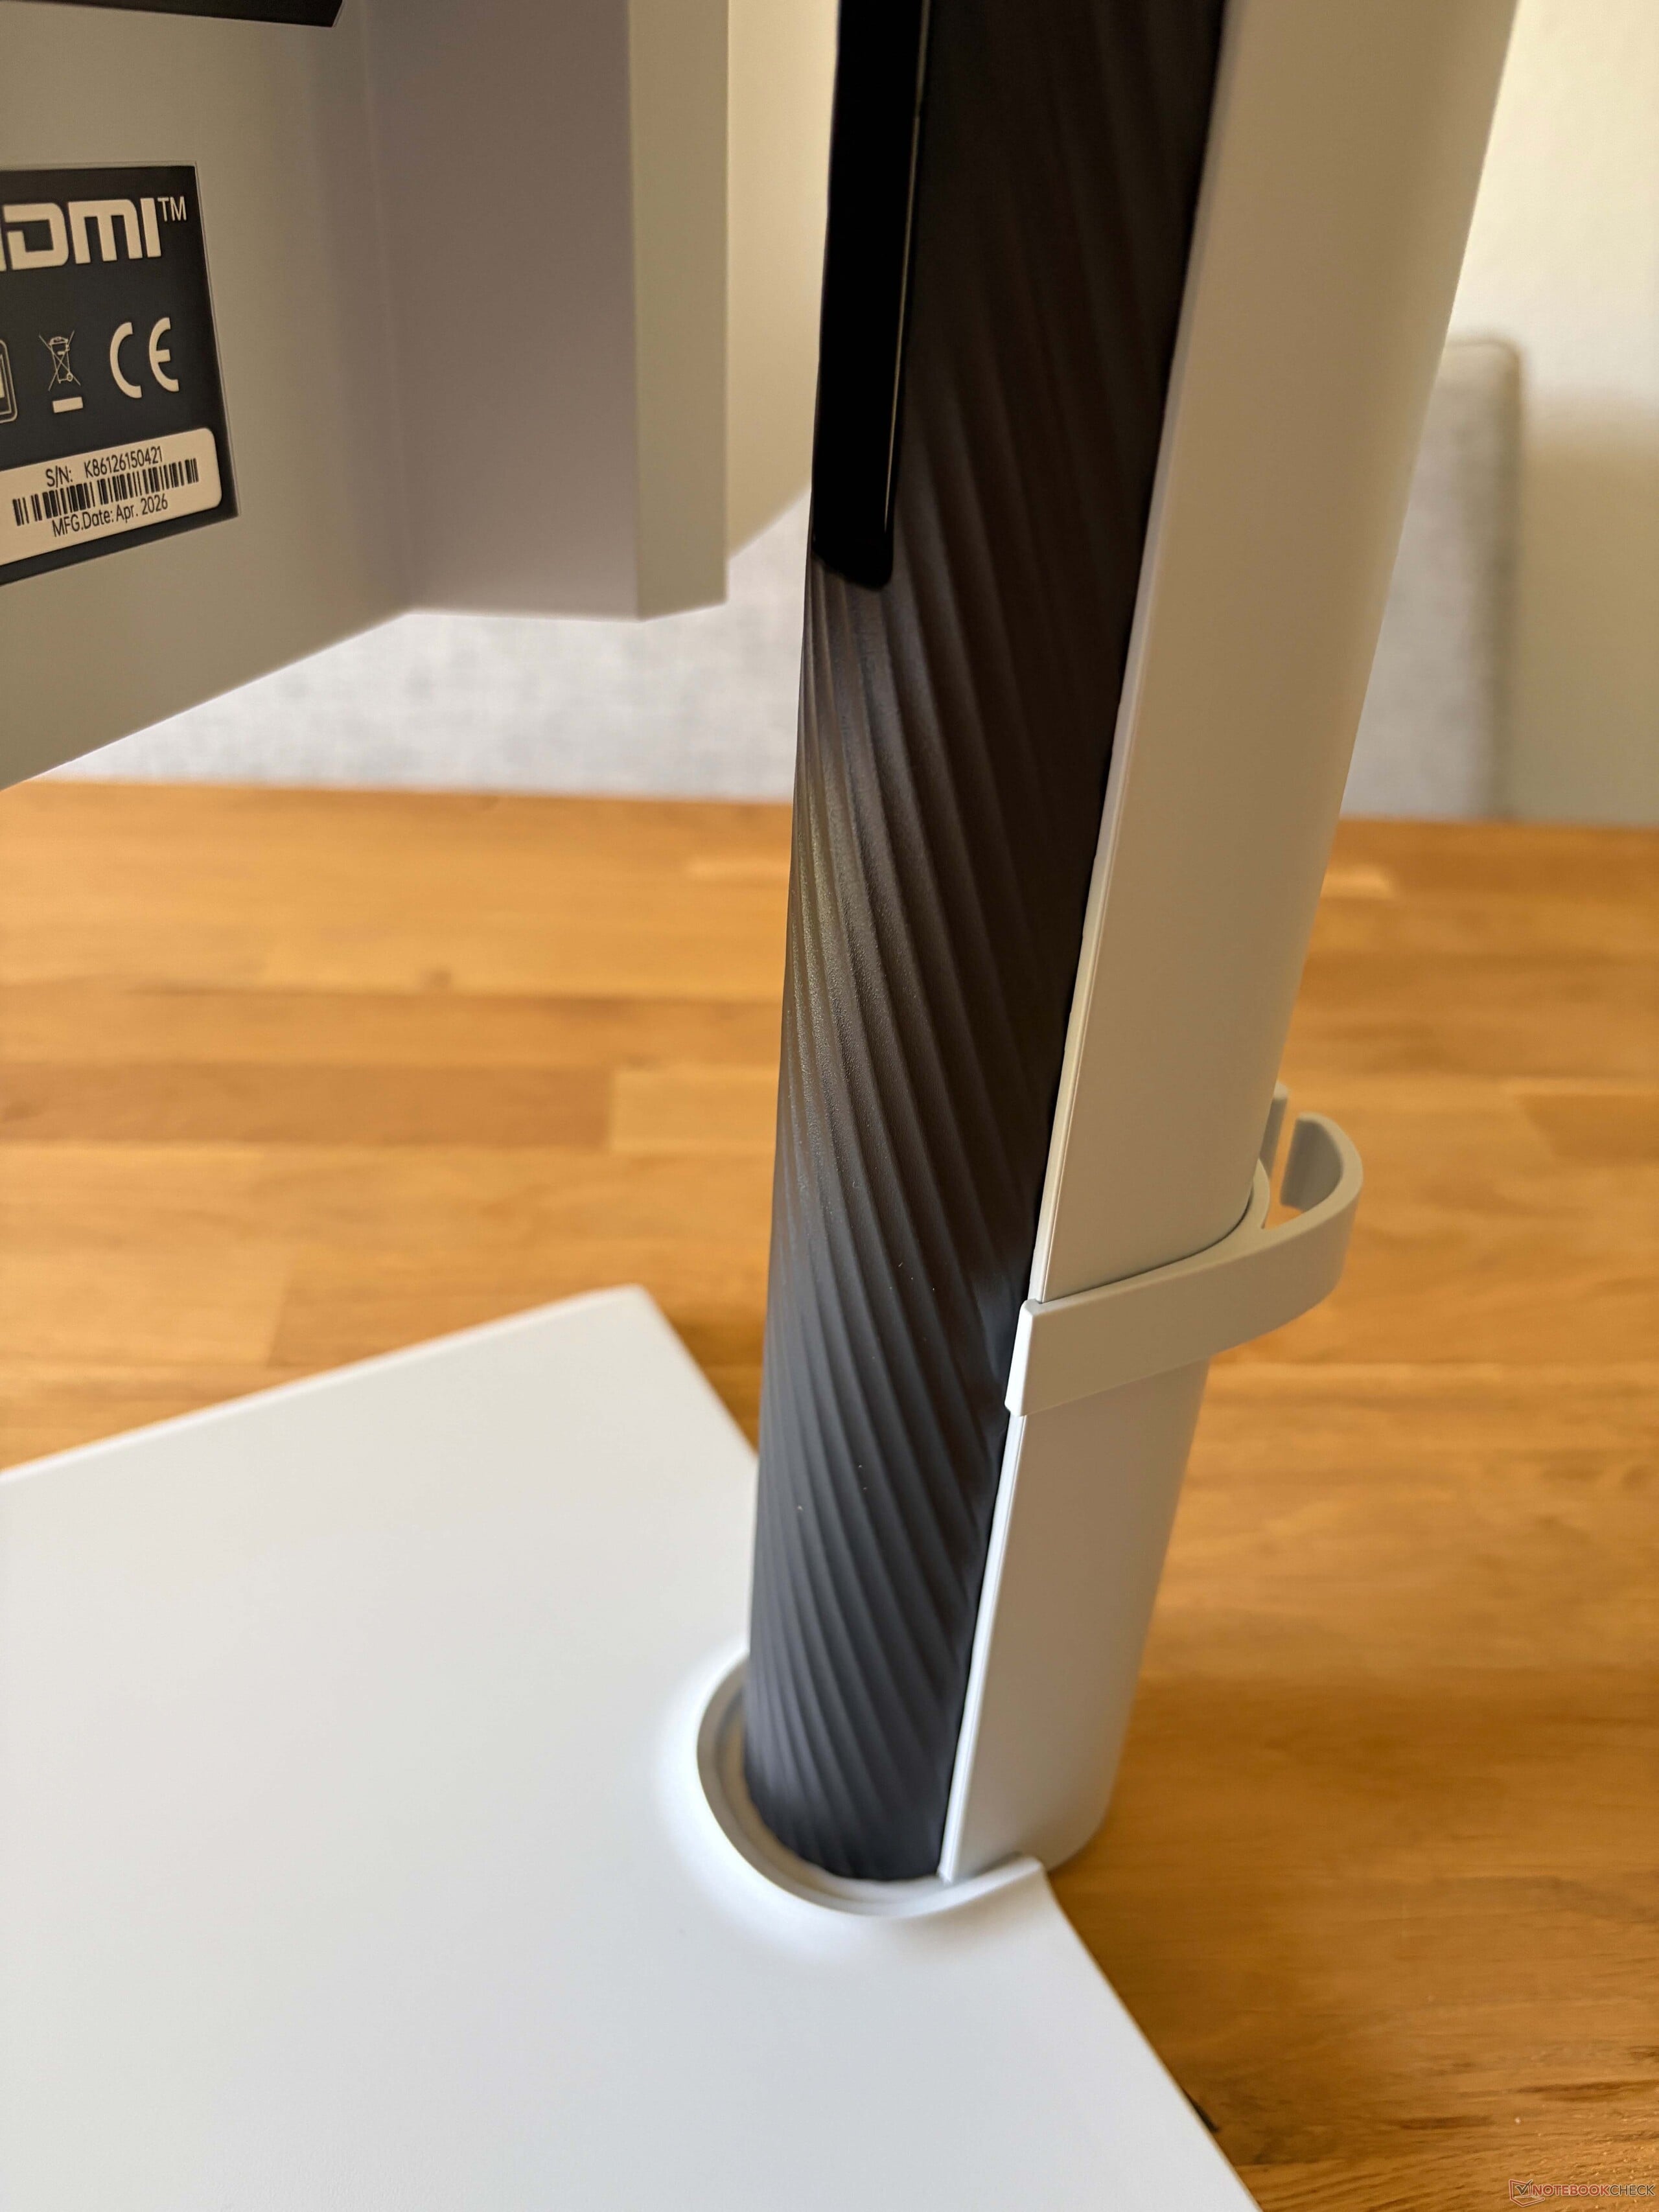
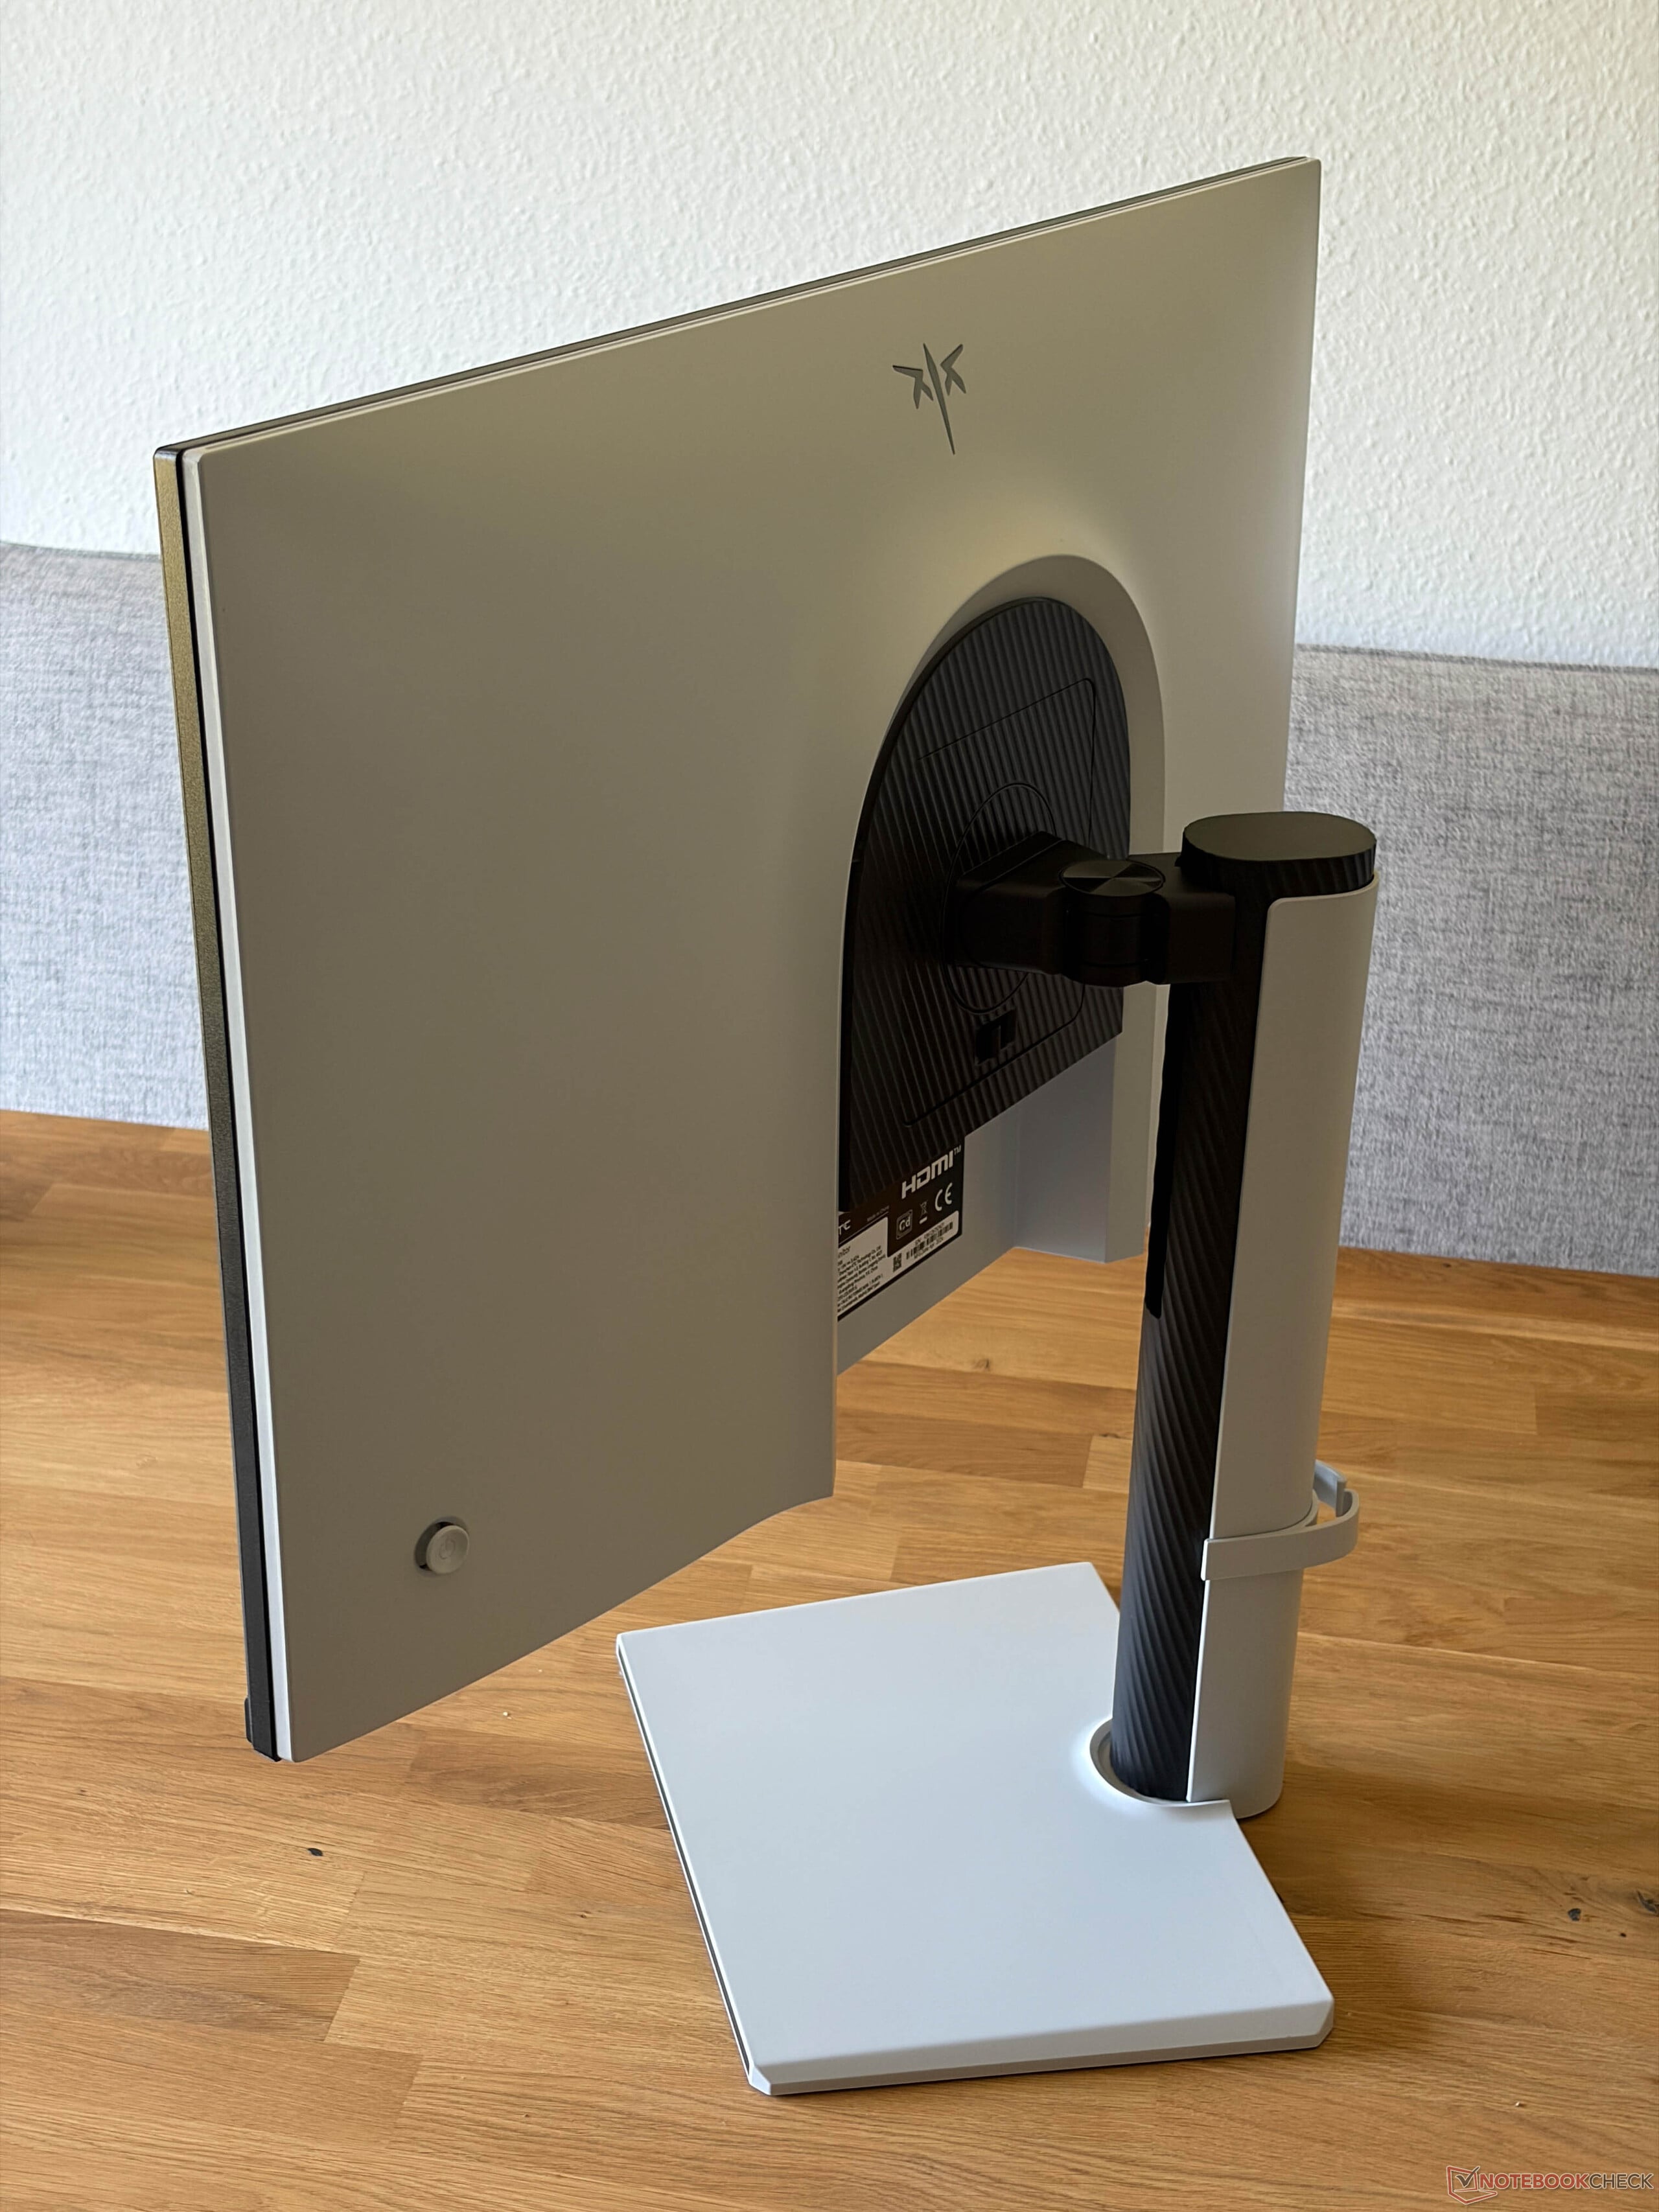
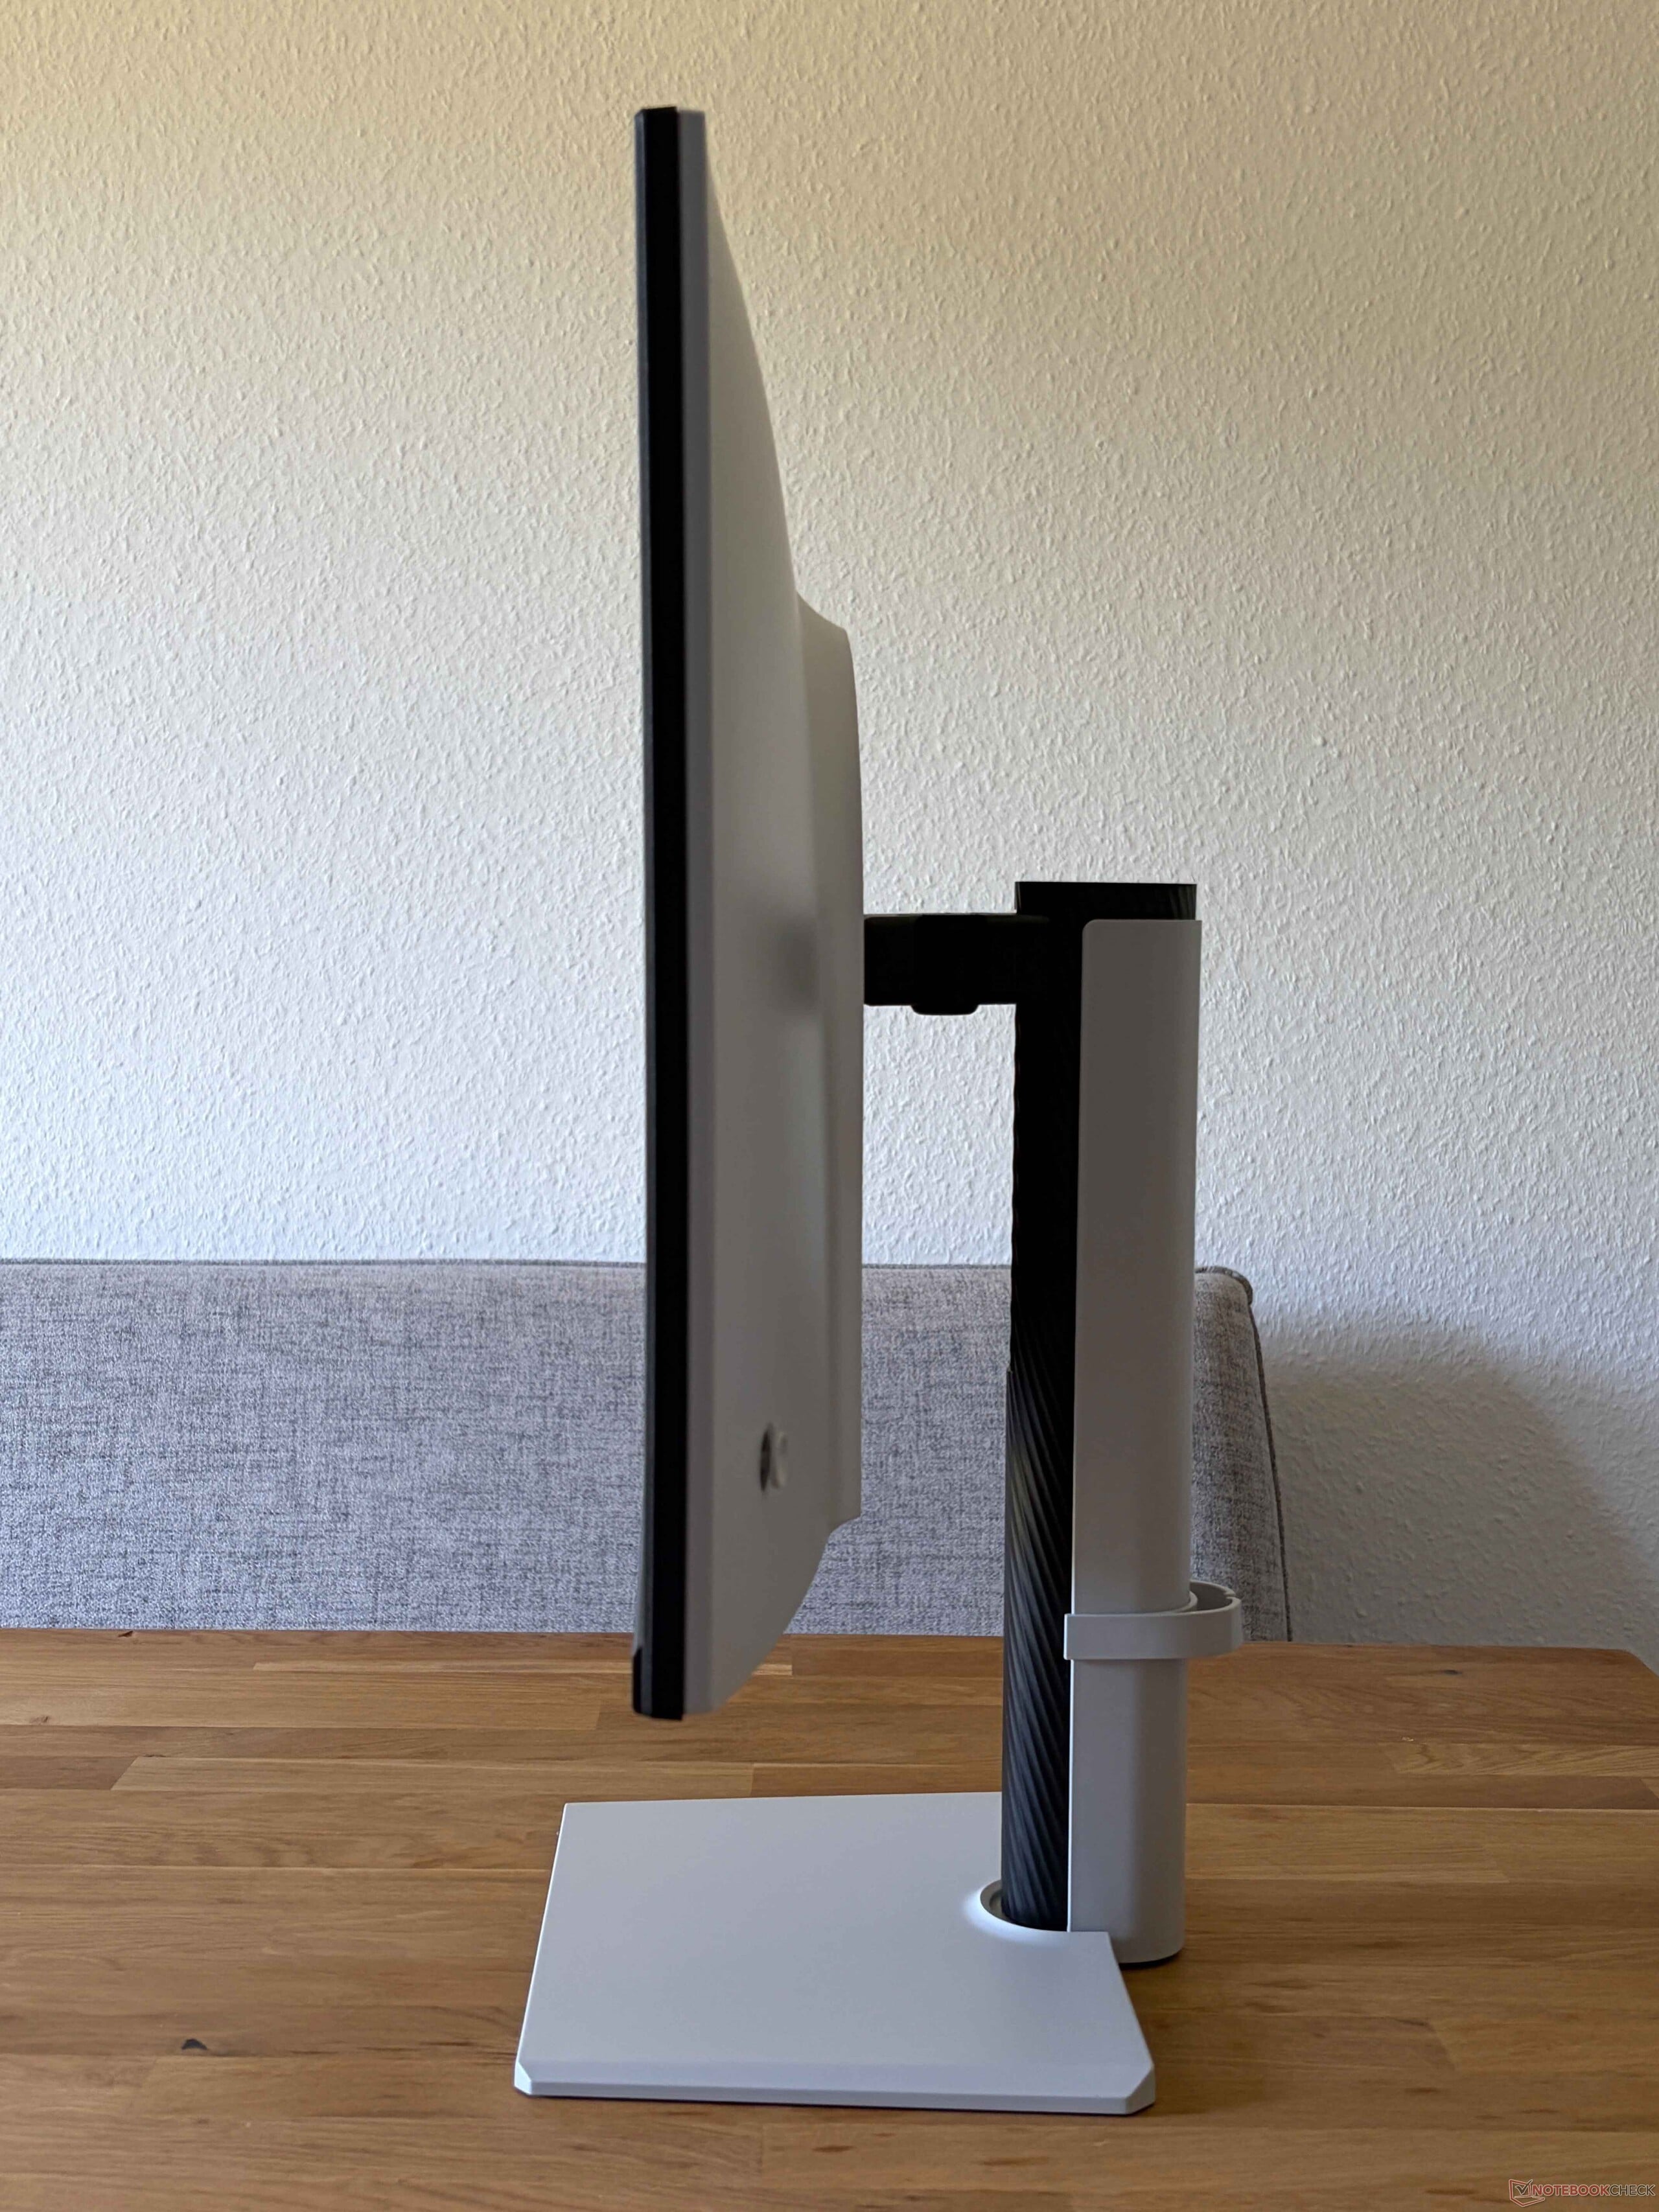
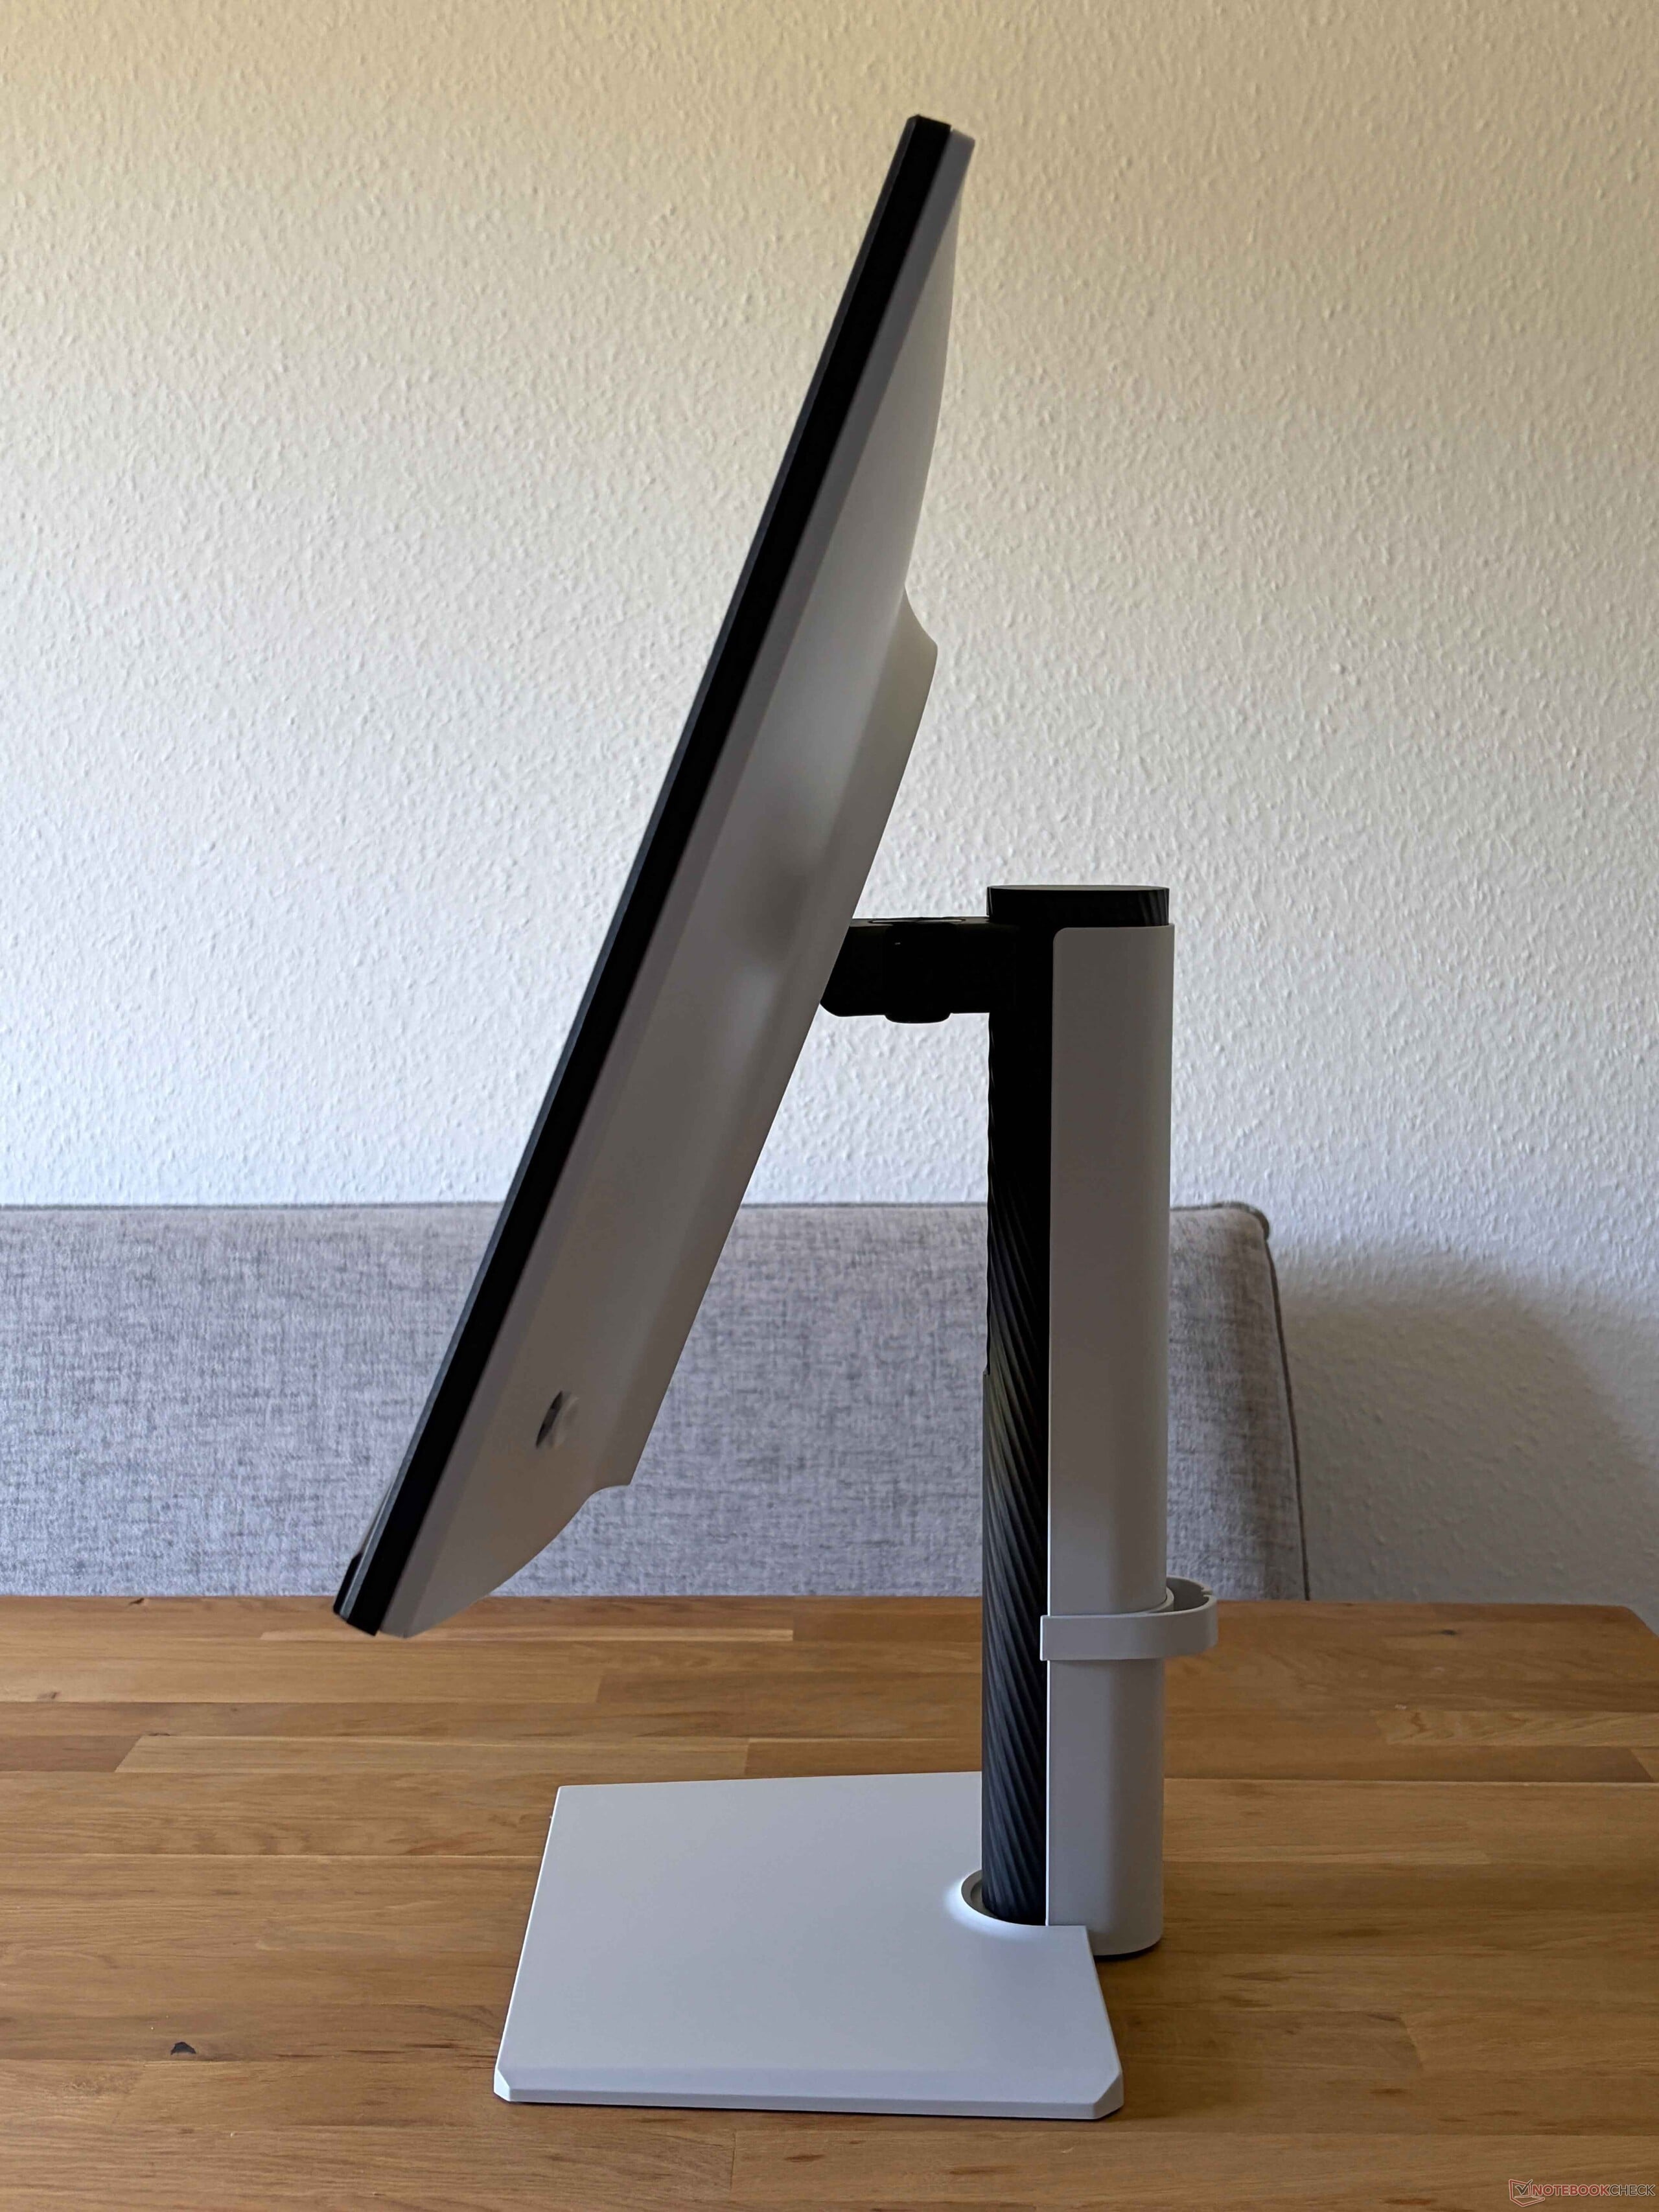
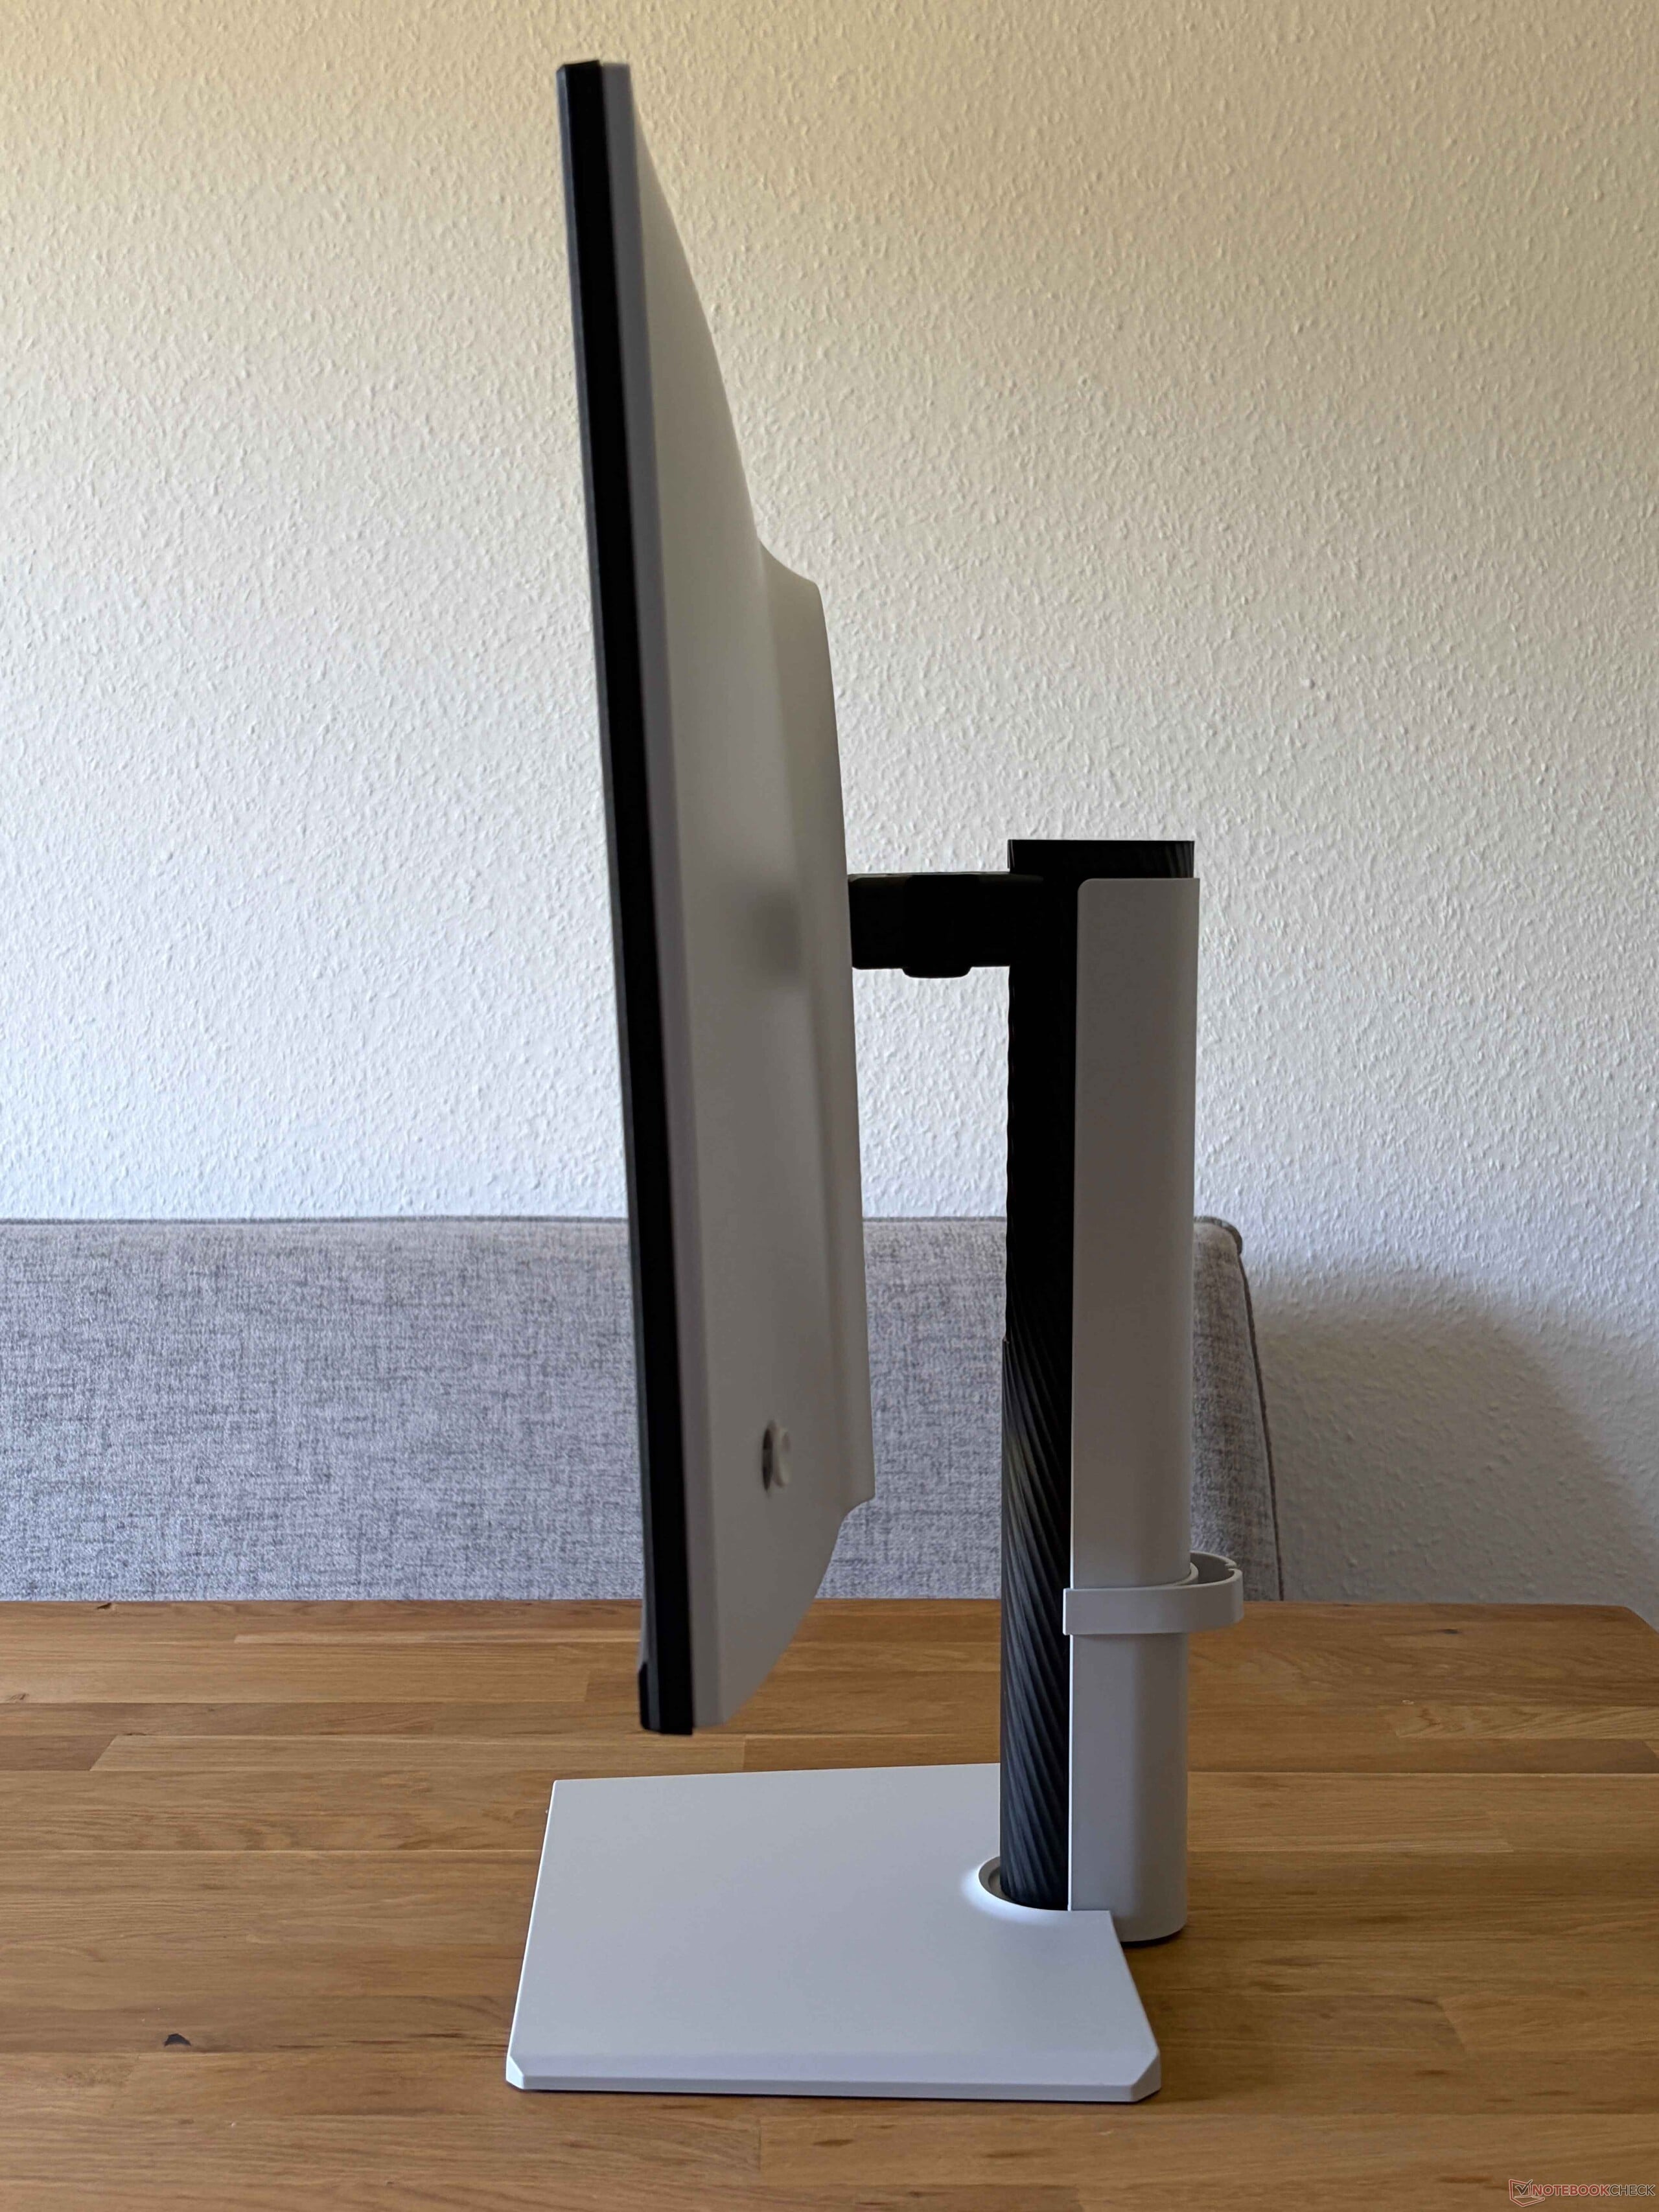
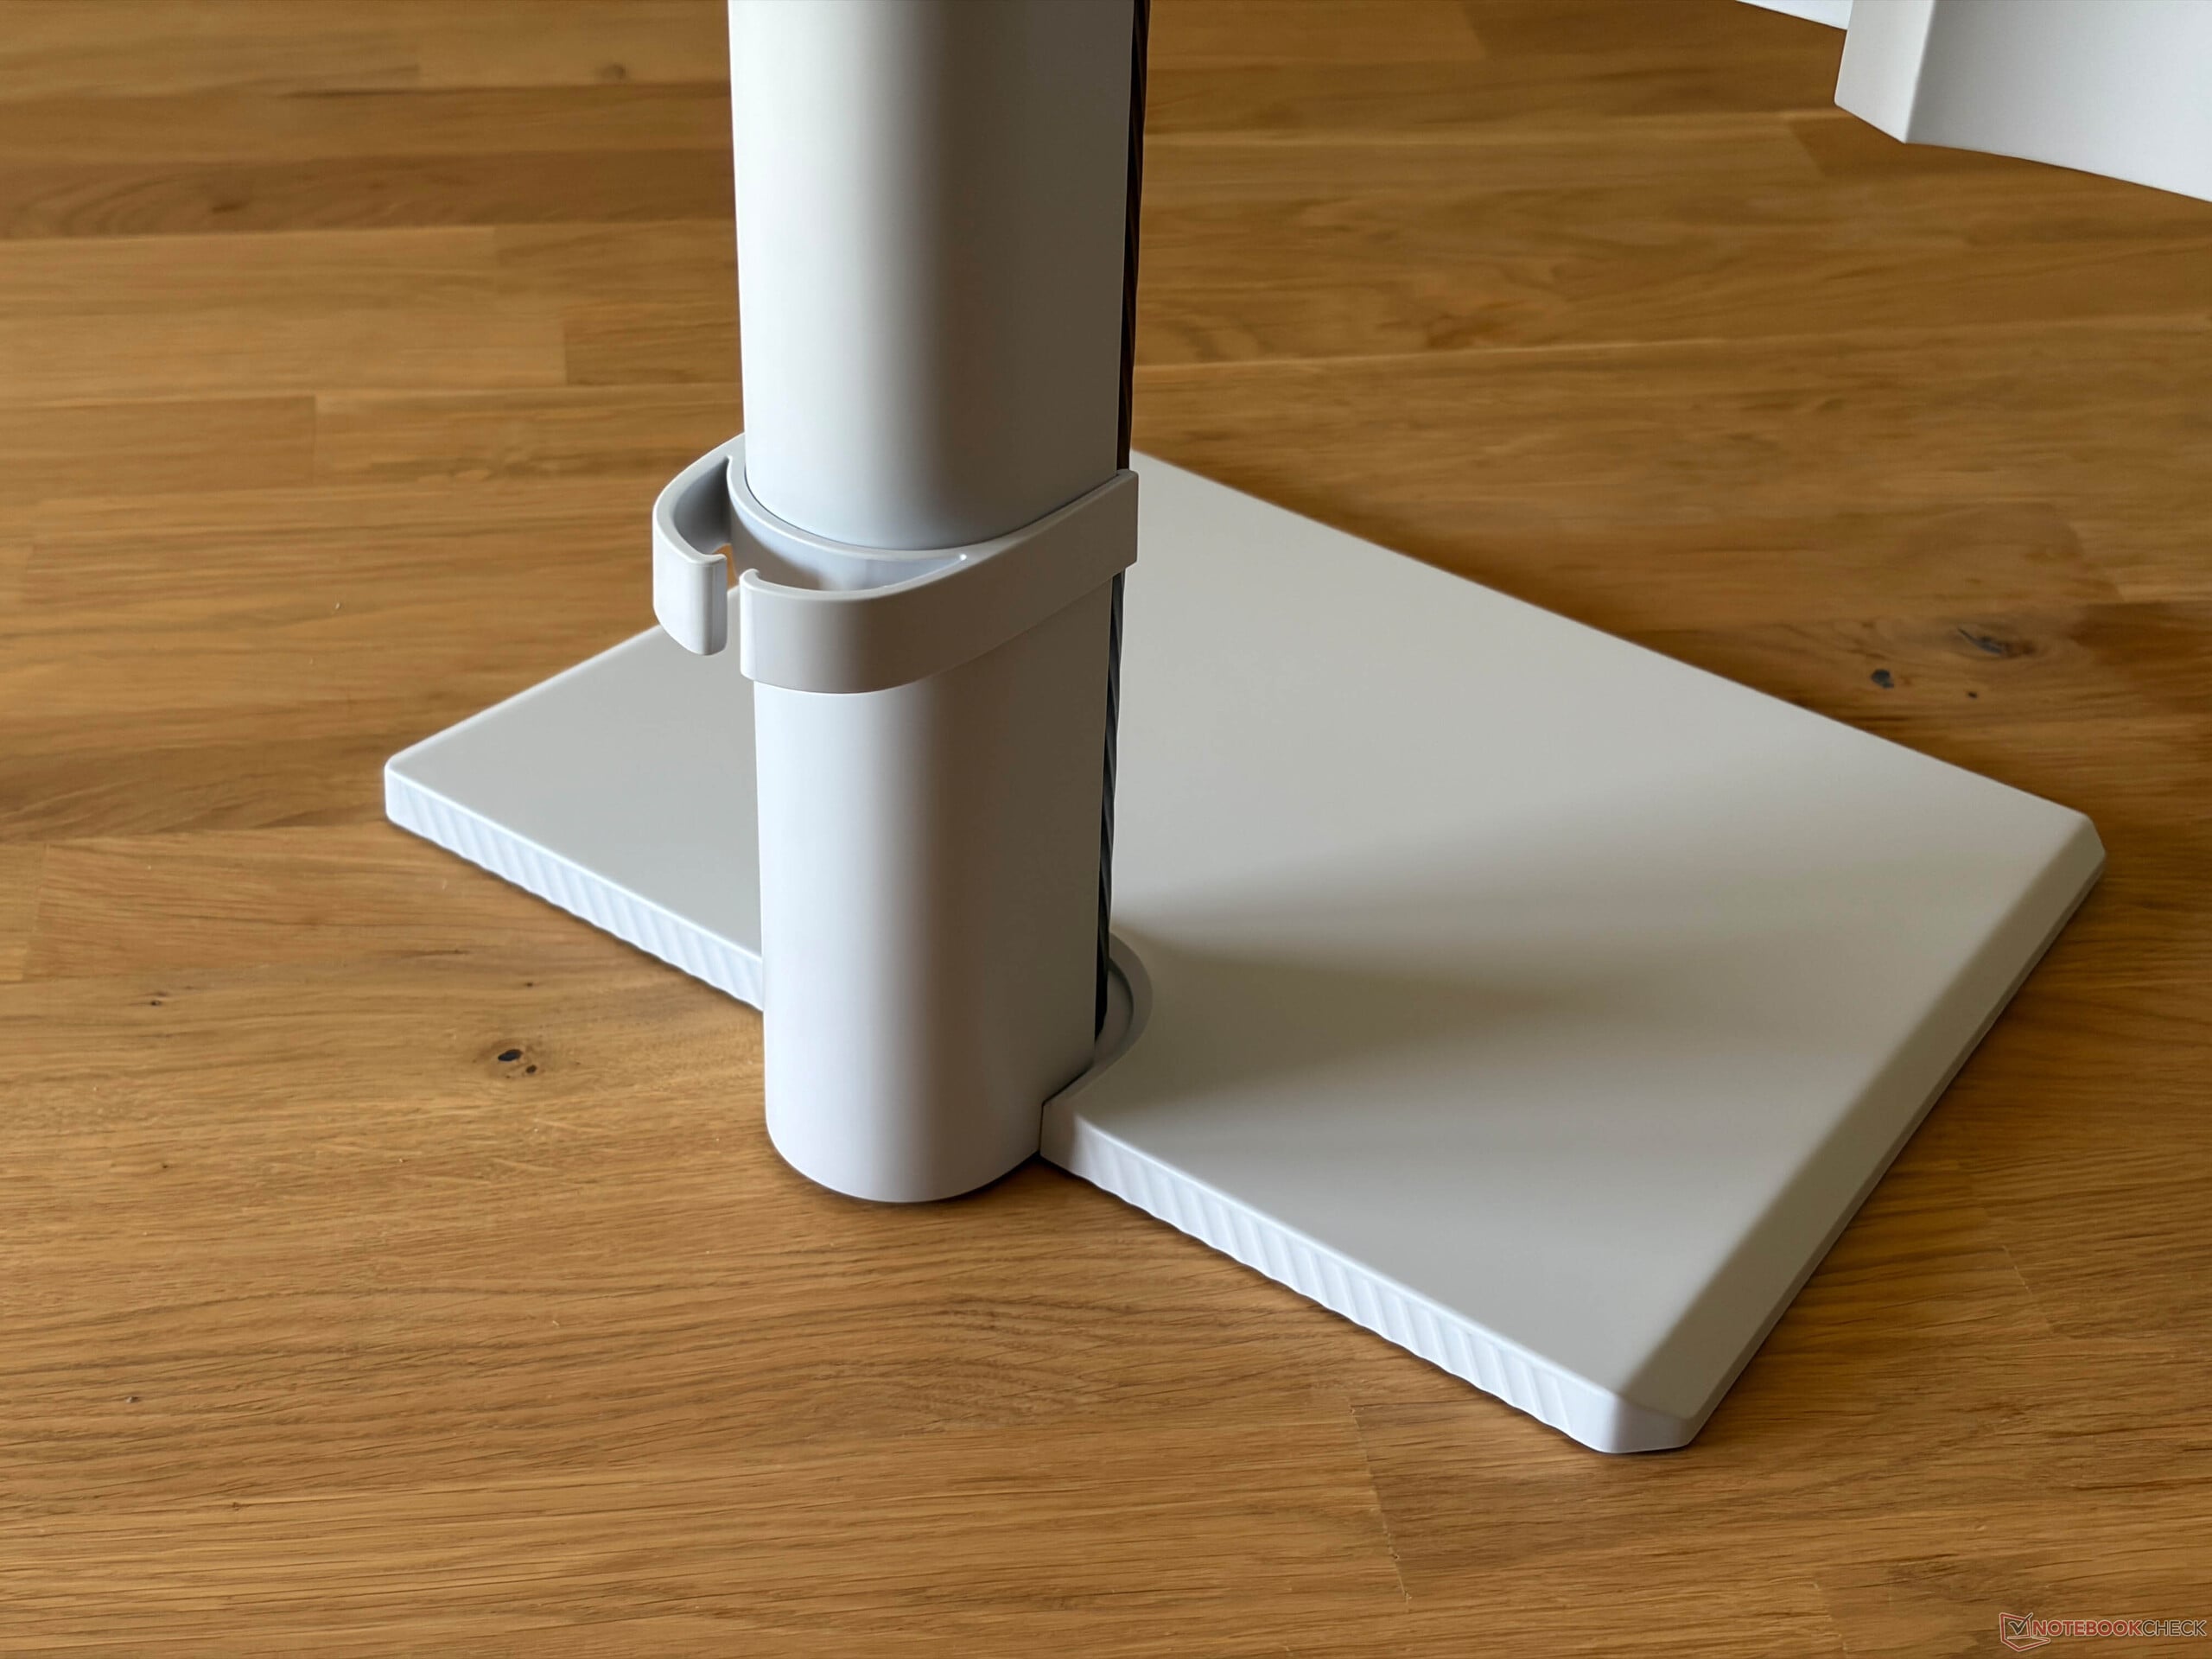
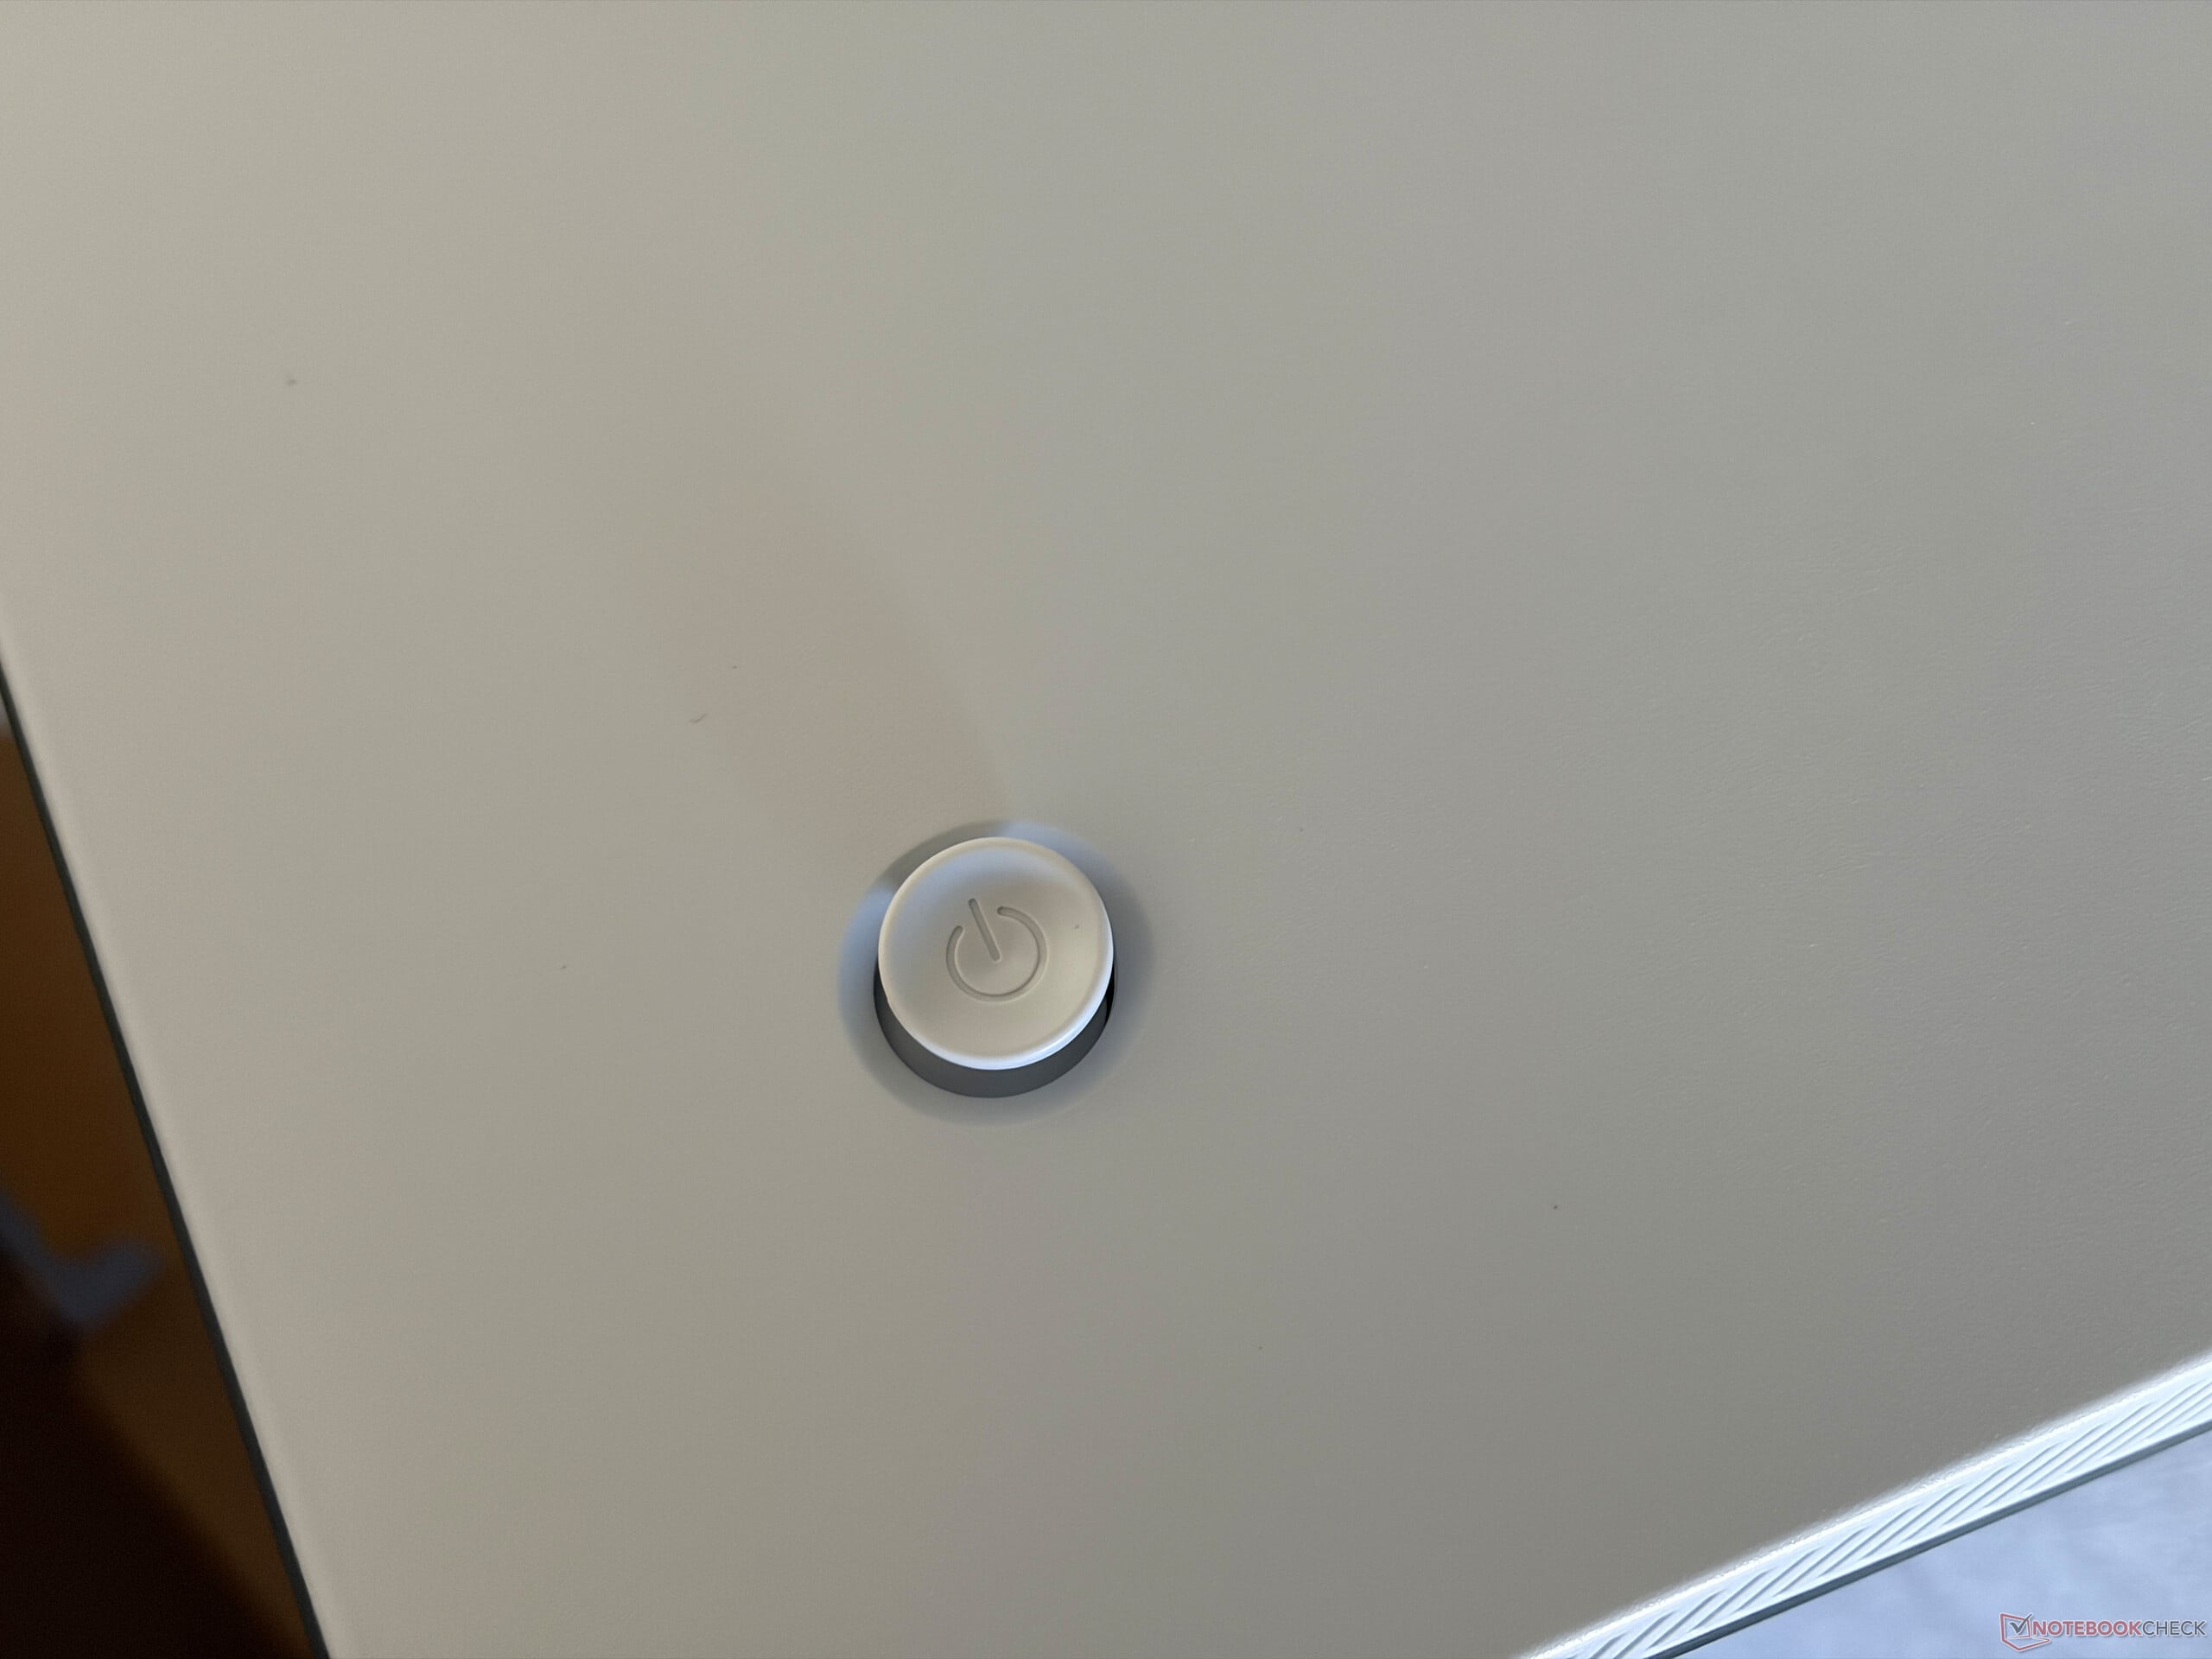
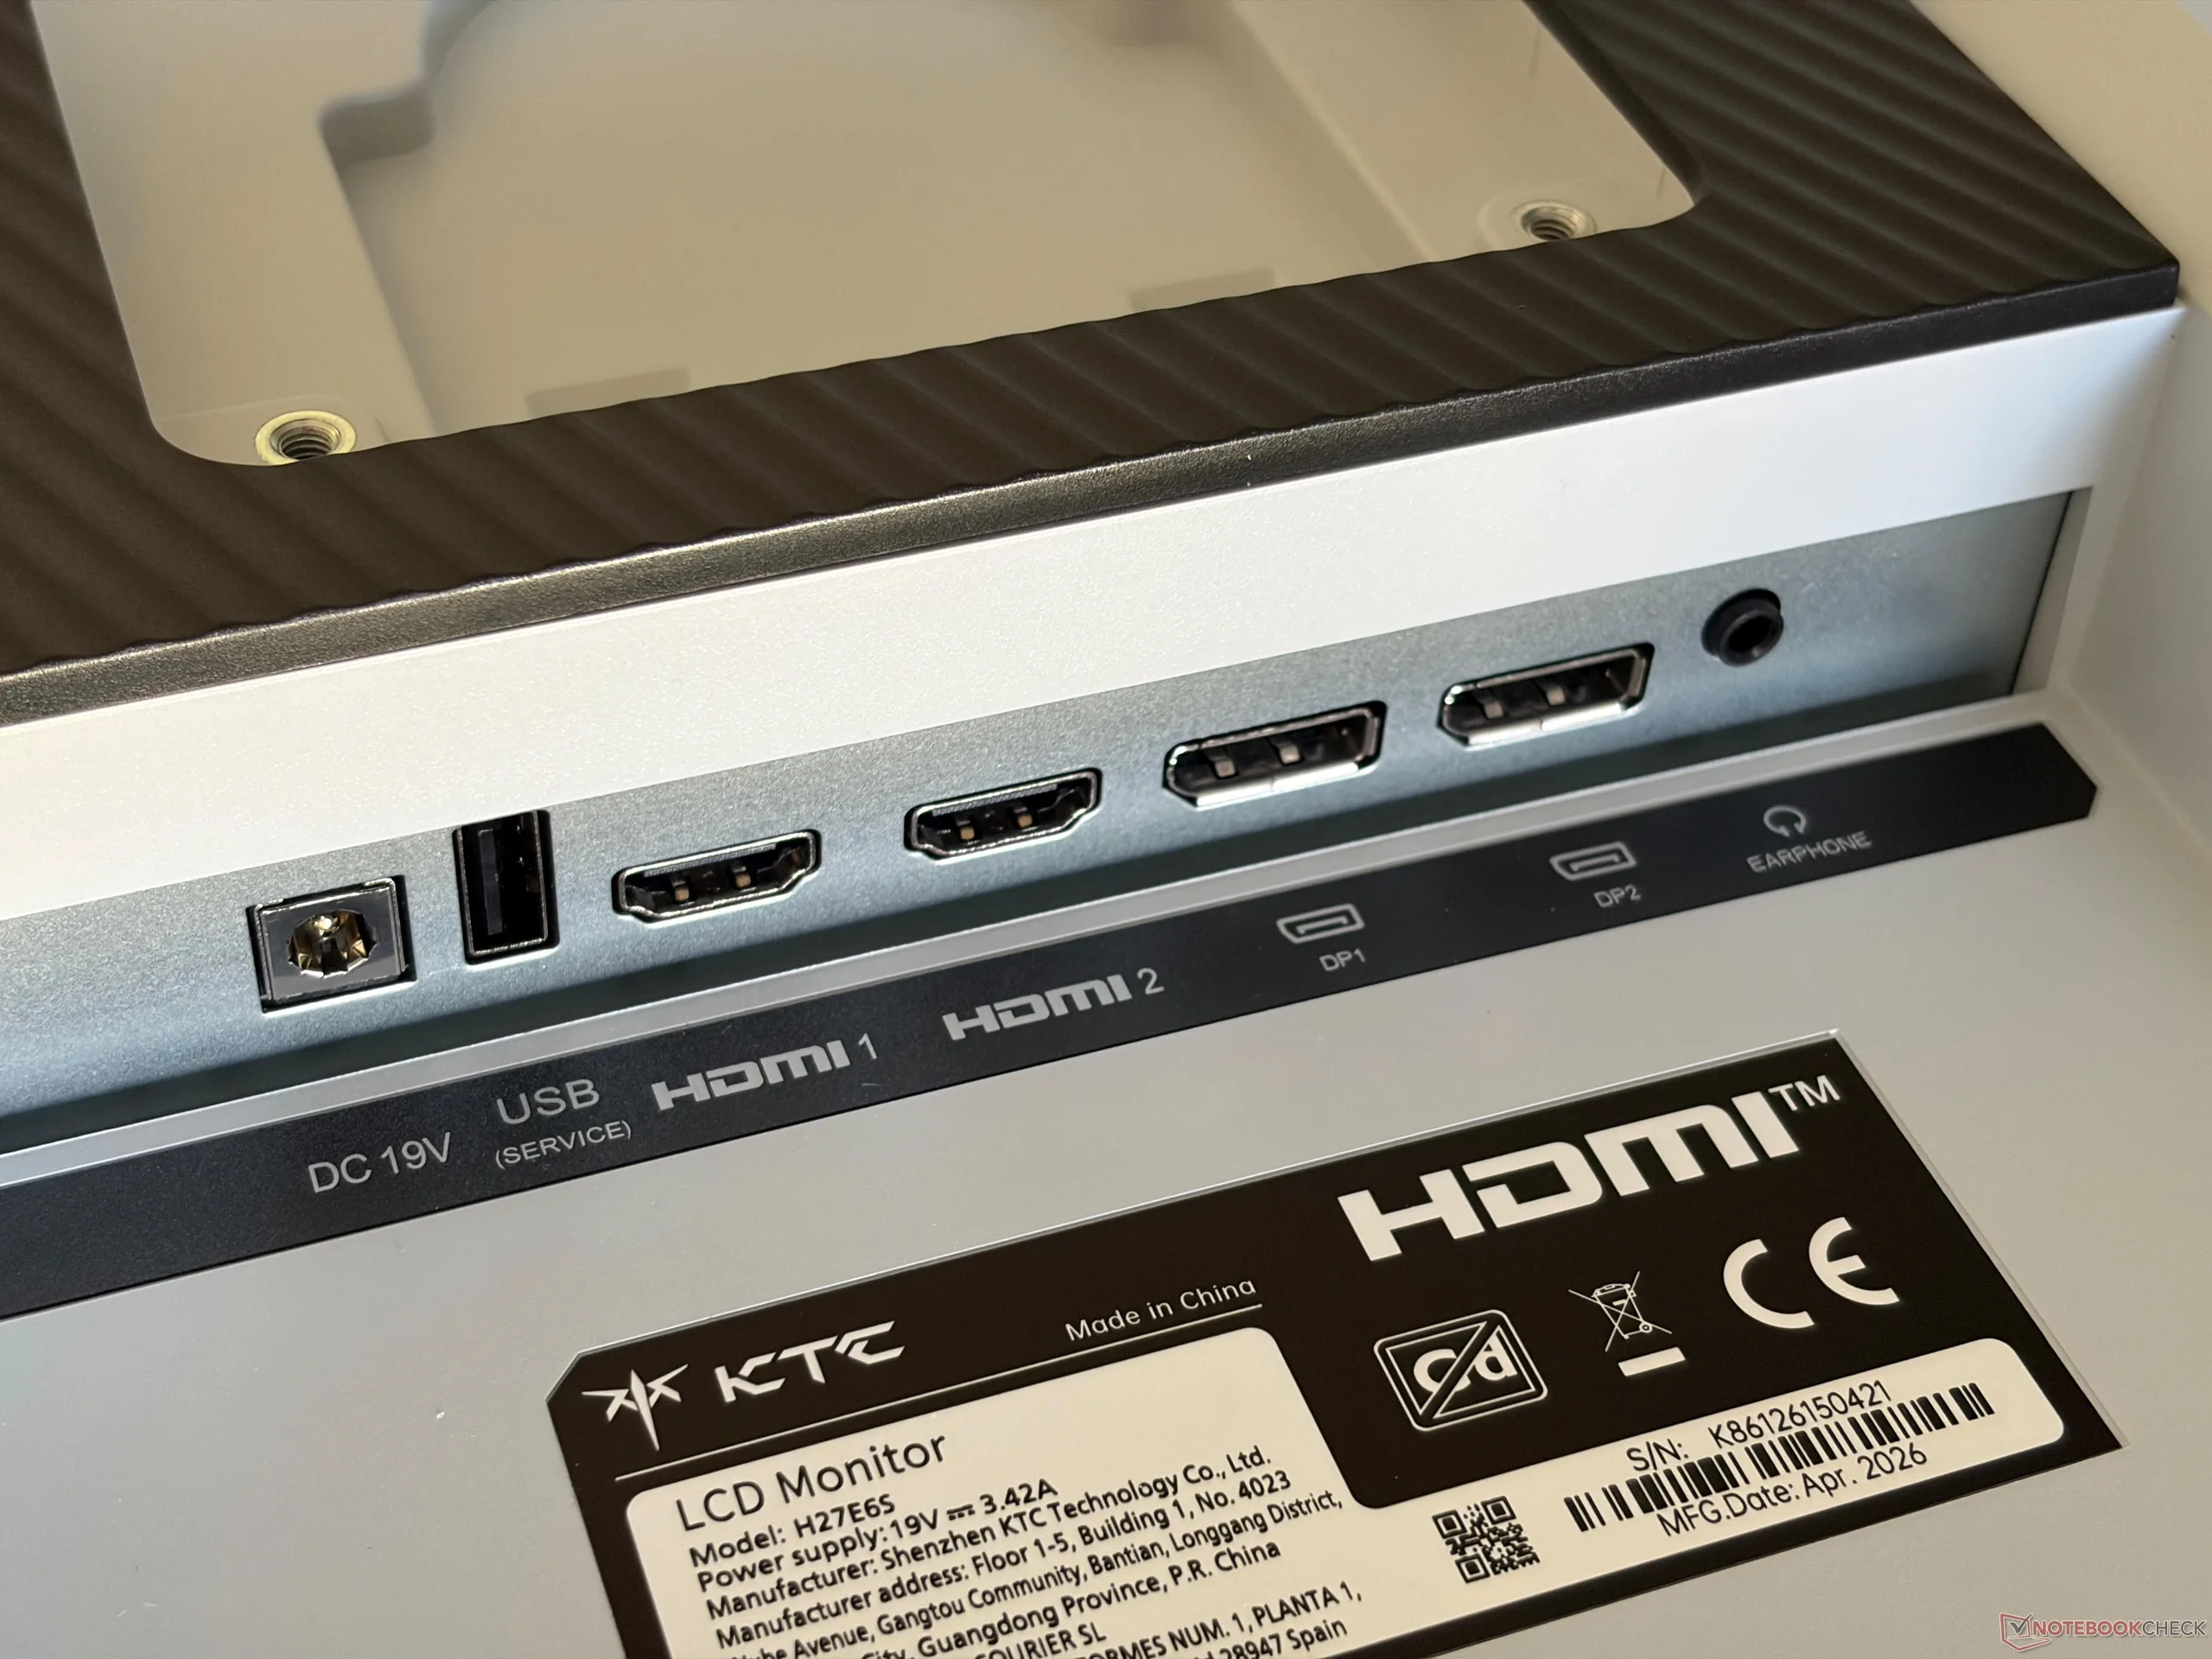
屏幕菜单通过显示器背面的摇杆(右下角)进行控制,该摇杆同时也兼作电源按钮。 操作界面直观易用,我们在测试过程中未遇到任何问题。接口均位于机身背面,包括两个HDMI接口和两个DisplayPort接口。宣传的240 Hz刷新率仅通过DisplayPort接口支持;若通过HDMI连接,刷新率则限制在144 Hz。
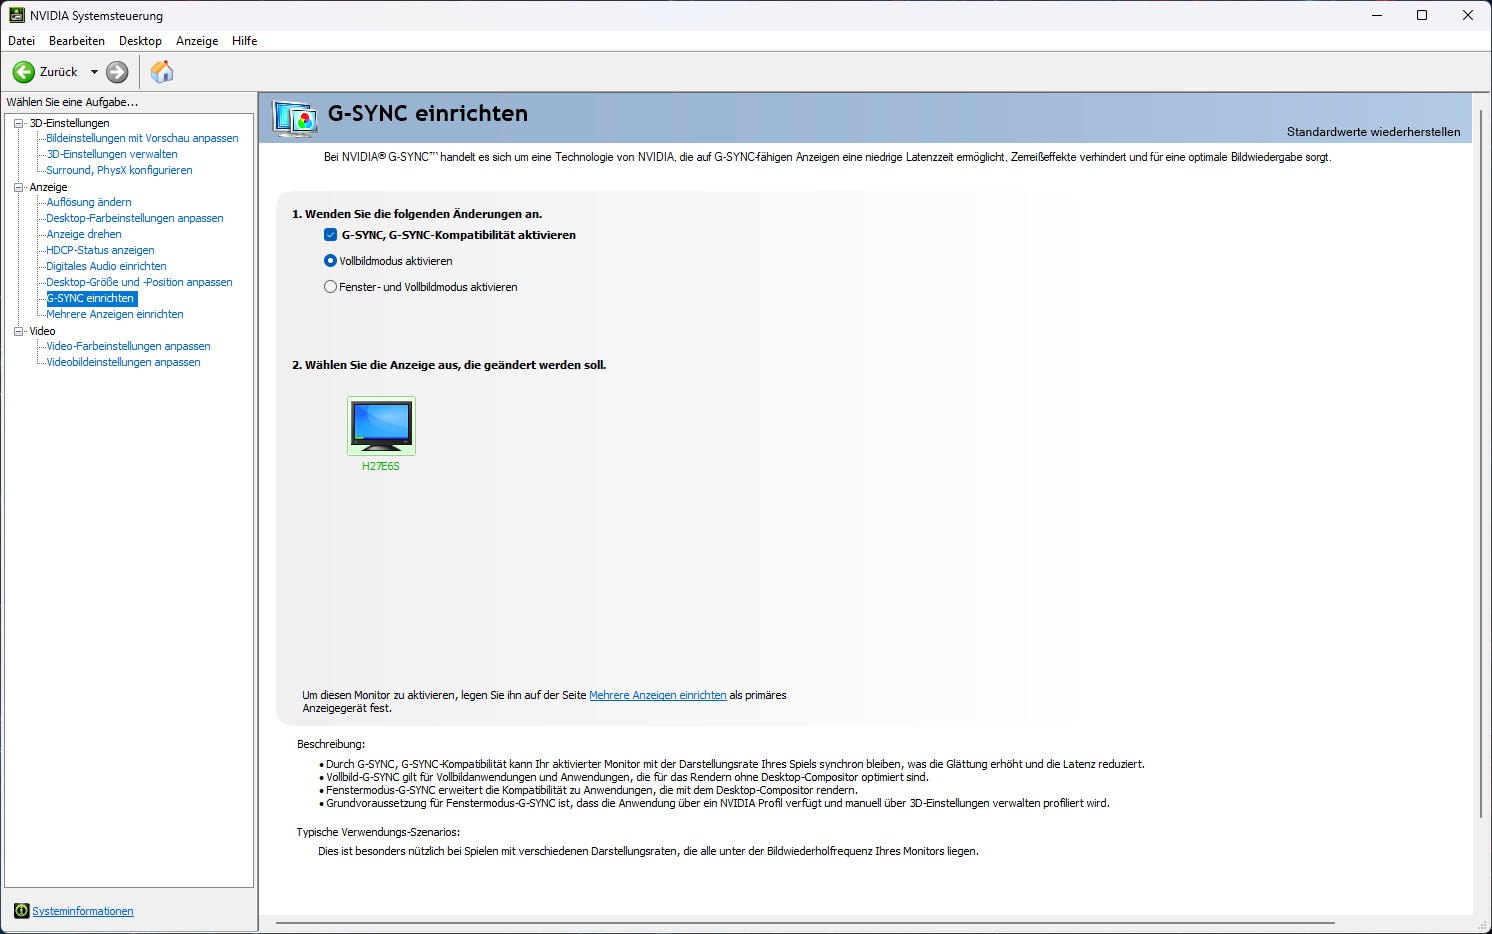
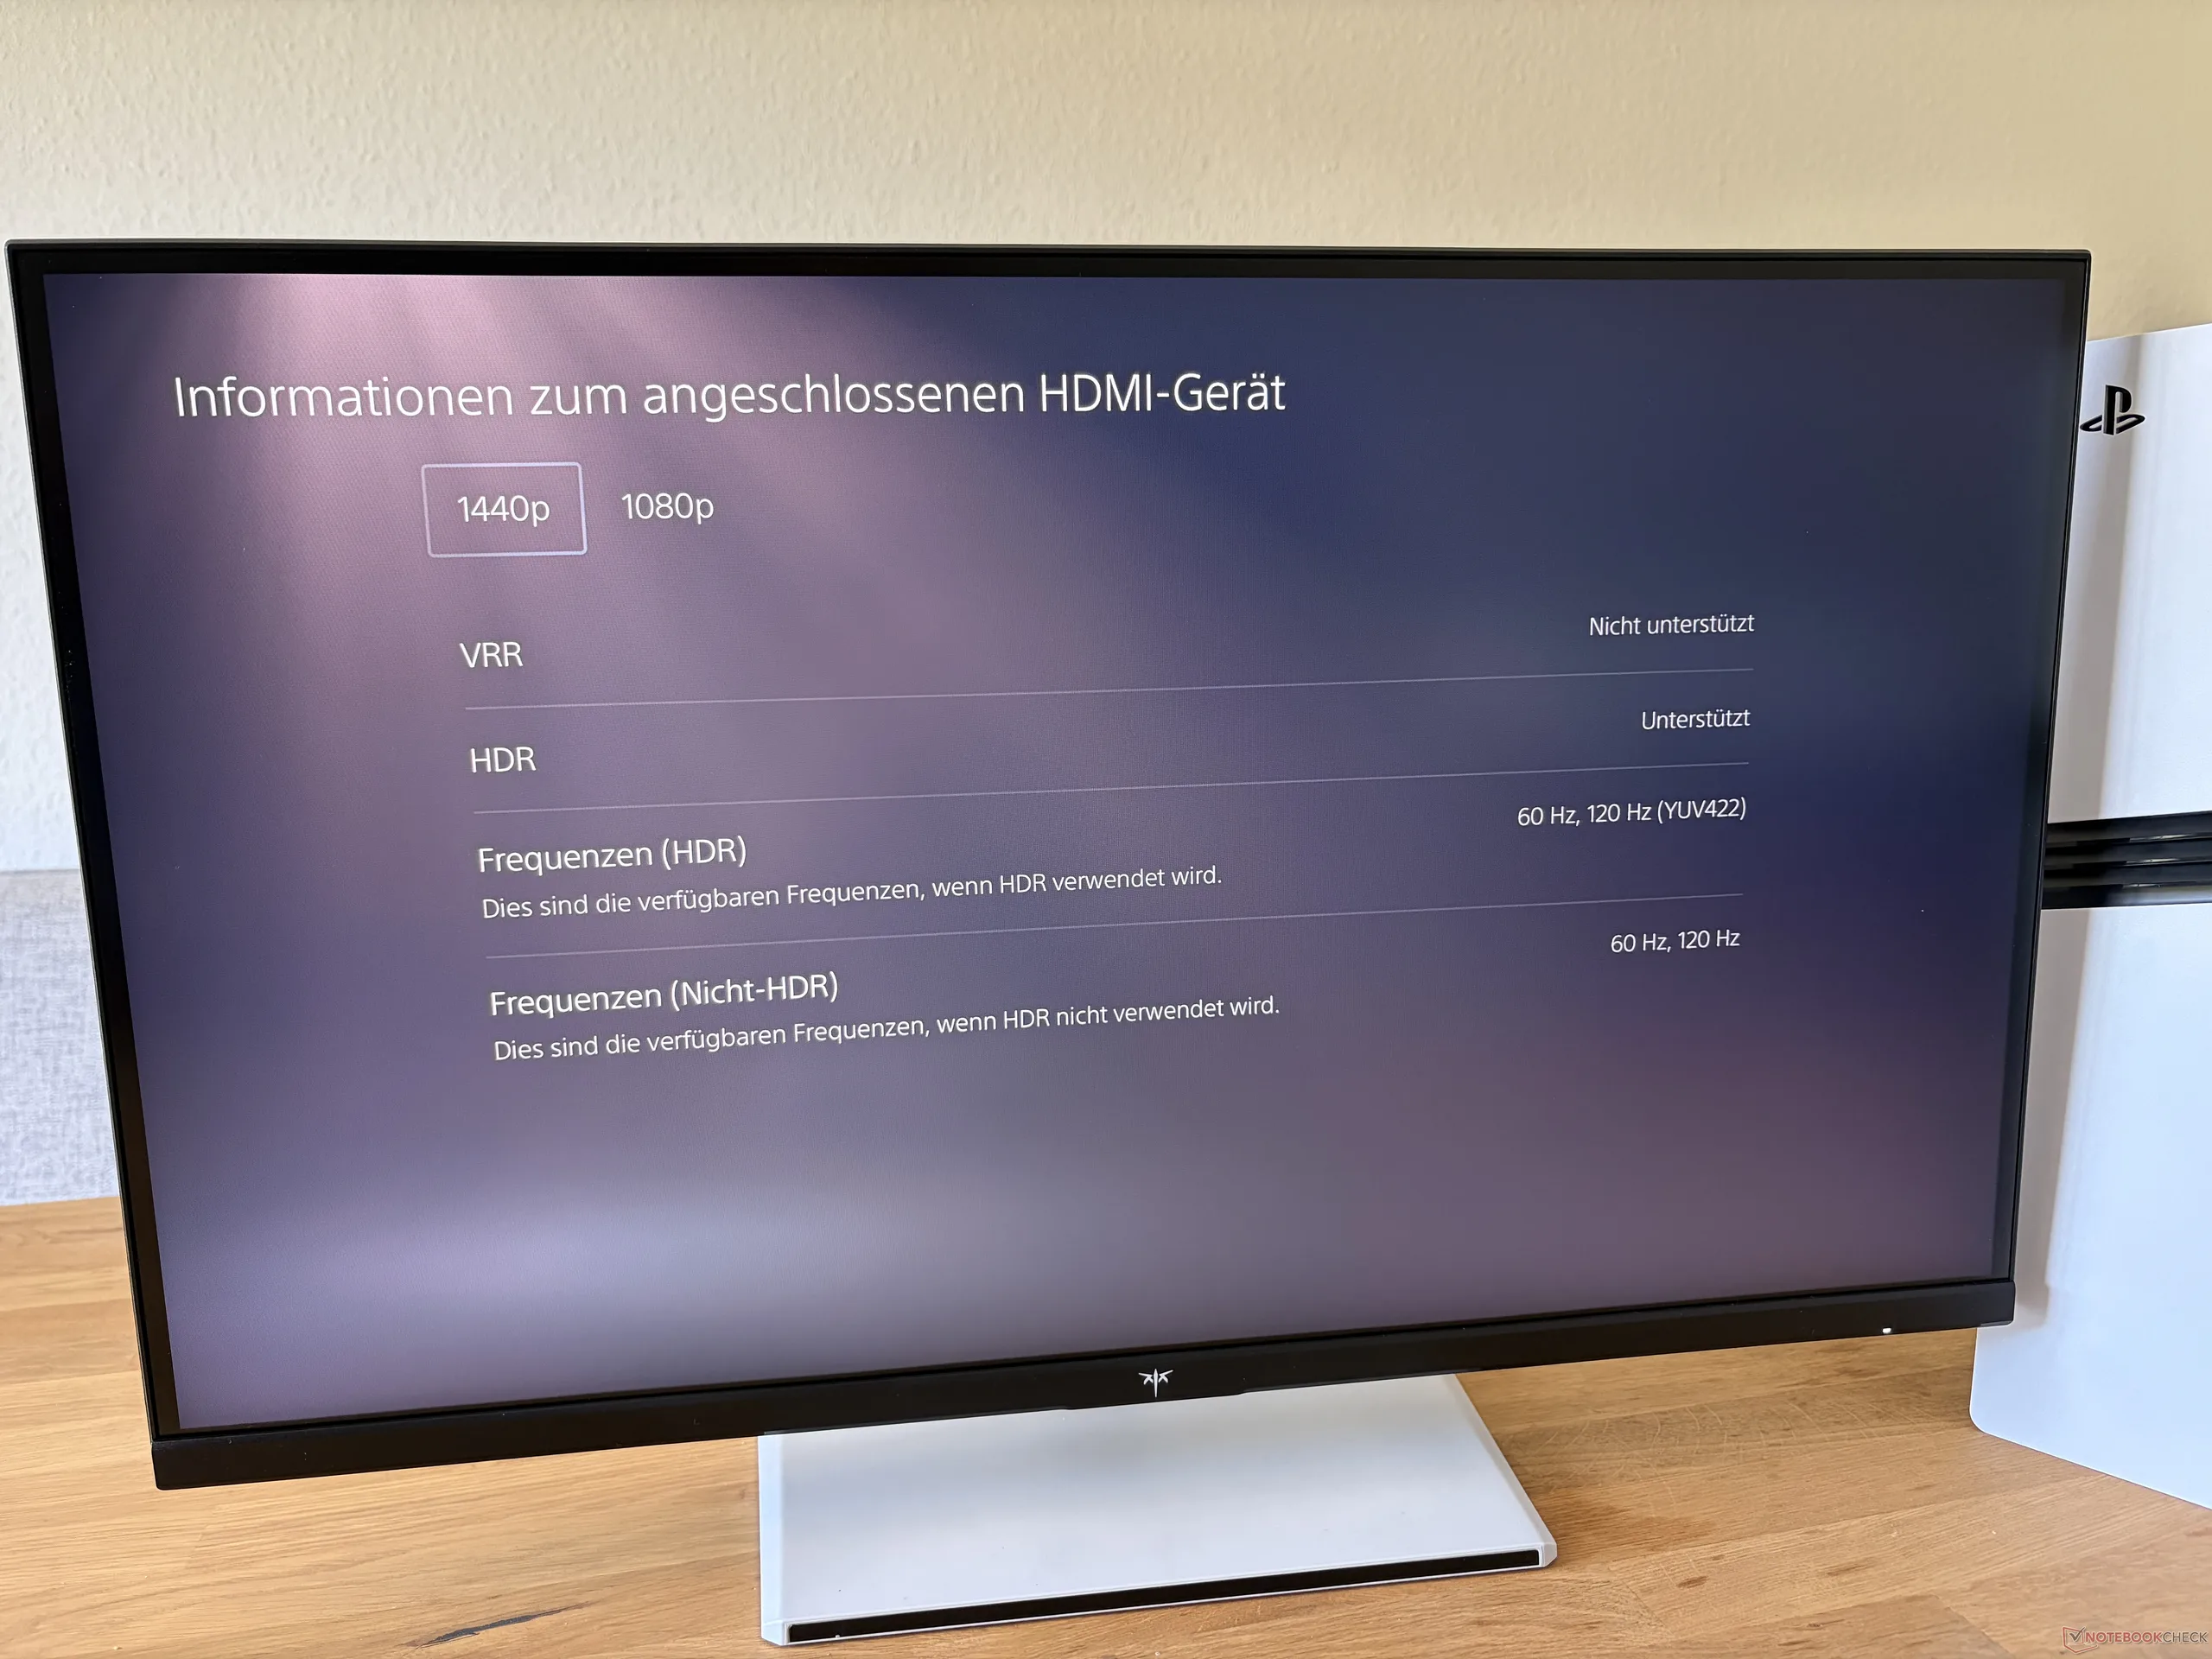
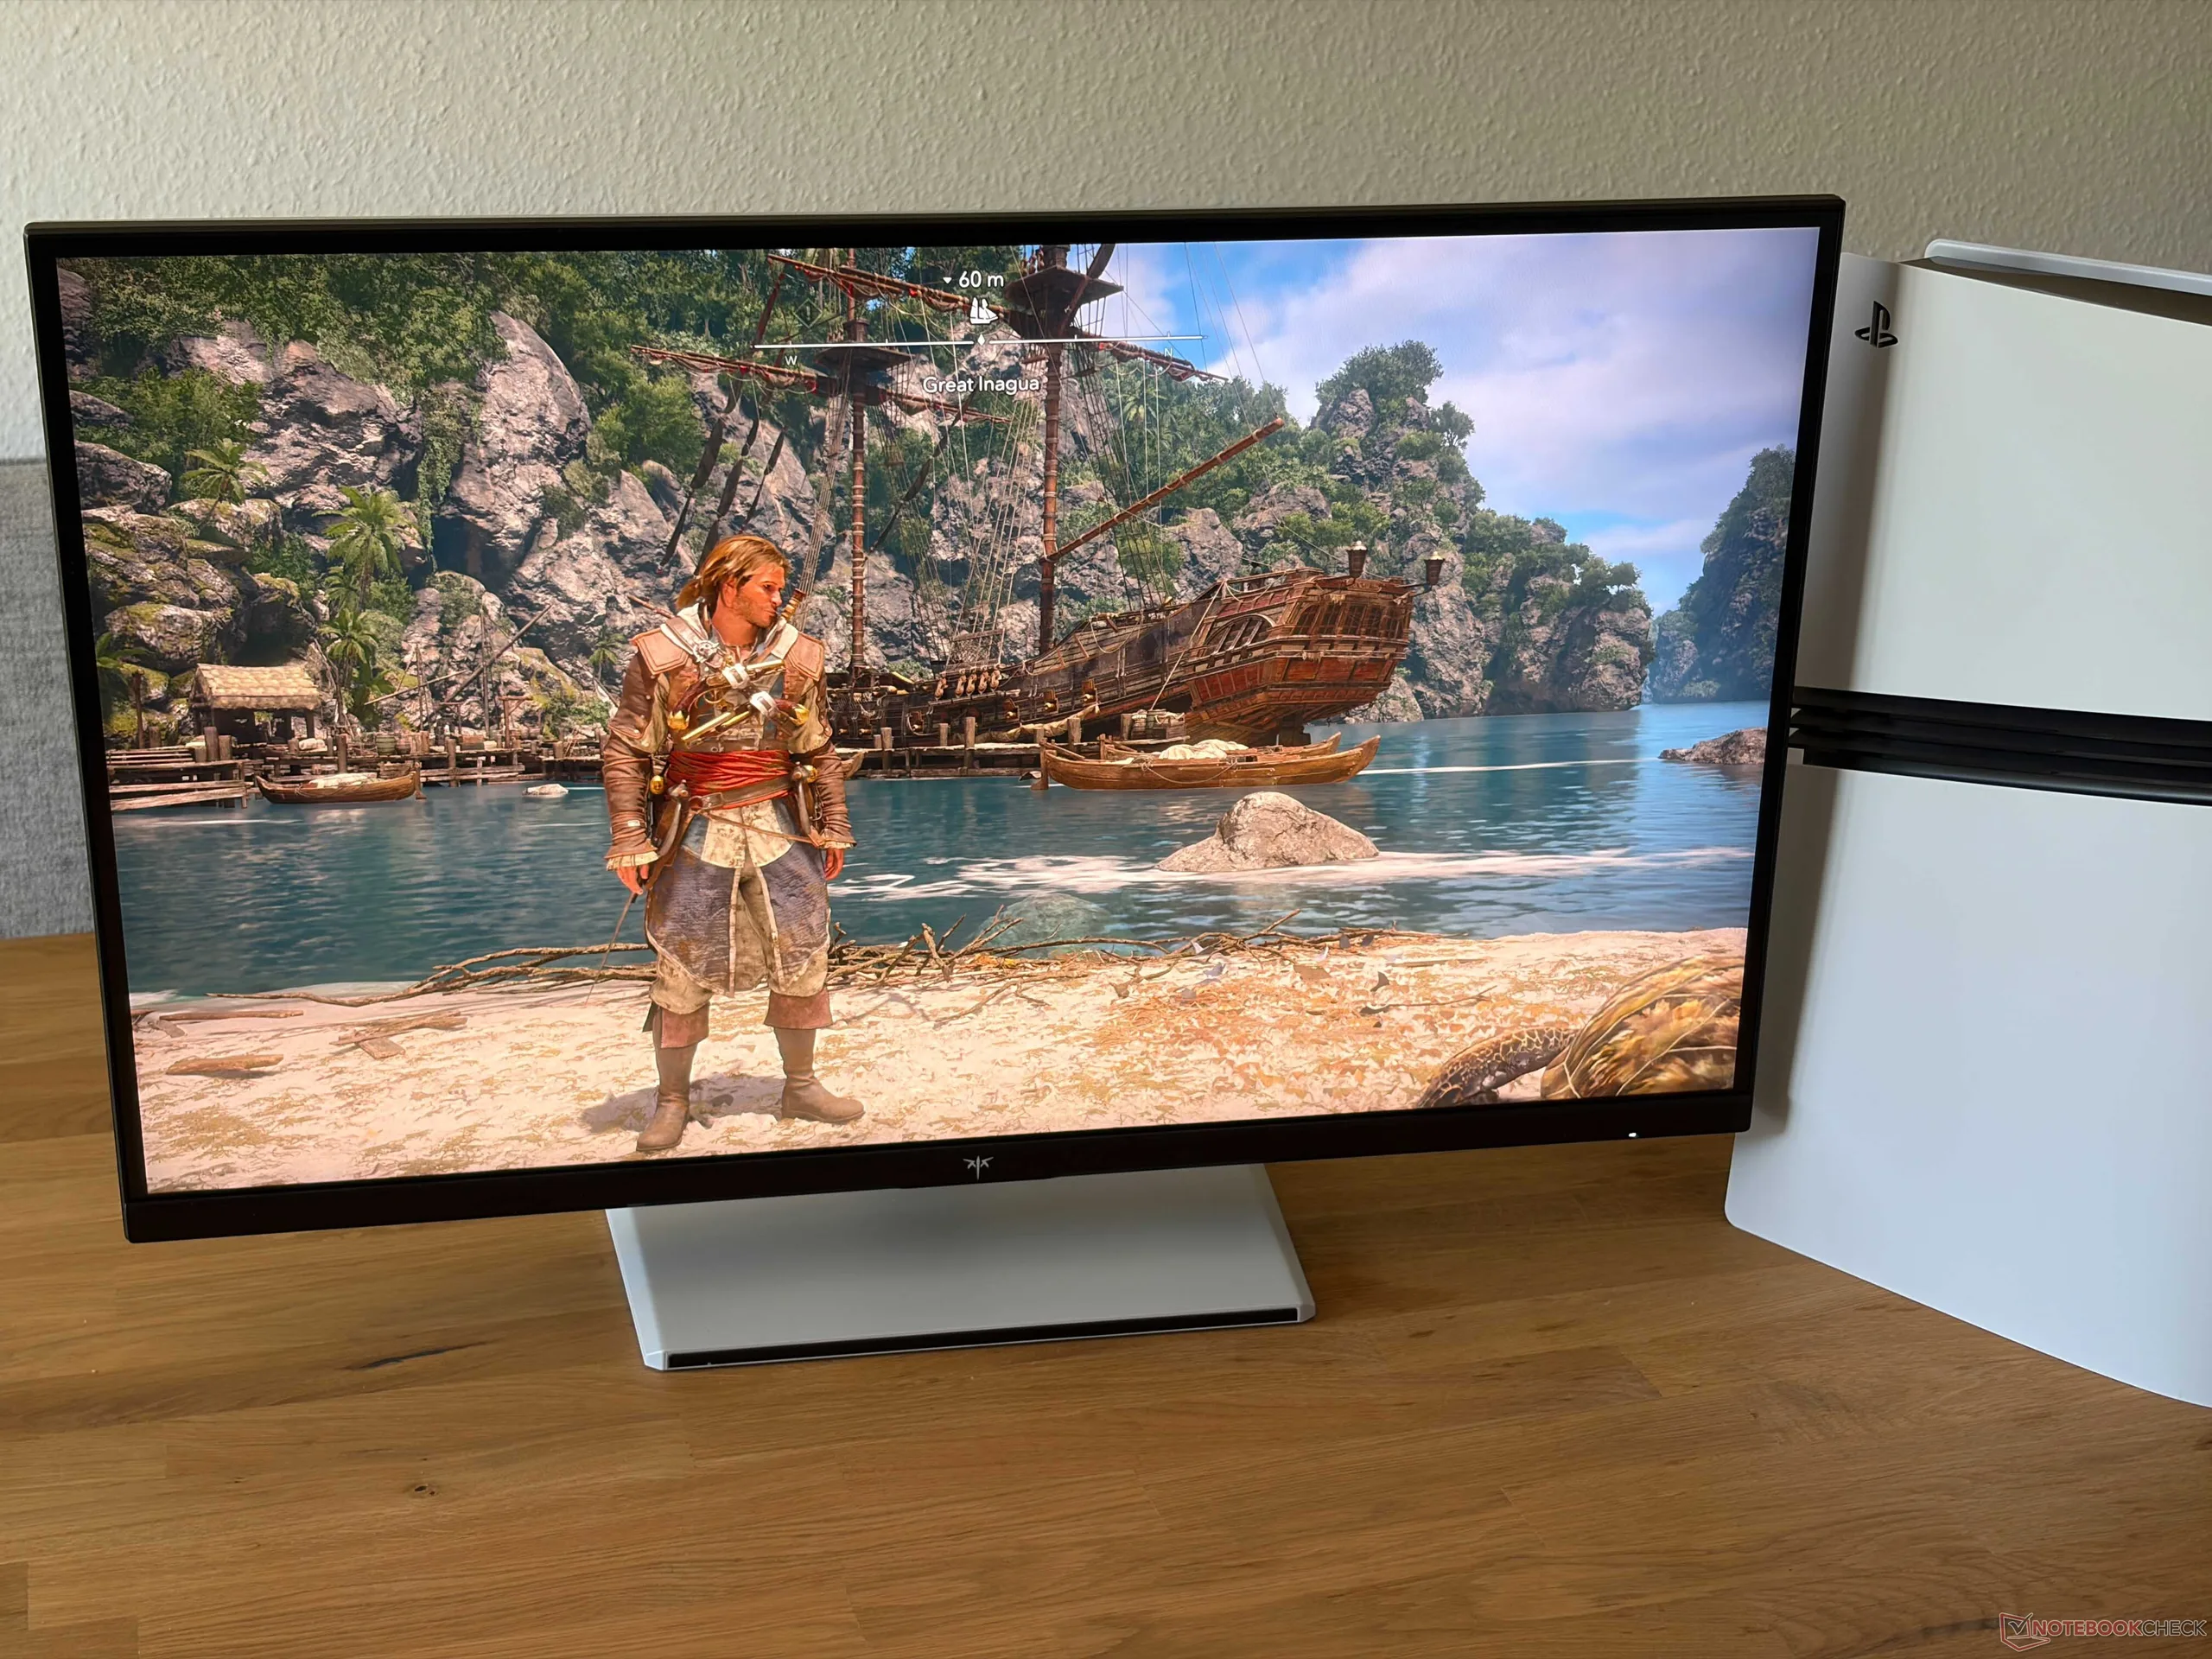
该显示器还支持 G-Sync 和 FreeSync,对主机游戏玩家同样颇具吸引力。如下图所示,PS5 Pro 在 QHD 分辨率和 120 Hz 刷新率下运行流畅,未出现任何问题。不过,该显示器不配备 KVM 切换器,也不支持 USB-C 电源传输功能。
显示屏——240 Hz IPS屏
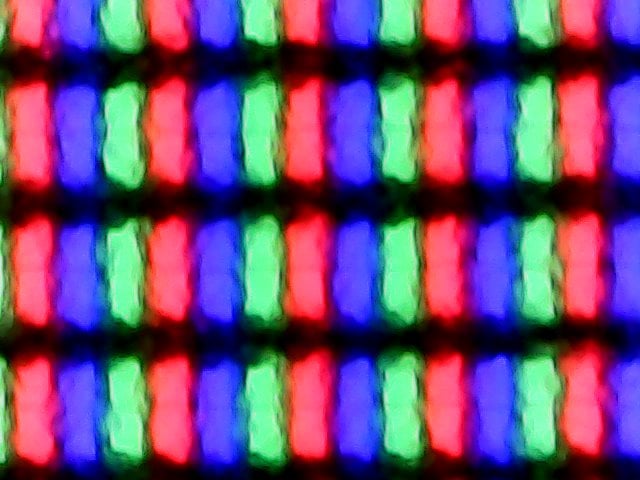
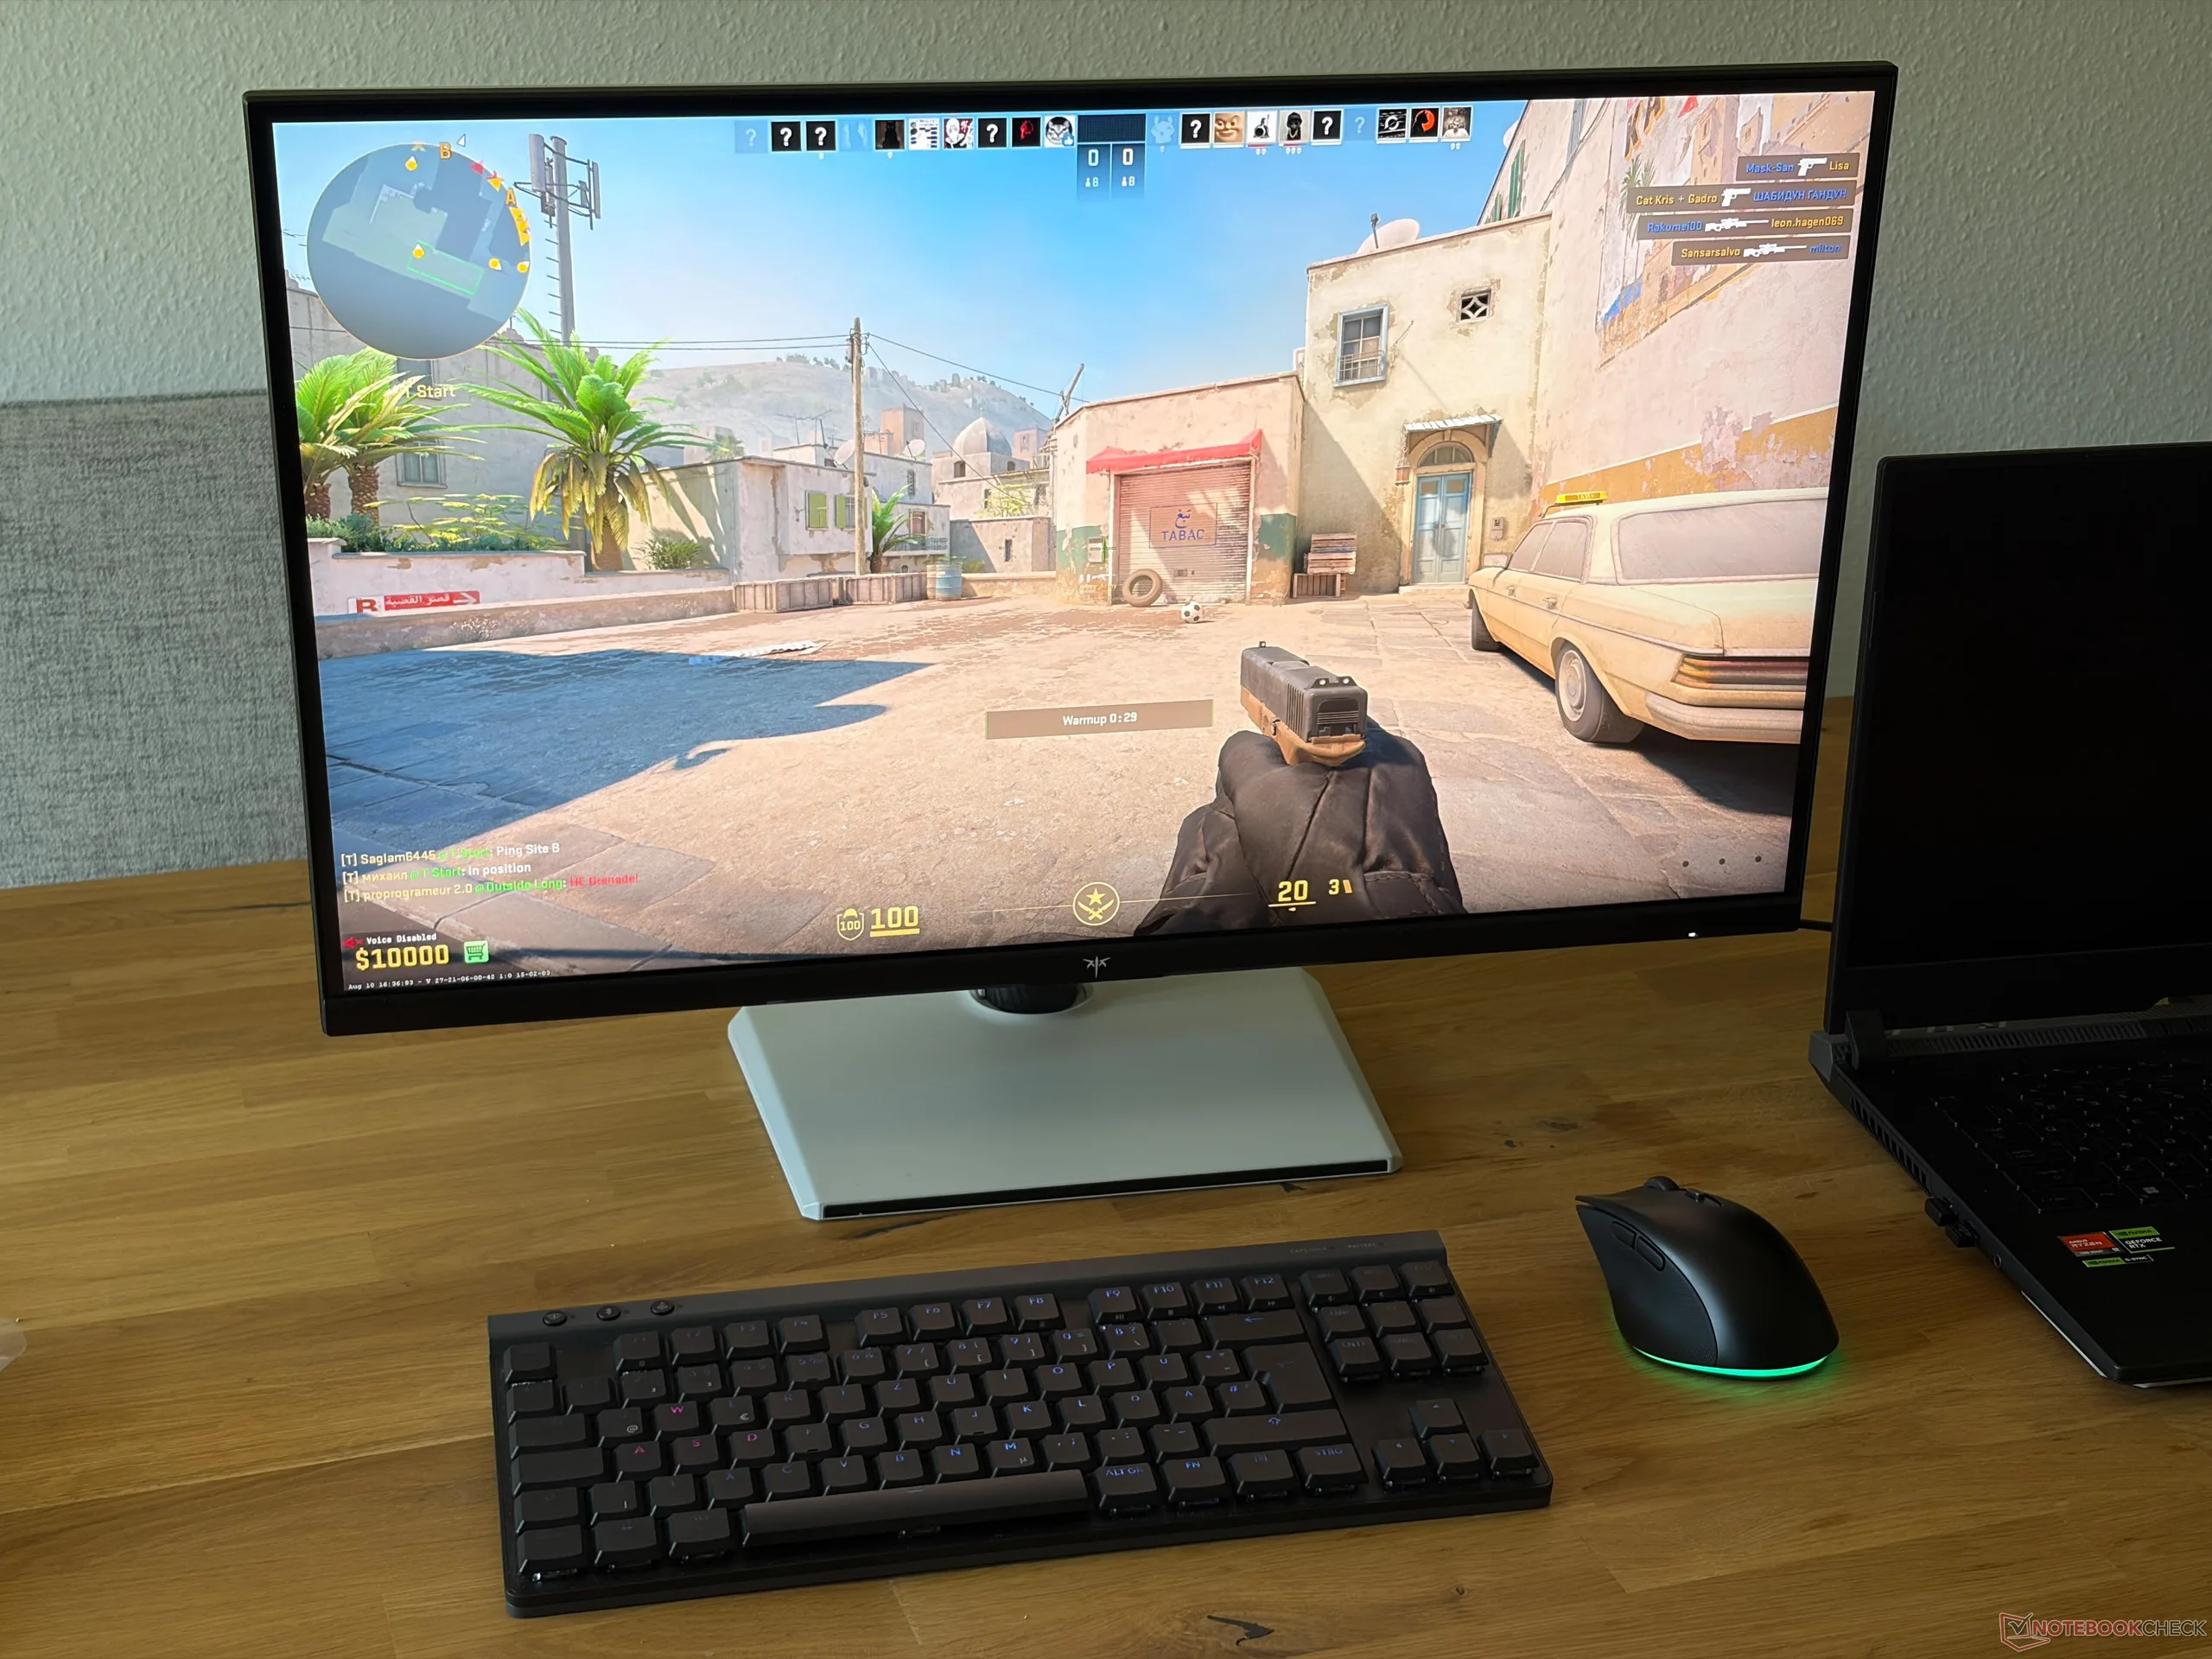
这款27英寸IPS显示屏的分辨率为2,560 x 1,440像素(16:9),其哑光面板的主观画质非常出色。 所有内容均显示清晰锐利,色彩鲜艳生动。得益于高刷新率,动态画面也显得格外流畅。响应时间在IPS面板中表现良好,且通过过驱动设置进一步优化。高亮内容不会出现颗粒感,且无PWM闪烁现象,这使得该显示器非常适合工作使用。
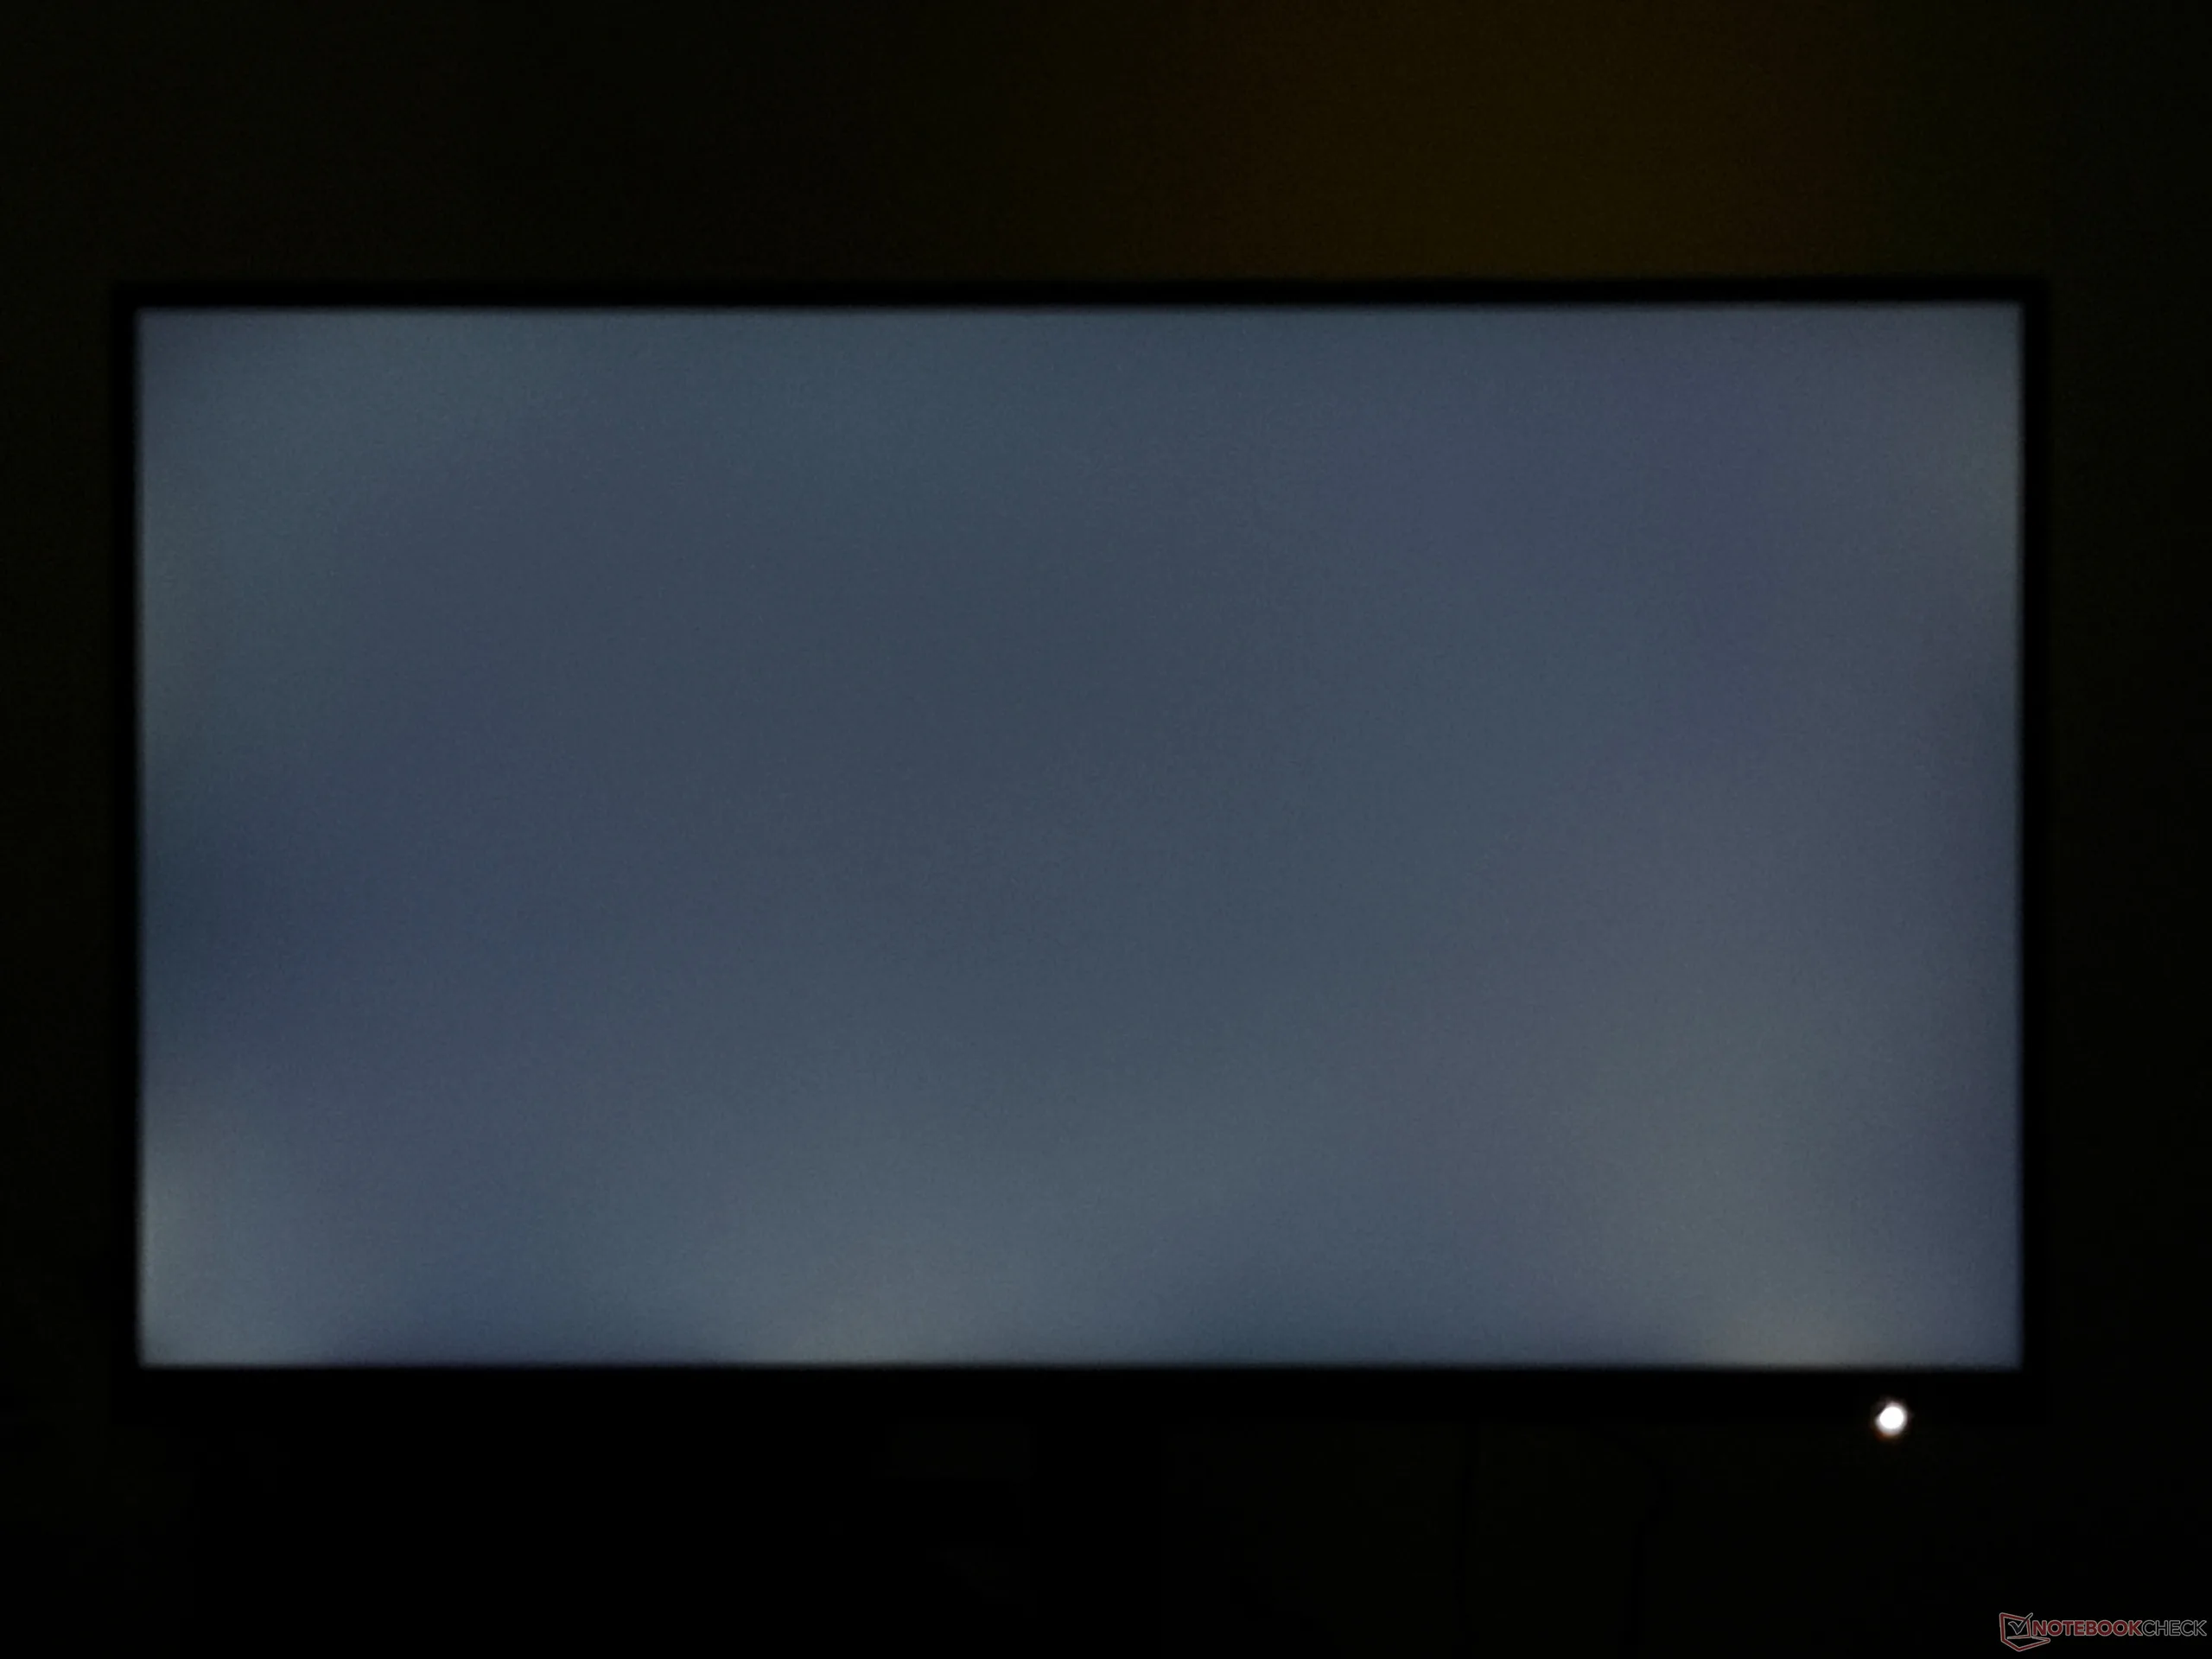
在使用专业 CalMAN 软件进行的测试中,该面板的亮度轻松超过了宣传的 400 cd/m²,平均亮度略低于 492 cd/m²。不过,亮度均匀度仅为 81%,表现并不特别理想。 黑电平略高,为0.39 cd/m²,但最大对比度仍达到约1,200:1,超过了制造商规定的1,000:1。 不过,最低亮度约为 90 cd/m²,略显偏高。尽管屏幕支持 HDR 内容(HDR400),但与 OLED 或 Mini-LED 显示屏不同,IPS 面板的亮度不会进一步提升。
| |||||||||||||||||||||||||
Brightness Distribution: 81 %
Contrast: 1236:1 (Black: 0.39 cd/m²)
ΔE ColorChecker Calman: 2.2 | ∀{0.5-29.43 Ø4.69}
calibrated: 0.9
ΔE Greyscale Calman: 3.3 | ∀{0.09-98 Ø4.94}
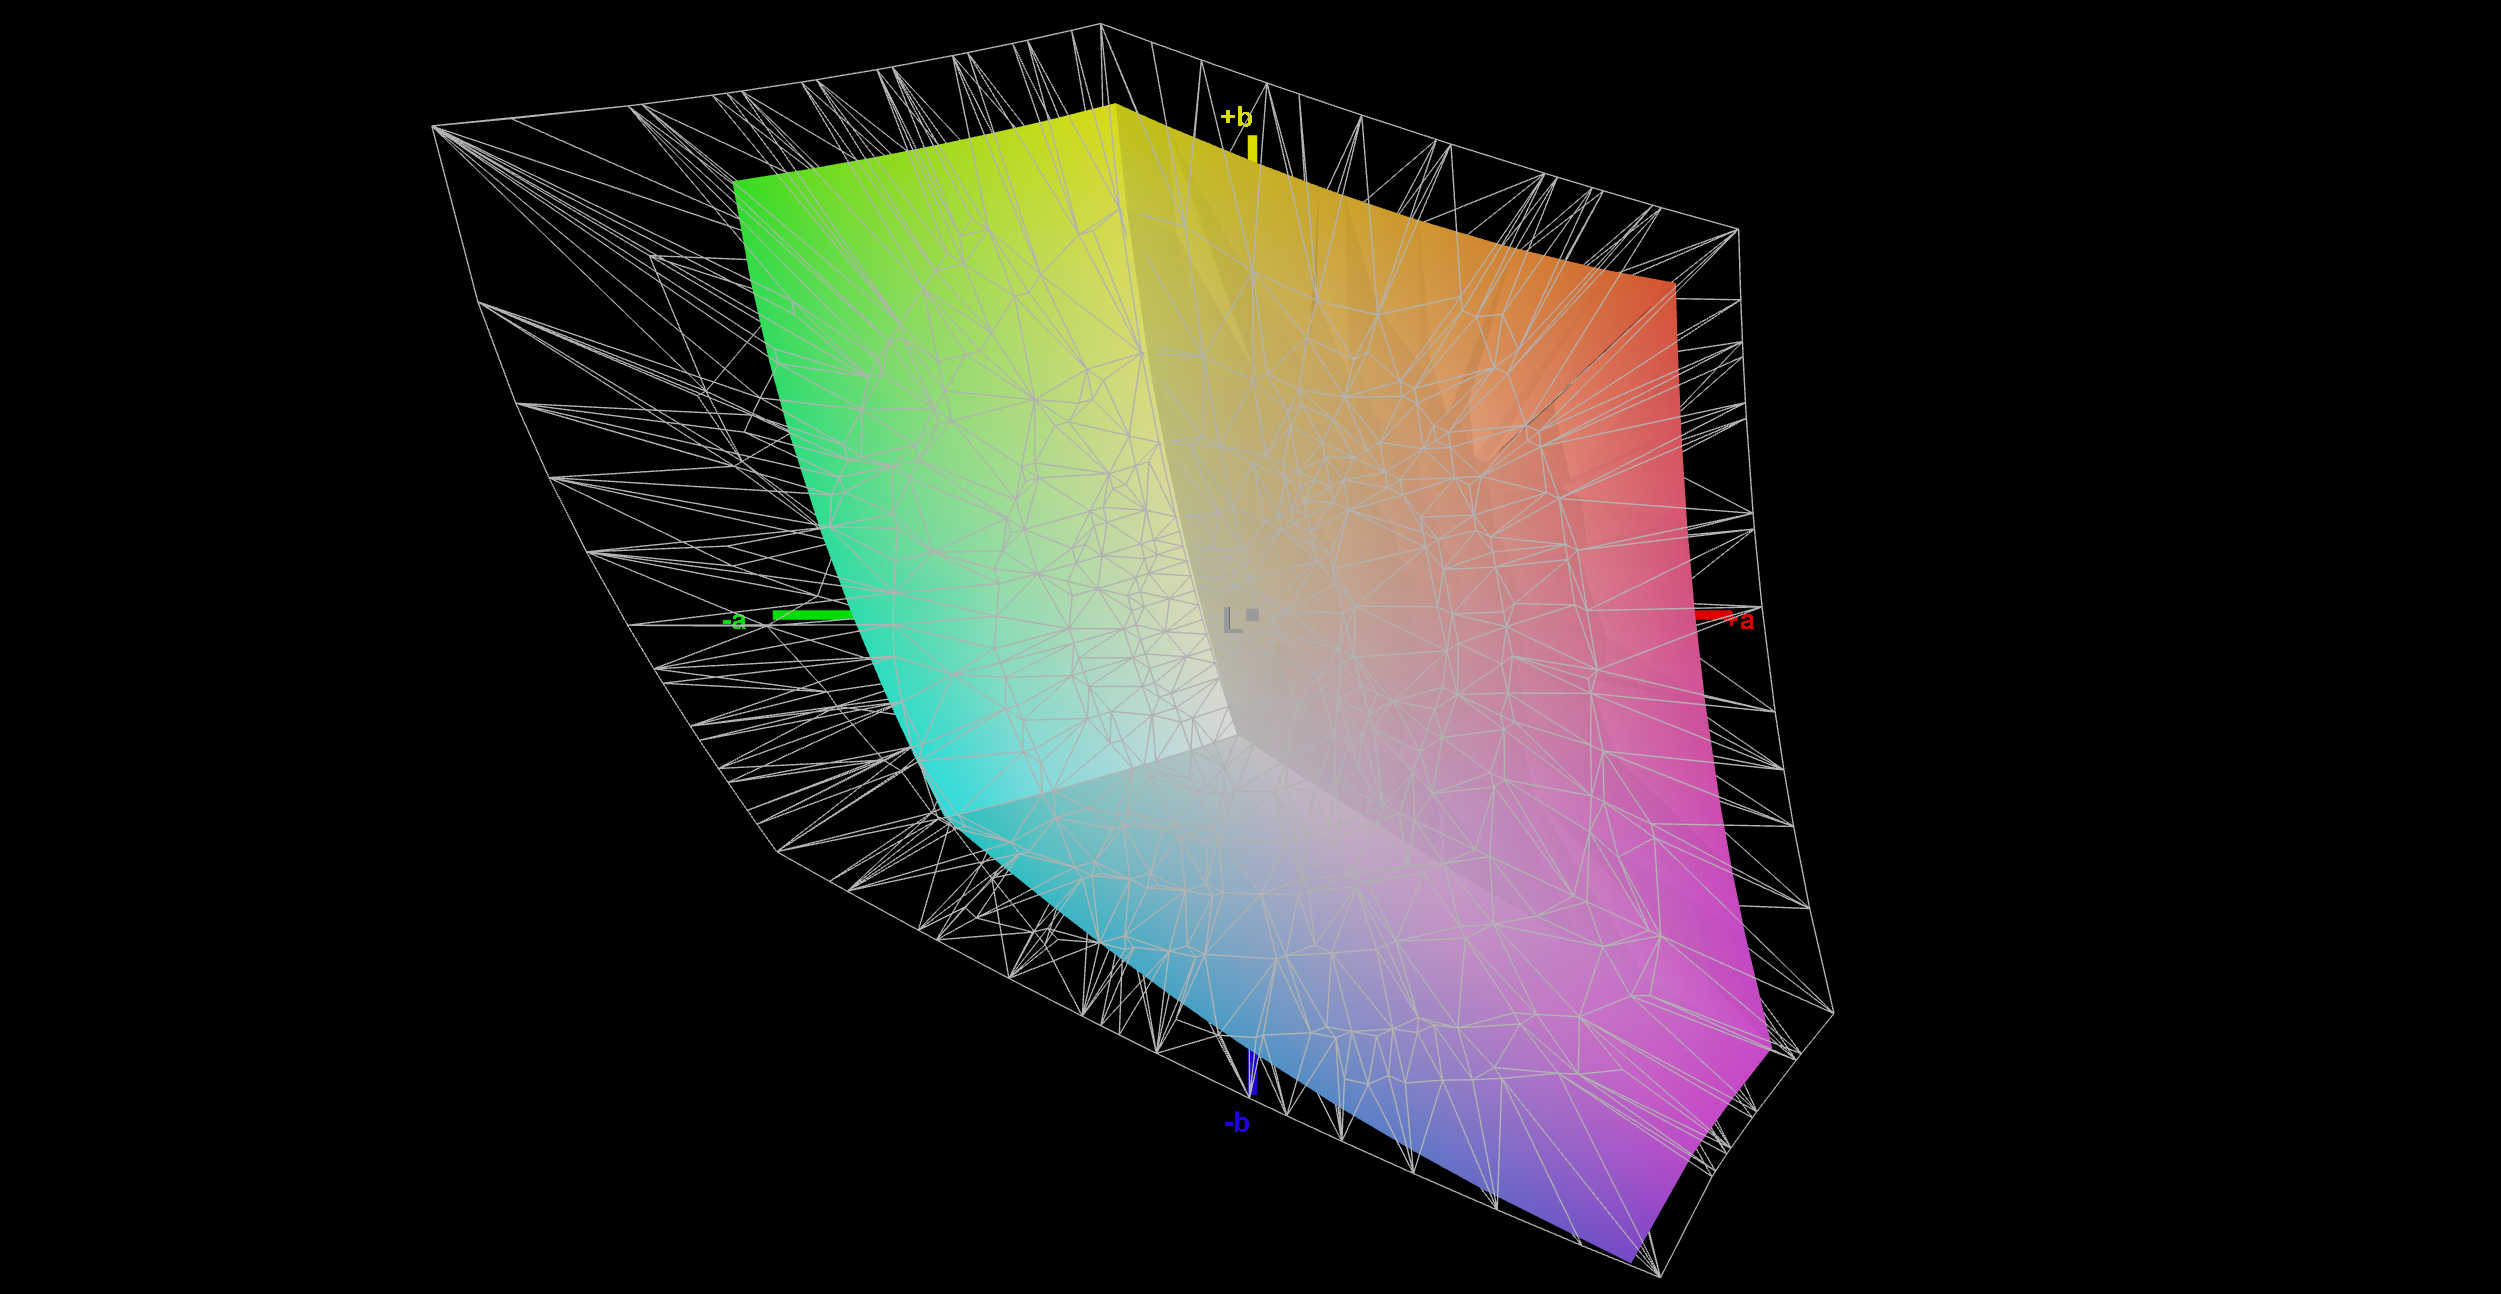
68% AdobeRGB 1998 (Argyll 3D)
97.4% sRGB (Argyll 3D)
65.8% Display P3 (Argyll 3D)
Gamma: 2.23
CCT: 7105 K
| KTC H27E6S 2560x1440, 27", 240 Hz | Asus ROG Strix XG27UCS IPS-type, , 3840x2160, 27", 160 Hz | MSI MAG 274QRF QD E2 MAG 274QRF QD E2, IPS, 2560x1440, 27", 180 Hz | TITAN ARMY P275MV PLUS 3840x2160, 27", 160 Hz | MSI Optix MAG274QRX IPS, 2560x1400, 27", 240 Hz | |
|---|---|---|---|---|---|
| Display | 27% | 26% | 26% | ||
| Display P3 Coverage (%) | 65.8 | 97.6 48% | 94.7 44% | 87.5 33% | |
| sRGB Coverage (%) | 97.4 | 99.7 2% | 100 3% | 99.9 3% | |
| AdobeRGB 1998 Coverage (%) | 68 | 88.9 31% | 88.9 31% | 96.3 42% | |
| Response Times | -9% | 1% | -36% | -4% | |
| Response Time Grey 50% / Grey 80% * (ms) | 9.2 ? 3.7 ? | 9.6 ? -4% 3.3 ? 64% | 5.76 ? 37% | 12.8 ? -39% | 6.23 ? 32% |
| Response Time Black / White * (ms) | 4.2 ? 4.2 ? | 6.6 ? -57% 5.8 ? -38% | 5.73 ? -36% | 5.6 ? -33% | 5.83 ? -39% |
| PWM Frequency (Hz) | |||||
| Screen | -6% | -68% | -10% | -108% | |
| Brightness middle (cd/m²) | 482 | 441 -9% | 453 -6% | 305 -37% | 351 -27% |
| Brightness (cd/m²) | 492 | 390 -21% | 404 -18% | 296 -40% | 329 -33% |
| Brightness Distribution (%) | 81 | 81 0% | 84 4% | 92 14% | 89 10% |
| Black Level * (cd/m²) | 0.39 | 0.54 -38% | 0.28 28% | 0.34 13% | 0.33 15% |
| Contrast (:1) | 1236 | 817 -34% | 1618 31% | 897 -27% | 1064 -14% |
| Colorchecker dE 2000 * | 2.2 | 1.6 27% | 7.97 -262% | 2.15 2% | 7.28 -231% |
| Colorchecker dE 2000 max. * | 5.7 | 4.5 21% | 14.32 -151% | 4.16 27% | 16.15 -183% |
| Colorchecker dE 2000 calibrated * | 0.9 | 1.71 -90% | 1.29 -43% | 3.61 -301% | |
| Greyscale dE 2000 * | 3.3 | 3.1 6% | 8.2 -148% | 3.21 3% | 10.3 -212% |
| Gamma | 2.23 99% | 2.3 96% | 1.46 151% | 2.52 87% | 2.15 102% |
| CCT | 7105 91% | 6368 102% | 7427 88% | 6617 98% | 9378 69% |
| Total Average (Program / Settings) | -8% /
-7% | -13% /
-38% | -7% /
-6% | -29% /
-65% |
* ... smaller is better
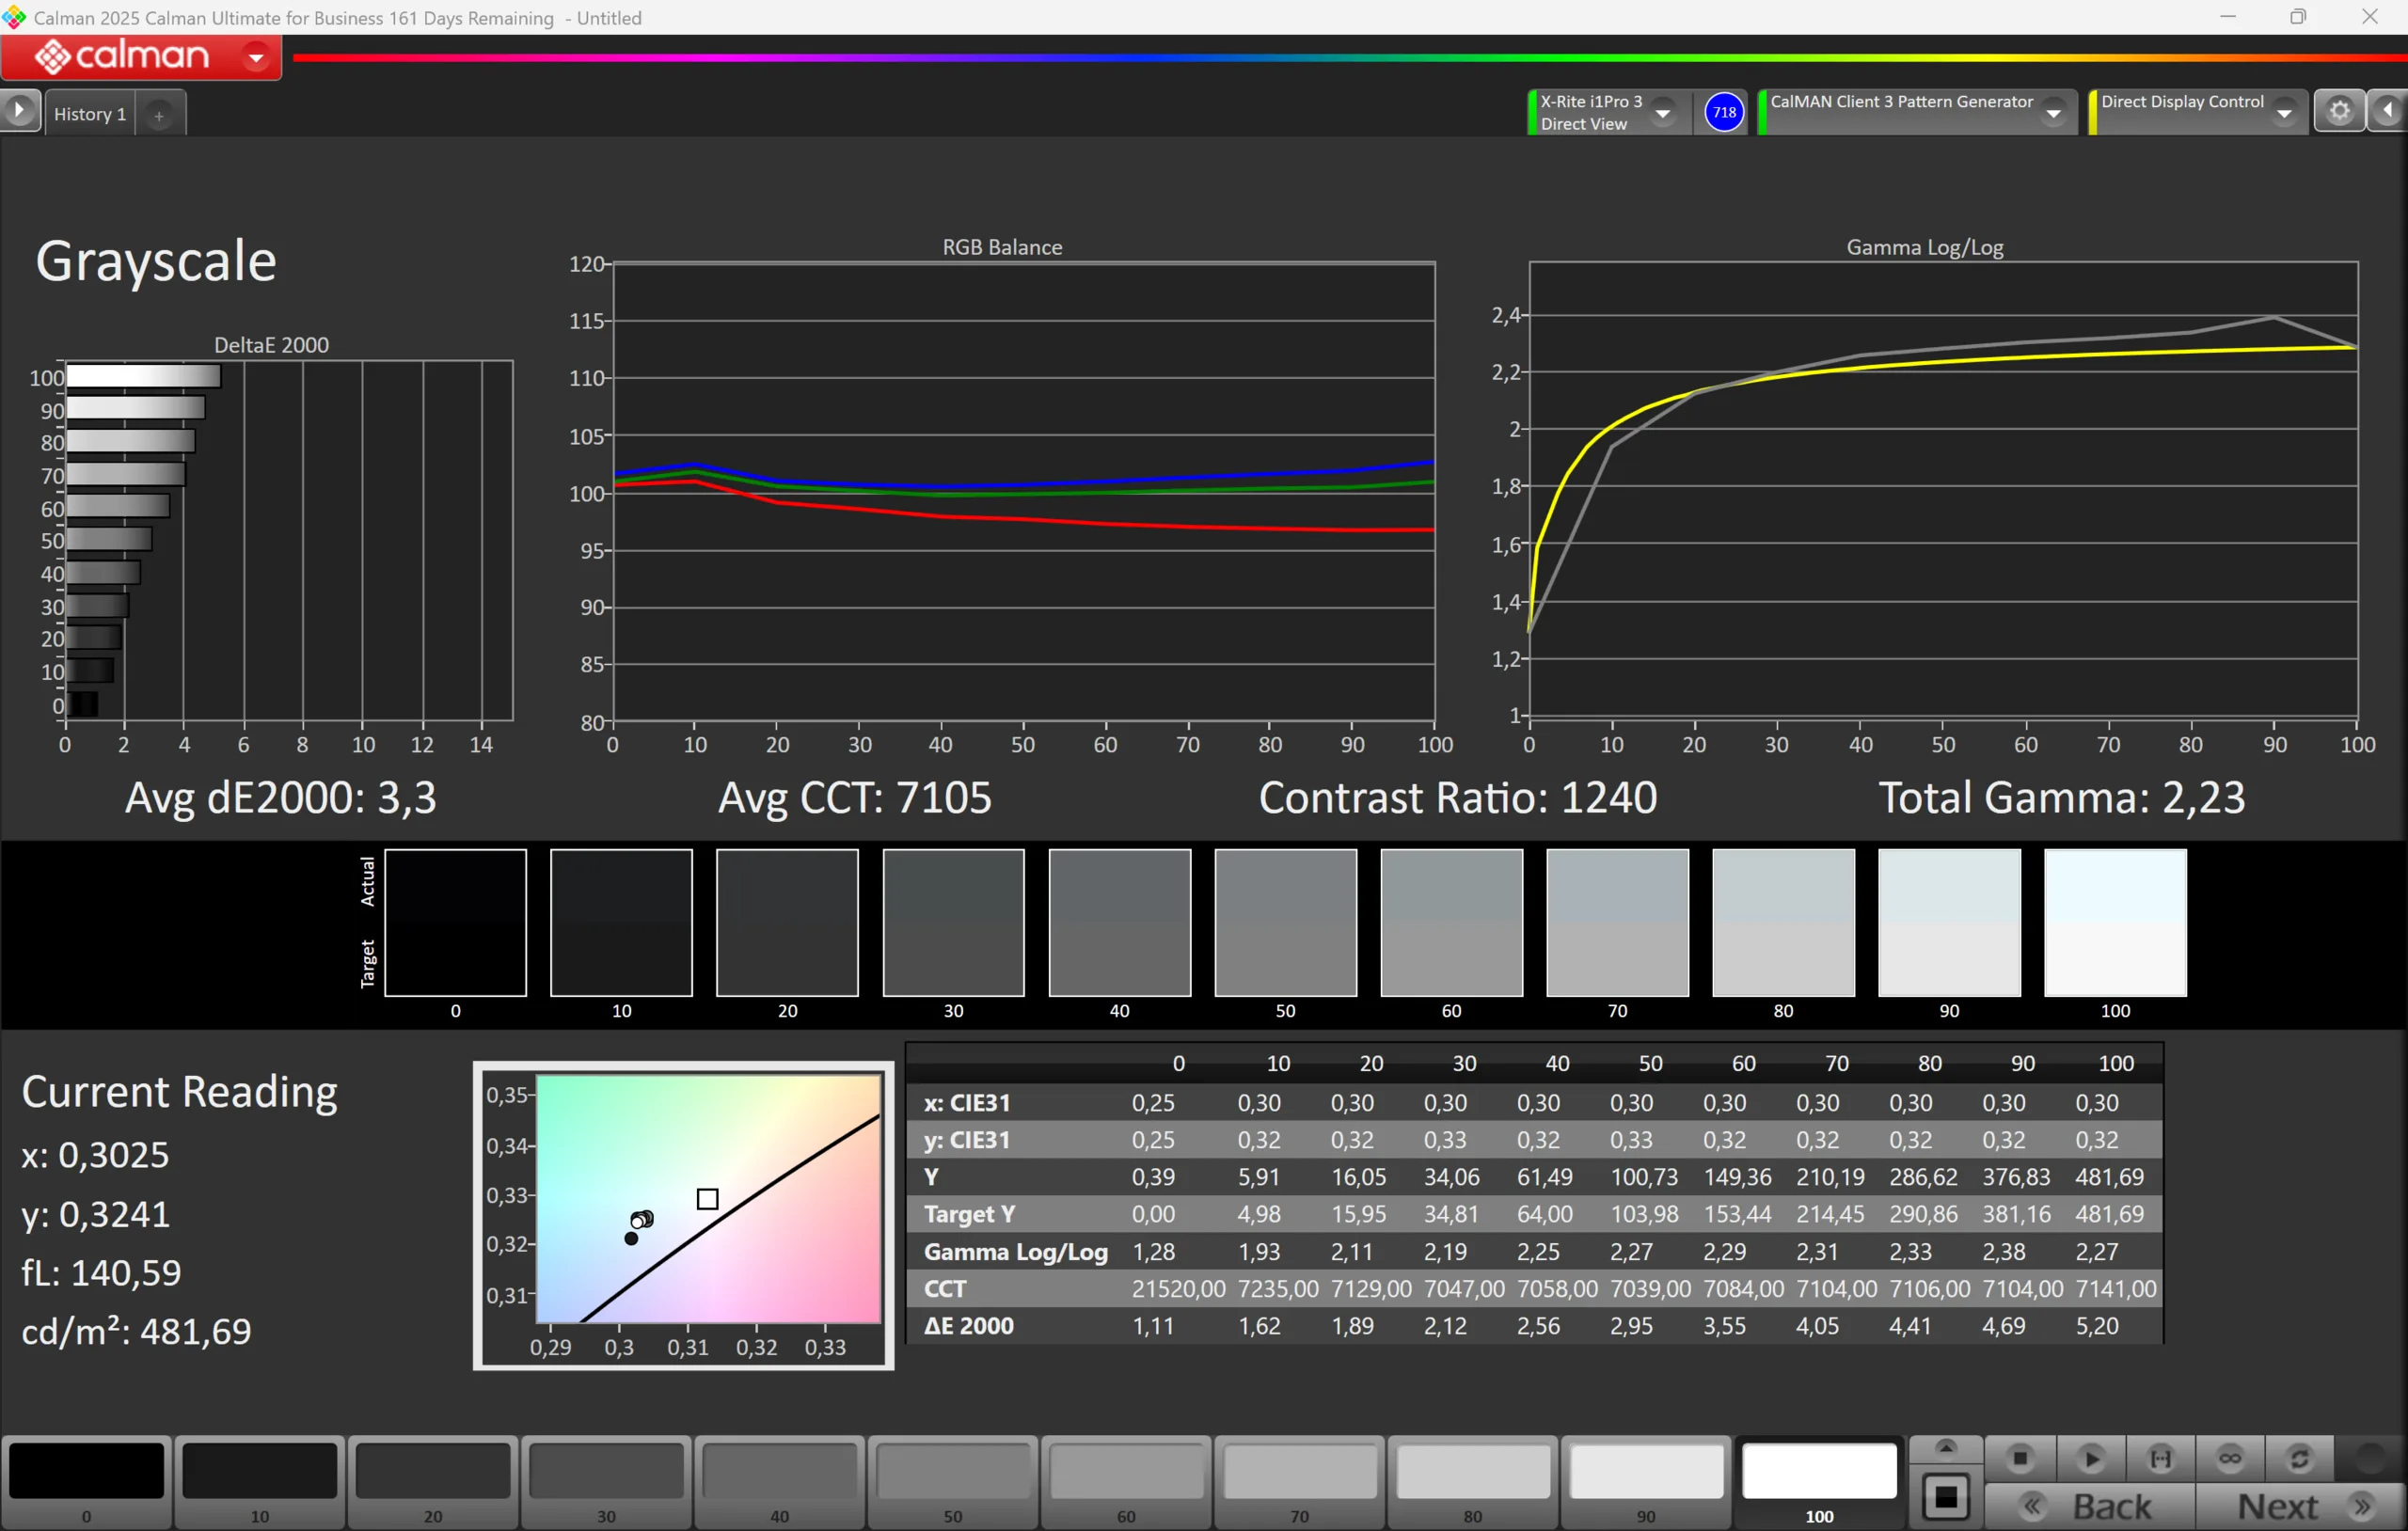
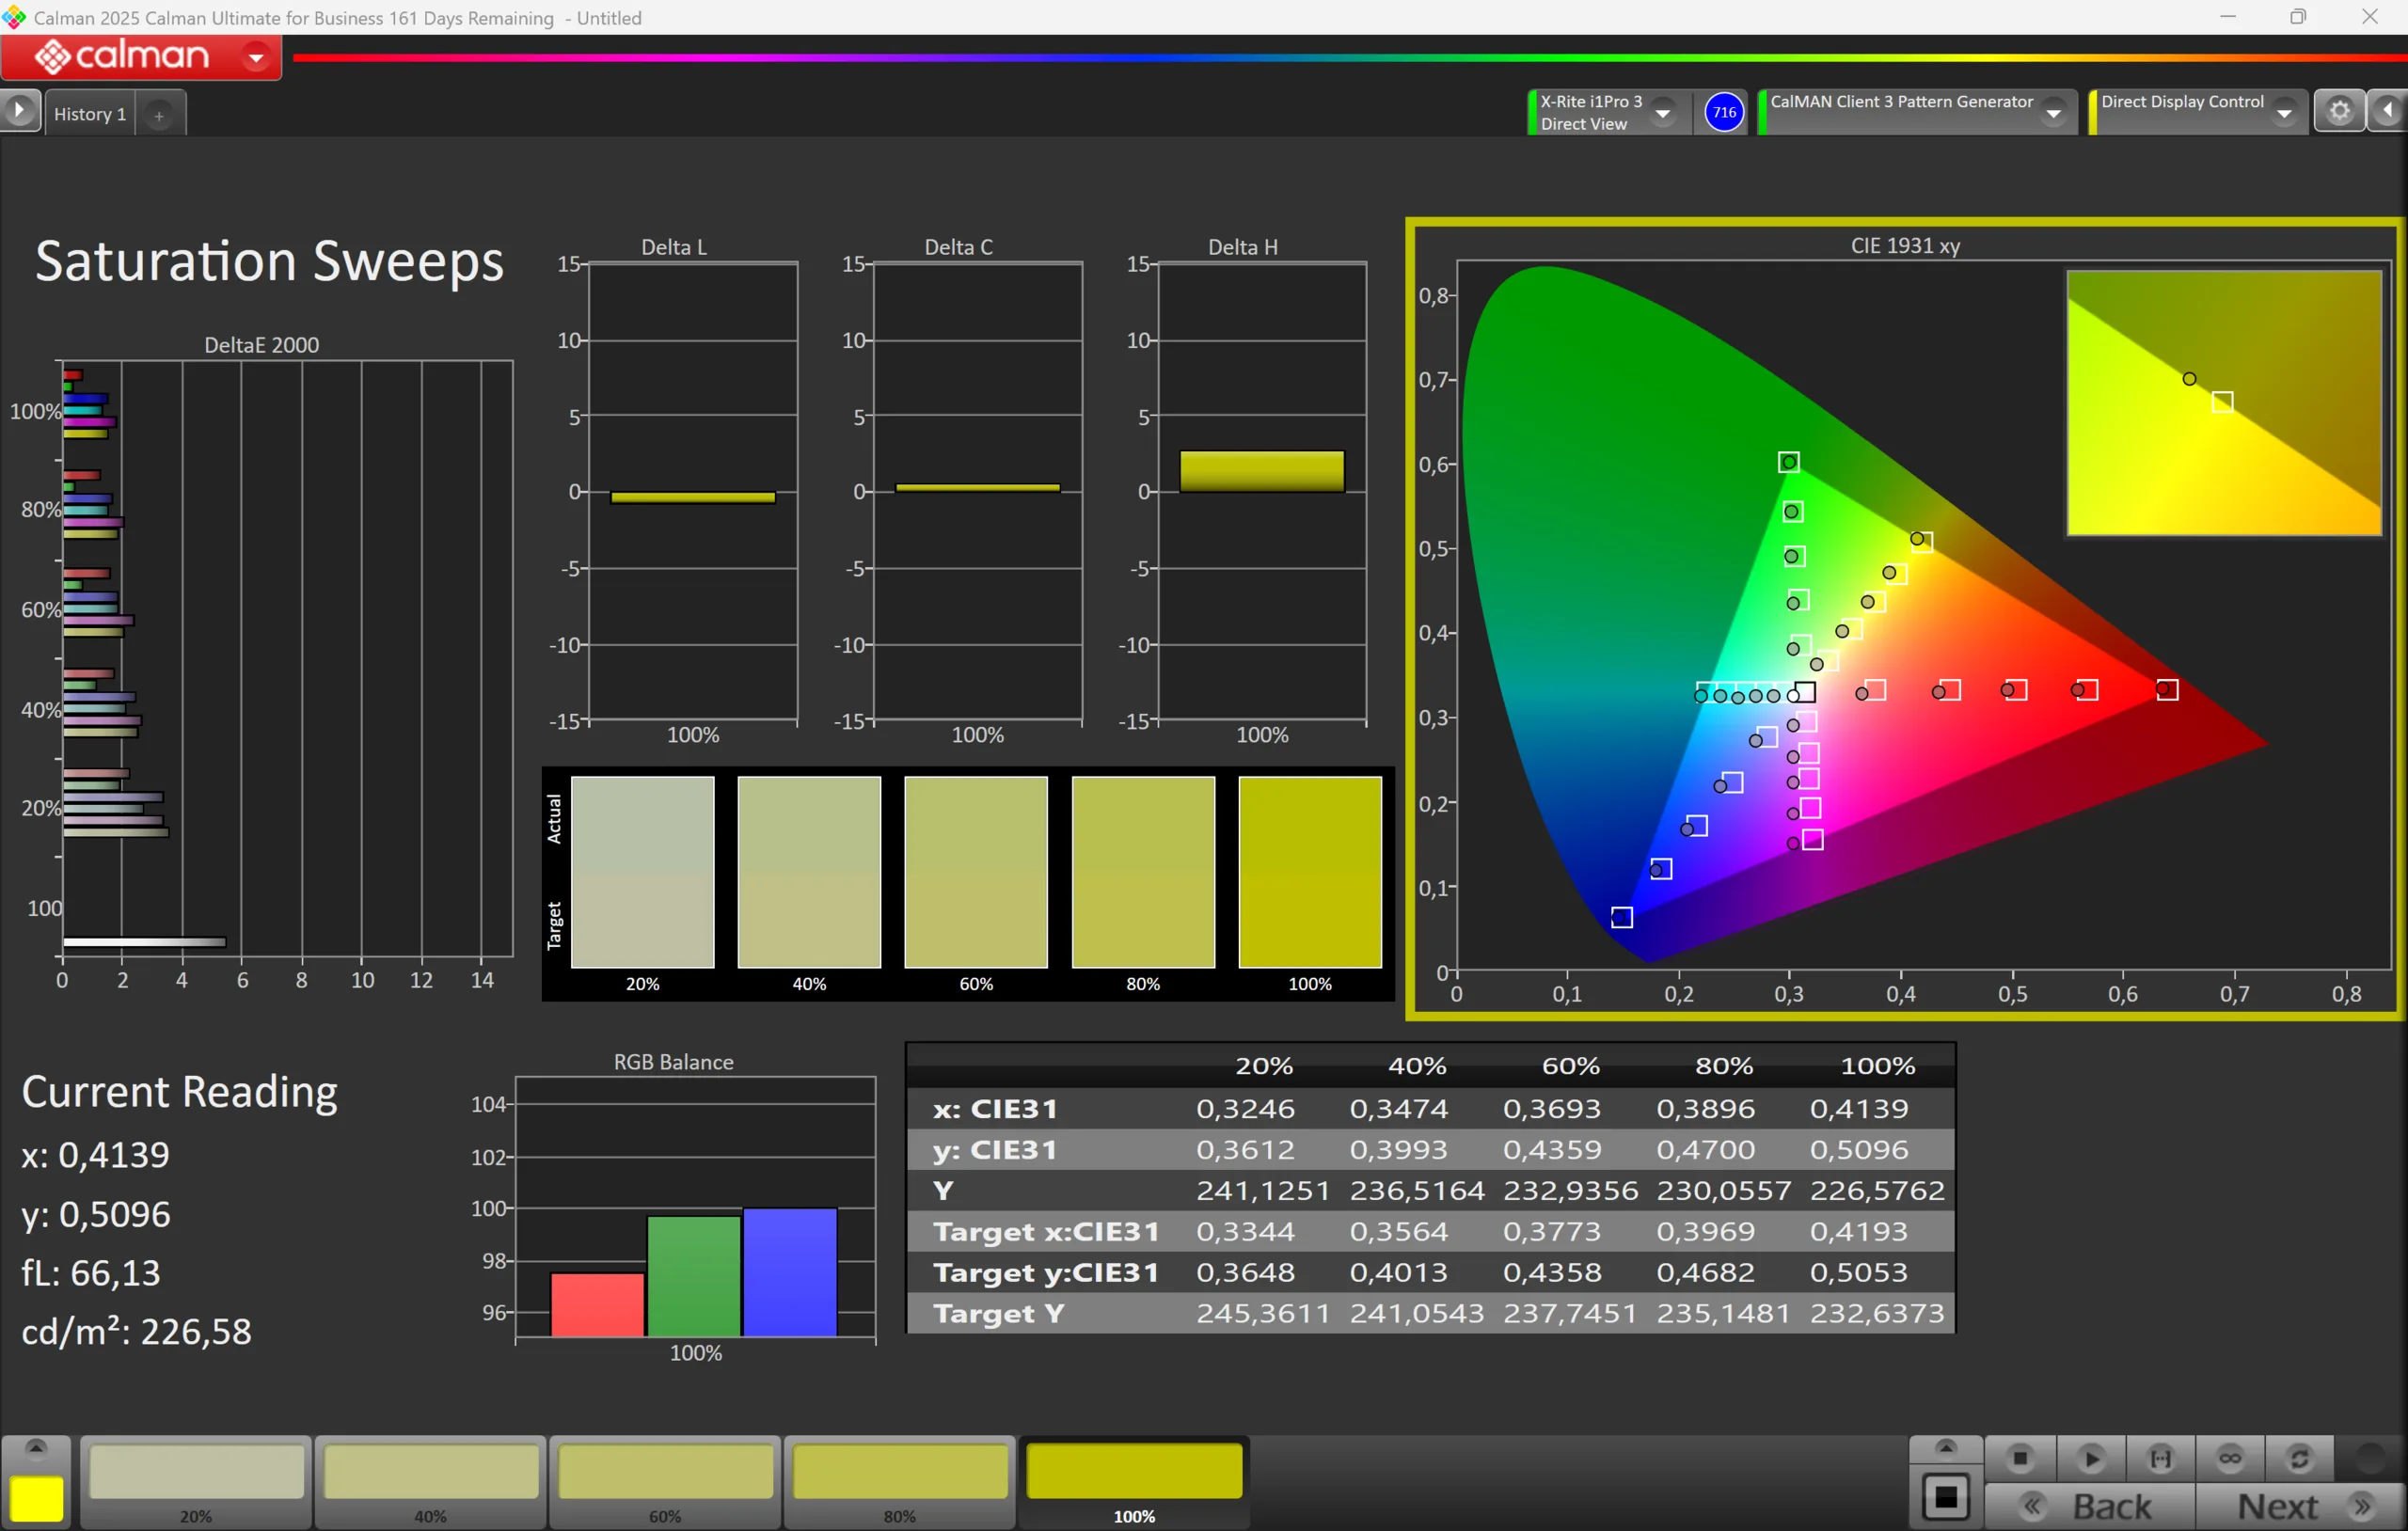

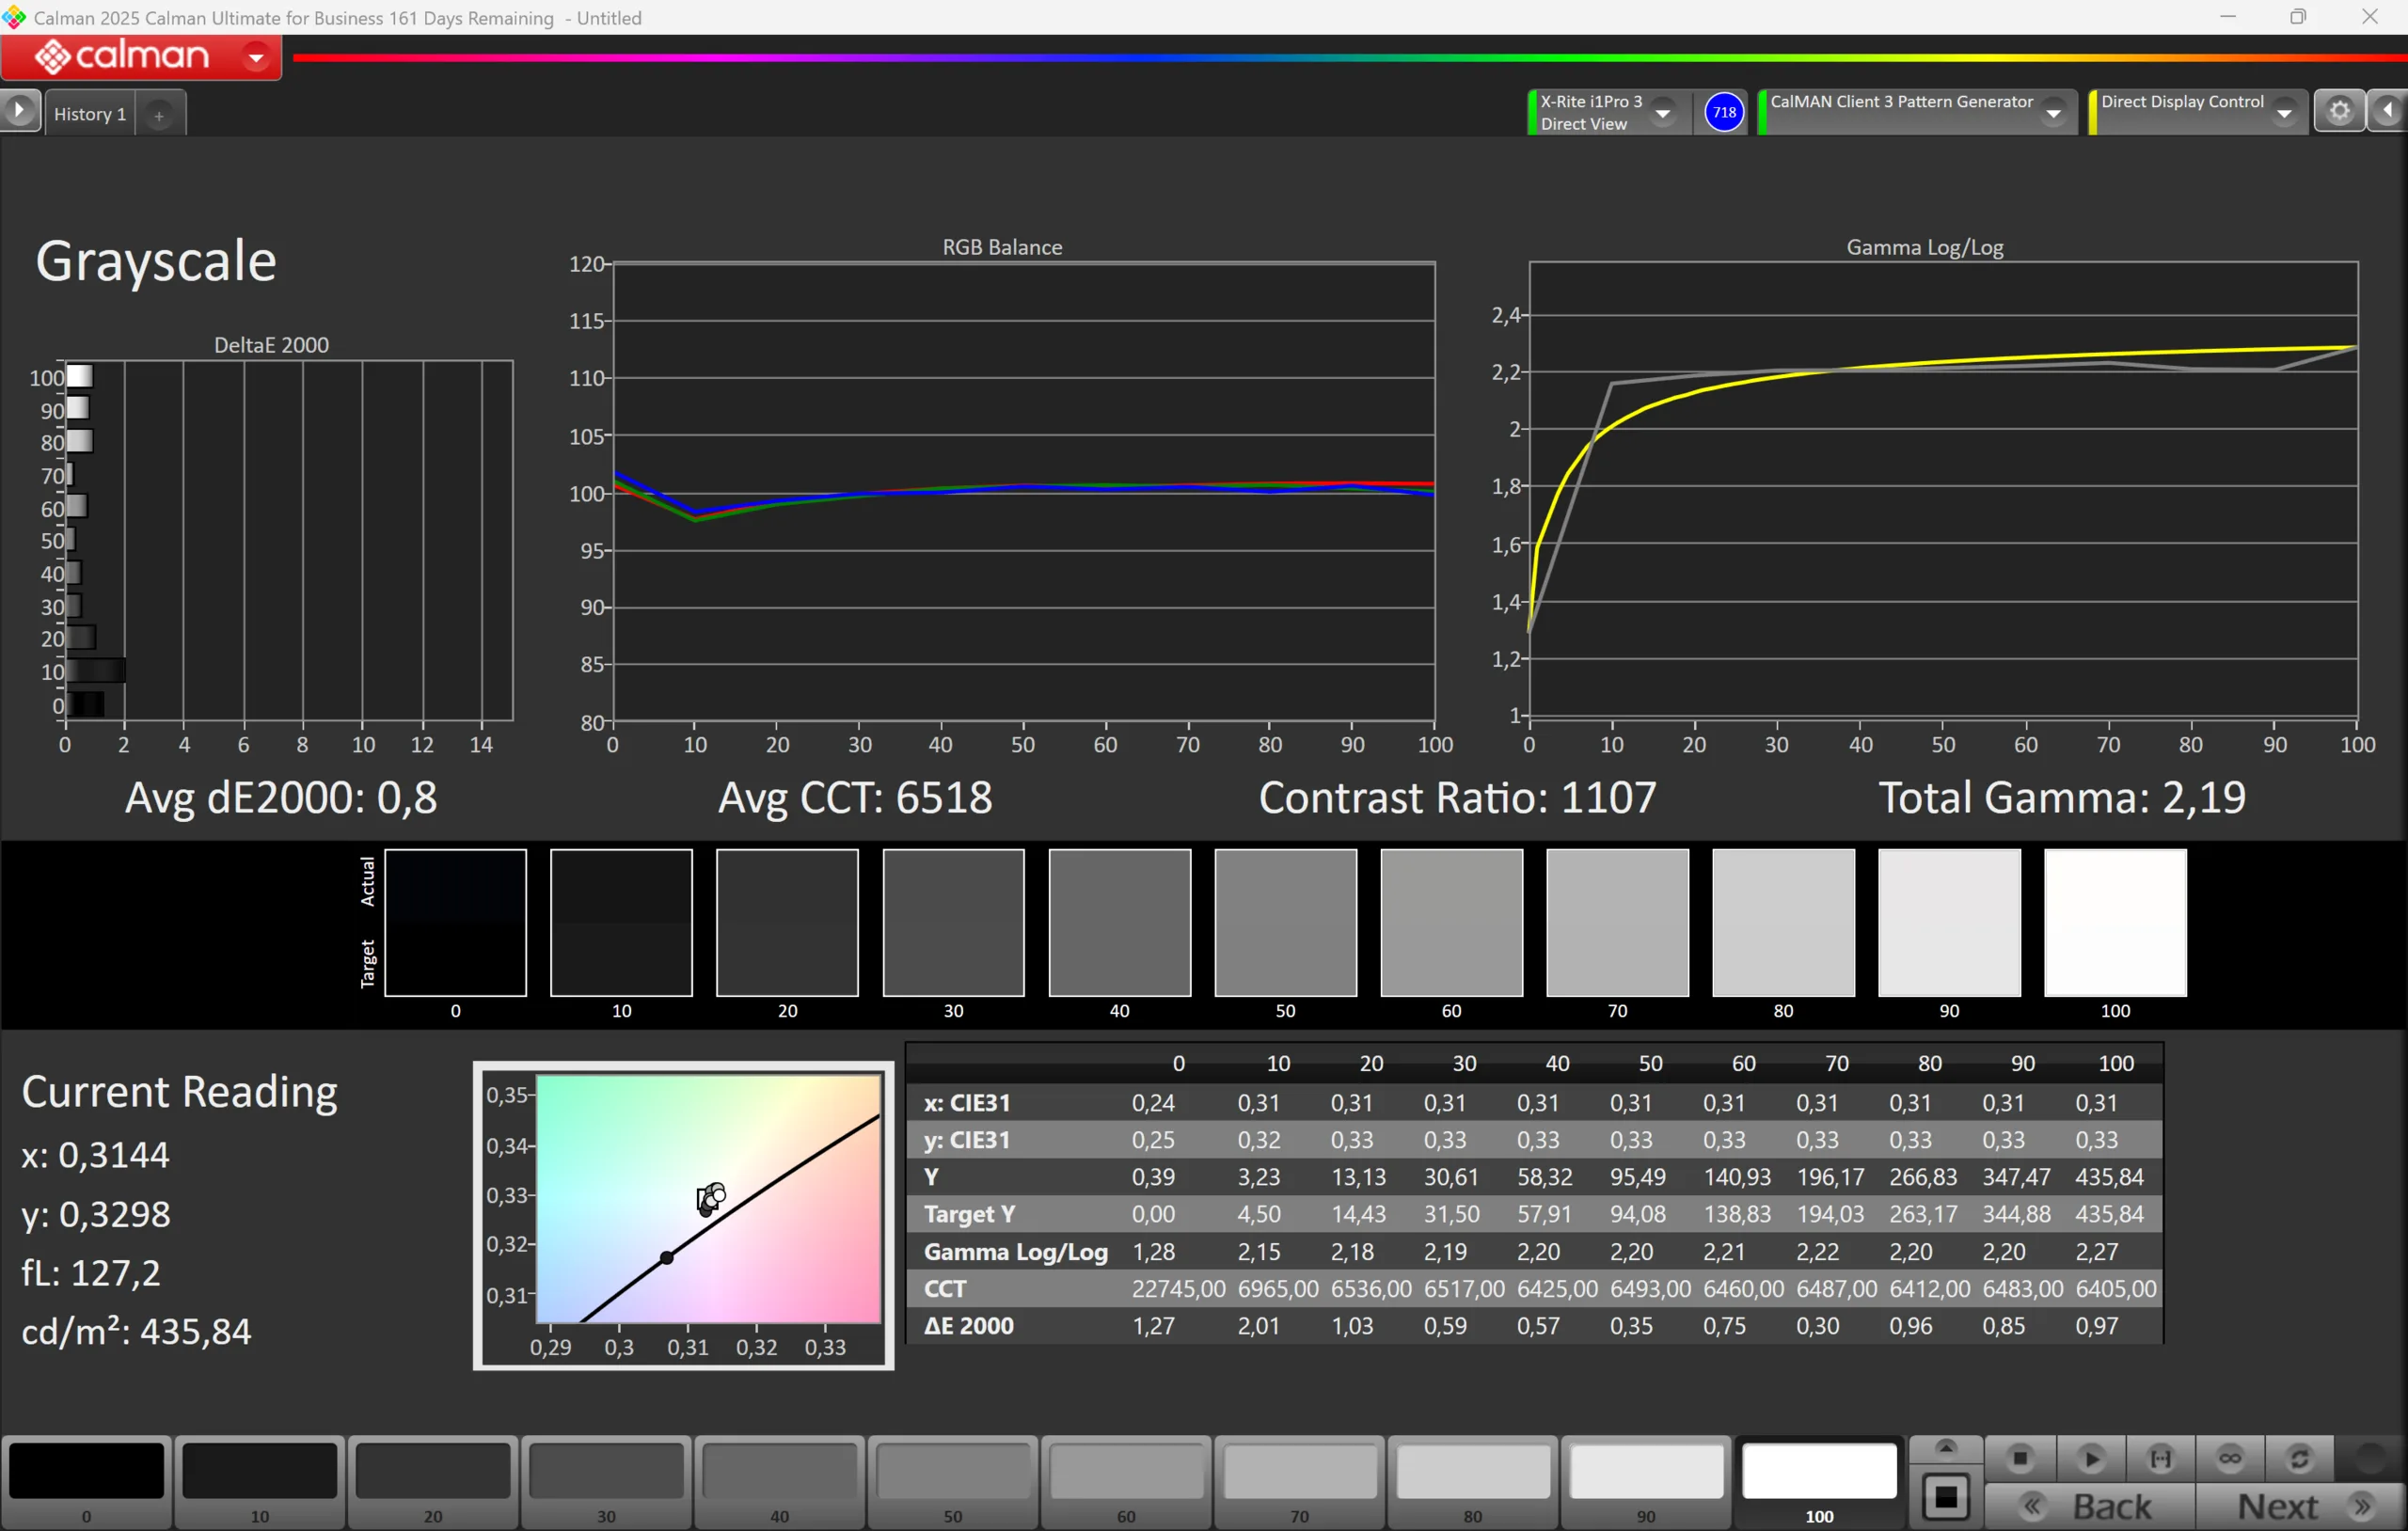
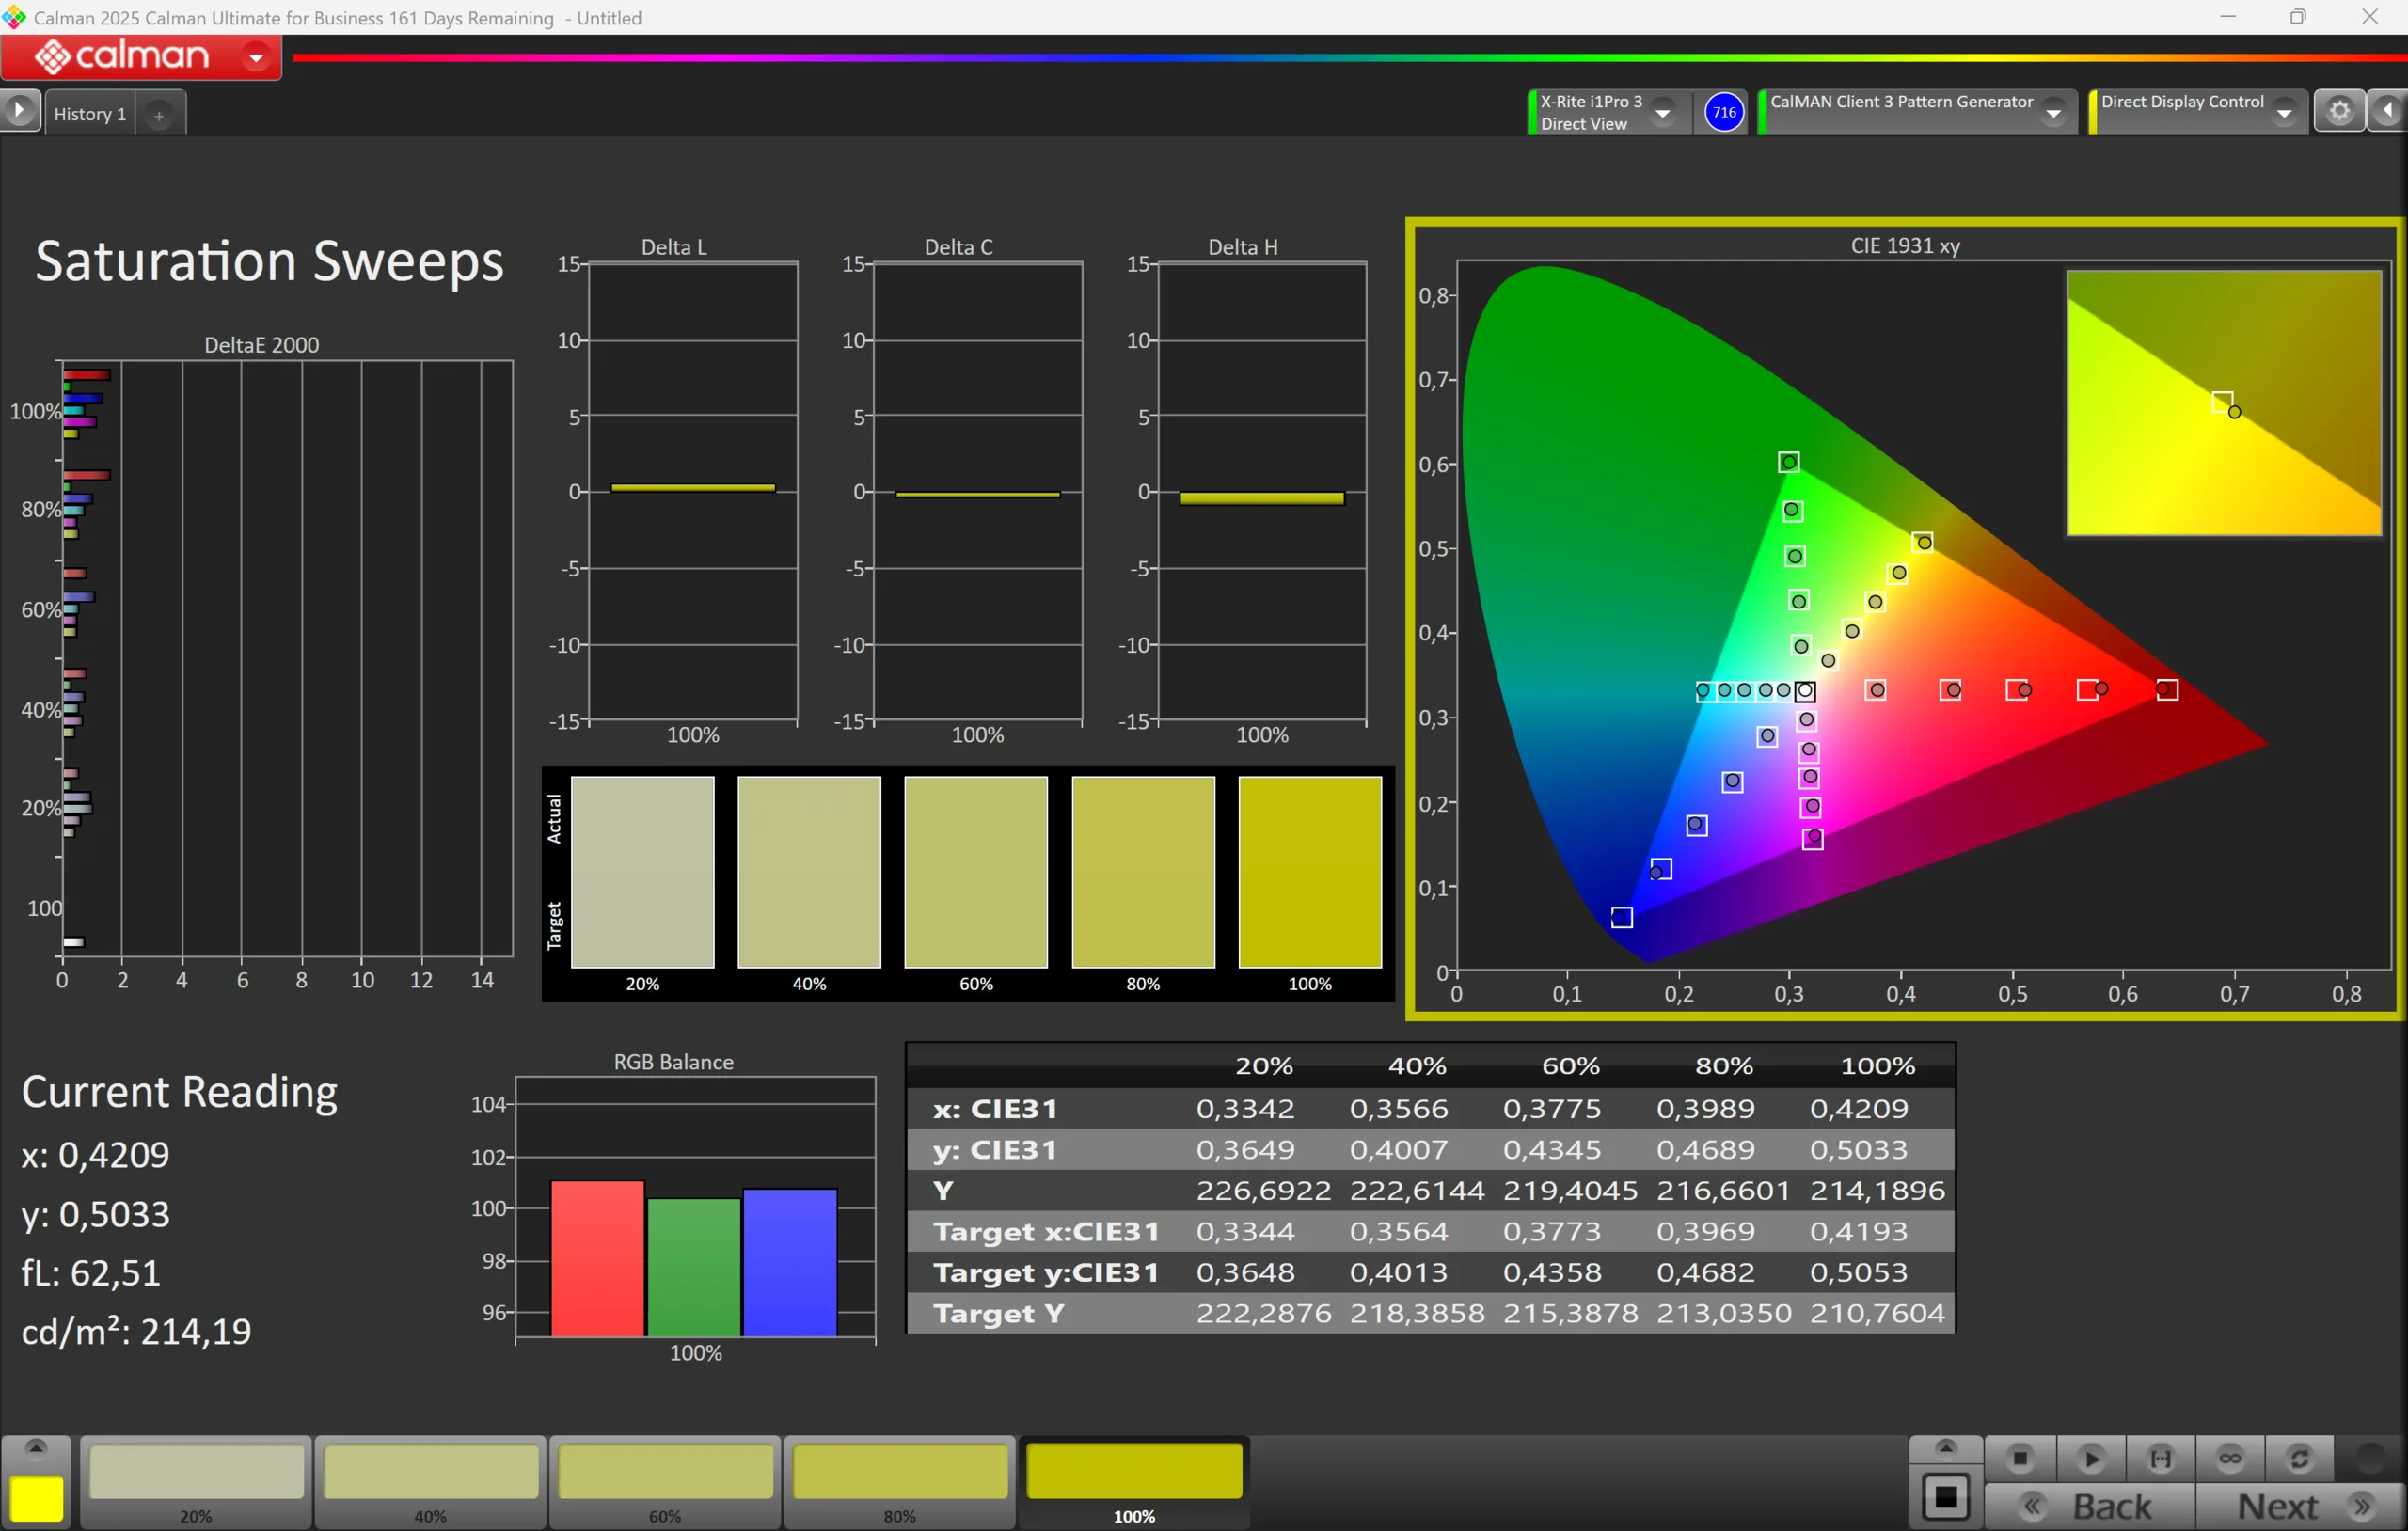

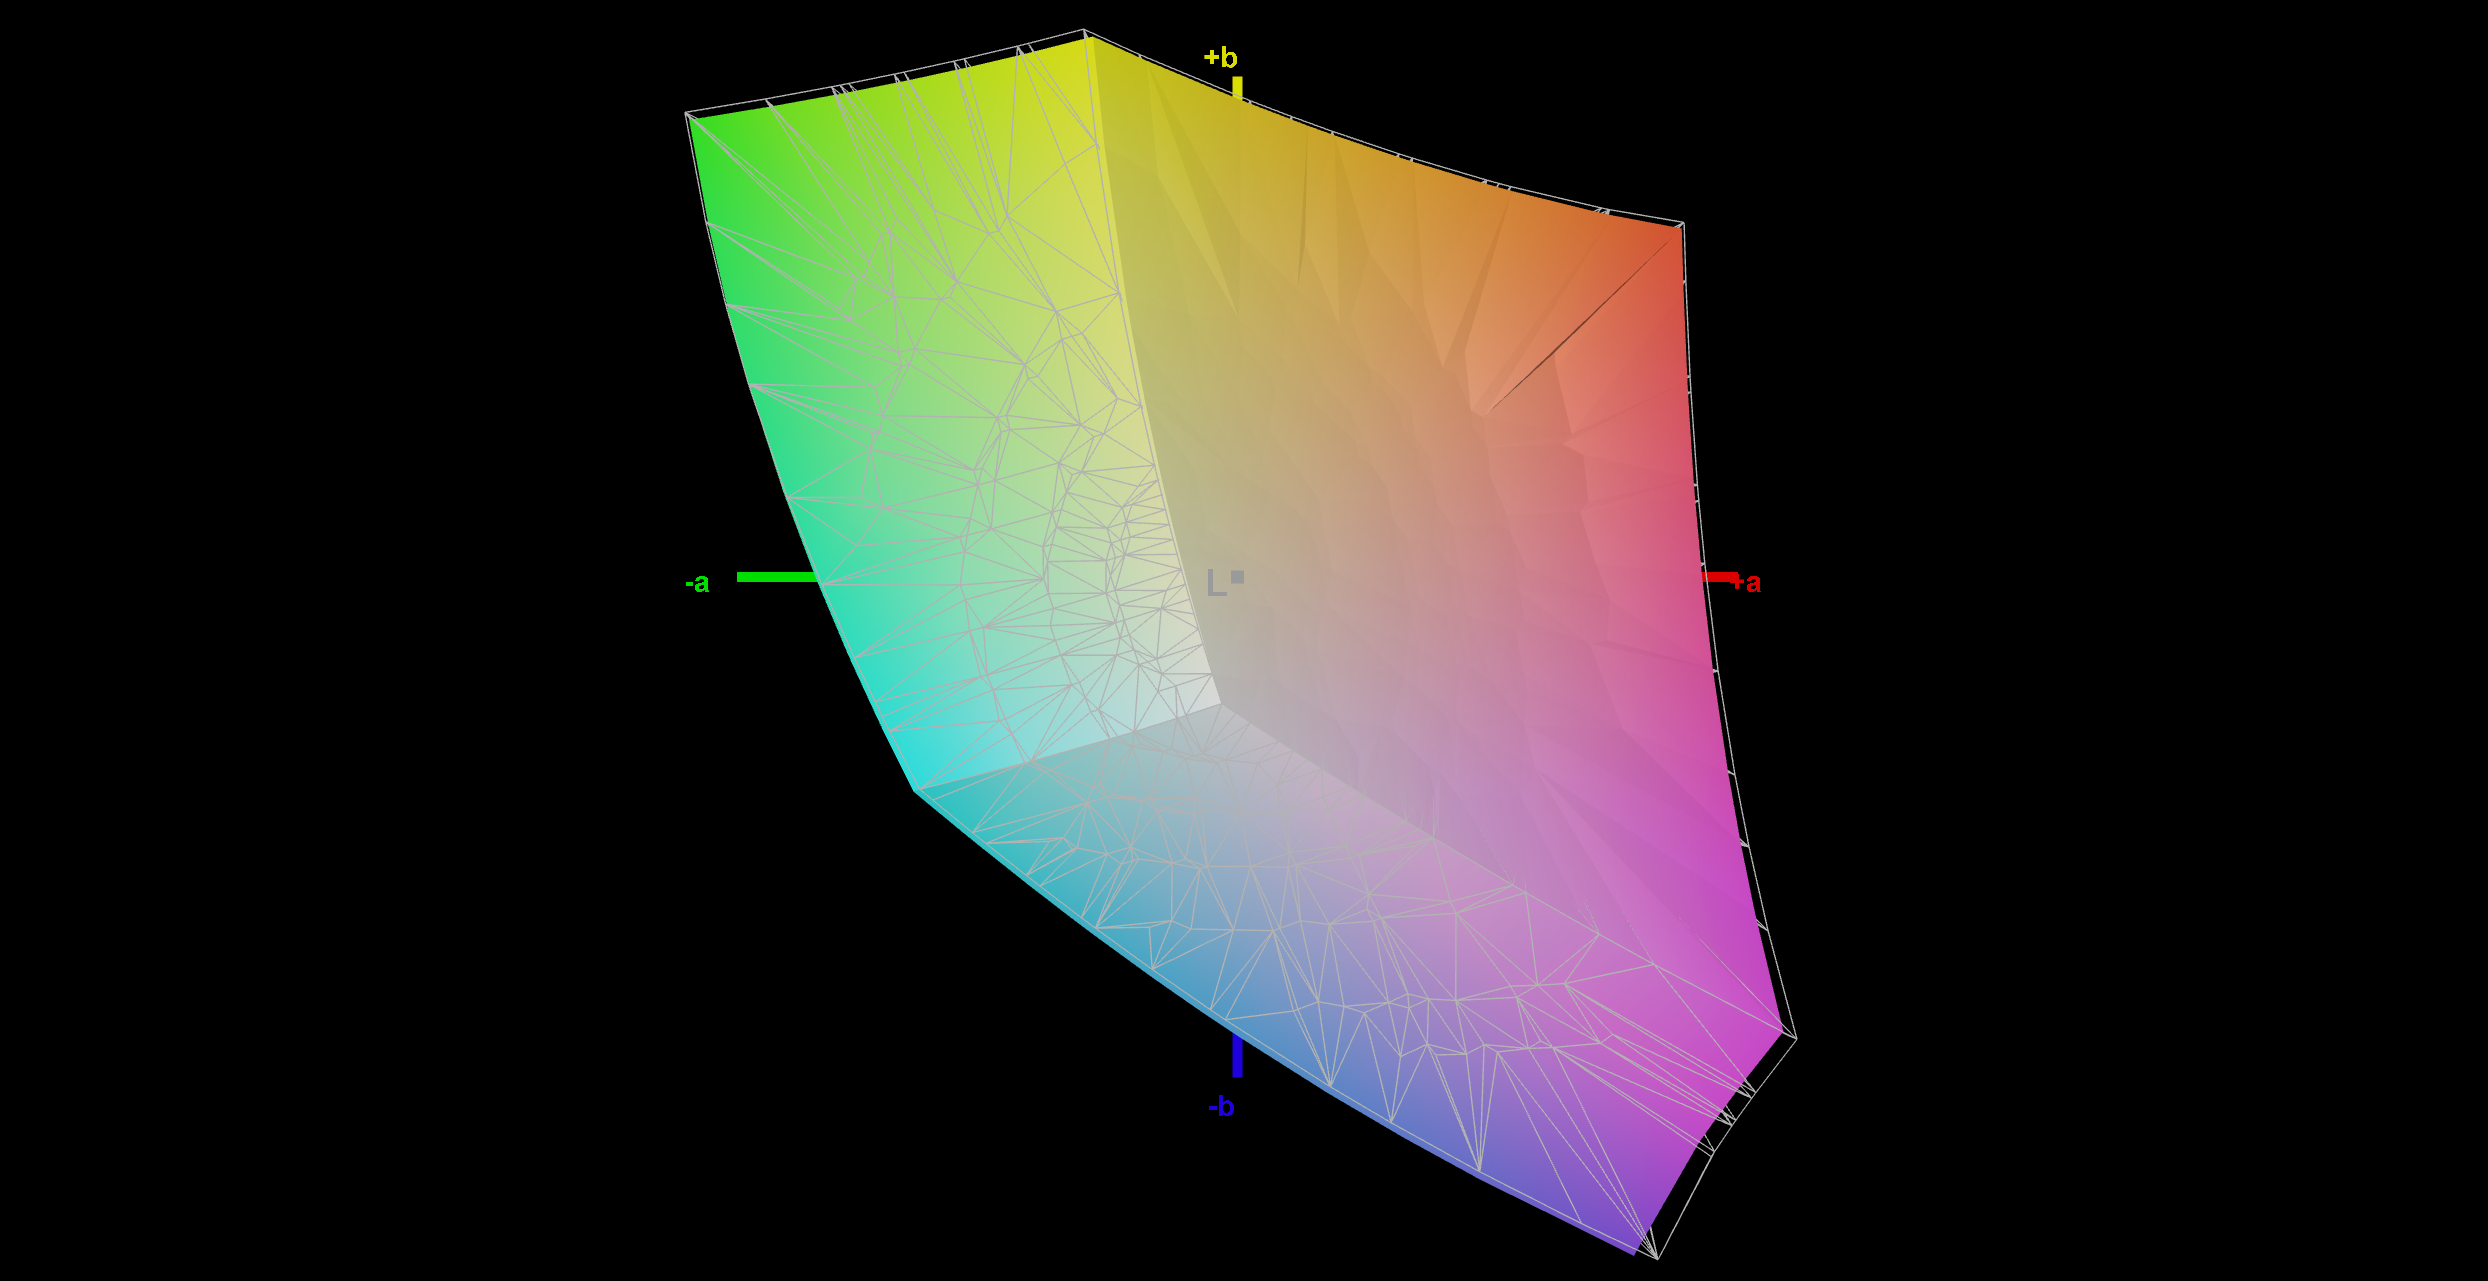
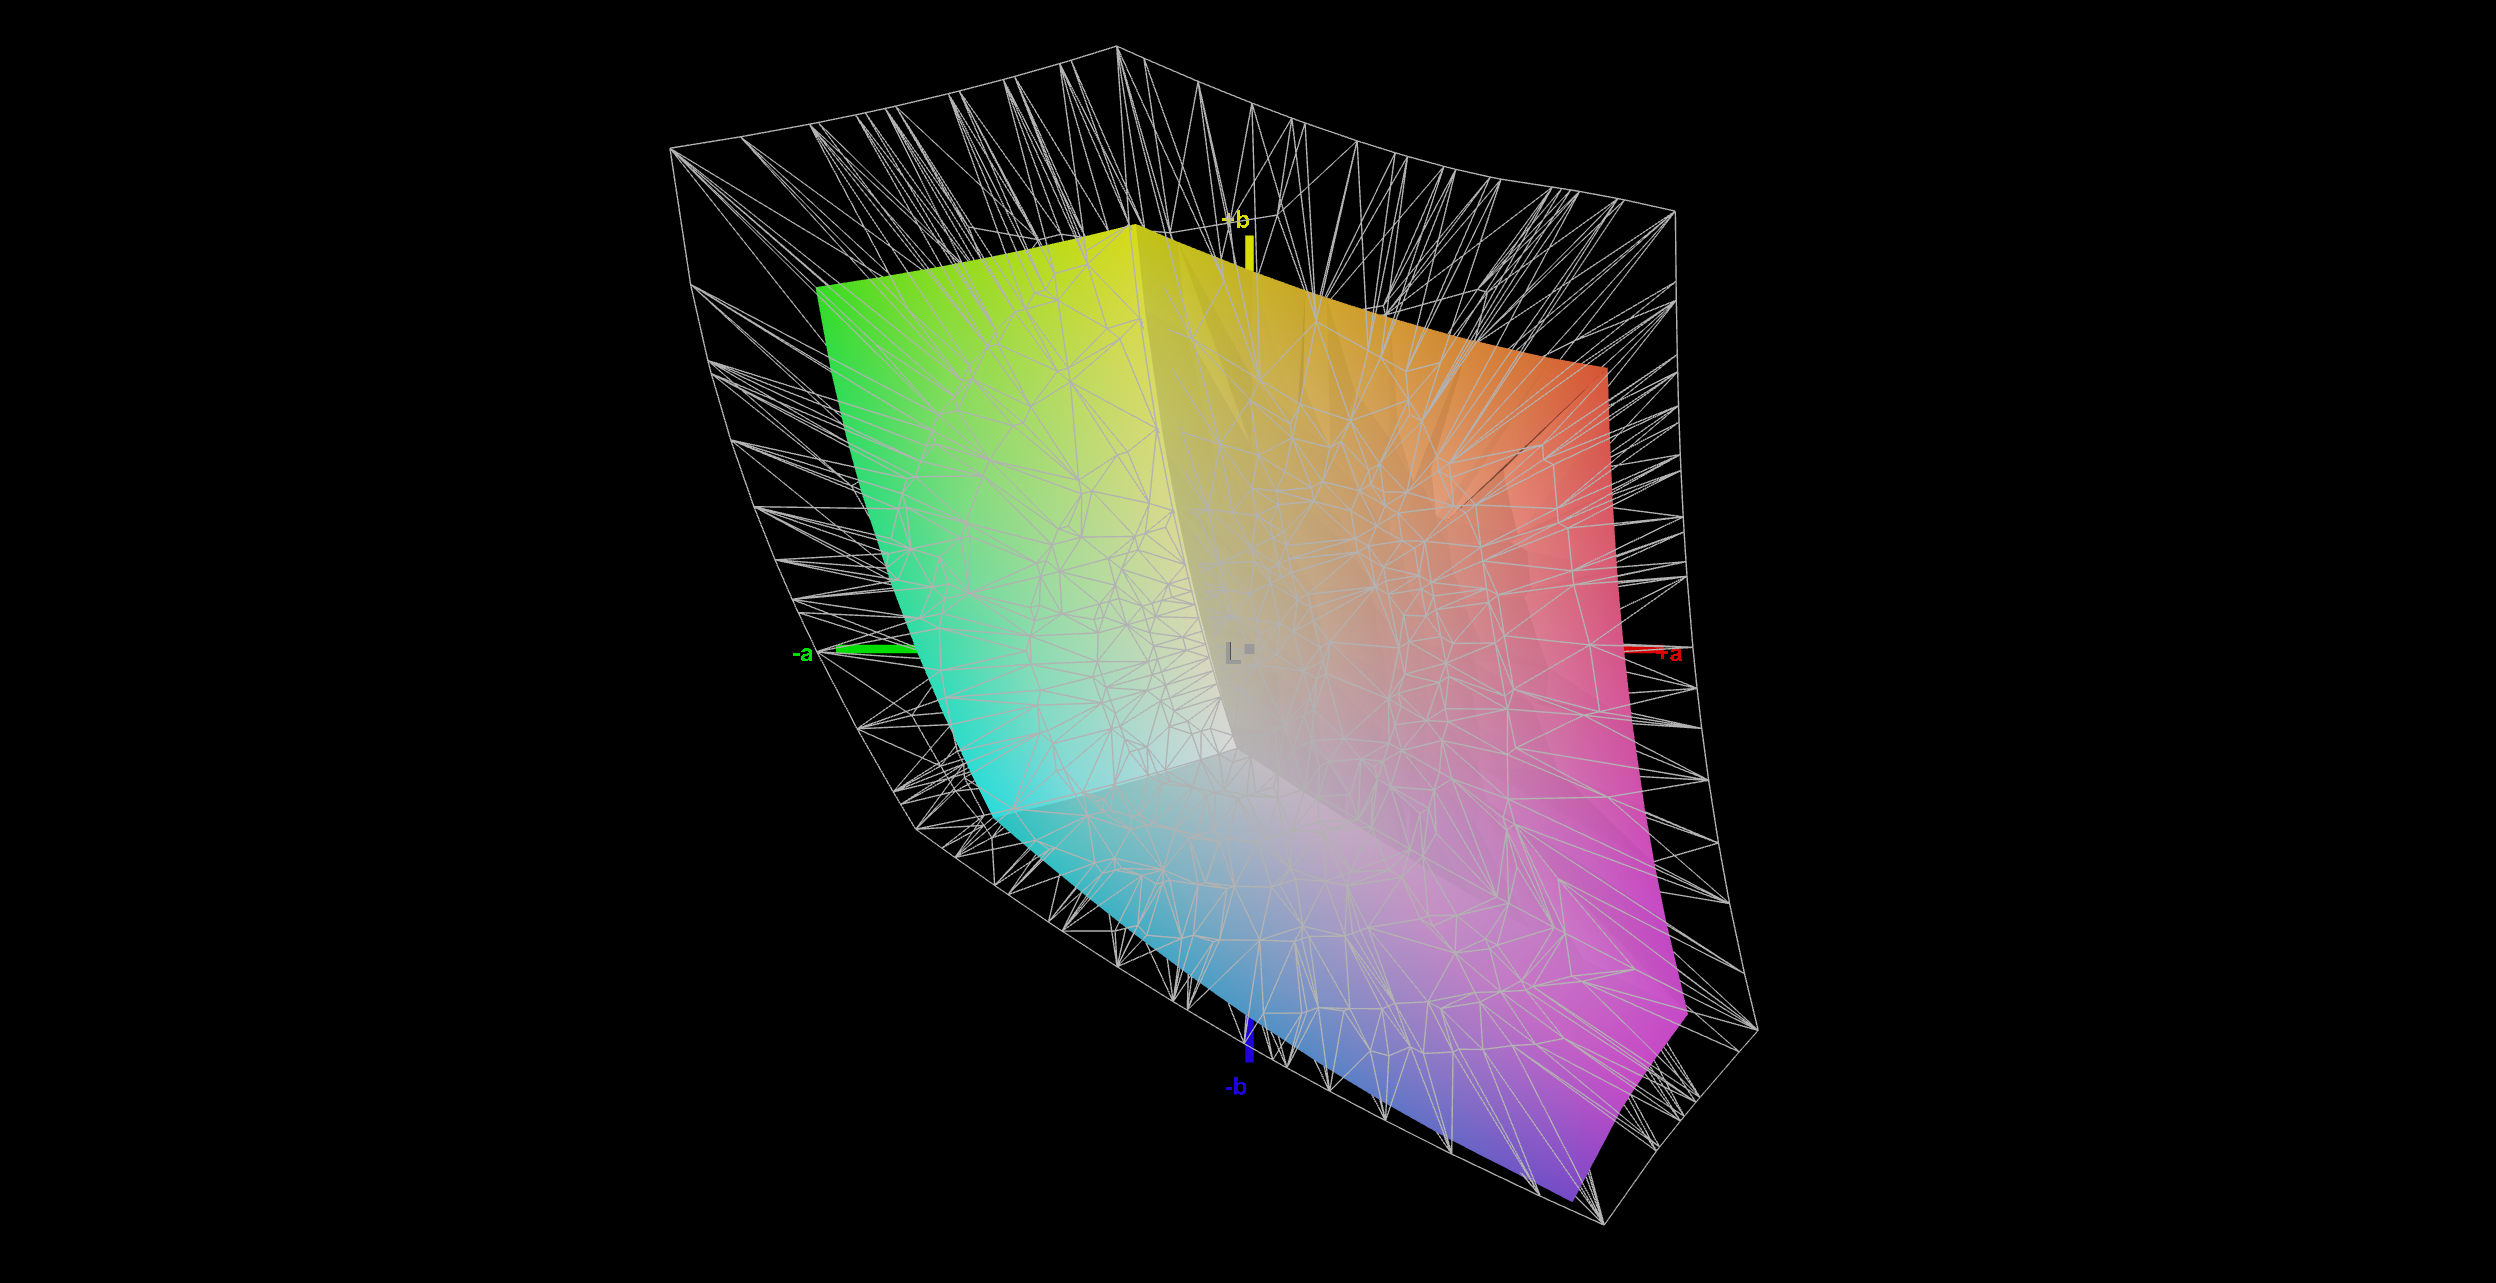
内置的 sRGB 配置文件开箱即用即可提供准确的色彩,尽管其灰度偏差相对较高。 此外还存在轻微的绿/蓝偏色,且色温偏冷。选择此设置是为了提高最大亮度。不过,通过我们自己的校准(相应的配置文件可在上方框中免费下载),我们可以显著提升图像质量。 灰度和色彩偏差均降至极低水平,色偏也完全消失。这使得该屏幕非常适合在sRGB色域内编辑图像和视频,且该色域覆盖率达到100%。不过,校准后最大亮度会降低约35 cd/m²。
Display Response Times
| ↔ Response Time Black to White | ||
|---|---|---|
| 4.2 ms ... rise ↗ and fall ↘ combined | ↗ 1.3 ms rise | 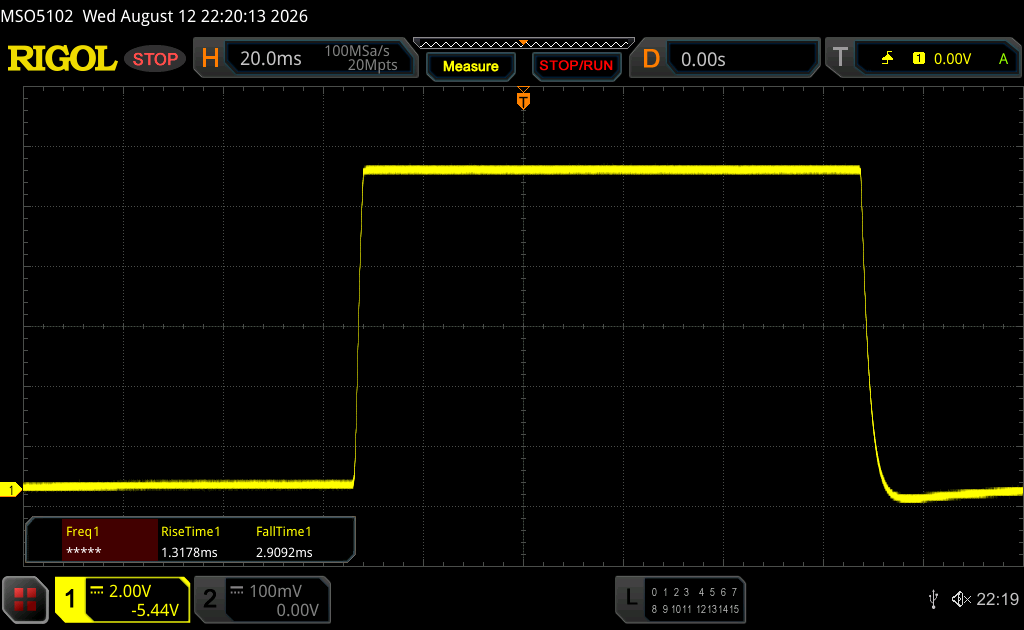 |
| ↘ 2.9 ms fall | ||
| The screen shows very fast response rates in our tests and should be very well suited for fast-paced gaming. In comparison, all tested devices range from 0.1 (minimum) to 240 (maximum) ms. » 17 % of all devices are better. This means that the measured response time is better than the average of all tested devices (19.7 ms). | ||
| ↔ Response Time Black to White | ||
| 4.2 ms ... rise ↗ and fall ↘ combined | ↗ 1.2 ms rise | 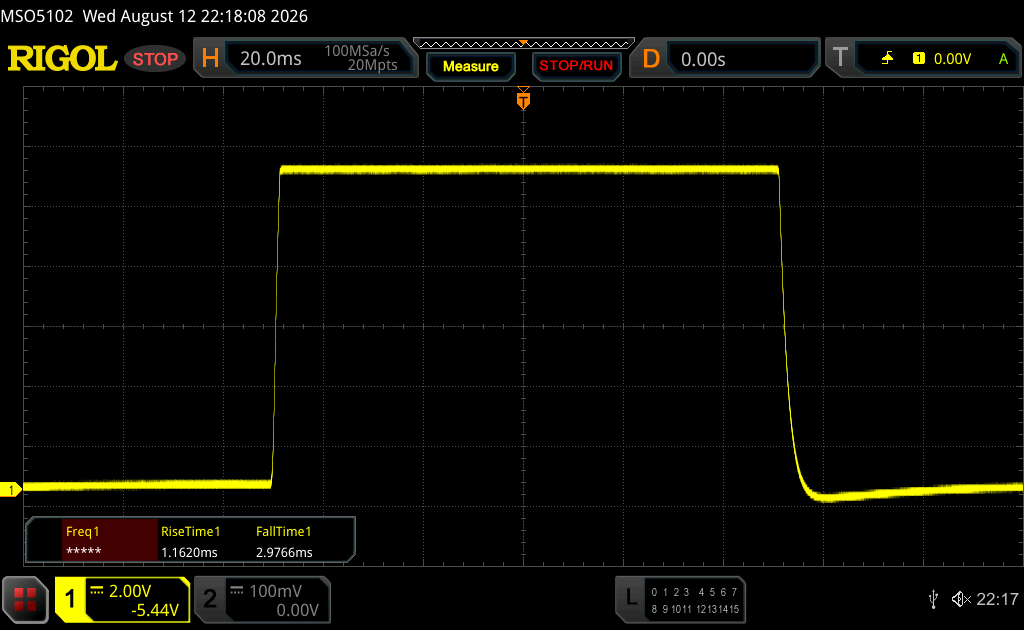 |
| ↘ 3 ms fall | ||
| The screen shows very fast response rates in our tests and should be very well suited for fast-paced gaming. In comparison, all tested devices range from 0.1 (minimum) to 240 (maximum) ms. » 17 % of all devices are better. This means that the measured response time is better than the average of all tested devices (19.7 ms). | ||
| ↔ Response Time 50% Grey to 80% Grey | ||
| 9.2 ms ... rise ↗ and fall ↘ combined | ↗ 3.3 ms rise | 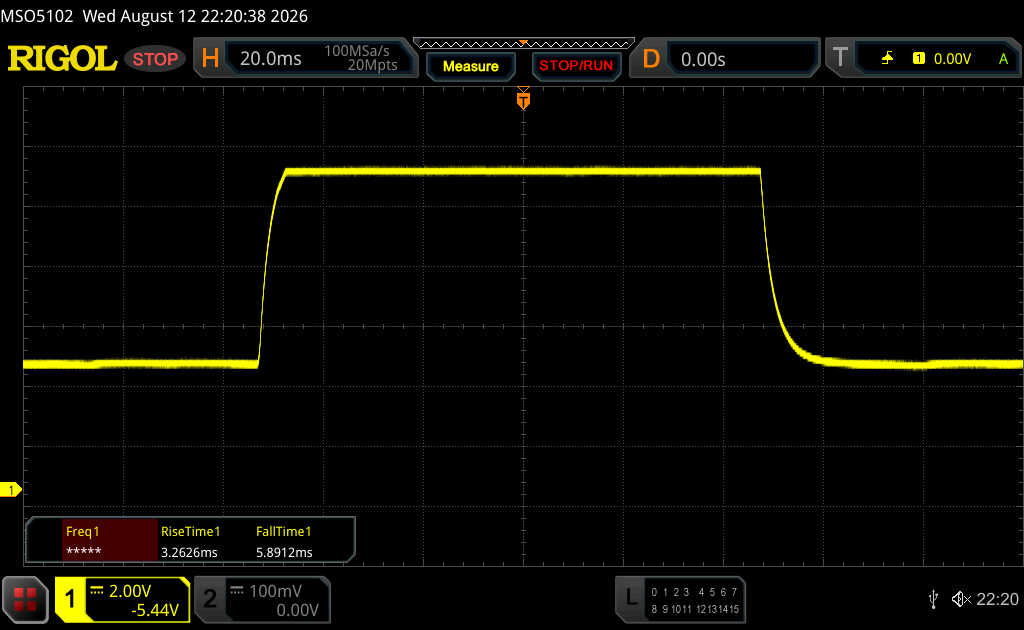 |
| ↘ 5.9 ms fall | ||
| The screen shows fast response rates in our tests and should be suited for gaming. In comparison, all tested devices range from 0.13 (minimum) to 636 (maximum) ms. » 23 % of all devices are better. This means that the measured response time is better than the average of all tested devices (30.7 ms). | ||
| ↔ Response Time 50% Grey to 80% Grey | ||
| 3.7 ms ... rise ↗ and fall ↘ combined | ↗ 1.4 ms rise | 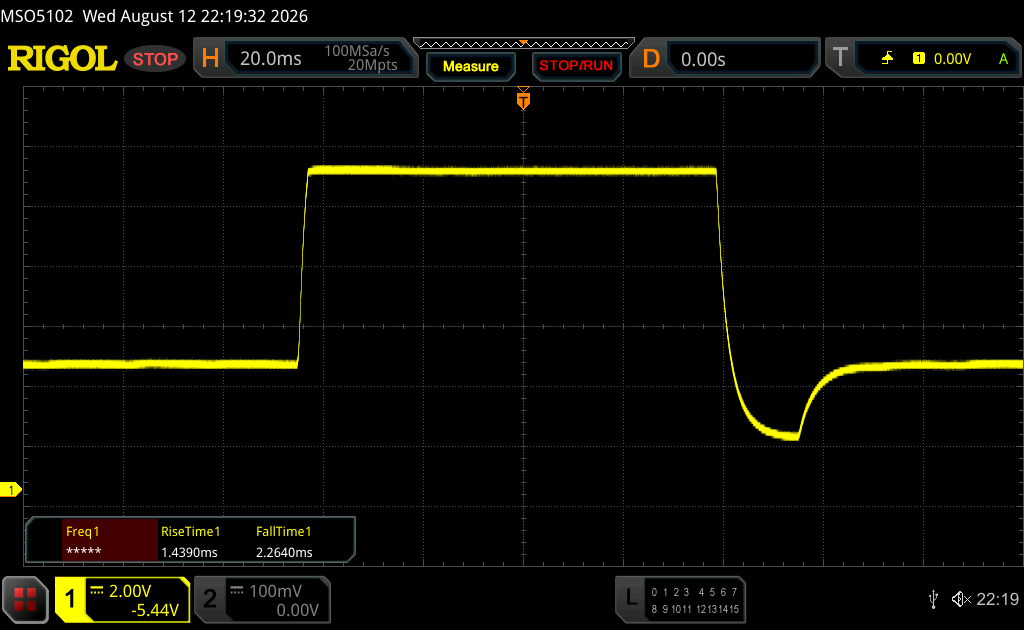 |
| ↘ 2.3 ms fall | ||
| The screen shows very fast response rates in our tests and should be very well suited for fast-paced gaming. In comparison, all tested devices range from 0.13 (minimum) to 636 (maximum) ms. » 15 % of all devices are better. This means that the measured response time is better than the average of all tested devices (30.7 ms). | ||
Screen Flickering / PWM (Pulse-Width Modulation)
| Screen flickering / PWM not detected | 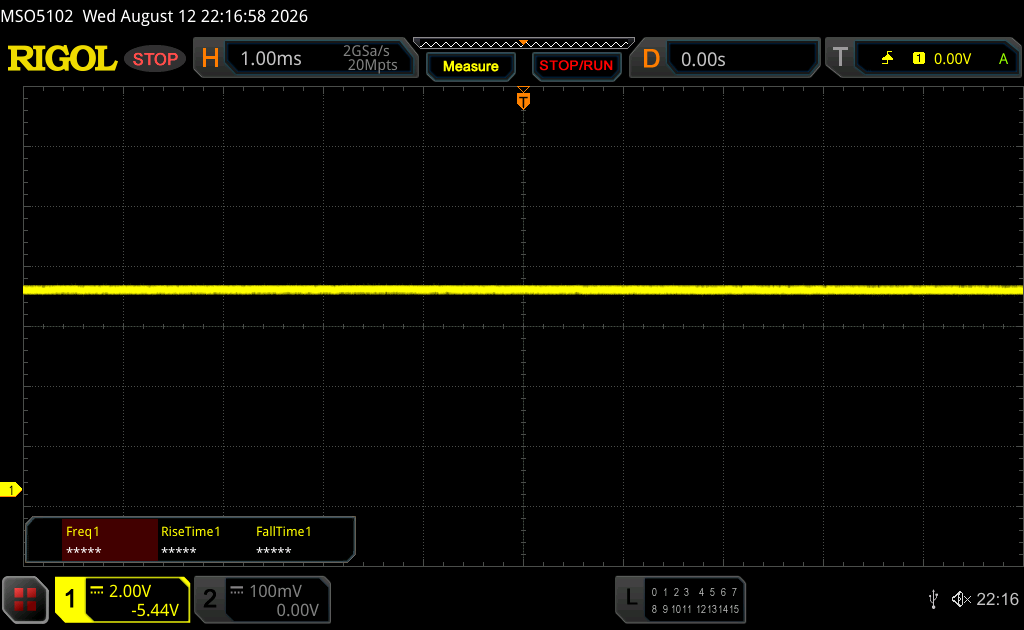 | ||
In comparison: 52 % of all tested devices do not use PWM to dim the display. If PWM was detected, an average of 7622 (minimum: 5 - maximum: 343500) Hz was measured. | |||
发言人
尽管技术规格中未提及扬声器,但在下边框中央确实有一个扬声器模块。不过,它真的只应被视为最后的选择,因为其音量并不大,且声音听起来极其单薄。
KTC H27E6S audio analysis
(±) | speaker loudness is average but good (77.2 dB)
Bass 100 - 315 Hz
(-) | nearly no bass - on average 24.1% lower than median
(+) | bass is linear (4.5% delta to prev. frequency)
Mids 400 - 2000 Hz
(±) | higher mids - on average 9.2% higher than median
(±) | linearity of mids is average (9.2% delta to prev. frequency)
Highs 2 - 16 kHz
(+) | balanced highs - only 3.8% away from median
(+) | highs are linear (4.1% delta to prev. frequency)
Overall 100 - 16.000 Hz
(±) | linearity of overall sound is average (25.2% difference to median)
Compared to same class
» 77% of all tested devices in this class were better, 5% similar, 18% worse
» The best had a delta of 4%, average was 23%, worst was 136%
Compared to all devices tested
» 77% of all tested devices were better, 5% similar, 18% worse
» The best had a delta of 4%, average was 23%, worst was 136%
KTC G27P6 audio analysis
(-) | not very loud speakers (71.04 dB)
Bass 100 - 315 Hz
(-) | nearly no bass - on average 15.2% lower than median
(-) | bass is not linear (17.8% delta to prev. frequency)
Mids 400 - 2000 Hz
(+) | balanced mids - only 2.2% away from median
(+) | mids are linear (5.7% delta to prev. frequency)
Highs 2 - 16 kHz
(+) | balanced highs - only 2.8% away from median
(+) | highs are linear (4.3% delta to prev. frequency)
Overall 100 - 16.000 Hz
(±) | linearity of overall sound is average (16.8% difference to median)
Compared to same class
» 30% of all tested devices in this class were better, 7% similar, 63% worse
» The best had a delta of 4%, average was 23%, worst was 136%
Compared to all devices tested
» 30% of all tested devices were better, 7% similar, 63% worse
» The best had a delta of 4%, average was 23%, worst was 136%
能耗
在我们的功耗测试中,KTC显示器表现优异,无论在待机状态还是关机状态下,功耗均较低。在最低亮度下,功耗约为14瓦,最高亮度时则升至38瓦。功耗随所选亮度级别的增加呈线性增长;在50%亮度时,功耗为26瓦。
| Off / Standby |   0.19 / 0.22 Watt 0.19 / 0.22 Watt |
| Idle |  14.3 / / 38.5 Watt 14.3 / / 38.5 Watt |
    
| |
Key:
min: ,
med: ,
max: Metrahit Energy | |
结论——一款优秀的IPS显示器,不仅适合游戏玩家
总体而言,KTC H27E6S 是一款优秀的 IPS 显示器,凭借其高刷新率和快速响应时间,特别适合游戏使用。不过,那些主要为了工作而选购 IPS 显示器的用户可能会觉得缺少 USB-C 电源传输或 KVM 切换器等功能。
Transparency
The selection of devices to be reviewed is made by our editorial team. The test sample was given to the author by the manufacturer free of charge for the purposes of review. There was no third-party influence on this review, nor did the manufacturer receive a copy of this review before publication. There was no obligation to publish this review. As an independent media company, Notebookcheck is not subjected to the authority of manufacturers, retailers or publishers.
 Add as a preferred source on Google