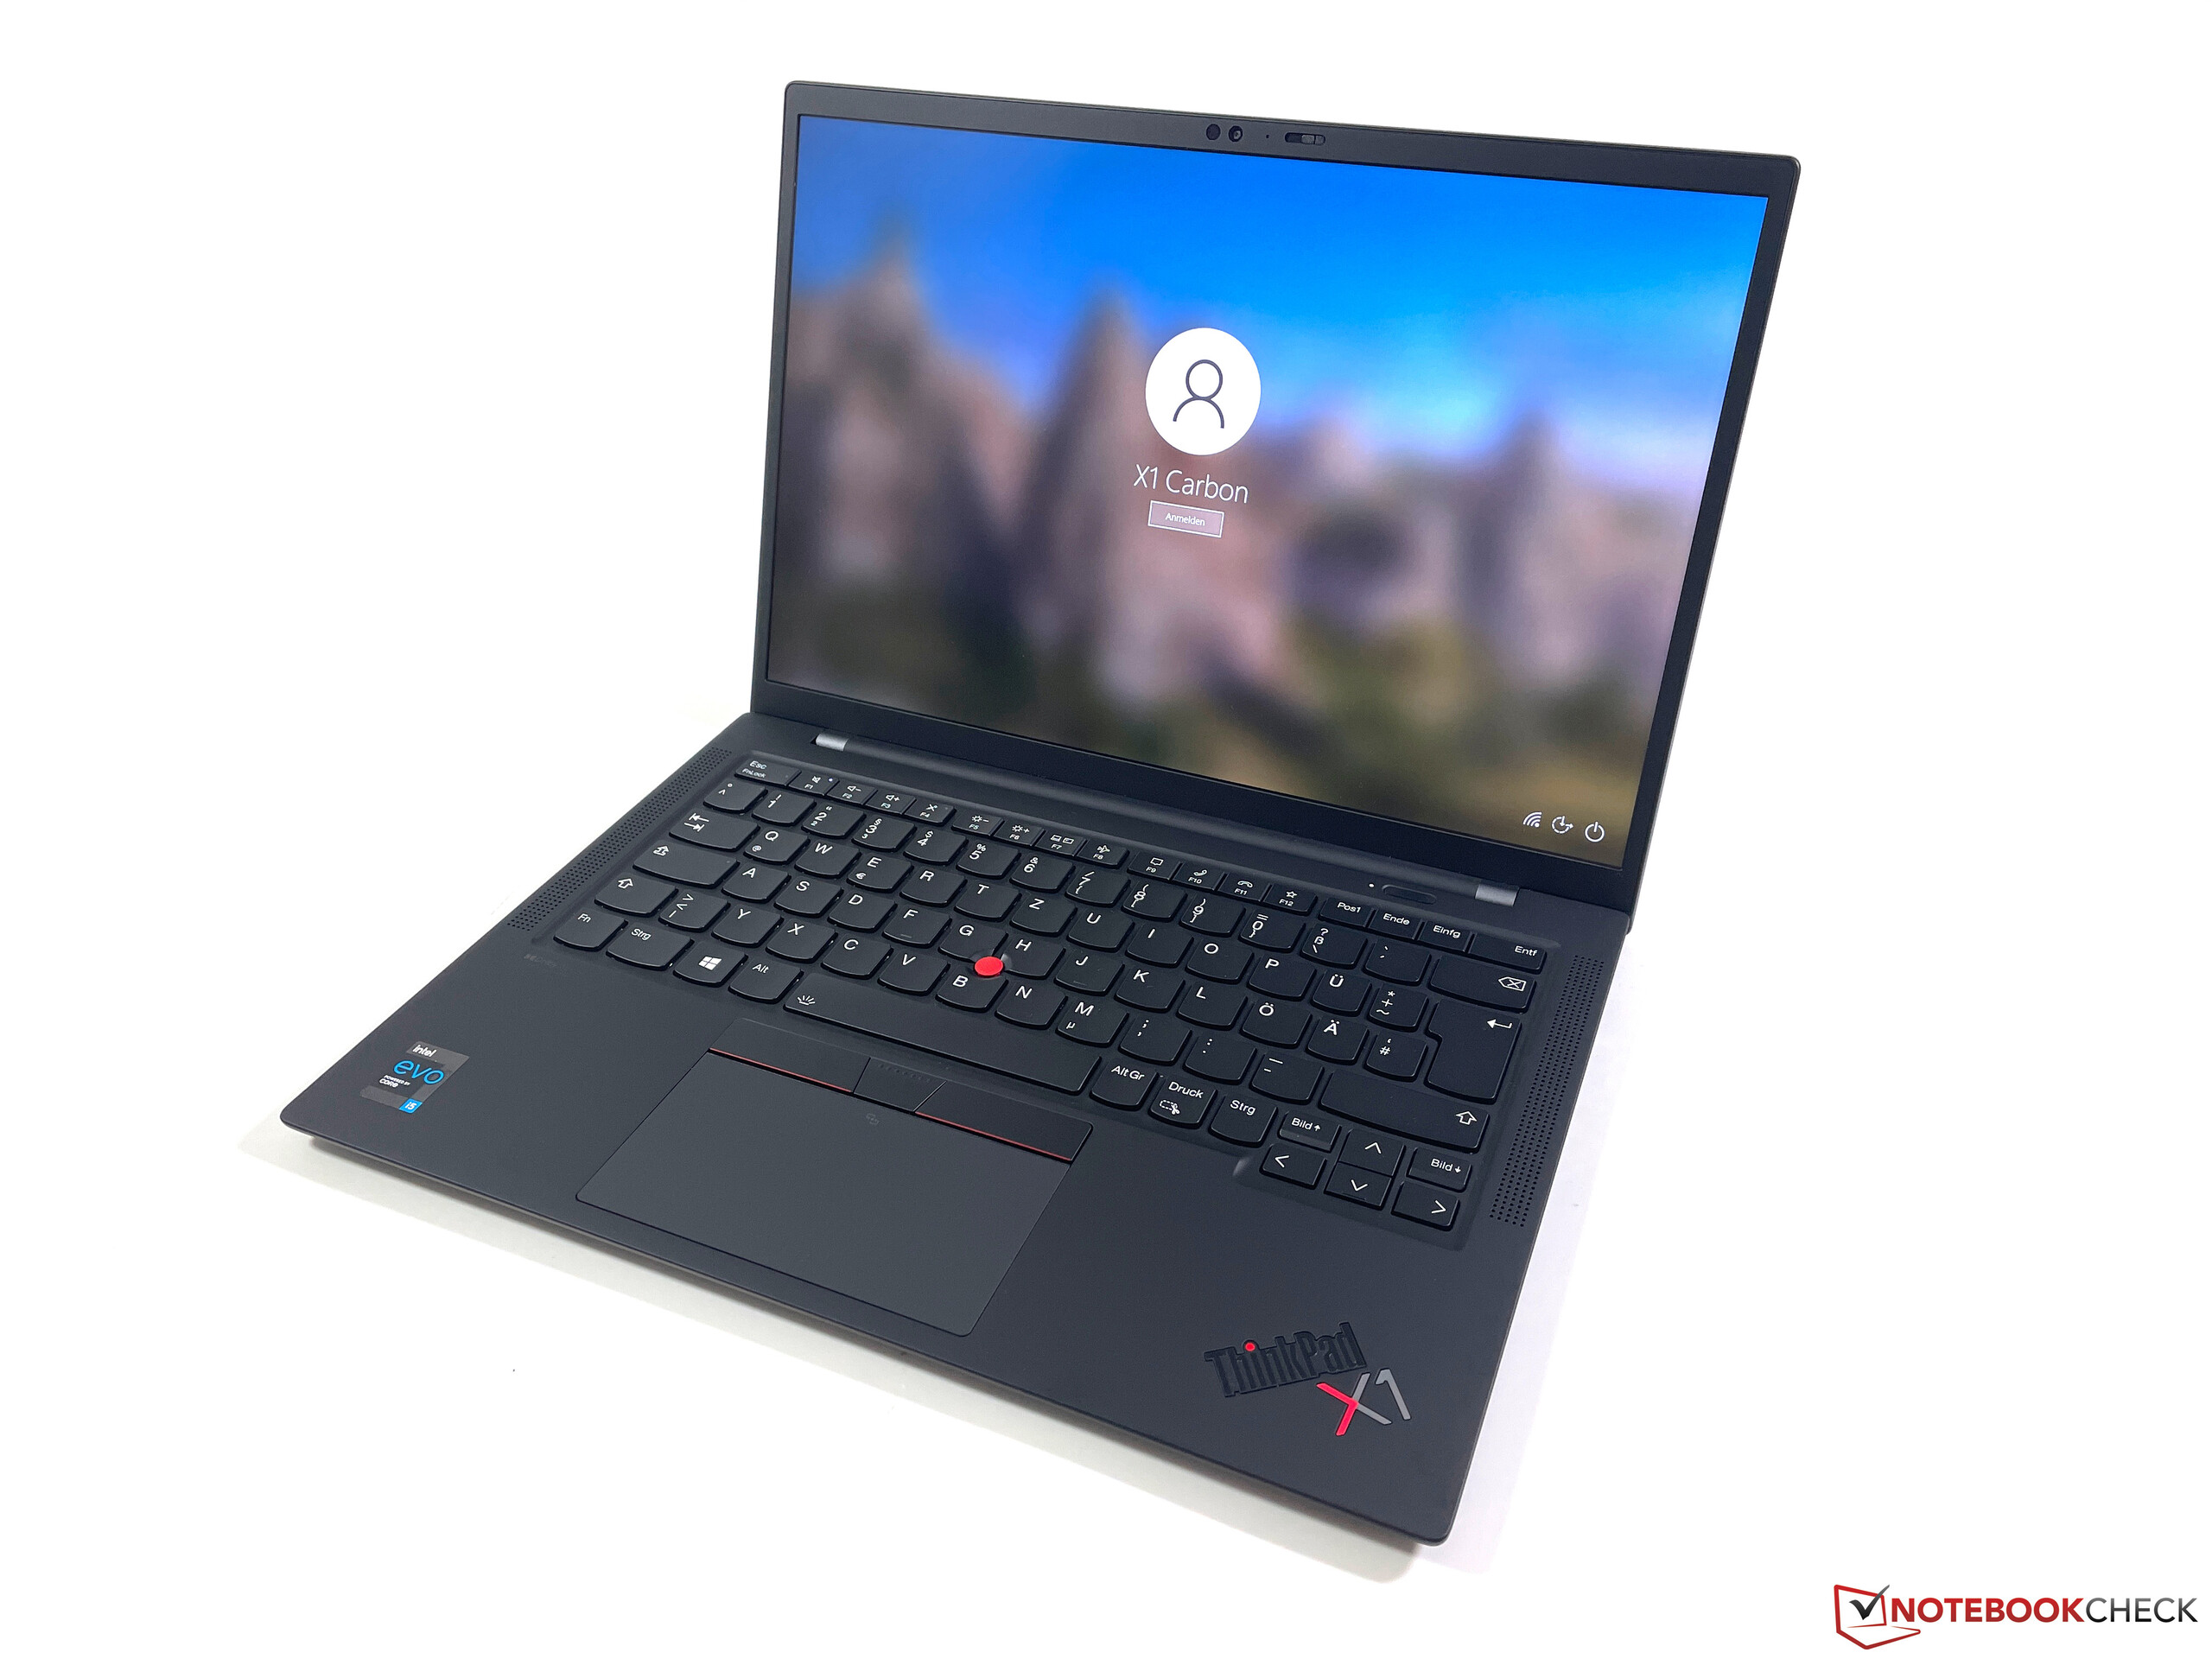
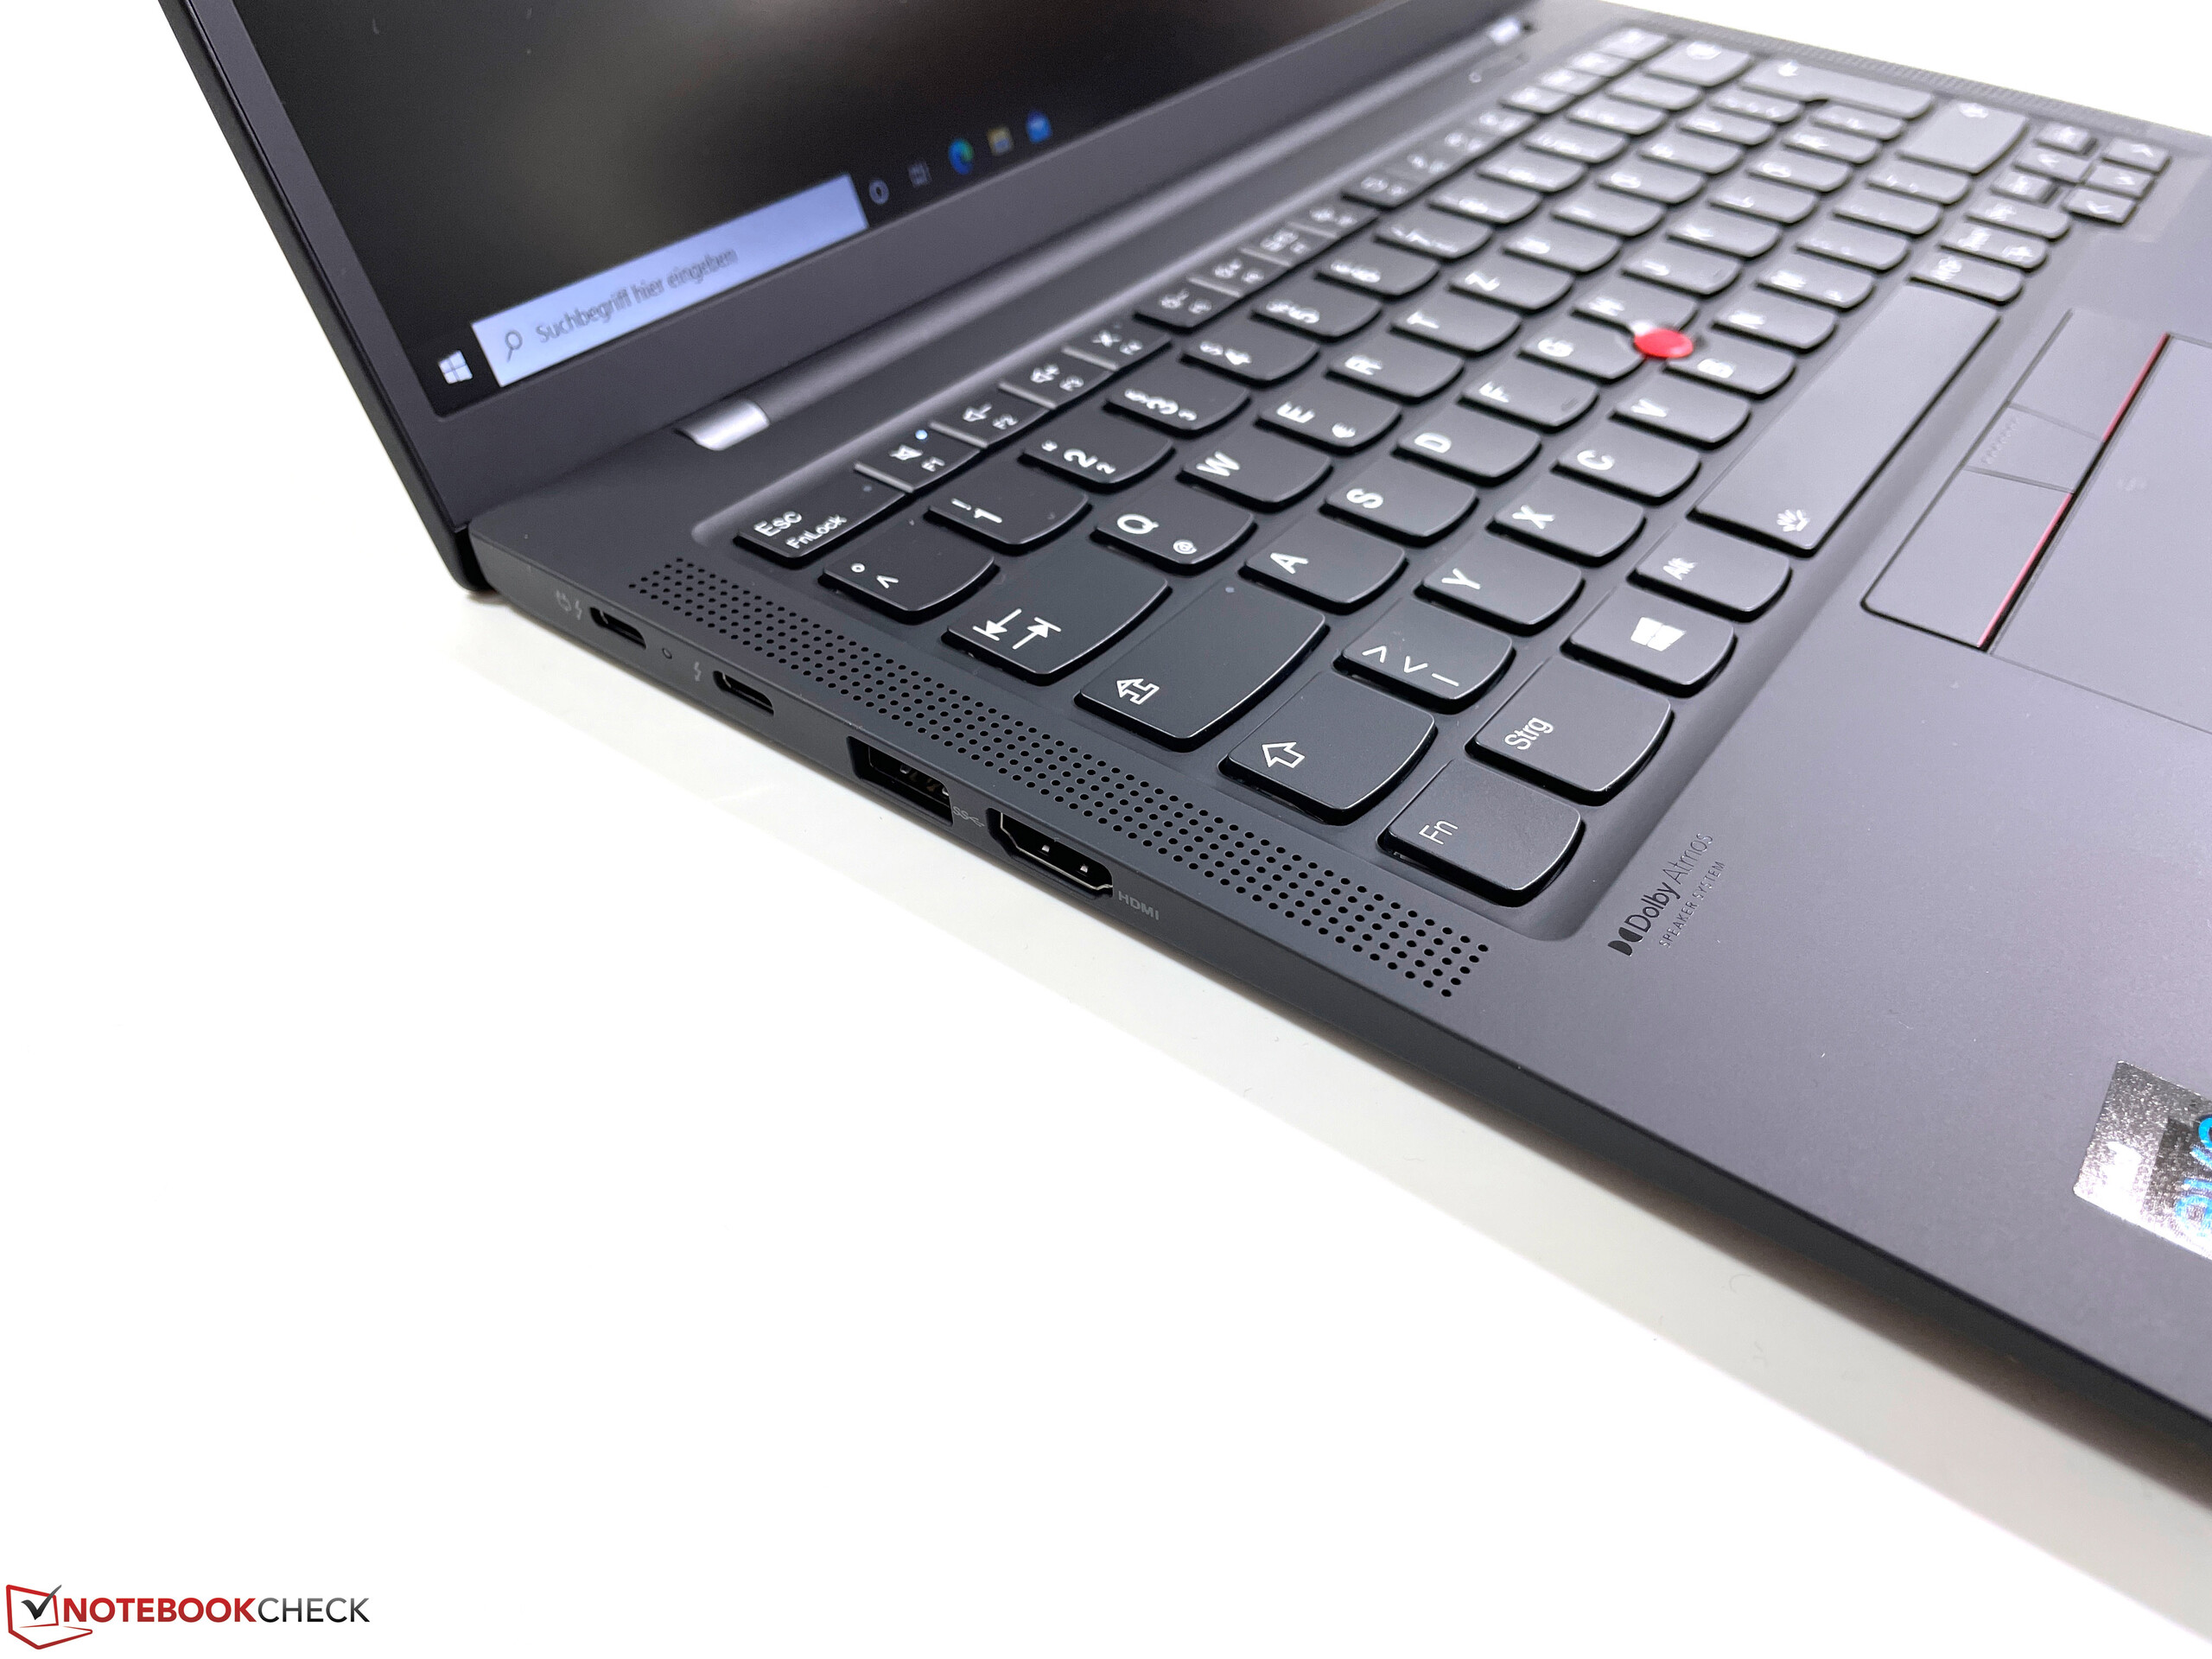
联想ThinkPad X1 Carbon G9笔记本电脑评测。ePrivacy屏幕仍有问题
我们已经测试了目前的第九代ThinkPad X1 Carbon,但早期型号在高负荷下的性能并不稳定。联想同时发布了几个BIOS更新,这就是为什么我们要再次检查性能发展。同时,我们仍然看一下带有集成隐私过滤器的可选ePrivacy显示屏。
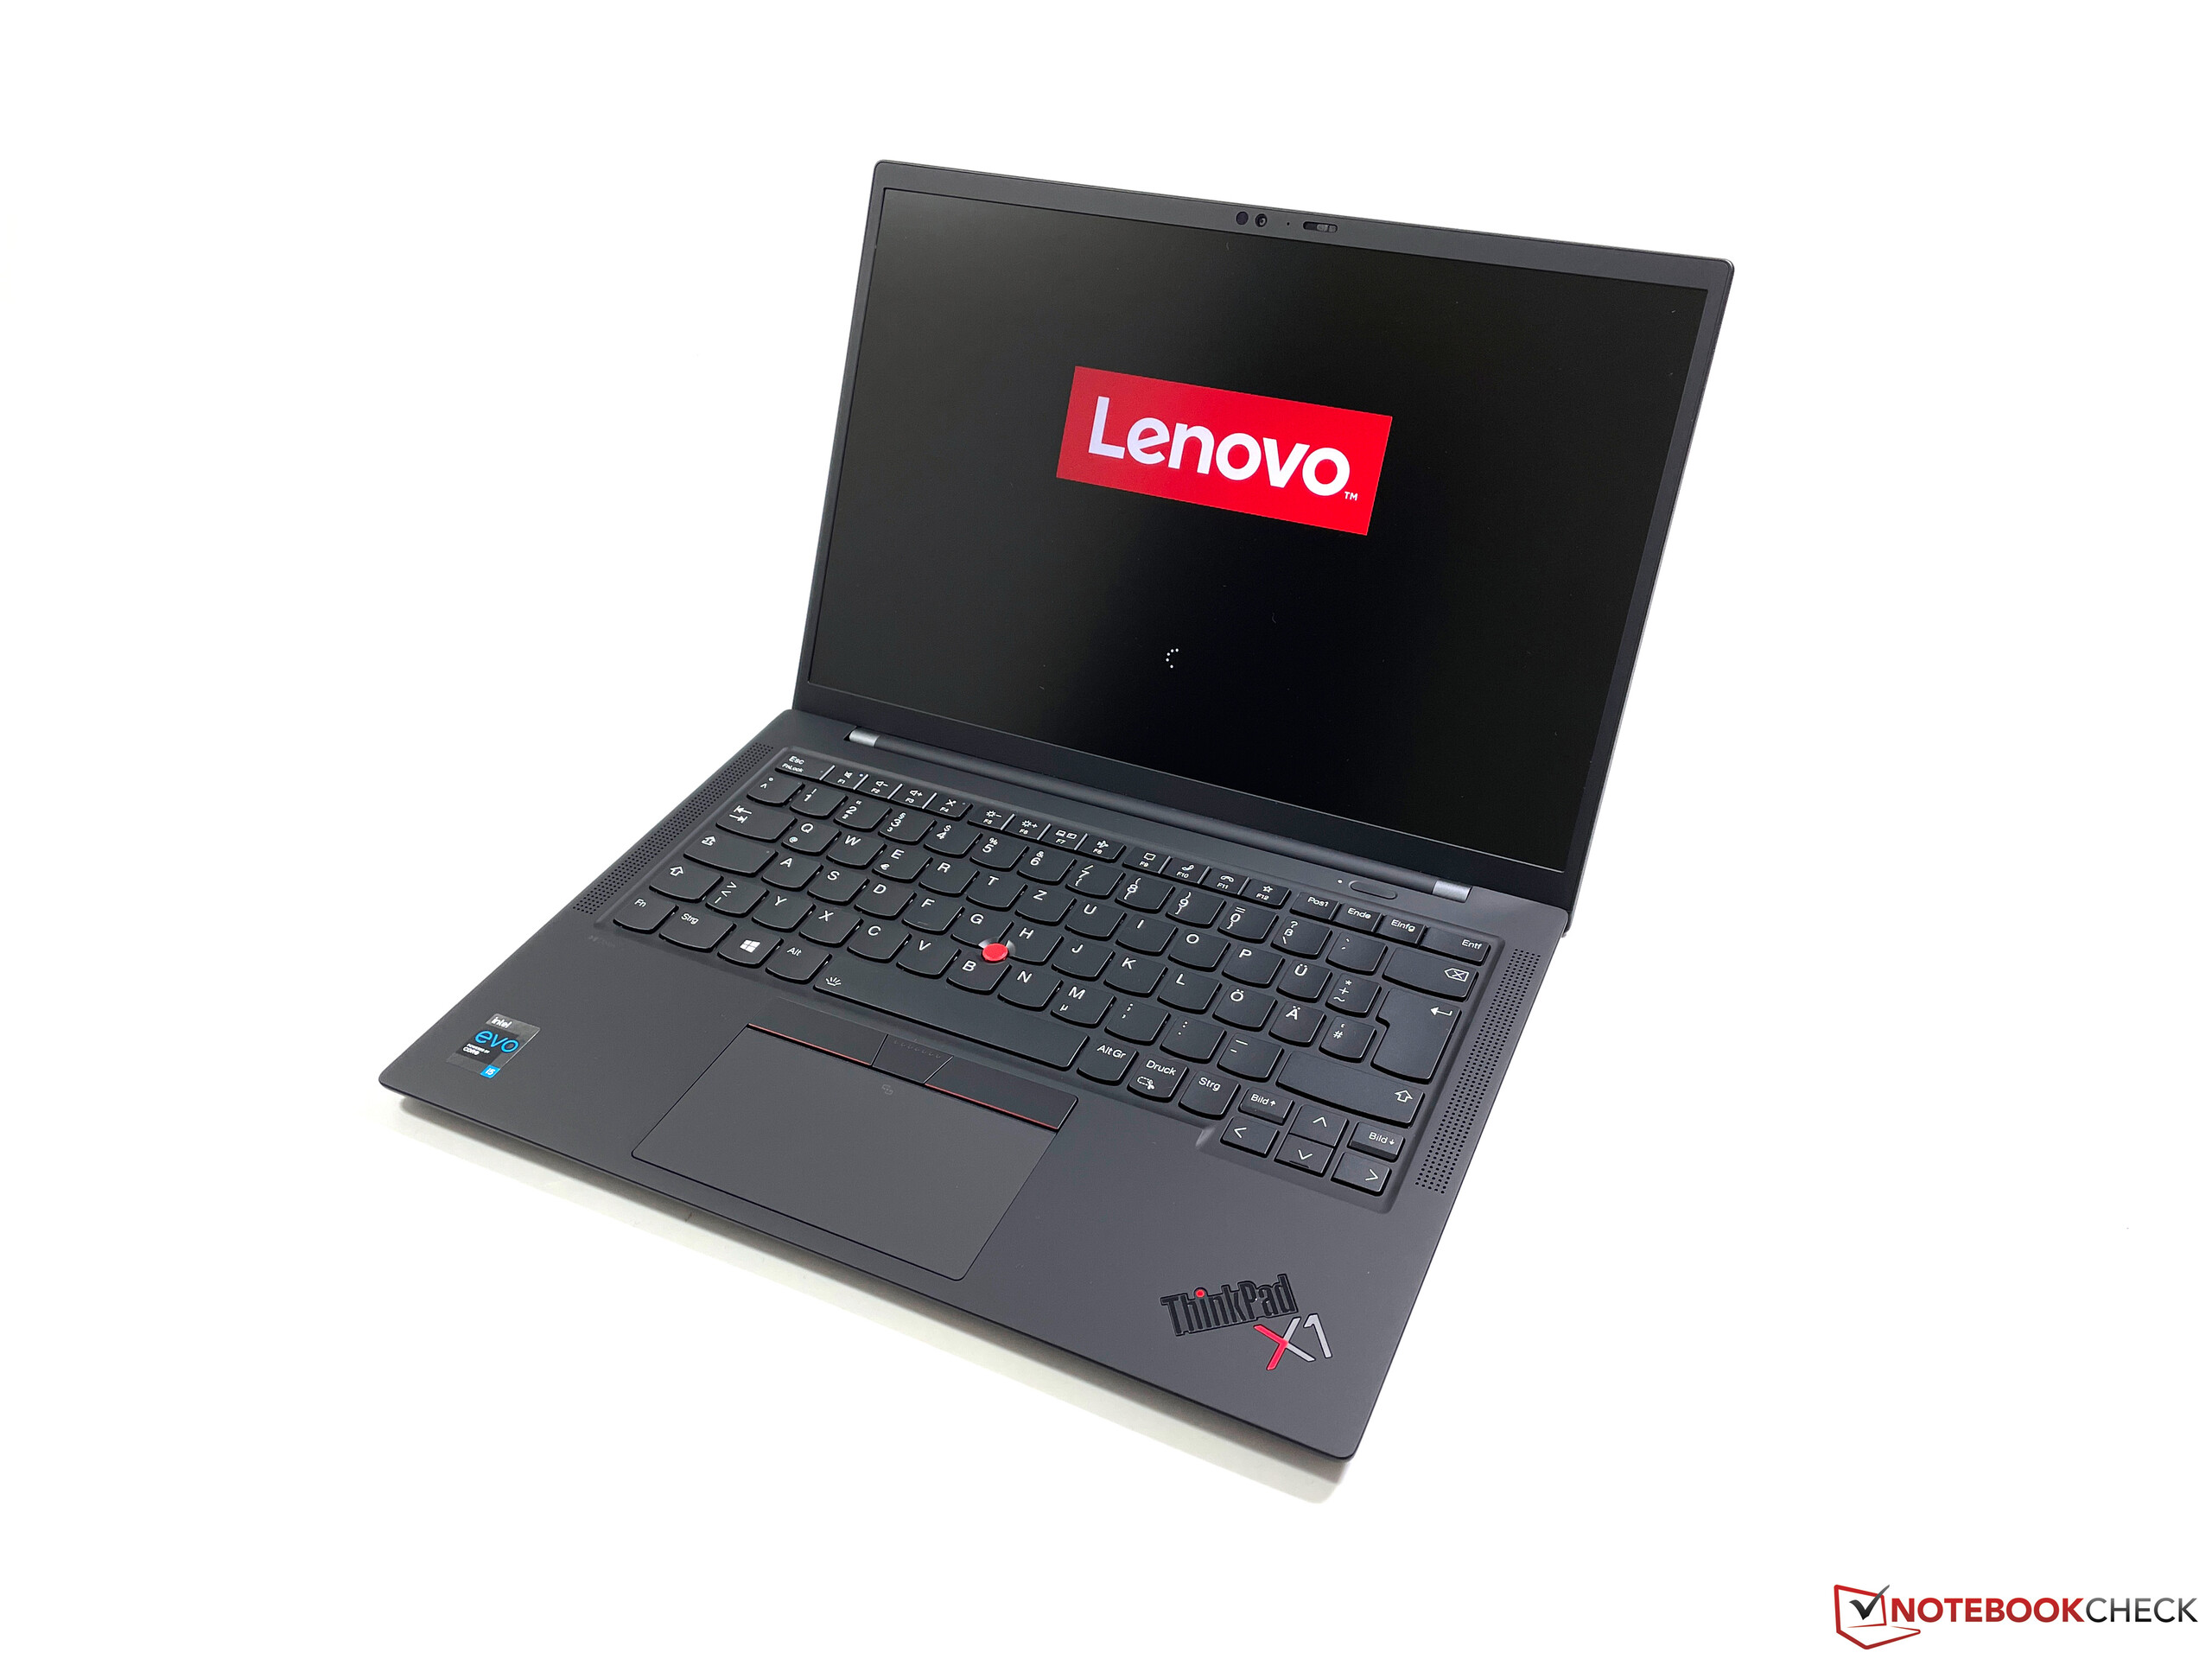
关于所有其他信息(外壳、设备和输入设备),我们之前对ThinkPad X1 Carbon G9的评论可供参考。
Possible competitors in comparison
Rating | Date | Model | Weight | Height | Size | Resolution | Price |
|---|---|---|---|---|---|---|---|
| 87.4 % v7 (old) | 11 / 2021 | Lenovo ThinkPad X1 Carbon G9-20XW0089GE i5-1135G7, Iris Xe G7 80EUs | 1.2 kg | 14.9 mm | 14.00" | 1920x1200 | |
| 89.8 % v7 (old) | 08 / 2021 | HP EliteBook 840 Aero G8 3E4Q6AA i7-1185G7, Iris Xe G7 96EUs | 1.2 kg | 17.9 mm | 14.00" | 1920x1080 | |
| 90.3 % v7 (old) | 09 / 2021 | Lenovo ThinkPad X1 Carbon G9-20XWCTO1WW i7-1165G7, Iris Xe G7 96EUs | 1.2 kg | 14.9 mm | 14.00" | 3840x2400 | |
| 89.1 % v7 (old) | Schenker Vision 14 i7-1165G7, Iris Xe G7 96EUs | 1 kg | 15.6 mm | 14.00" | 2880x1800 | ||
| 87.1 % v7 (old) | 09 / 2021 | Asus ExpertBook B9 B9400CE-KC0166R i7-1165G7, Iris Xe G7 96EUs | 995 g | 14.9 mm | 14.00" | 1920x1080 |
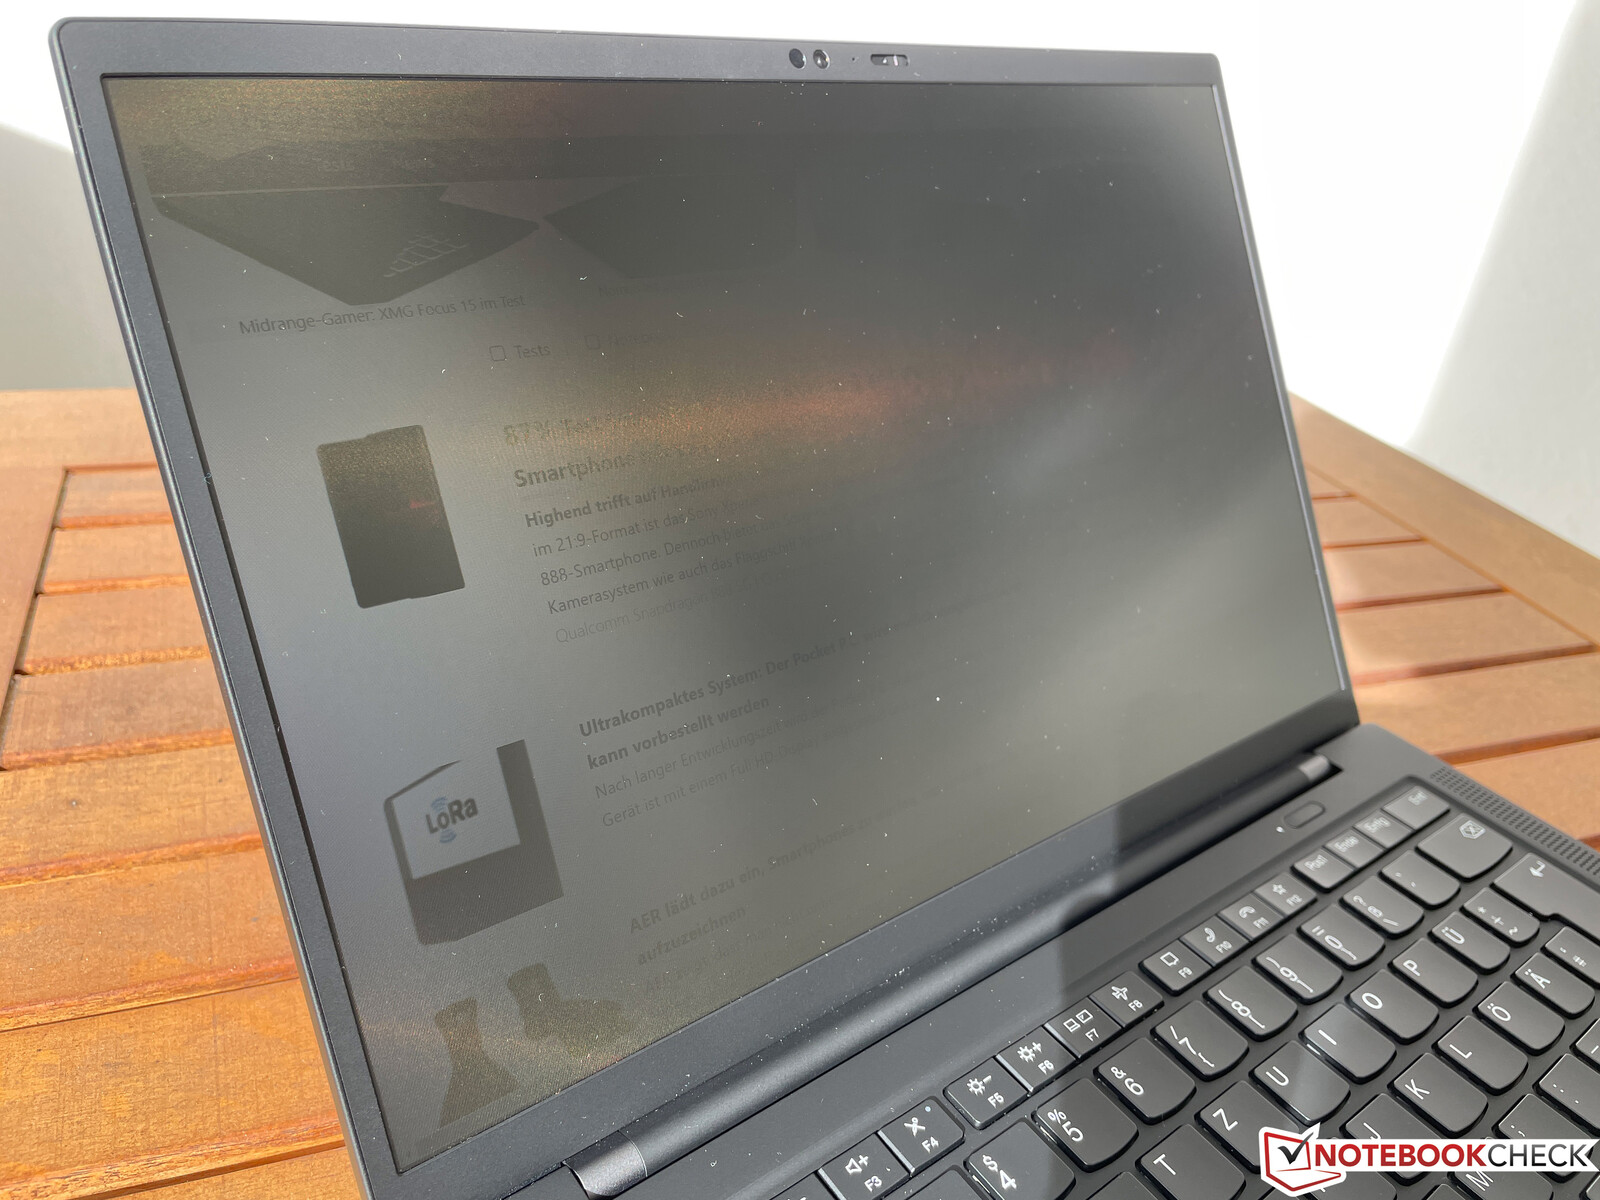
显示器--ThinkPad,内置隐私过滤器

我们测试设备中的可选ePrivacy屏幕在14英寸的对角线上提供了1920 x 1200像素(16:10)的分辨率。联想表示亮度为500尼特,根据我们的分析(CalMAN & X-Rite i1 Pro 2)可以确认,平均亮度甚至比540cd/m²还要高一点。同时,黑值非常低(0.24),这导致了2400:1的非常好的对比度。
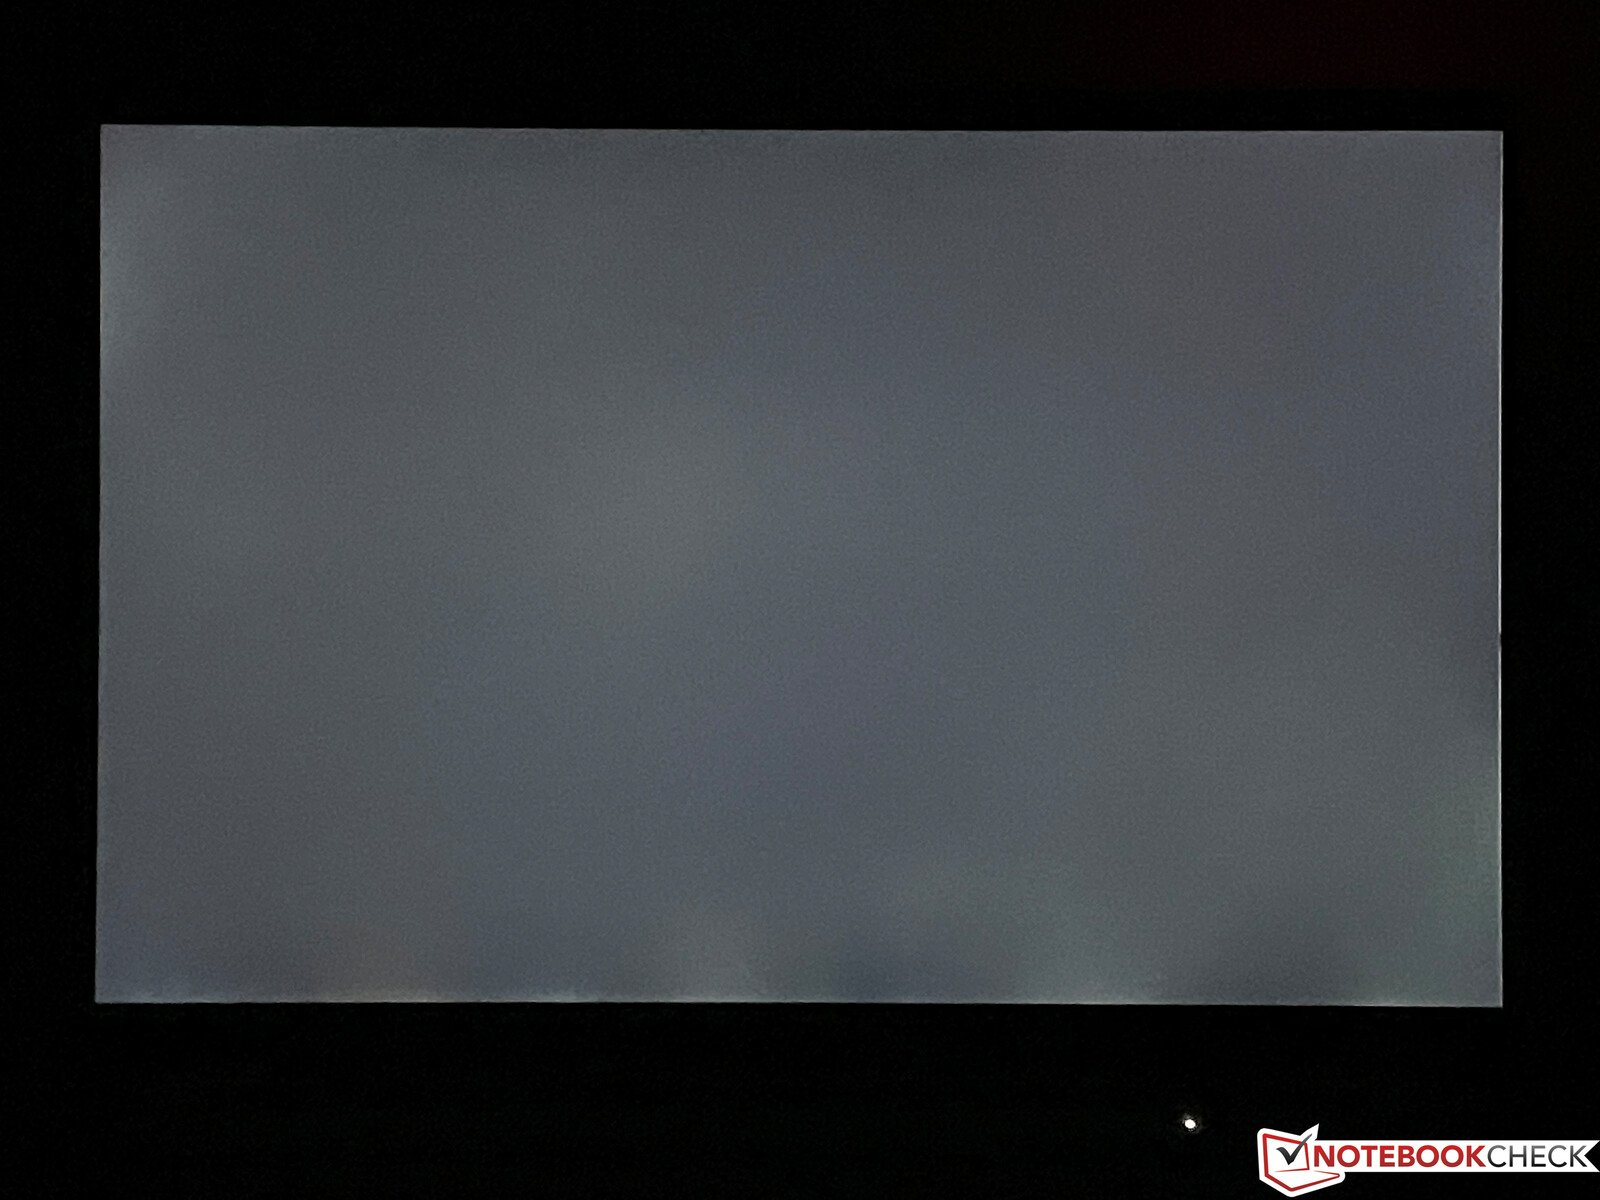
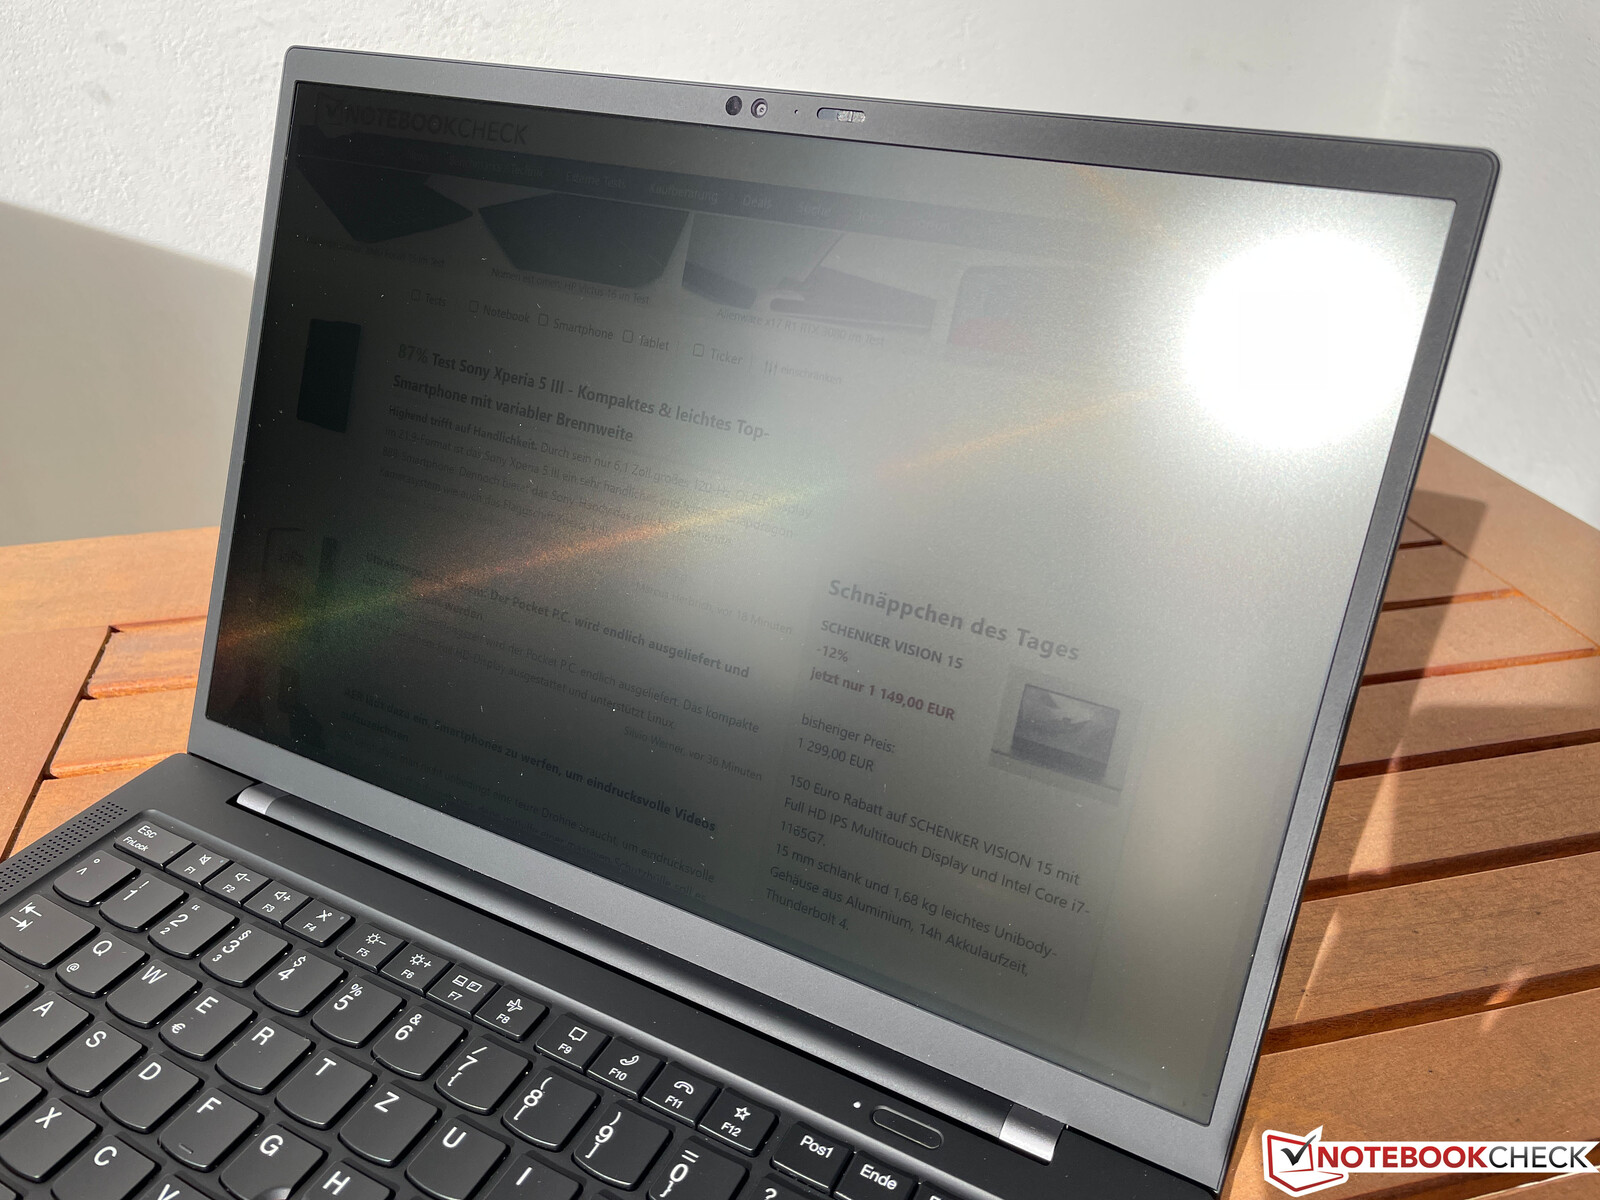
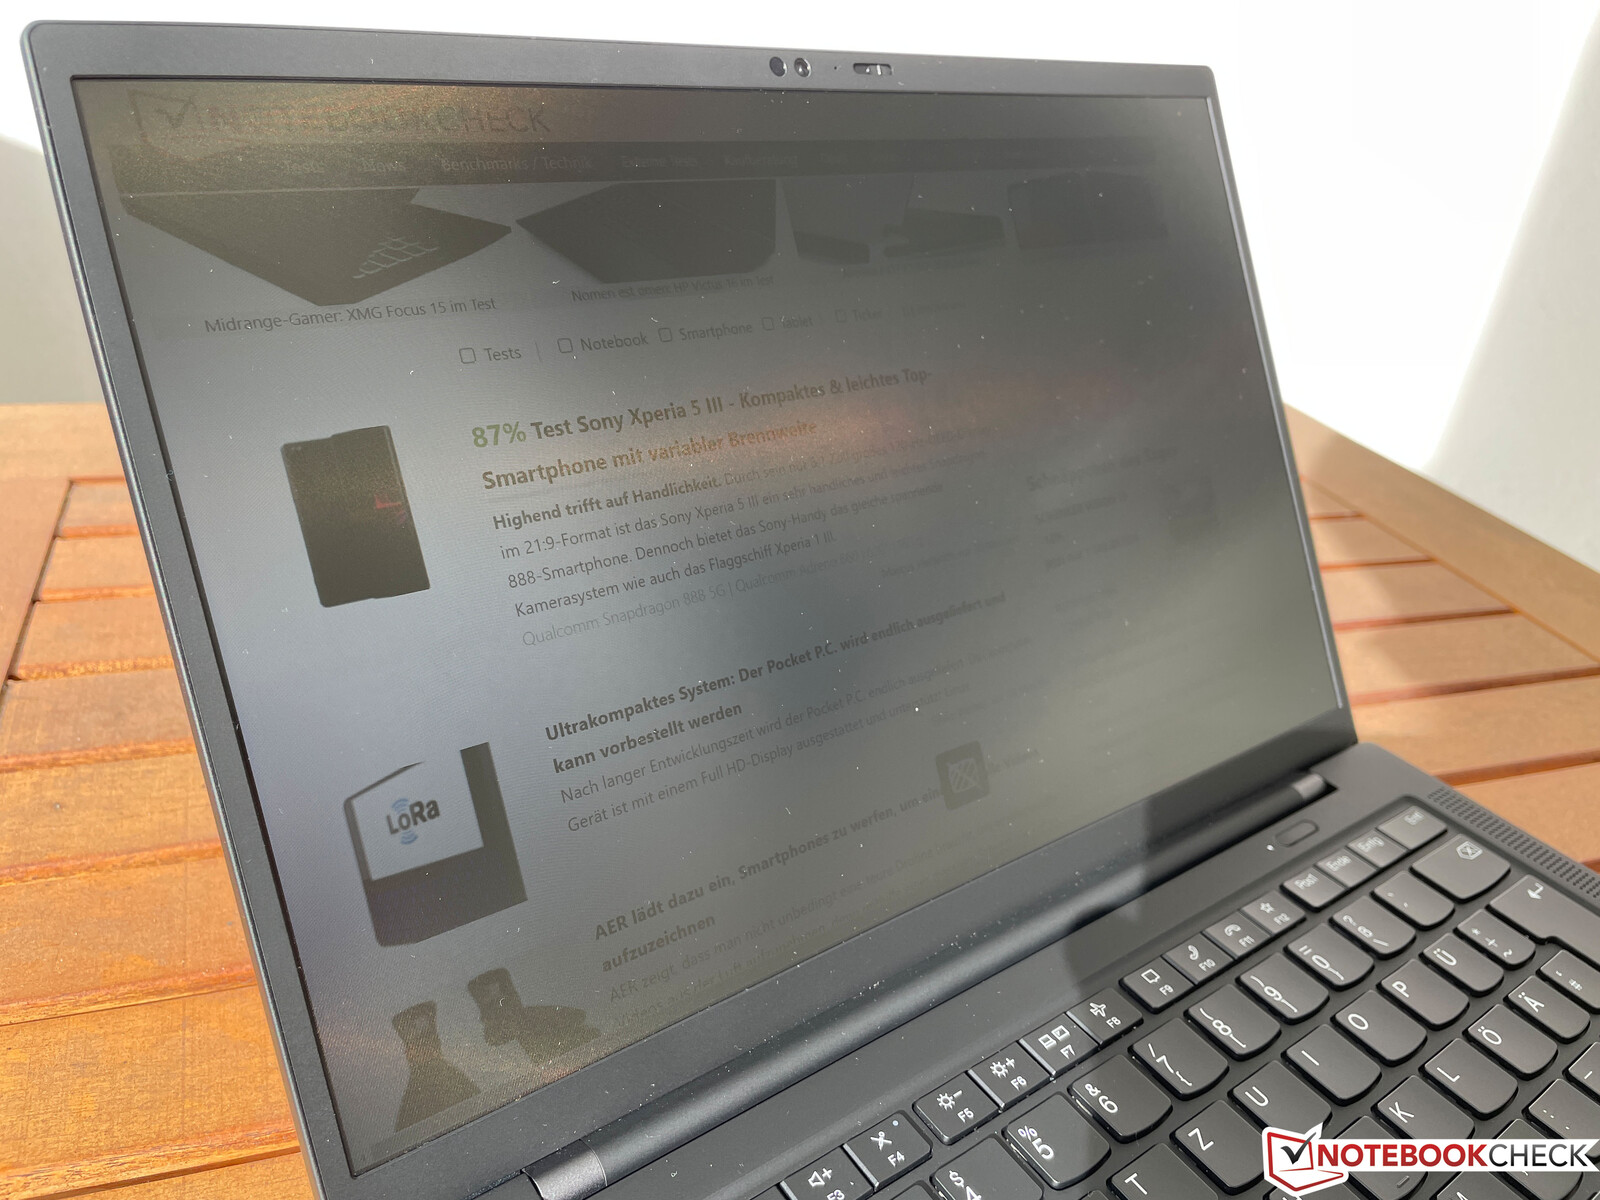
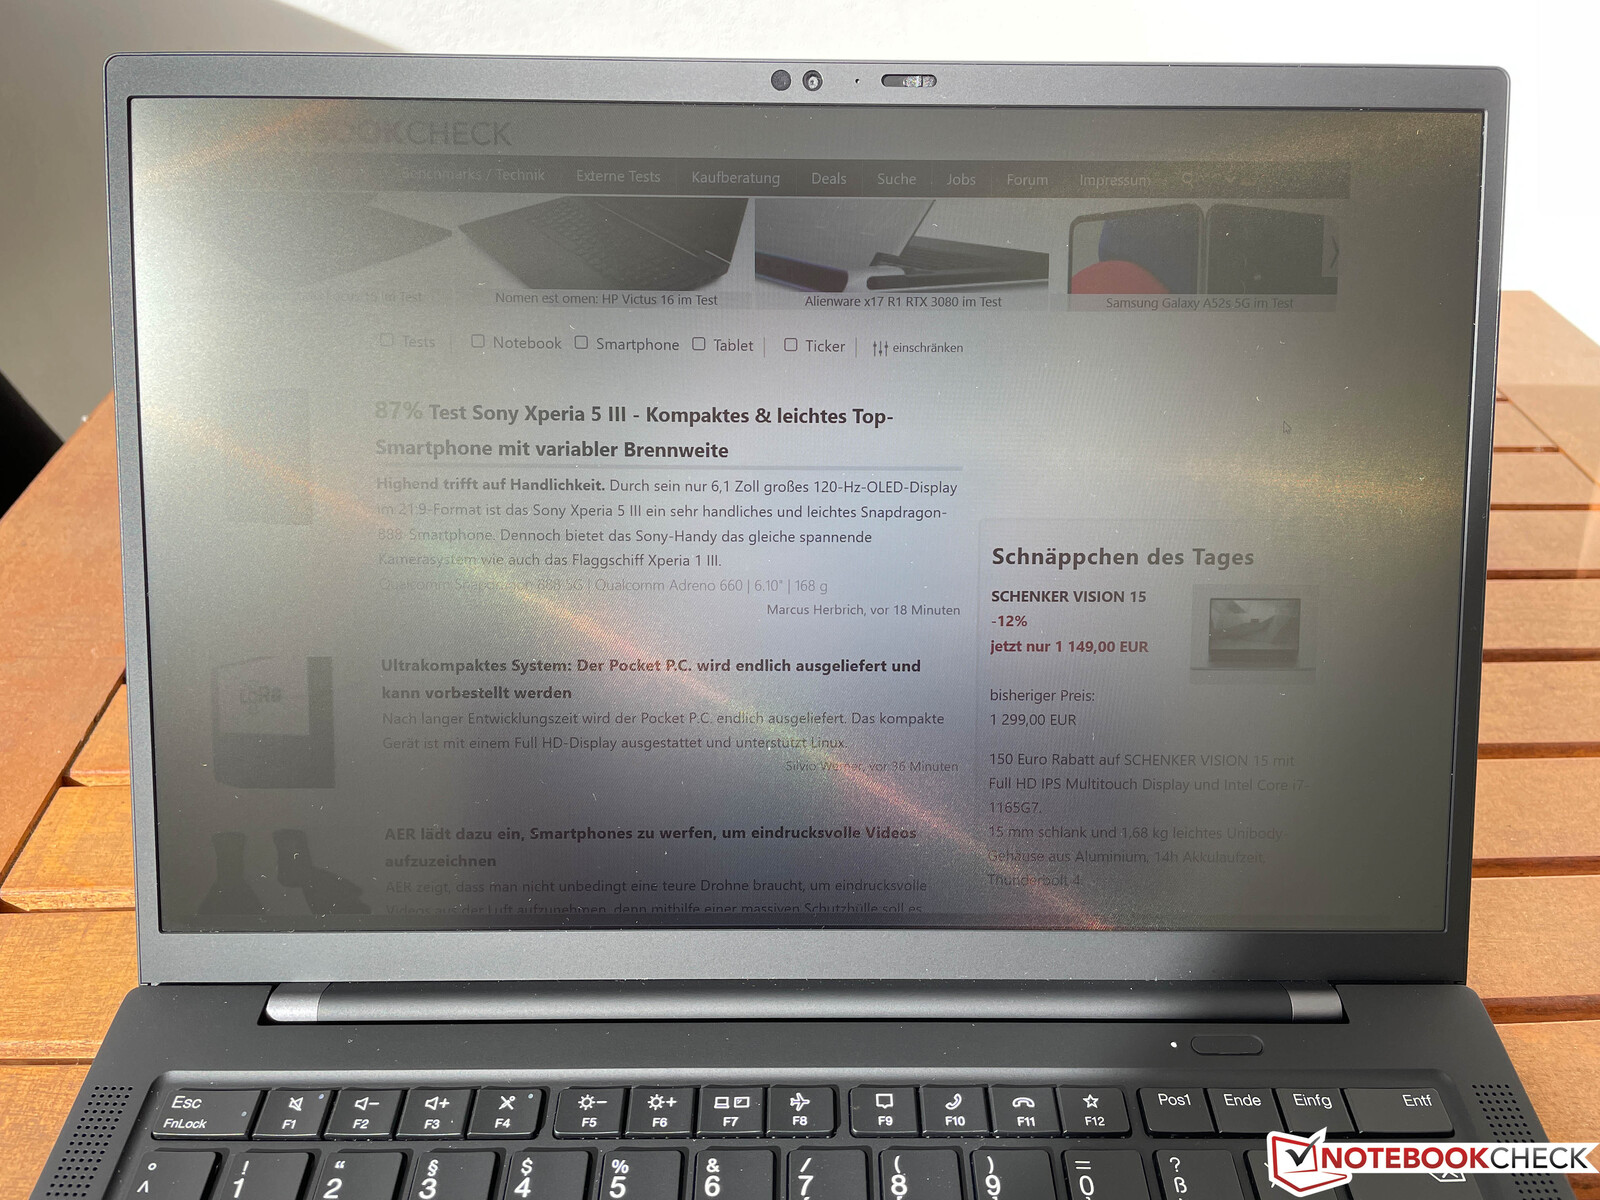
然而,在实践中,主观的画面印象要比这些比率所显示的差很多。由于ePrivacy过滤器的存在,在中心位置看显示器时,只有一个非常小的甜蜜点(即使ePrivacy被禁用)。即使有很小的偏差,对比度和亮度也会明显下降,几乎可以说是灰雾笼罩了整个画面。视角也比普通IPS显示器差很多。
启用和禁用隐私过滤器(Fn + D)之间的差异实际上也不是很大。联想在这里做了点手脚,在启用过滤器时,默认情况下将亮度降低到~160 cd/m²。然后你可以再次增加亮度,但隐私过滤器的效果实际上已经消失。现实上,它只在低亮度水平上带来所需的效果,这可能是个问题,特别是在旅途中。
我们无法确定PWM闪烁(即使启用了ePrivacy过滤器),但响应时间相当慢,在操作过程中你也可以看到重影,例如移动鼠标指针时。
| |||||||||||||||||||||||||
Brightness Distribution: 85 %
Center on Battery: 577 cd/m²
Contrast: 2400:1 (Black: 0.24 cd/m²)
ΔE ColorChecker Calman: 2.2 | ∀{0.5-29.43 Ø4.73}
calibrated: 1.4
ΔE Greyscale Calman: 2.8 | ∀{0.09-98 Ø4.97}
70% AdobeRGB 1998 (Argyll 3D)
98.6% sRGB (Argyll 3D)
69.3% Display P3 (Argyll 3D)
Gamma: 2.23
CCT: 6792 K
| Lenovo ThinkPad X1 Carbon G9-20XW0089GE LEB14201N, IPS, 1920x1200, 14" | HP EliteBook 840 Aero G8 3E4Q6AA AU Optronics AUO068B, IPS, 1920x1080, 14" | Lenovo ThinkPad X1 Carbon G9-20XWCTO1WW MNE007A1-2, IPS LED, 3840x2400, 14" | Schenker Vision 14 CSOT T3_MNE007ZA1_1, IPS, 2880x1800, 14" | Asus ExpertBook B9 B9400CE-KC0166R B140HAN06.B, IPS, 1920x1080, 14" | |
|---|---|---|---|---|---|
| Display | -1% | 22% | 6% | 1% | |
| Display P3 Coverage (%) | 69.3 | 68 -2% | 95.2 37% | 75.4 9% | 69.8 1% |
| sRGB Coverage (%) | 98.6 | 97.6 -1% | 99.8 1% | 99 0% | 98.8 0% |
| AdobeRGB 1998 Coverage (%) | 70 | 69.3 -1% | 89.2 27% | 76.4 9% | 71.3 2% |
| Response Times | 10% | 11% | 38% | -3% | |
| Response Time Grey 50% / Grey 80% * (ms) | 52.4 ? | 48 ? 8% | 46 ? 12% | 32.8 ? 37% | 60 ? -15% |
| Response Time Black / White * (ms) | 32.8 ? | 28.8 ? 12% | 30 ? 9% | 20.4 ? 38% | 29.6 ? 10% |
| PWM Frequency (Hz) | |||||
| Screen | -27% | 9% | -22% | -5% | |
| Brightness middle (cd/m²) | 576 | 466.4 -19% | 497 -14% | 390 -32% | 437 -24% |
| Brightness (cd/m²) | 541 | 426 -21% | 488 -10% | 387 -28% | 421 -22% |
| Brightness Distribution (%) | 85 | 84 -1% | 87 2% | 94 11% | 87 2% |
| Black Level * (cd/m²) | 0.24 | 0.32 -33% | 0.35 -46% | 0.29 -21% | 0.29 -21% |
| Contrast (:1) | 2400 | 1458 -39% | 1420 -41% | 1345 -44% | 1507 -37% |
| Colorchecker dE 2000 * | 2.2 | 2.84 -29% | 1.2 45% | 2.8 -27% | 1.8 18% |
| Colorchecker dE 2000 max. * | 4.3 | 4.73 -10% | 2.1 51% | 4.4 -2% | 3.5 19% |
| Colorchecker dE 2000 calibrated * | 1.4 | 2.27 -62% | 0.9 36% | 1.8 -29% | 1.4 -0% |
| Greyscale dE 2000 * | 2.8 | 3.7 -32% | 1.3 54% | 3.5 -25% | 2.3 18% |
| Gamma | 2.23 99% | 2.13 103% | 2.16 102% | 2.24 98% | 2.18 101% |
| CCT | 6792 96% | 6886 94% | 6690 97% | 6174 105% | 6782 96% |
| Color Space (Percent of AdobeRGB 1998) (%) | 79.37 | 76.4 | 65.4 | ||
| Color Space (Percent of sRGB) (%) | 99.78 | 99 | 98.7 | ||
| Total Average (Program / Settings) | -6% /
-16% | 14% /
12% | 7% /
-7% | -2% /
-4% |
* ... smaller is better
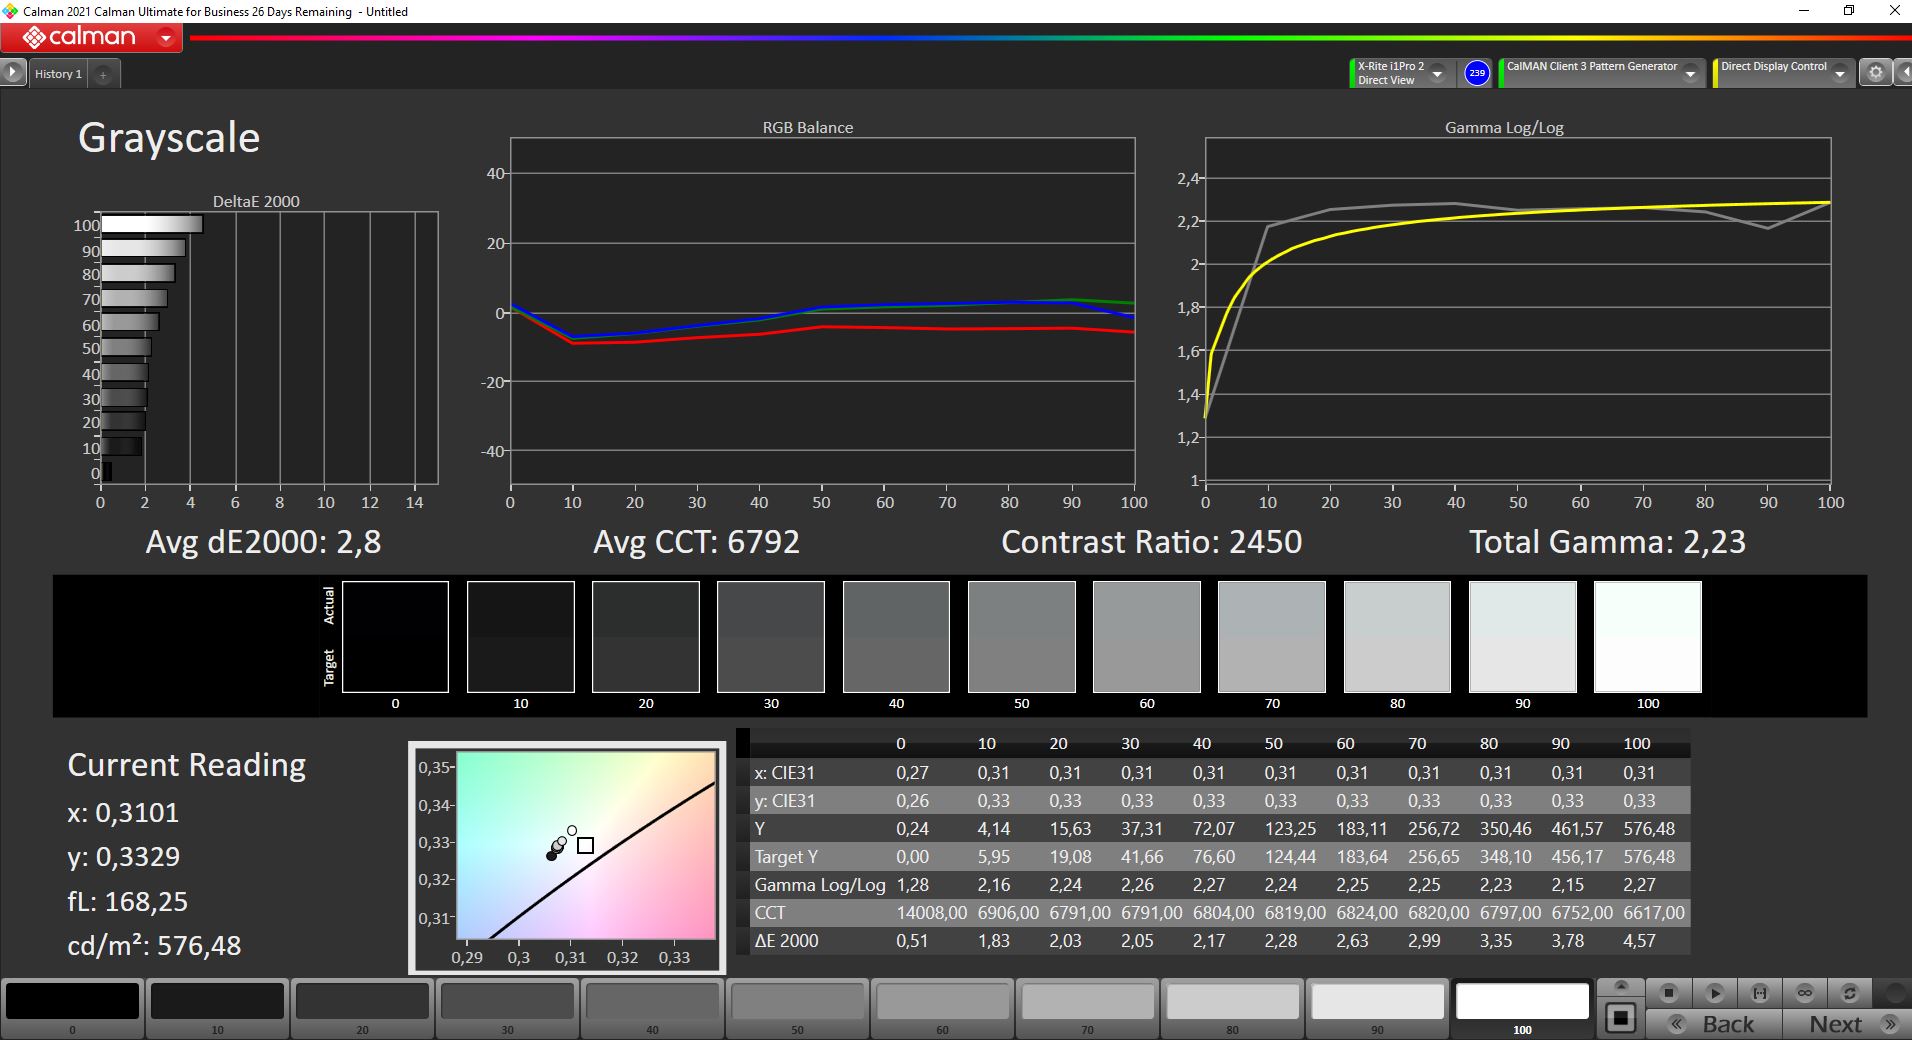
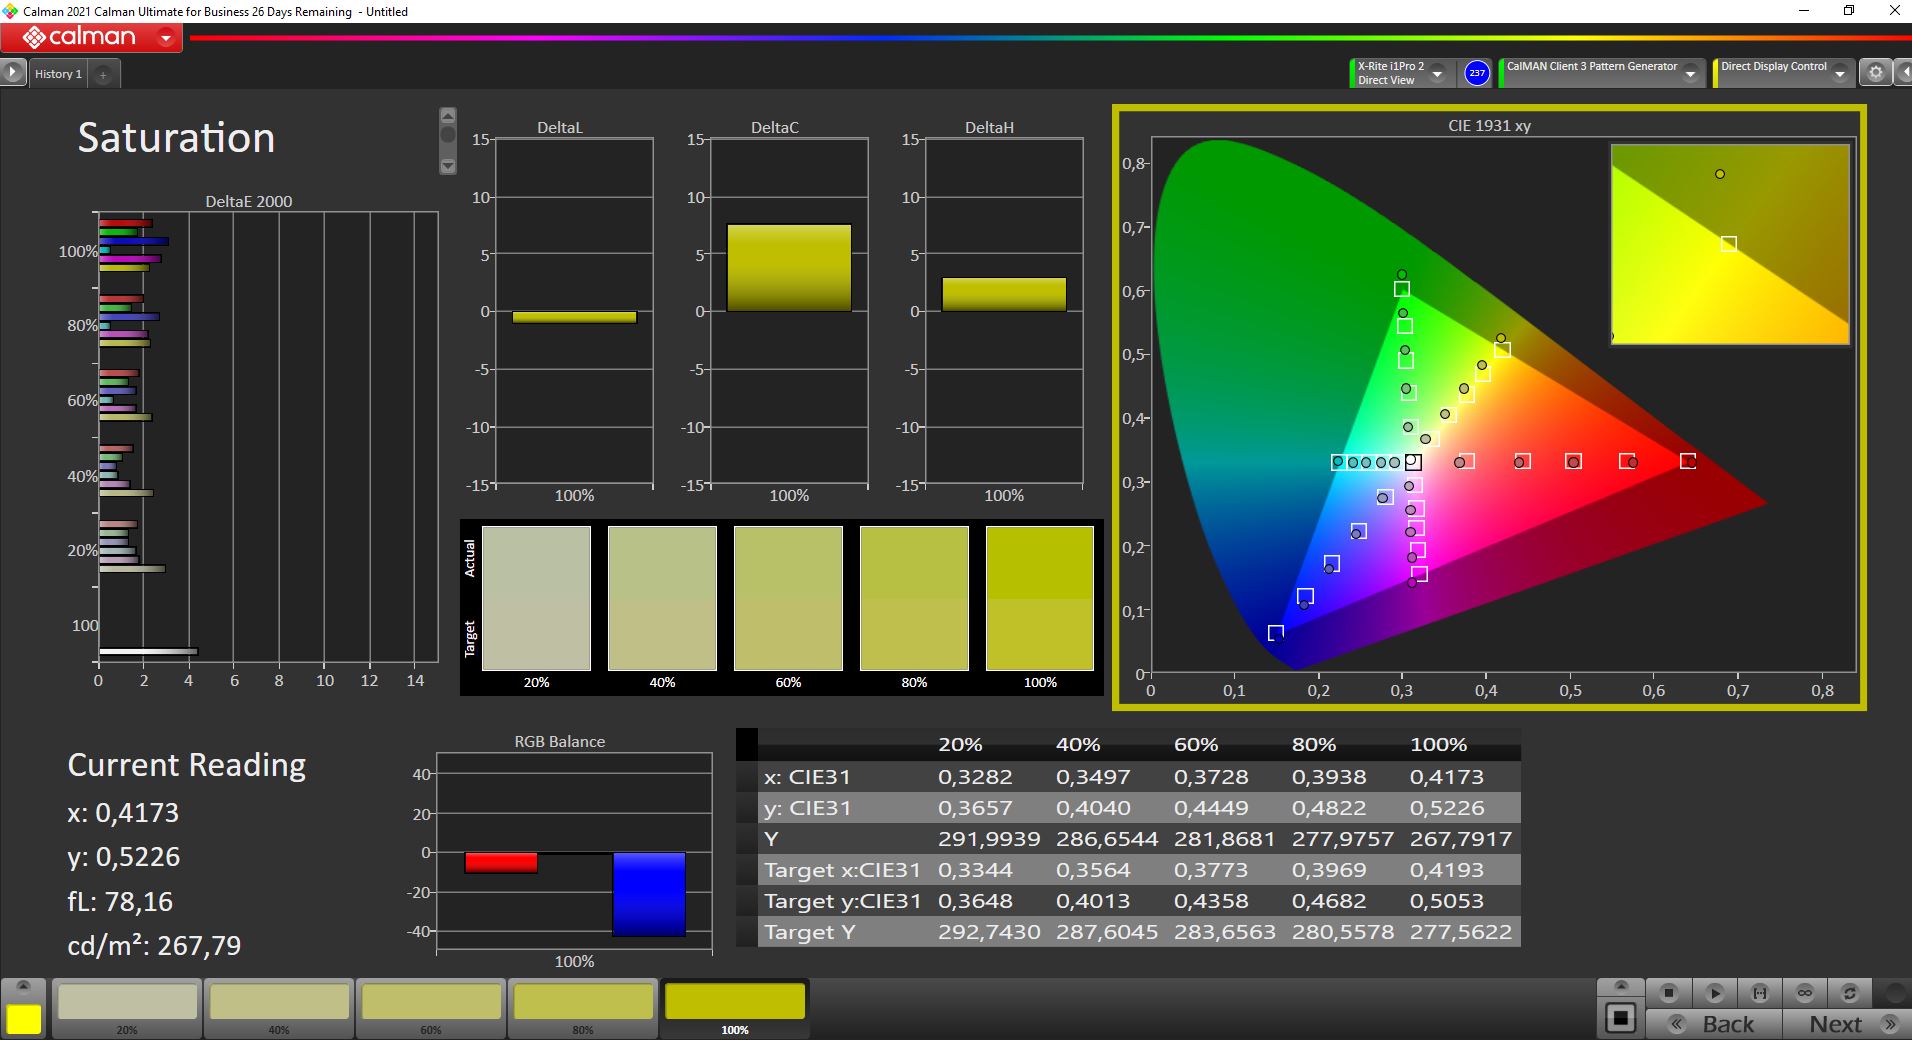
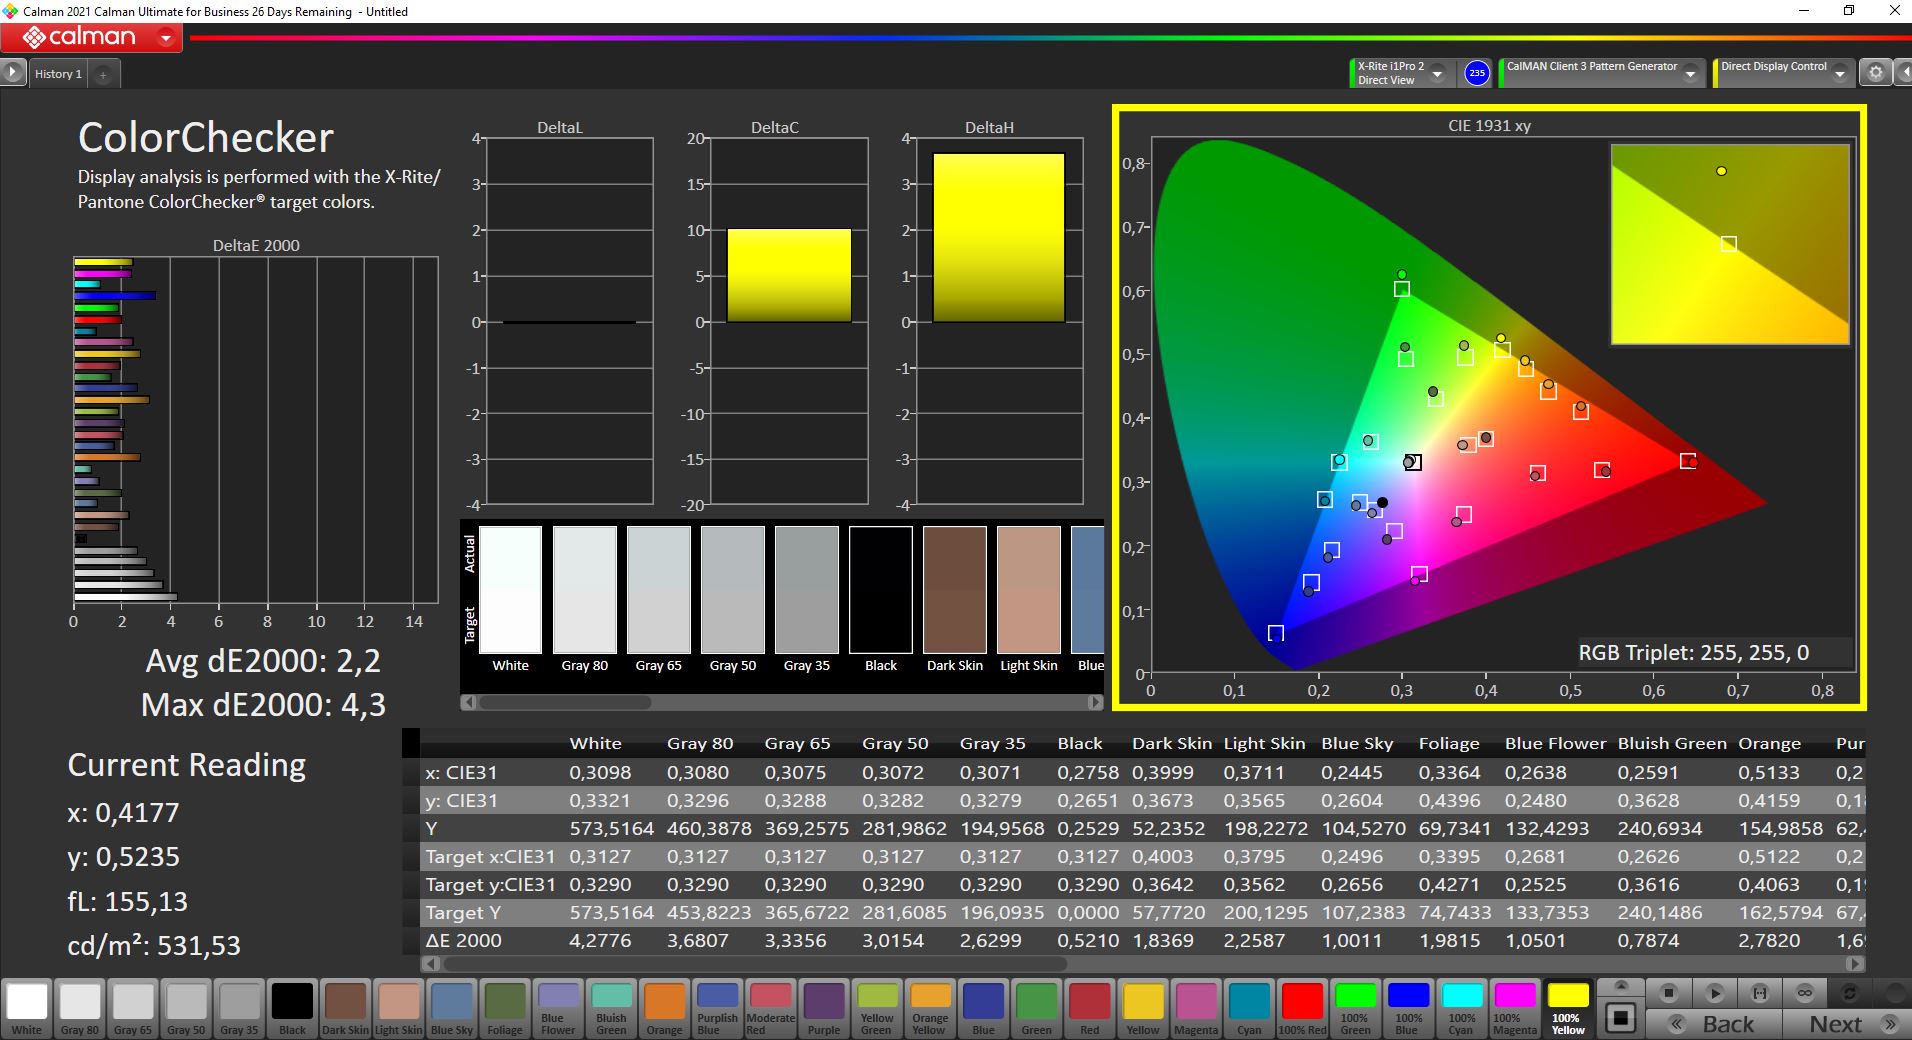

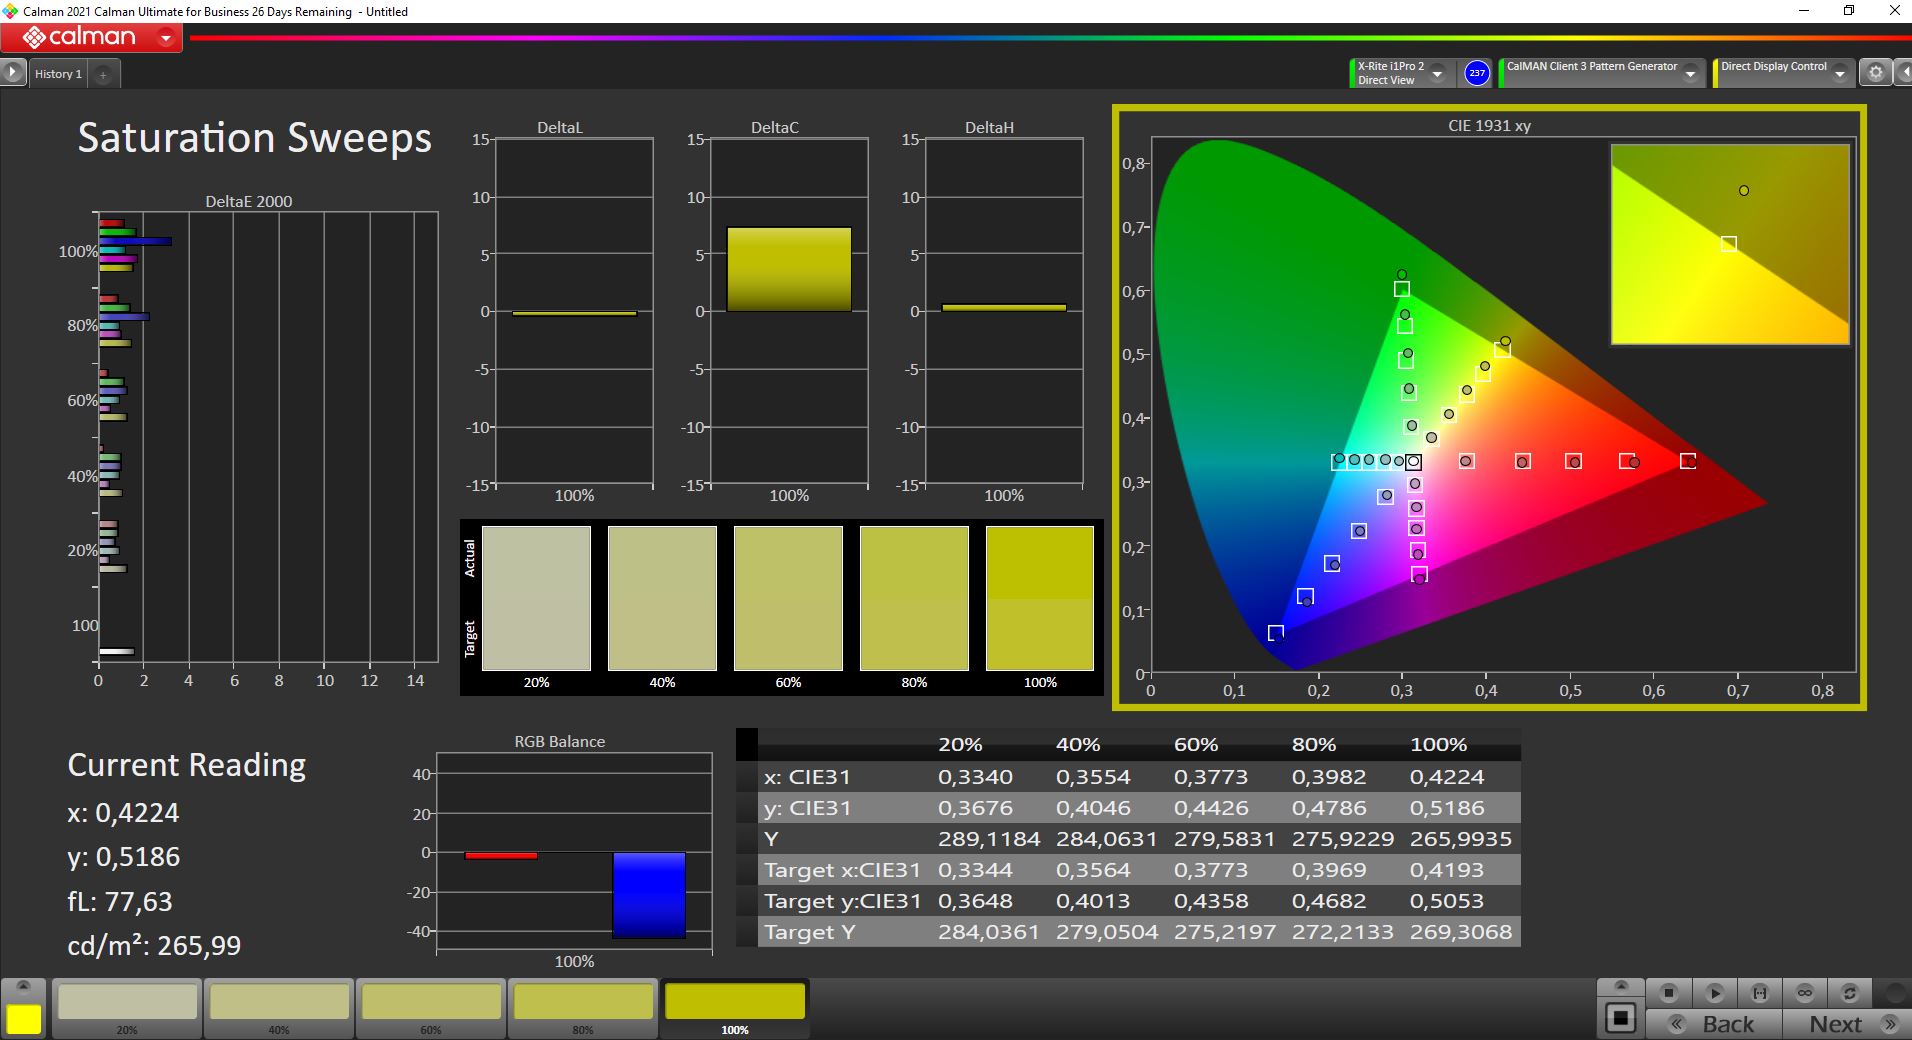

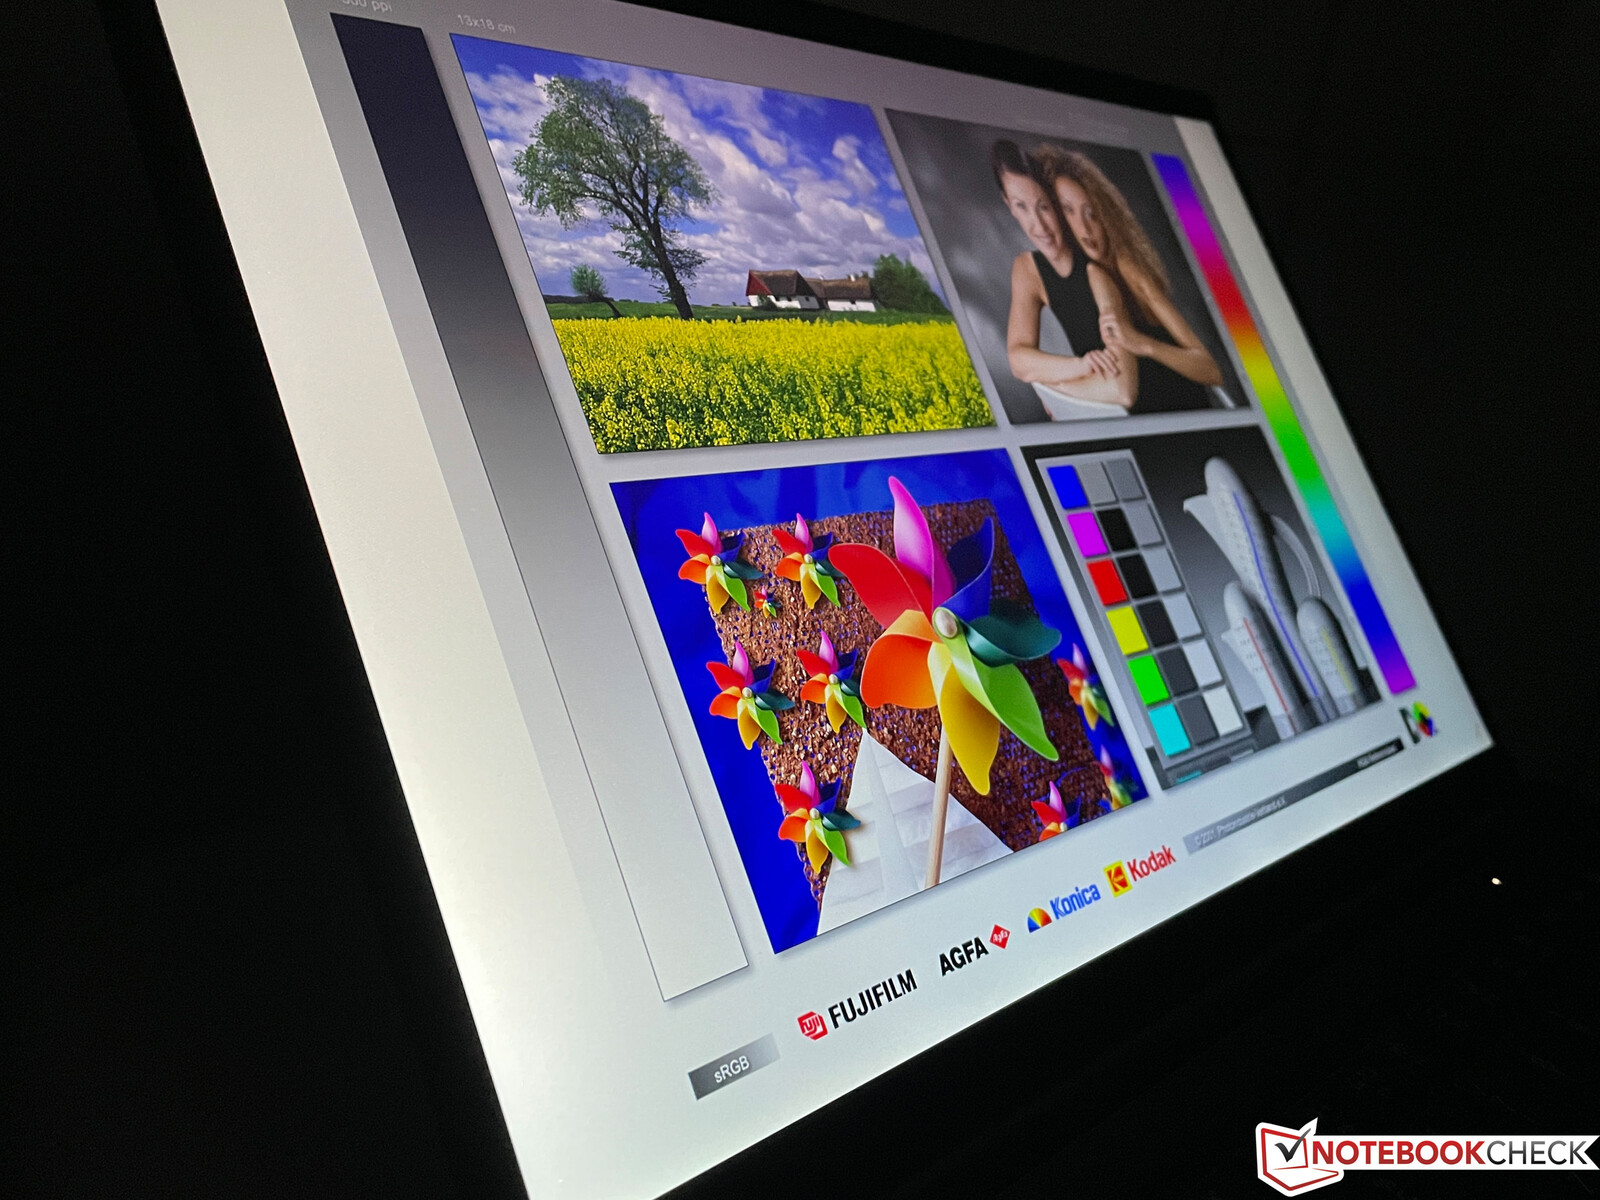
显示屏在出厂前已经被校准得相当好,即使启用了电子隐私过滤器,读数也不会恶化。灰度确实显示出轻微的偏色(绿色/蓝色),但这在实践中几乎不可见。通过我们的校准(上面有免费下载的配置文件),我们可以进一步提高数值,由于几乎完全覆盖sRGB,该面板也适合编辑图片/视频。
Display Response Times
| ↔ Response Time Black to White | ||
|---|---|---|
| 32.8 ms ... rise ↗ and fall ↘ combined | ↗ 16.4 ms rise | 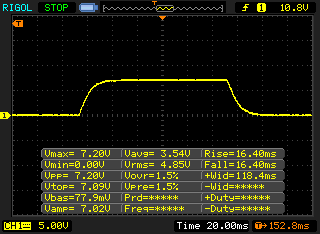 |
| ↘ 16.4 ms fall | ||
| The screen shows slow response rates in our tests and will be unsatisfactory for gamers. In comparison, all tested devices range from 0.1 (minimum) to 240 (maximum) ms. » 88 % of all devices are better. This means that the measured response time is worse than the average of all tested devices (19.9 ms). | ||
| ↔ Response Time 50% Grey to 80% Grey | ||
| 52.4 ms ... rise ↗ and fall ↘ combined | ↗ 24.8 ms rise | 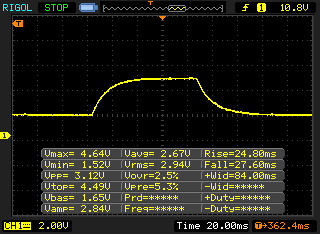 |
| ↘ 27.6 ms fall | ||
| The screen shows slow response rates in our tests and will be unsatisfactory for gamers. In comparison, all tested devices range from 0.165 (minimum) to 636 (maximum) ms. » 89 % of all devices are better. This means that the measured response time is worse than the average of all tested devices (31.1 ms). | ||
Screen Flickering / PWM (Pulse-Width Modulation)
| Screen flickering / PWM not detected | 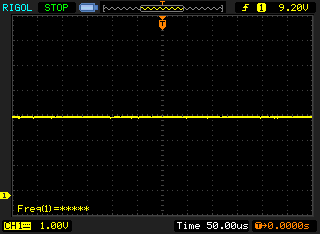 | ||
In comparison: 52 % of all tested devices do not use PWM to dim the display. If PWM was detected, an average of 7798 (minimum: 5 - maximum: 343500) Hz was measured. | |||
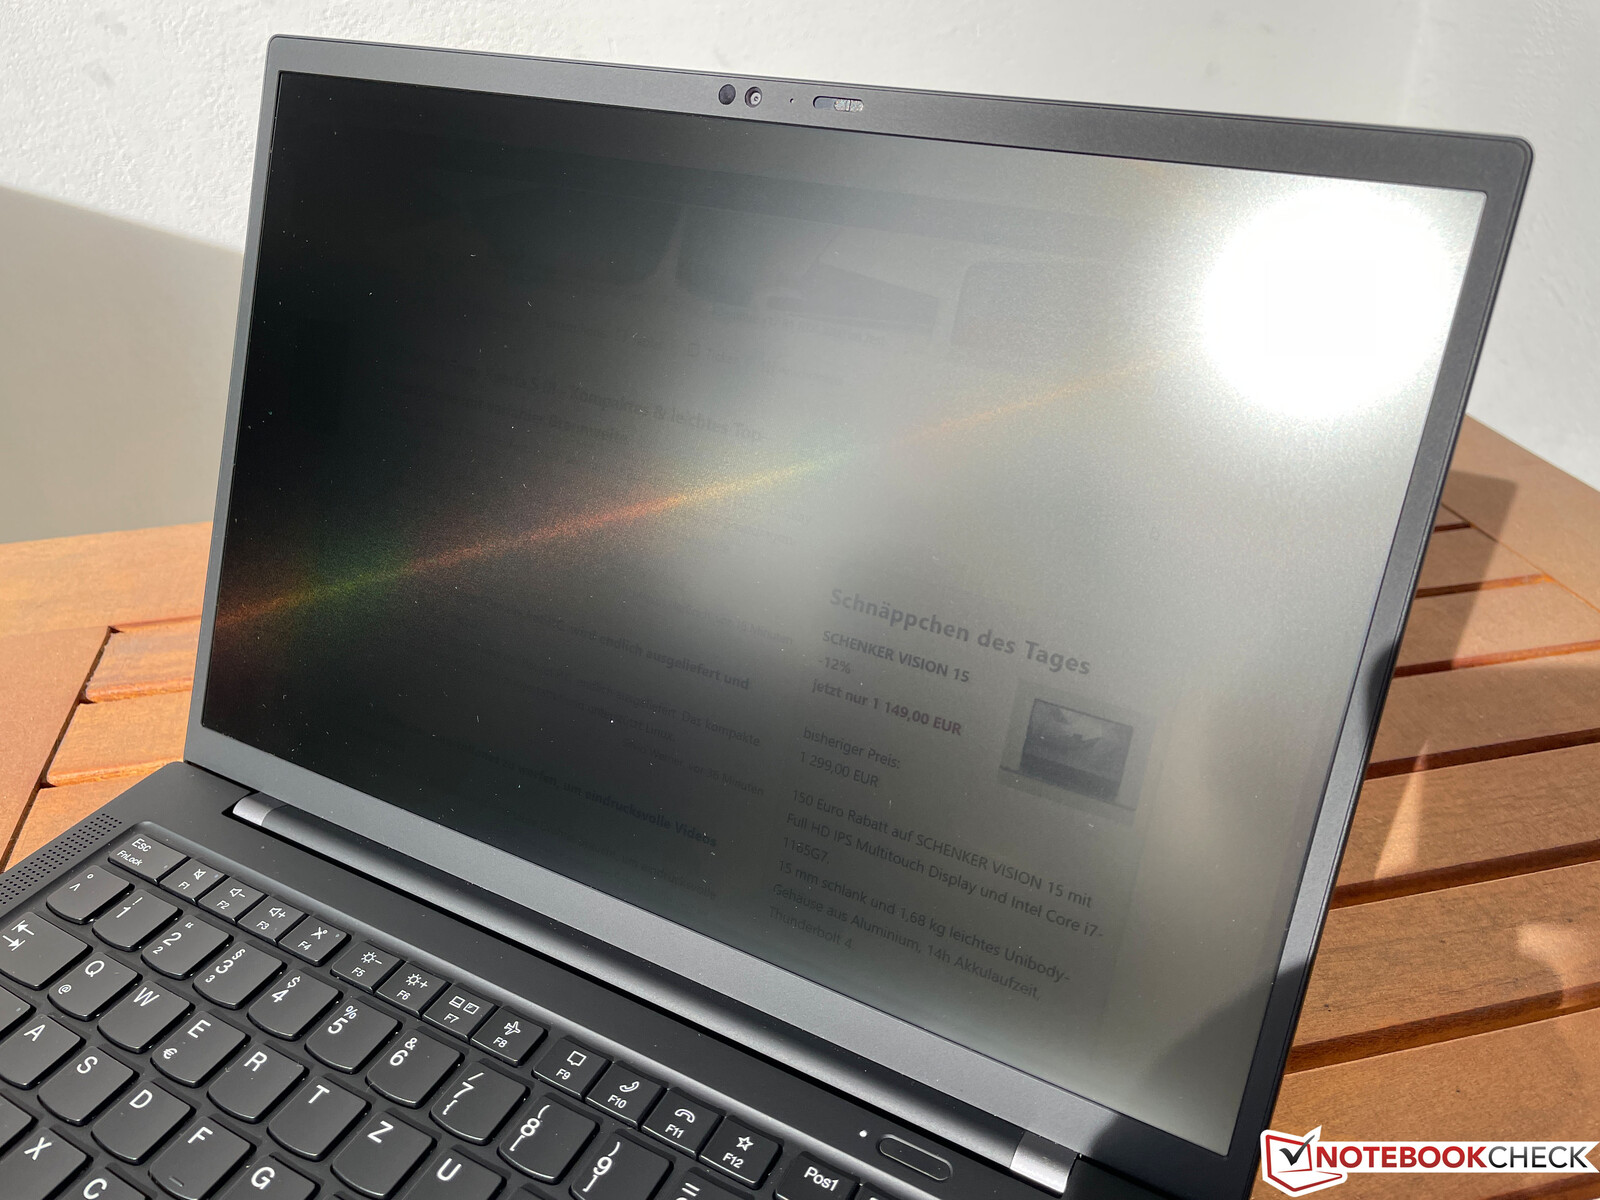
尽管有哑光的表面和高的最大亮度,但隐私过滤器明显地限制了户外使用性。在可视角度的稳定性方面,你也很快看到亮度和对比度的下降。
性能和排放
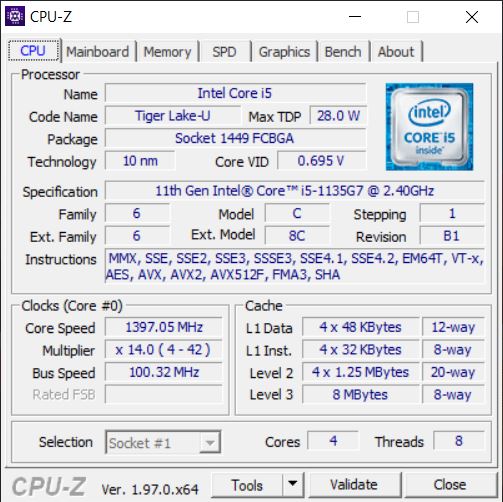
目前ThinkPad X1 Carbon G9的CPU性能非常好,而 酷睿i5-1135G7由于高TDP限制,也能很好地跟上实际上更快的i7型号。几分钟后,功耗稳定在27瓦左右,这是一个好结果。
然而,在此之前,CPU的性能已经很好了,但我们可以看到在综合负载下,性能下降很厉害。联想现在已经通过BIOS的更新掌握了这一点,从下图中也可以清楚地看到这一点。 Witcher 3图中可以清楚地看到。然而,联想让它自己变得相当容易,在CPU/iGPU联合负载下的性能很快就限制在15瓦。
我们还注意到,现在的风扇曲线工作得更积极了。即使在日常工作中,也经常可以听到安静的嘶嘶声,在更多的负载下(甚至在游戏时),冷却很快就达到了最大的40.9 dB(A),这使得它的声音明显高于 第一个测试设备的酷睿i7.
Cinebench R15 Multi Endurance test
Cinebench R23: Multi Core | Single Core
Cinebench R20: CPU (Multi Core) | CPU (Single Core)
Cinebench R15: CPU Multi 64Bit | CPU Single 64Bit
Blender: v2.79 BMW27 CPU
7-Zip 18.03: 7z b 4 | 7z b 4 -mmt1
Geekbench 5.5: Multi-Core | Single-Core
HWBOT x265 Benchmark v2.2: 4k Preset
LibreOffice : 20 Documents To PDF
R Benchmark 2.5: Overall mean
| CPU Performance rating | |
| Average of class Subnotebook | |
| Schenker Vision 14 | |
| Lenovo ThinkPad X1 Carbon G9-20XWCTO1WW | |
| Asus ExpertBook B9 B9400CE-KC0166R | |
| Lenovo ThinkPad X1 Carbon G9-20XW0089GE | |
| HP EliteBook 840 Aero G8 3E4Q6AA -2! | |
| Average Intel Core i5-1135G7 | |
| Cinebench R23 / Multi Core | |
| Average of class Subnotebook (1555 - 21812, n=62, last 2 years) | |
| Schenker Vision 14 | |
| Lenovo ThinkPad X1 Carbon G9-20XWCTO1WW | |
| Lenovo ThinkPad X1 Carbon G9-20XW0089GE | |
| HP EliteBook 840 Aero G8 3E4Q6AA | |
| Average Intel Core i5-1135G7 (2786 - 6136, n=55) | |
| Asus ExpertBook B9 B9400CE-KC0166R | |
| Cinebench R23 / Single Core | |
| Average of class Subnotebook (358 - 2213, n=63, last 2 years) | |
| Schenker Vision 14 | |
| Lenovo ThinkPad X1 Carbon G9-20XWCTO1WW | |
| HP EliteBook 840 Aero G8 3E4Q6AA | |
| Asus ExpertBook B9 B9400CE-KC0166R | |
| Lenovo ThinkPad X1 Carbon G9-20XW0089GE | |
| Average Intel Core i5-1135G7 (1062 - 1373, n=53) | |
| Cinebench R20 / CPU (Multi Core) | |
| Average of class Subnotebook (579 - 8541, n=59, last 2 years) | |
| Schenker Vision 14 | |
| Asus ExpertBook B9 B9400CE-KC0166R | |
| Lenovo ThinkPad X1 Carbon G9-20XWCTO1WW | |
| Lenovo ThinkPad X1 Carbon G9-20XW0089GE | |
| Average Intel Core i5-1135G7 (979 - 2382, n=62) | |
| HP EliteBook 840 Aero G8 3E4Q6AA | |
| Cinebench R20 / CPU (Single Core) | |
| Average of class Subnotebook (128 - 832, n=59, last 2 years) | |
| Schenker Vision 14 | |
| Lenovo ThinkPad X1 Carbon G9-20XWCTO1WW | |
| Asus ExpertBook B9 B9400CE-KC0166R | |
| Lenovo ThinkPad X1 Carbon G9-20XW0089GE | |
| Average Intel Core i5-1135G7 (375 - 527, n=62) | |
| HP EliteBook 840 Aero G8 3E4Q6AA | |
| Cinebench R15 / CPU Multi 64Bit | |
| Average of class Subnotebook (327 - 3345, n=59, last 2 years) | |
| Schenker Vision 14 | |
| Asus ExpertBook B9 B9400CE-KC0166R | |
| Lenovo ThinkPad X1 Carbon G9-20XW0089GE | |
| Lenovo ThinkPad X1 Carbon G9-20XWCTO1WW | |
| Average Intel Core i5-1135G7 (431 - 941, n=65) | |
| HP EliteBook 840 Aero G8 3E4Q6AA | |
| Cinebench R15 / CPU Single 64Bit | |
| Average of class Subnotebook (72.4 - 322, n=59, last 2 years) | |
| Schenker Vision 14 | |
| Asus ExpertBook B9 B9400CE-KC0166R | |
| Lenovo ThinkPad X1 Carbon G9-20XWCTO1WW | |
| HP EliteBook 840 Aero G8 3E4Q6AA | |
| Lenovo ThinkPad X1 Carbon G9-20XW0089GE | |
| Average Intel Core i5-1135G7 (141.4 - 205, n=61) | |
| Blender / v2.79 BMW27 CPU | |
| Average Intel Core i5-1135G7 (499 - 1044, n=60) | |
| HP EliteBook 840 Aero G8 3E4Q6AA | |
| Lenovo ThinkPad X1 Carbon G9-20XW0089GE | |
| Lenovo ThinkPad X1 Carbon G9-20XWCTO1WW | |
| Asus ExpertBook B9 B9400CE-KC0166R | |
| Schenker Vision 14 | |
| Average of class Subnotebook (159 - 2271, n=60, last 2 years) | |
| 7-Zip 18.03 / 7z b 4 | |
| Average of class Subnotebook (11668 - 77867, n=59, last 2 years) | |
| Schenker Vision 14 | |
| Asus ExpertBook B9 B9400CE-KC0166R | |
| Lenovo ThinkPad X1 Carbon G9-20XWCTO1WW | |
| Lenovo ThinkPad X1 Carbon G9-20XW0089GE | |
| HP EliteBook 840 Aero G8 3E4Q6AA | |
| Average Intel Core i5-1135G7 (14745 - 24873, n=62) | |
| 7-Zip 18.03 / 7z b 4 -mmt1 | |
| Average of class Subnotebook (2643 - 6699, n=61, last 2 years) | |
| Schenker Vision 14 | |
| HP EliteBook 840 Aero G8 3E4Q6AA | |
| Asus ExpertBook B9 B9400CE-KC0166R | |
| Lenovo ThinkPad X1 Carbon G9-20XWCTO1WW | |
| Average Intel Core i5-1135G7 (3924 - 4921, n=62) | |
| Lenovo ThinkPad X1 Carbon G9-20XW0089GE | |
| Geekbench 5.5 / Multi-Core | |
| Average of class Subnotebook (2557 - 17218, n=50, last 2 years) | |
| Lenovo ThinkPad X1 Carbon G9-20XWCTO1WW | |
| Schenker Vision 14 | |
| Lenovo ThinkPad X1 Carbon G9-20XW0089GE | |
| Asus ExpertBook B9 B9400CE-KC0166R | |
| Average Intel Core i5-1135G7 (3475 - 5472, n=58) | |
| Geekbench 5.5 / Single-Core | |
| Average of class Subnotebook (726 - 2224, n=50, last 2 years) | |
| Schenker Vision 14 | |
| Lenovo ThinkPad X1 Carbon G9-20XWCTO1WW | |
| Asus ExpertBook B9 B9400CE-KC0166R | |
| Average Intel Core i5-1135G7 (1147 - 1428, n=58) | |
| Lenovo ThinkPad X1 Carbon G9-20XW0089GE | |
| HWBOT x265 Benchmark v2.2 / 4k Preset | |
| Average of class Subnotebook (0.97 - 25.1, n=59, last 2 years) | |
| Schenker Vision 14 | |
| Asus ExpertBook B9 B9400CE-KC0166R | |
| HP EliteBook 840 Aero G8 3E4Q6AA | |
| Lenovo ThinkPad X1 Carbon G9-20XWCTO1WW | |
| Lenovo ThinkPad X1 Carbon G9-20XW0089GE | |
| Average Intel Core i5-1135G7 (3.57 - 7.6, n=57) | |
| LibreOffice / 20 Documents To PDF | |
| Average of class Subnotebook (39.9 - 220, n=58, last 2 years) | |
| HP EliteBook 840 Aero G8 3E4Q6AA | |
| Average Intel Core i5-1135G7 (44.2 - 62.9, n=60) | |
| Lenovo ThinkPad X1 Carbon G9-20XW0089GE | |
| Asus ExpertBook B9 B9400CE-KC0166R | |
| Schenker Vision 14 | |
| Lenovo ThinkPad X1 Carbon G9-20XWCTO1WW | |
| R Benchmark 2.5 / Overall mean | |
| Lenovo ThinkPad X1 Carbon G9-20XW0089GE | |
| Average Intel Core i5-1135G7 (0.619 - 0.727, n=59) | |
| Lenovo ThinkPad X1 Carbon G9-20XWCTO1WW | |
| Asus ExpertBook B9 B9400CE-KC0166R | |
| HP EliteBook 840 Aero G8 3E4Q6AA | |
| Schenker Vision 14 | |
| Average of class Subnotebook (0.4024 - 1.456, n=60, last 2 years) | |
* ... smaller is better
AIDA64: FP32 Ray-Trace | FPU Julia | CPU SHA3 | CPU Queen | FPU SinJulia | FPU Mandel | CPU AES | CPU ZLib | FP64 Ray-Trace | CPU PhotoWorxx
| Performance rating | |
| Average of class Subnotebook | |
| Schenker Vision 14 | |
| Asus ExpertBook B9 B9400CE-KC0166R | |
| Lenovo ThinkPad X1 Carbon G9-20XWCTO1WW | |
| Lenovo ThinkPad X1 Carbon G9-20XW0089GE | |
| HP EliteBook 840 Aero G8 3E4Q6AA | |
| Average Intel Core i5-1135G7 | |
| AIDA64 / FP32 Ray-Trace | |
| Average of class Subnotebook (1135 - 32888, n=60, last 2 years) | |
| Schenker Vision 14 | |
| Lenovo ThinkPad X1 Carbon G9-20XWCTO1WW | |
| Lenovo ThinkPad X1 Carbon G9-20XW0089GE | |
| Asus ExpertBook B9 B9400CE-KC0166R | |
| Average Intel Core i5-1135G7 (4313 - 7952, n=45) | |
| HP EliteBook 840 Aero G8 3E4Q6AA | |
| AIDA64 / FPU Julia | |
| Average of class Subnotebook (5218 - 123315, n=60, last 2 years) | |
| Schenker Vision 14 | |
| Lenovo ThinkPad X1 Carbon G9-20XWCTO1WW | |
| Asus ExpertBook B9 B9400CE-KC0166R | |
| Lenovo ThinkPad X1 Carbon G9-20XW0089GE | |
| Average Intel Core i5-1135G7 (19402 - 32283, n=45) | |
| HP EliteBook 840 Aero G8 3E4Q6AA | |
| AIDA64 / CPU SHA3 | |
| Average of class Subnotebook (444 - 5287, n=60, last 2 years) | |
| Schenker Vision 14 | |
| Lenovo ThinkPad X1 Carbon G9-20XWCTO1WW | |
| Asus ExpertBook B9 B9400CE-KC0166R | |
| Lenovo ThinkPad X1 Carbon G9-20XW0089GE | |
| Average Intel Core i5-1135G7 (1316 - 2172, n=45) | |
| HP EliteBook 840 Aero G8 3E4Q6AA | |
| AIDA64 / CPU Queen | |
| Average of class Subnotebook (10579 - 95002, n=53, last 2 years) | |
| HP EliteBook 840 Aero G8 3E4Q6AA | |
| Schenker Vision 14 | |
| Lenovo ThinkPad X1 Carbon G9-20XWCTO1WW | |
| Asus ExpertBook B9 B9400CE-KC0166R | |
| Lenovo ThinkPad X1 Carbon G9-20XW0089GE | |
| Average Intel Core i5-1135G7 (39000 - 46951, n=45) | |
| AIDA64 / FPU SinJulia | |
| Average of class Subnotebook (744 - 18418, n=60, last 2 years) | |
| Schenker Vision 14 | |
| Lenovo ThinkPad X1 Carbon G9-20XWCTO1WW | |
| Asus ExpertBook B9 B9400CE-KC0166R | |
| Lenovo ThinkPad X1 Carbon G9-20XW0089GE | |
| HP EliteBook 840 Aero G8 3E4Q6AA | |
| Average Intel Core i5-1135G7 (3497 - 4445, n=45) | |
| AIDA64 / FPU Mandel | |
| Average of class Subnotebook (3341 - 65433, n=60, last 2 years) | |
| Schenker Vision 14 | |
| Lenovo ThinkPad X1 Carbon G9-20XWCTO1WW | |
| Asus ExpertBook B9 B9400CE-KC0166R | |
| Lenovo ThinkPad X1 Carbon G9-20XW0089GE | |
| Average Intel Core i5-1135G7 (12569 - 19635, n=45) | |
| HP EliteBook 840 Aero G8 3E4Q6AA | |
| AIDA64 / CPU AES | |
| Schenker Vision 14 | |
| Lenovo ThinkPad X1 Carbon G9-20XWCTO1WW | |
| Lenovo ThinkPad X1 Carbon G9-20XW0089GE | |
| Asus ExpertBook B9 B9400CE-KC0166R | |
| HP EliteBook 840 Aero G8 3E4Q6AA | |
| Average Intel Core i5-1135G7 (28988 - 67977, n=45) | |
| Average of class Subnotebook (638 - 96917, n=60, last 2 years) | |
| AIDA64 / CPU ZLib | |
| Average of class Subnotebook (164.9 - 1379, n=60, last 2 years) | |
| Schenker Vision 14 | |
| Lenovo ThinkPad X1 Carbon G9-20XW0089GE | |
| Lenovo ThinkPad X1 Carbon G9-20XWCTO1WW | |
| Asus ExpertBook B9 B9400CE-KC0166R | |
| HP EliteBook 840 Aero G8 3E4Q6AA | |
| Average Intel Core i5-1135G7 (265 - 373, n=51) | |
| AIDA64 / FP64 Ray-Trace | |
| Average of class Subnotebook (610 - 17495, n=60, last 2 years) | |
| Schenker Vision 14 | |
| Lenovo ThinkPad X1 Carbon G9-20XWCTO1WW | |
| Lenovo ThinkPad X1 Carbon G9-20XW0089GE | |
| Asus ExpertBook B9 B9400CE-KC0166R | |
| Average Intel Core i5-1135G7 (2226 - 4291, n=45) | |
| HP EliteBook 840 Aero G8 3E4Q6AA | |
| AIDA64 / CPU PhotoWorxx | |
| Average of class Subnotebook (6569 - 85600, n=60, last 2 years) | |
| Asus ExpertBook B9 B9400CE-KC0166R | |
| Lenovo ThinkPad X1 Carbon G9-20XWCTO1WW | |
| Lenovo ThinkPad X1 Carbon G9-20XW0089GE | |
| Schenker Vision 14 | |
| HP EliteBook 840 Aero G8 3E4Q6AA | |
| Average Intel Core i5-1135G7 (9004 - 45366, n=45) | |
| PCMark 10 / Score | |
| Average of class Subnotebook (4920 - 9939, n=45, last 2 years) | |
| Schenker Vision 14 | |
| Lenovo ThinkPad X1 Carbon G9-20XWCTO1WW | |
| Asus ExpertBook B9 B9400CE-KC0166R | |
| Lenovo ThinkPad X1 Carbon G9-20XW0089GE | |
| HP EliteBook 840 Aero G8 3E4Q6AA | |
| Average Intel Core i5-1135G7, Intel Iris Xe Graphics G7 80EUs (4026 - 4952, n=53) | |
| PCMark 10 / Essentials | |
| Average of class Subnotebook (8552 - 11646, n=45, last 2 years) | |
| Schenker Vision 14 | |
| Lenovo ThinkPad X1 Carbon G9-20XWCTO1WW | |
| Asus ExpertBook B9 B9400CE-KC0166R | |
| Lenovo ThinkPad X1 Carbon G9-20XW0089GE | |
| HP EliteBook 840 Aero G8 3E4Q6AA | |
| Average Intel Core i5-1135G7, Intel Iris Xe Graphics G7 80EUs (8149 - 9917, n=53) | |
| PCMark 10 / Productivity | |
| Average of class Subnotebook (5435 - 16606, n=45, last 2 years) | |
| Lenovo ThinkPad X1 Carbon G9-20XWCTO1WW | |
| Schenker Vision 14 | |
| Asus ExpertBook B9 B9400CE-KC0166R | |
| HP EliteBook 840 Aero G8 3E4Q6AA | |
| Lenovo ThinkPad X1 Carbon G9-20XW0089GE | |
| Average Intel Core i5-1135G7, Intel Iris Xe Graphics G7 80EUs (5040 - 6619, n=53) | |
| PCMark 10 / Digital Content Creation | |
| Average of class Subnotebook (5722 - 13779, n=45, last 2 years) | |
| Schenker Vision 14 | |
| HP EliteBook 840 Aero G8 3E4Q6AA | |
| Lenovo ThinkPad X1 Carbon G9-20XWCTO1WW | |
| Asus ExpertBook B9 B9400CE-KC0166R | |
| Lenovo ThinkPad X1 Carbon G9-20XW0089GE | |
| Average Intel Core i5-1135G7, Intel Iris Xe Graphics G7 80EUs (3548 - 5255, n=53) | |
| AIDA64 / Memory Copy | |
| Average of class Subnotebook (14554 - 131023, n=60, last 2 years) | |
| Lenovo ThinkPad X1 Carbon G9-20XWCTO1WW | |
| Asus ExpertBook B9 B9400CE-KC0166R | |
| Lenovo ThinkPad X1 Carbon G9-20XW0089GE | |
| Schenker Vision 14 | |
| HP EliteBook 840 Aero G8 3E4Q6AA | |
| Average Intel Core i5-1135G7 (17443 - 63889, n=45) | |
| AIDA64 / Memory Read | |
| Average of class Subnotebook (15948 - 127174, n=60, last 2 years) | |
| Lenovo ThinkPad X1 Carbon G9-20XW0089GE | |
| Lenovo ThinkPad X1 Carbon G9-20XWCTO1WW | |
| Asus ExpertBook B9 B9400CE-KC0166R | |
| Schenker Vision 14 | |
| HP EliteBook 840 Aero G8 3E4Q6AA | |
| Average Intel Core i5-1135G7 (19716 - 63705, n=45) | |
| AIDA64 / Memory Write | |
| Average of class Subnotebook (15709 - 135141, n=60, last 2 years) | |
| Asus ExpertBook B9 B9400CE-KC0166R | |
| Lenovo ThinkPad X1 Carbon G9-20XW0089GE | |
| Lenovo ThinkPad X1 Carbon G9-20XWCTO1WW | |
| HP EliteBook 840 Aero G8 3E4Q6AA | |
| Schenker Vision 14 | |
| Average Intel Core i5-1135G7 (18722 - 66778, n=45) | |
| AIDA64 / Memory Latency | |
| Average of class Subnotebook (6.1 - 159.9, n=58, last 2 years) | |
| Asus ExpertBook B9 B9400CE-KC0166R | |
| HP EliteBook 840 Aero G8 3E4Q6AA | |
| Lenovo ThinkPad X1 Carbon G9-20XWCTO1WW | |
| Lenovo ThinkPad X1 Carbon G9-20XW0089GE | |
| Average Intel Core i5-1135G7 (68.3 - 107, n=51) | |
| Schenker Vision 14 | |
* ... smaller is better
DPC延迟
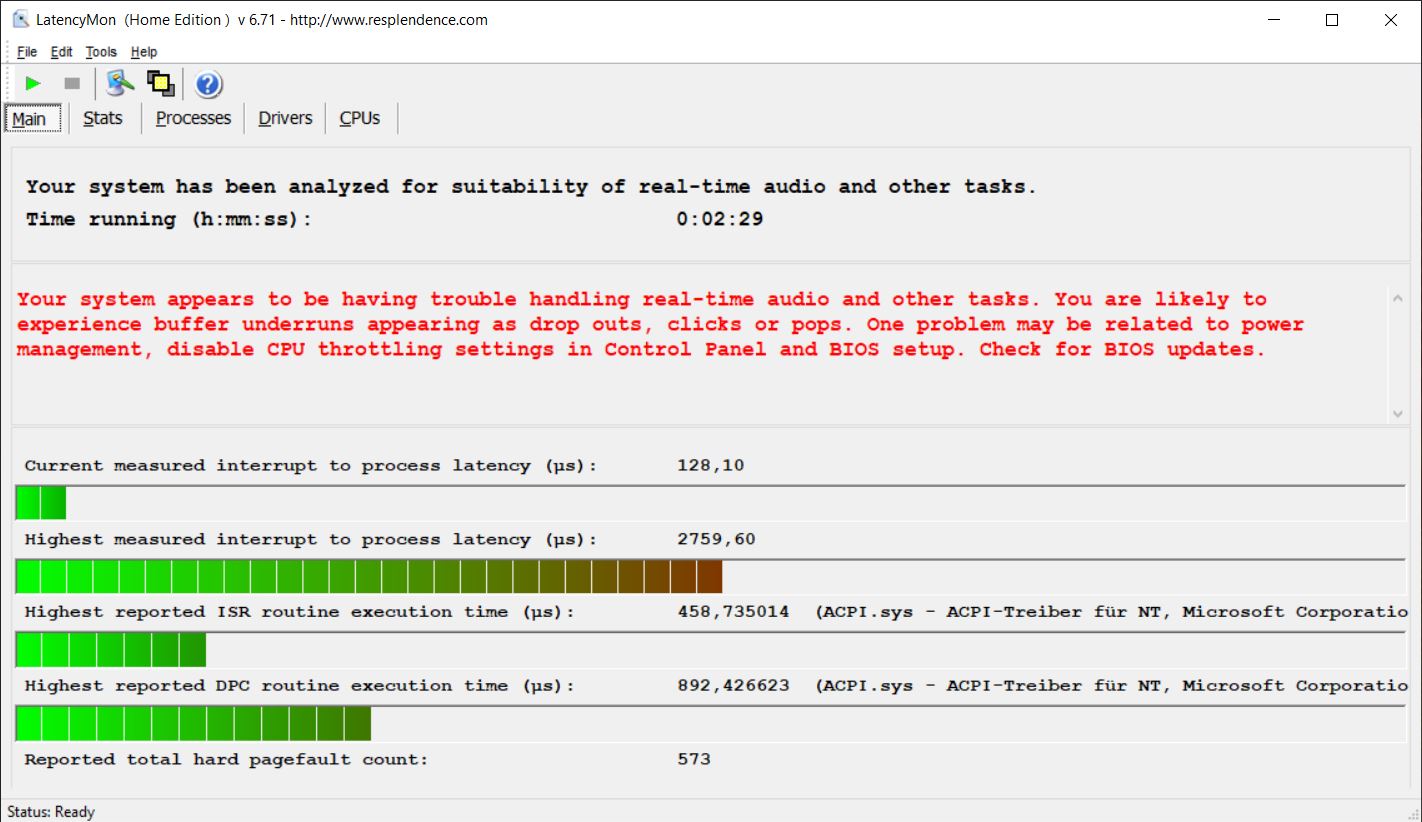
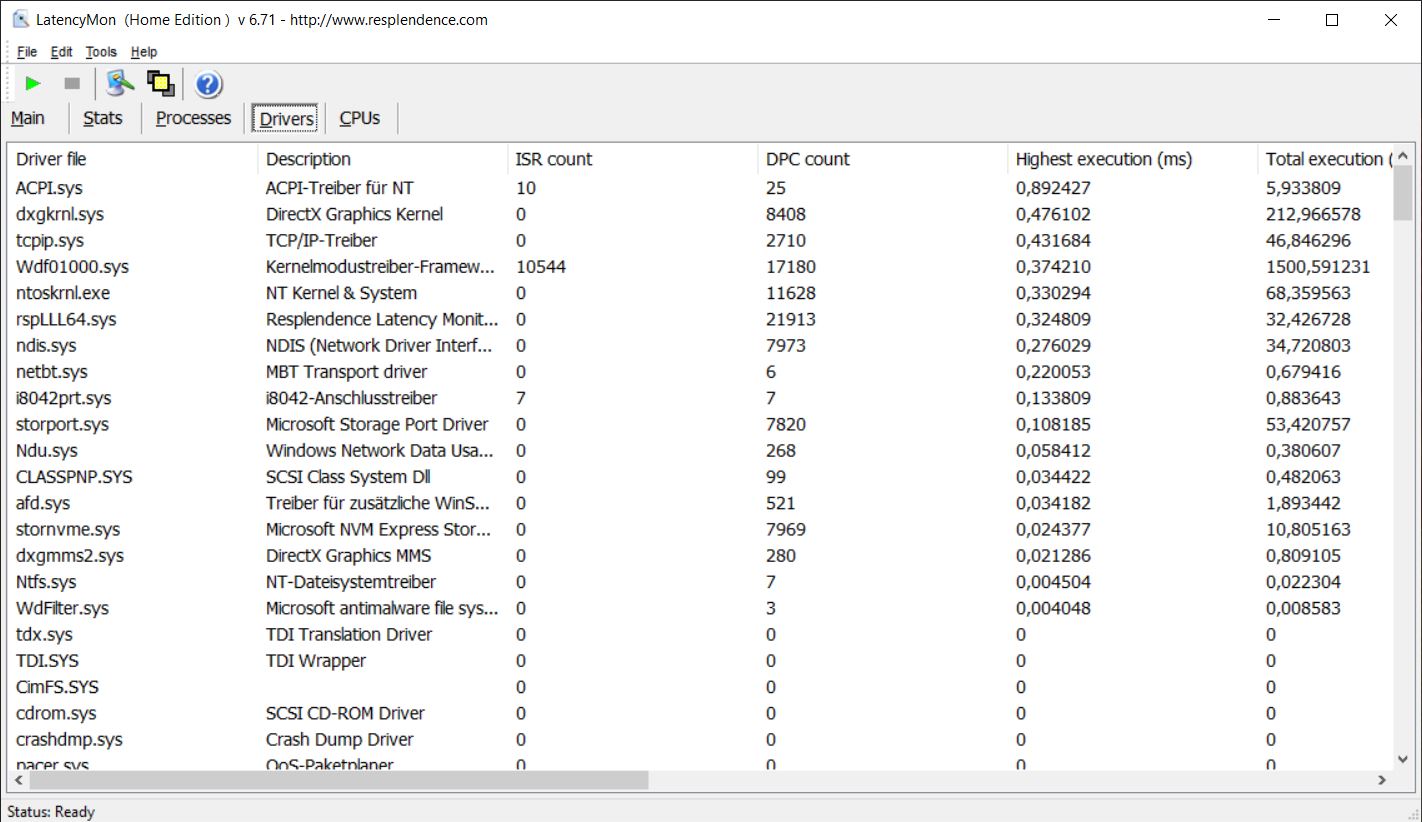
| DPC Latencies / LatencyMon - interrupt to process latency (max), Web, Youtube, Prime95 | |
| HP EliteBook 840 Aero G8 3E4Q6AA | |
| Lenovo ThinkPad X1 Carbon G9-20XW0089GE | |
| Schenker Vision 14 | |
| Lenovo ThinkPad X1 Carbon G9-20XWCTO1WW | |
| Asus ExpertBook B9 B9400CE-KC0166R | |
* ... smaller is better

| Drive Performance rating - Percent | |
| Schenker Vision 14 | |
| Lenovo ThinkPad X1 Carbon G9-20XW0089GE | |
| Average Samsung PM9A1 MZVL2512HCJQ | |
| Lenovo ThinkPad X1 Carbon G9-20XWCTO1WW | |
| Average of class Subnotebook | |
| Asus ExpertBook B9 B9400CE-KC0166R | |
| HP EliteBook 840 Aero G8 3E4Q6AA | |
* ... smaller is better
Continuous reading: DiskSpd Read Loop, Queue Depth 8
| 3DMark Performance rating - Percent | |
| Average of class Subnotebook | |
| Asus ExpertBook B9 B9400CE-KC0166R | |
| HP EliteBook 840 Aero G8 3E4Q6AA | |
| Lenovo ThinkPad X1 Carbon G9-20XWCTO1WW -1! | |
| Schenker Vision 14 | |
| Lenovo ThinkPad X1 Carbon G9-20XW0089GE | |
| Average Intel Iris Xe Graphics G7 80EUs | |
| 3DMark 11 Performance | 6087 points | |
| 3DMark Cloud Gate Standard Score | 18583 points | |
| 3DMark Fire Strike Score | 4021 points | |
| 3DMark Time Spy Score | 1508 points | |
Help | ||
Witcher 3 FPS-Diagram
| low | med. | high | ultra | |
|---|---|---|---|---|
| The Witcher 3 (2015) | 85 | 53 | 28 | 10.6 |
| Dota 2 Reborn (2015) | 123 | 74.7 | 51.6 | 47.9 |
| Final Fantasy XV Benchmark (2018) | 39.9 | 21 | 15.1 | |
| X-Plane 11.11 (2018) | 38.1 | 32.3 | 29.7 |
Noise level
| Idle |
| 24.7 / 24.7 / 24.7 dB(A) |
| Load |
| 40.9 / 40.9 dB(A) |
 | ||
30 dB silent 40 dB(A) audible 50 dB(A) loud |
||
min: | ||
| Lenovo ThinkPad X1 Carbon G9-20XW0089GE Iris Xe G7 80EUs, i5-1135G7, Samsung PM9A1 MZVL2512HCJQ | HP EliteBook 840 Aero G8 3E4Q6AA Iris Xe G7 96EUs, i7-1185G7, SK Hynix PC711 512GB HFS512GDE9X073N | Lenovo ThinkPad X1 Carbon G9-20XWCTO1WW Iris Xe G7 96EUs, i7-1165G7, Samsung PM9A1 MZVL21T0HCLR | Schenker Vision 14 Iris Xe G7 96EUs, i7-1165G7, Samsung SSD 980 Pro 1TB MZ-V8P1T0BW | Asus ExpertBook B9 B9400CE-KC0166R Iris Xe G7 96EUs, i7-1165G7, Samsung PM981a MZVLB1T0HBLR | |
|---|---|---|---|---|---|
| Noise | 14% | 8% | -1% | -5% | |
| off / environment * (dB) | 24.7 | 24.1 2% | 23.66 4% | 25 -1% | 24 3% |
| Idle Minimum * (dB) | 24.7 | 24.2 2% | 23.6 4% | 25 -1% | 24 3% |
| Idle Average * (dB) | 24.7 | 24.2 2% | 23.6 4% | 25 -1% | 24 3% |
| Idle Maximum * (dB) | 24.7 | 24.2 2% | 23.6 4% | 26.9 -9% | 24 3% |
| Load Average * (dB) | 40.9 | 26.9 34% | 33.5 18% | 38.6 6% | 47.5 -16% |
| Witcher 3 ultra * (dB) | 40.9 | 27.9 32% | 41.2 -1% | 47.5 -16% | |
| Load Maximum * (dB) | 40.9 | 29.9 27% | 34.3 16% | 41.2 -1% | 47.5 -16% |
* ... smaller is better
Lenovo ThinkPad X1 Carbon G9-20XW0089GE audio analysis
(±) | speaker loudness is average but good (80.8 dB)
Bass 100 - 315 Hz
(±) | reduced bass - on average 13% lower than median
(±) | linearity of bass is average (12.3% delta to prev. frequency)
Mids 400 - 2000 Hz
(+) | balanced mids - only 4.5% away from median
(+) | mids are linear (4.5% delta to prev. frequency)
Highs 2 - 16 kHz
(+) | balanced highs - only 2.4% away from median
(+) | highs are linear (5.7% delta to prev. frequency)
Overall 100 - 16.000 Hz
(+) | overall sound is linear (13.9% difference to median)
Compared to same class
» 25% of all tested devices in this class were better, 6% similar, 69% worse
» The best had a delta of 5%, average was 18%, worst was 53%
Compared to all devices tested
» 16% of all tested devices were better, 4% similar, 80% worse
» The best had a delta of 4%, average was 24%, worst was 134%
HP EliteBook 840 Aero G8 3E4Q6AA audio analysis
(±) | speaker loudness is average but good (78.6 dB)
Bass 100 - 315 Hz
(±) | reduced bass - on average 11% lower than median
(±) | linearity of bass is average (10.6% delta to prev. frequency)
Mids 400 - 2000 Hz
(+) | balanced mids - only 4.3% away from median
(+) | mids are linear (3% delta to prev. frequency)
Highs 2 - 16 kHz
(+) | balanced highs - only 2.5% away from median
(+) | highs are linear (4.3% delta to prev. frequency)
Overall 100 - 16.000 Hz
(+) | overall sound is linear (12.6% difference to median)
Compared to same class
» 5% of all tested devices in this class were better, 2% similar, 93% worse
» The best had a delta of 7%, average was 21%, worst was 53%
Compared to all devices tested
» 11% of all tested devices were better, 2% similar, 86% worse
» The best had a delta of 4%, average was 24%, worst was 134%
| Off / Standby | |
| Idle | |
| Load |
|
Key:
min: | |
Energy consumption Witcher 3 / Stress test
电池寿命
在我们的WLAN测试中,我们确定电池运行时间为10小时,调整亮度为150cd/m²,使用最大亮度时仍为7小时。这使测试设备几乎处于比较组的中场,也处于X1 Carbon G9的其他两个版本之间。高分辨率的4K型号在同样的测试中仅能维持7小时和5小时,而没有隐私过滤器的普通全高清面板分别能维持11.5小时和9.5小时。
Pros
Cons
结论 - X1 Carbon的冷却仍然需要改进
联想能够解决处理器和显卡同时加载时的性能问题,但这是以相当低的TDP限制和明显更响的风扇为代价的。制造商肯定应该在下一代产品中对此进行改进。
可选的ePrivacy显示屏仍然是一个问题。原则上,测量值还可以,面板可以说服人,特别是在亮度方面。色彩准确度也处于良好水平,可以处理sRGB色彩空间的图片(完全覆盖)。然而,由于内置的隐私过滤器,当你非常集中地看显示器时,只有一个相对较小的甜蜜点。只要你稍微改变角度(水平或垂直),就会出现明显的亮度和对比度损失。它几乎看起来就像一个灰色的雾气覆盖在画面上。此外,隐私过滤器的效果也很有限。它当然会限制从侧面看去的视线,但它只有在低亮度水平下才能真正合理地发挥作用,这显然不是在旅途中的最佳状态。联想在这里也做了一些手脚,一旦你激活过滤器,默认情况下会将亮度降低到160cd/m²左右。你可以再次增加亮度,但视觉保护会明显下降。
联想已经稳定了性能,但现在风扇的声音反倒大了。内置的隐私过滤器提供了一定的保护,防止不需要的目光,但你必须考虑到一般图片质量的限制。
对于大多数用户来说,我们当然会选择普通的 全高清面板.惠普提供的 EliteBook 840也提供了一个内置的隐私过滤器(SureView技术),但这里的画质也有限制。
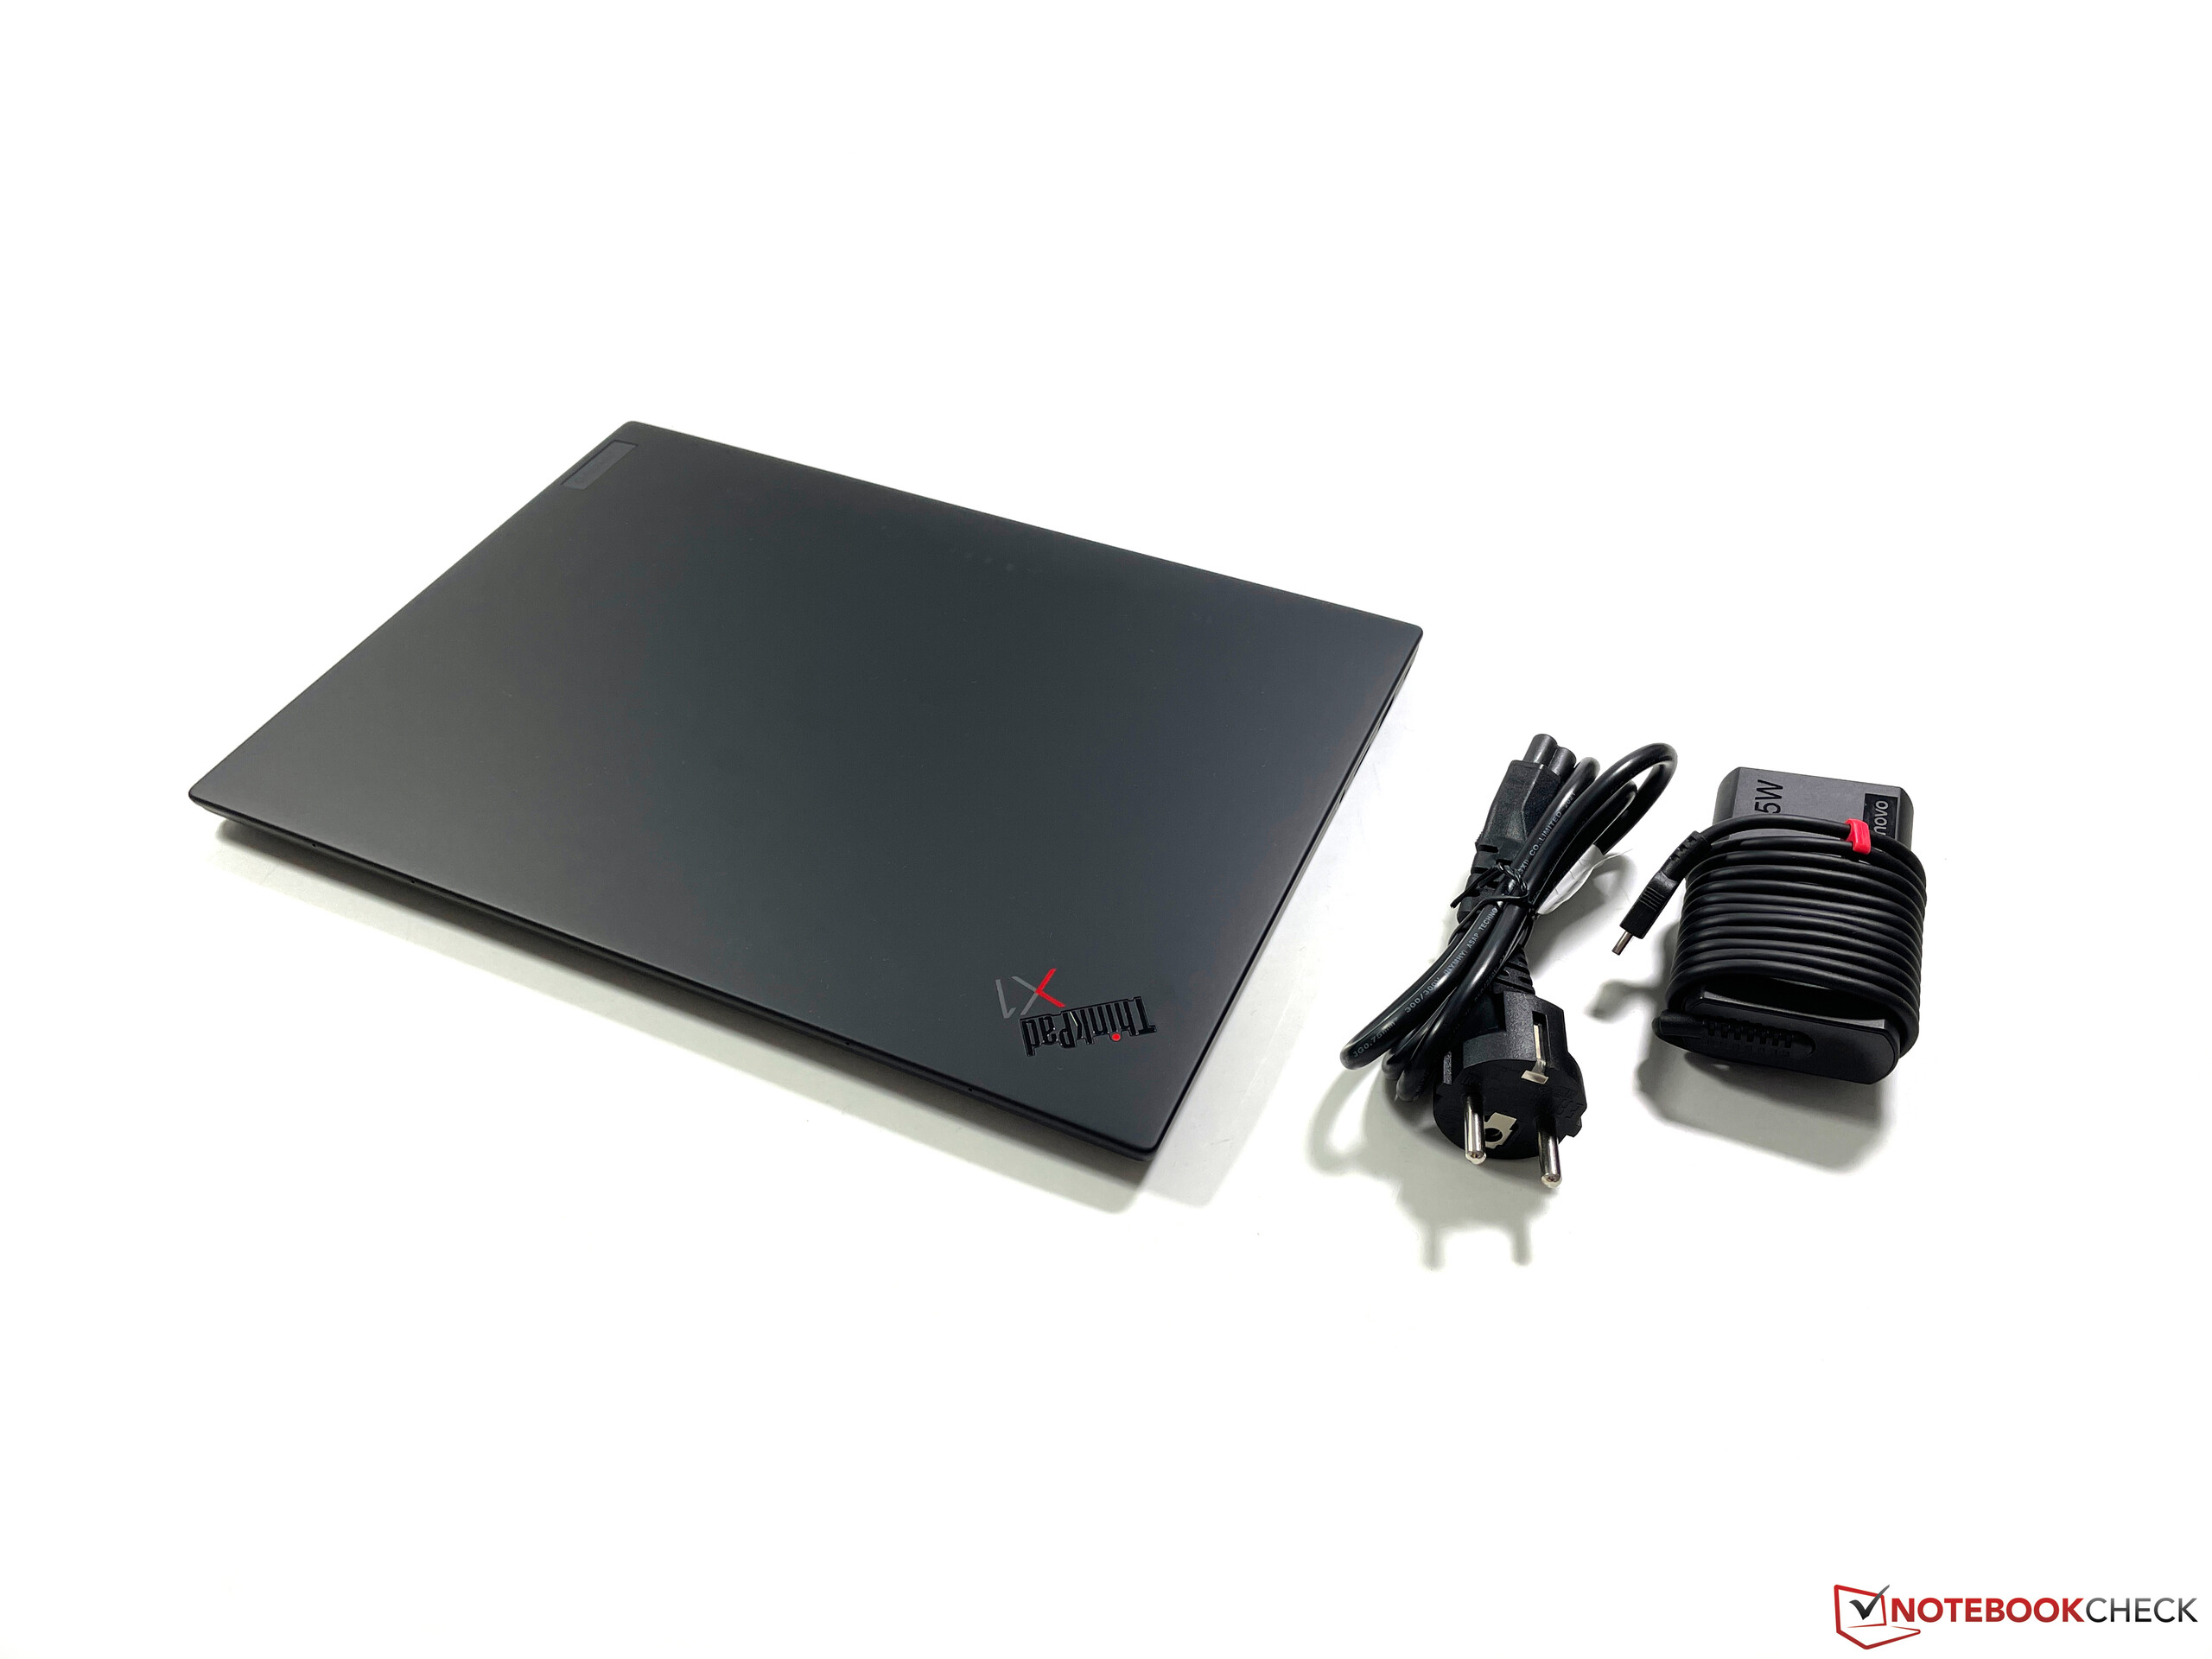
价格和可用性
除其他外,ThinkPad X1 Carbon G9的评测样品可在Cyberport售价2,140欧元(约合2,455美元)。
Lenovo ThinkPad X1 Carbon G9-20XW0089GE
- 11/09/2021 v7 (old)
Andreas Osthoff
Price comparison
