联想ThinkPad E15笔记本电脑评测:性能太强,散热太差
Rating | Date | Model | Weight | Height | Size | Resolution | Price |
|---|---|---|---|---|---|---|---|
| 82.1 % v7 (old) | 05 / 2020 | Lenovo ThinkPad E15 20RD0011GE i7-10510U, Radeon RX 640 | 1.8 kg | 18.9 mm | 15.60" | 1920x1080 | |
| 87.6 % v6 (old) | 04 / 2019 | Lenovo ThinkPad E590-20NB0012GE i7-8565U, Radeon RX 550X (Laptop) | 1.9 kg | 19.9 mm | 15.60" | 1920x1080 | |
| 86.6 % v7 (old) | 09 / 2019 | Lenovo ThinkPad T590-20N4002VGE i7-8565U, GeForce MX250 | 1.9 kg | 19.95 mm | 15.60" | 1920x1080 | |
| 81.1 % v6 (old) | Dell Vostro 15-5581 i5-8265U, GeForce MX130 | 2 kg | 18.04 mm | 15.60" | 1920x1080 | ||
| 80.1 % v7 (old) | 03 / 2020 | MSI Modern 15 A10RB i7-10510U, GeForce MX250 | 1.6 kg | 15.9 mm | 15.60" | 1920x1080 |

| Networking | |
| iperf3 transmit AX12 | |
| MSI Modern 15 A10RB | |
| Lenovo ThinkPad E590-20NB0012GE | |
| Lenovo ThinkPad E15 20RD0011GE | |
| Lenovo ThinkPad T590-20N4002VGE | |
| Dell Vostro 15-5581 | |
| iperf3 receive AX12 | |
| MSI Modern 15 A10RB | |
| Lenovo ThinkPad E15 20RD0011GE | |
| Lenovo ThinkPad T590-20N4002VGE | |
| Lenovo ThinkPad E590-20NB0012GE | |
| Dell Vostro 15-5581 | |
| |||||||||||||||||||||||||
Brightness Distribution: 81 %
Center on Battery: 284 cd/m²
Contrast: 1286:1 (Black: 0.22 cd/m²)
ΔE ColorChecker Calman: 7.9 | ∀{0.5-29.43 Ø4.71}
calibrated: 5.8
ΔE Greyscale Calman: 6.6 | ∀{0.09-98 Ø4.96}
57.1% sRGB (Argyll 1.6.3 3D)
37% AdobeRGB 1998 (Argyll 1.6.3 3D)
41.59% AdobeRGB 1998 (Argyll 3D)
57.7% sRGB (Argyll 3D)
40.25% Display P3 (Argyll 3D)
Gamma: 2.18
CCT: 5735 K
| Lenovo ThinkPad E15 20RD0011GE NV156FHM-N48, IPS LED, 1920x1080, 15.6" | Lenovo ThinkPad E590-20NB0012GE Lenovo B156HAN02.1, IPS, 1920x1080, 15.6" | Lenovo ThinkPad T590-20N4002VGE LP156WFC-SPD1, aSi IPS LED, 1920x1080, 15.6" | Dell Vostro 15-5581 156CL04 1G2XW, IPS, 1920x1080, 15.6" | MSI Modern 15 A10RB Chi Mei N156HCE-EN1, IPS, 1920x1080, 15.6" | |
|---|---|---|---|---|---|
| Display | 1% | -2% | -2% | 61% | |
| Display P3 Coverage (%) | 40.25 | 39.88 -1% | 38.79 -4% | 38.86 -3% | 66 64% |
| sRGB Coverage (%) | 57.7 | 59.9 4% | 58.3 1% | 58.5 1% | 92.1 60% |
| AdobeRGB 1998 Coverage (%) | 41.59 | 41.21 -1% | 40.11 -4% | 40.15 -3% | 66.5 60% |
| Response Times | 7% | 25% | 26% | 9% | |
| Response Time Grey 50% / Grey 80% * (ms) | 49.6 ? | 47.2 ? 5% | 37.2 ? 25% | 36 ? 27% | 43.2 ? 13% |
| Response Time Black / White * (ms) | 36 ? | 32.8 ? 9% | 27.2 ? 24% | 27 ? 25% | 34.4 ? 4% |
| PWM Frequency (Hz) | 1250 ? | 208 ? | 26040 ? | ||
| Screen | 15% | 12% | 19% | 32% | |
| Brightness middle (cd/m²) | 283 | 284 0% | 276 -2% | 231 -18% | 289.4 2% |
| Brightness (cd/m²) | 258 | 272 5% | 262 2% | 213 -17% | 273 6% |
| Brightness Distribution (%) | 81 | 92 14% | 88 9% | 87 7% | 82 1% |
| Black Level * (cd/m²) | 0.22 | 0.21 5% | 0.23 -5% | 0.13 41% | 0.27 -23% |
| Contrast (:1) | 1286 | 1352 5% | 1200 -7% | 1777 38% | 1072 -17% |
| Colorchecker dE 2000 * | 7.9 | 5.3 33% | 5.6 29% | 4.81 39% | 2.32 71% |
| Colorchecker dE 2000 max. * | 23.6 | 18.9 20% | 16.4 31% | 8.33 65% | 5.76 76% |
| Colorchecker dE 2000 calibrated * | 5.8 | 4.4 24% | 4.7 19% | 4.2 28% | 2.49 57% |
| Greyscale dE 2000 * | 6.6 | 3.2 52% | 3 55% | 5.19 21% | 3 55% |
| Gamma | 2.18 101% | 2.41 91% | 2.18 101% | 2.33 94% | 2.22 99% |
| CCT | 5735 113% | 6736 96% | 7075 92% | 7088 92% | 6867 95% |
| Color Space (Percent of AdobeRGB 1998) (%) | 37 | 37.9 2% | 36.9 0% | 37 0% | 59.8 62% |
| Color Space (Percent of sRGB) (%) | 57.1 | 59.7 5% | 58.1 2% | 58 2% | 92 61% |
| Total Average (Program / Settings) | 8% /
11% | 12% /
11% | 14% /
16% | 34% /
35% |
* ... smaller is better
Display Response Times
| ↔ Response Time Black to White | ||
|---|---|---|
| 36 ms ... rise ↗ and fall ↘ combined | ↗ 18.8 ms rise | 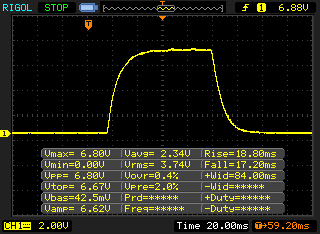 |
| ↘ 17.2 ms fall | ||
| The screen shows slow response rates in our tests and will be unsatisfactory for gamers. In comparison, all tested devices range from 0.1 (minimum) to 240 (maximum) ms. » 94 % of all devices are better. This means that the measured response time is worse than the average of all tested devices (19.8 ms). | ||
| ↔ Response Time 50% Grey to 80% Grey | ||
| 49.6 ms ... rise ↗ and fall ↘ combined | ↗ 24.4 ms rise | 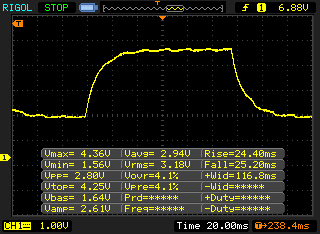 |
| ↘ 25.2 ms fall | ||
| The screen shows slow response rates in our tests and will be unsatisfactory for gamers. In comparison, all tested devices range from 0.165 (minimum) to 636 (maximum) ms. » 86 % of all devices are better. This means that the measured response time is worse than the average of all tested devices (31 ms). | ||
Screen Flickering / PWM (Pulse-Width Modulation)
| Screen flickering / PWM detected | 1250 Hz | ≤ 99 % brightness setting | 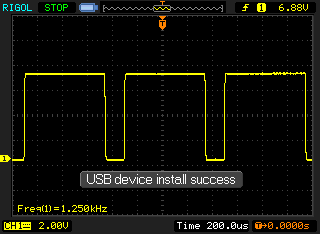 |
The display backlight flickers at 1250 Hz (worst case, e.g., utilizing PWM) Flickering detected at a brightness setting of 99 % and below. There should be no flickering or PWM above this brightness setting. The frequency of 1250 Hz is quite high, so most users sensitive to PWM should not notice any flickering. In comparison: 52 % of all tested devices do not use PWM to dim the display. If PWM was detected, an average of 7754 (minimum: 5 - maximum: 343500) Hz was measured. | |||
| PCMark 8 | |
| Home Score Accelerated v2 | |
| Average of class Office (n=1last 2 years) | |
| Lenovo ThinkPad E590-20NB0012GE | |
| Lenovo ThinkPad E15 20RD0011GE | |
| MSI Modern 15 A10RB | |
| Lenovo ThinkPad T590-20N4002VGE | |
| Average Intel Core i7-10510U, AMD Radeon RX 640 (3537 - 4045, n=2) | |
| Dell Vostro 15-5581 | |
| Work Score Accelerated v2 | |
| Average of class Office (n=1last 2 years) | |
| MSI Modern 15 A10RB | |
| Lenovo ThinkPad E590-20NB0012GE | |
| Lenovo ThinkPad T590-20N4002VGE | |
| Lenovo ThinkPad E15 20RD0011GE | |
| Average Intel Core i7-10510U, AMD Radeon RX 640 (4927 - 5142, n=2) | |
| Dell Vostro 15-5581 | |
| PCMark 8 Home Score Accelerated v2 | 4045 points | |
| PCMark 8 Work Score Accelerated v2 | 5142 points | |
| PCMark 10 Score | 5023 points | |
Help | ||
| Lenovo ThinkPad E15 20RD0011GE Samsung PM991 MZALQ512HALU | Lenovo ThinkPad E590-20NB0012GE Toshiba KBG30ZMT256G | Lenovo ThinkPad T590-20N4002VGE Toshiba XG6 KXG60ZNV512G | Dell Vostro 15-5581 SK hynix BC501 HFM128GDJTNG-831 | MSI Modern 15 A10RB WDC PC SN730 SDBPNTY-512G | Average Samsung PM991 MZALQ512HALU | |
|---|---|---|---|---|---|---|
| CrystalDiskMark 5.2 / 6 | -28% | 17% | -48% | 55% | -3% | |
| Write 4K (MB/s) | 144.4 | 111.2 -23% | 126.2 -13% | 129.3 -10% | 208.4 44% | 129.5 ? -10% |
| Read 4K (MB/s) | 52.3 | 49.01 -6% | 48.93 -6% | 41.02 -22% | 51 -2% | 45.1 ? -14% |
| Write Seq (MB/s) | 946 | 586 -38% | 1345 42% | 203.4 -78% | 2687 184% | 1172 ? 24% |
| Read Seq (MB/s) | 1608 | 783 -51% | 1373 -15% | 271.2 -83% | 2168 35% | 1496 ? -7% |
| Write 4K Q32T1 (MB/s) | 592 | 263 -56% | 383.8 -35% | 252.3 -57% | 489.2 -17% | 448 ? -24% |
| Read 4K Q32T1 (MB/s) | 397.7 | 481.5 21% | 434.8 9% | 281.4 -29% | 600 51% | 415 ? 4% |
| Write Seq Q32T1 (MB/s) | 1364 | 784 -43% | 2966 117% | 319.8 -77% | 2699 98% | 1397 ? 2% |
| Read Seq Q32T1 (MB/s) | 2301 | 1602 -30% | 3230 40% | 1589 -31% | 3374 47% | 2307 ? 0% |

| 3DMark 11 - 1280x720 Performance GPU | |
| Average of class Office (2551 - 18313, n=72, last 2 years) | |
| Lenovo ThinkPad E590-20NB0012GE | |
| Average AMD Radeon RX 640 (4998 - 5472, n=2) | |
| Lenovo ThinkPad E15 20RD0011GE | |
| MSI Modern 15 A10RB | |
| Lenovo ThinkPad T590-20N4002VGE | |
| Dell Vostro 15-5581 | |
| 3DMark | |
| 1280x720 Cloud Gate Standard Graphics | |
| Average of class Office (11640 - 118515, n=38, last 2 years) | |
| MSI Modern 15 A10RB | |
| Lenovo ThinkPad T590-20N4002VGE | |
| Average AMD Radeon RX 640 (19479 - 20412, n=2) | |
| Lenovo ThinkPad E590-20NB0012GE | |
| Lenovo ThinkPad E15 20RD0011GE | |
| Dell Vostro 15-5581 | |
| 1920x1080 Fire Strike Graphics | |
| Average of class Office (736 - 21871, n=75, last 2 years) | |
| MSI Modern 15 A10RB | |
| Lenovo ThinkPad T590-20N4002VGE | |
| Lenovo ThinkPad E590-20NB0012GE | |
| Average AMD Radeon RX 640 (3279 - 3718, n=2) | |
| Lenovo ThinkPad E15 20RD0011GE | |
| Dell Vostro 15-5581 | |
| 2560x1440 Time Spy Graphics | |
| Average of class Office (493 - 6679, n=70, last 2 years) | |
| MSI Modern 15 A10RB | |
| Lenovo ThinkPad E590-20NB0012GE | |
| Average AMD Radeon RX 640 (990 - 1025, n=2) | |
| Lenovo ThinkPad E15 20RD0011GE | |
| Dell Vostro 15-5581 | |
| 3DMark 06 Standard Score | 20261 points | |
| 3DMark Vantage P Result | 14141 points | |
| 3DMark 11 Performance | 5243 points | |
| 3DMark Ice Storm Standard Score | 61367 points | |
| 3DMark Cloud Gate Standard Score | 13593 points | |
| 3DMark Fire Strike Score | 3049 points | |
| 3DMark Time Spy Score | 1100 points | |
Help | ||
| The Witcher 3 - 1920x1080 High Graphics & Postprocessing (Nvidia HairWorks Off) | |
| Average of class Office (23.7 - 53.4, n=3, last 2 years) | |
| MSI Modern 15 A10RB | |
| Lenovo ThinkPad T590-20N4002VGE | |
| Lenovo ThinkPad E590-20NB0012GE | |
| Average AMD Radeon RX 640 (19.7 - 19.9, n=2) | |
| Lenovo ThinkPad E15 20RD0011GE | |
| low | med. | high | ultra | |
|---|---|---|---|---|
| BioShock Infinite (2013) | 150.5 | 94.1 | 74.4 | 27.3 |
| The Witcher 3 (2015) | 63.2 | 38.4 | 19.7 | 11.3 |
| Dota 2 Reborn (2015) | 110 | 95.5 | 51.7 | 48.2 |
| Rise of the Tomb Raider (2016) | 64.7 | 28.6 | 19.8 | |
| Far Cry 5 (2018) | 48 | 21 | ||
| Shadow of the Tomb Raider (2018) | 42 | 22 | ||
| Assassin´s Creed Odyssey (2018) | 39 | 20 | ||
| Battlefield V (2018) | 61.8 | 29.8 | 23.2 | |
| Apex Legends (2019) | 72 | 27 | 20 | |
| Far Cry New Dawn (2019) | 37 | 17 | ||
| The Division 2 (2019) | 52 | 18 | ||
| Anno 1800 (2019) | 61.8 | 20.5 | ||
| Total War: Three Kingdoms (2019) | 51.4 | 16.9 | ||
| F1 2019 (2019) | 55 | 23 | ||
| FIFA 20 (2019) | 112.6 | |||
| Ghost Recon Breakpoint (2019) | 29 | |||
| GRID 2019 (2019) | 60.6 | 20.4 | ||
| Need for Speed Heat (2019) | 31.7 | 14.3 | ||
| Star Wars Jedi Fallen Order (2019) | 25.9 |
Noise level
| Idle |
| 29.2 / 29.2 / 31.7 dB(A) |
| Load |
| 34.8 / 34.8 dB(A) |
 | ||
30 dB silent 40 dB(A) audible 50 dB(A) loud |
||
min: | ||
(-) The maximum temperature on the upper side is 46.1 °C / 115 F, compared to the average of 34.3 °C / 94 F, ranging from 21.2 to 62.5 °C for the class Office.
(-) The bottom heats up to a maximum of 67.8 °C / 154 F, compared to the average of 36.8 °C / 98 F
(+) In idle usage, the average temperature for the upper side is 23.9 °C / 75 F, compared to the device average of 29.5 °C / 85 F.
(±) Playing The Witcher 3, the average temperature for the upper side is 35.9 °C / 97 F, compared to the device average of 29.5 °C / 85 F.
(+) The palmrests and touchpad are cooler than skin temperature with a maximum of 27.8 °C / 82 F and are therefore cool to the touch.
(±) The average temperature of the palmrest area of similar devices was 27.5 °C / 81.5 F (-0.3 °C / -0.5 F).
| Off / Standby | |
| Idle | |
| Load |
|
Key:
min: | |
| Lenovo ThinkPad E15 20RD0011GE i7-10510U, Radeon RX 640, Samsung PM991 MZALQ512HALU, IPS LED, 1920x1080, 15.6" | Lenovo ThinkPad E590-20NB0012GE i7-8565U, Radeon RX 550X (Laptop), Toshiba KBG30ZMT256G, IPS, 1920x1080, 15.6" | Lenovo ThinkPad T590-20N4002VGE i7-8565U, GeForce MX250, Toshiba XG6 KXG60ZNV512G, aSi IPS LED, 1920x1080, 15.6" | Dell Vostro 15-5581 i5-8265U, GeForce MX130, SK hynix BC501 HFM128GDJTNG-831, IPS, 1920x1080, 15.6" | MSI Modern 15 A10RB i7-10510U, GeForce MX250, WDC PC SN730 SDBPNTY-512G, IPS, 1920x1080, 15.6" | Average AMD Radeon RX 640 | Average of class Office | |
|---|---|---|---|---|---|---|---|
| Power Consumption | -11% | -24% | -9% | -72% | -2% | -6% | |
| Idle Minimum * (Watt) | 3.2 | 3.48 -9% | 4.1 -28% | 5 -56% | 6.6 -106% | 3.25 ? -2% | 4.26 ? -33% |
| Idle Average * (Watt) | 6.8 | 7.2 -6% | 8.3 -22% | 7.9 -16% | 9.9 -46% | 6.5 ? 4% | 7.31 ? -8% |
| Idle Maximum * (Watt) | 9.5 | 10.2 -7% | 11.8 -24% | 11.2 -18% | 14.7 -55% | 8.95 ? 6% | 8.55 ? 10% |
| Load Average * (Watt) | 44 | 59.6 -35% | 61.6 -40% | 34 23% | 82.9 -88% | 51.6 ? -17% | 43.8 ? -0% |
| Load Maximum * (Watt) | 66.4 | 65.1 2% | 69.4 -5% | 50.2 24% | 109.3 -65% | 66.5 ? -0% | 64.5 ? 3% |
| Witcher 3 ultra * (Watt) | 49 | 54.4 | 59.4 |
* ... smaller is better
| Lenovo ThinkPad E15 20RD0011GE i7-10510U, Radeon RX 640, 45 Wh | Lenovo ThinkPad E590-20NB0012GE i7-8565U, Radeon RX 550X (Laptop), 45 Wh | Lenovo ThinkPad T590-20N4002VGE i7-8565U, GeForce MX250, 57 Wh | Dell Vostro 15-5581 i5-8265U, GeForce MX130, 42 Wh | MSI Modern 15 A10RB i7-10510U, GeForce MX250, 52 Wh | Average of class Office | |
|---|---|---|---|---|---|---|
| Battery runtime | -8% | 47% | -21% | -12% | 40% | |
| H.264 (h) | 10.4 | 9 -13% | 12.1 16% | 6.6 -37% | 15.5 ? 49% | |
| WiFi v1.3 (h) | 7.5 | 7.1 -5% | 10.5 40% | 6.8 -9% | 6.5 -13% | 13.2 ? 76% |
| Load (h) | 1.9 | 1.8 -5% | 3.5 84% | 1.6 -16% | 1.7 -11% | 1.808 ? -5% |
| Reader / Idle (h) | 18.9 | 12.5 | 15.4 | 24.5 ? |
Pros
Cons
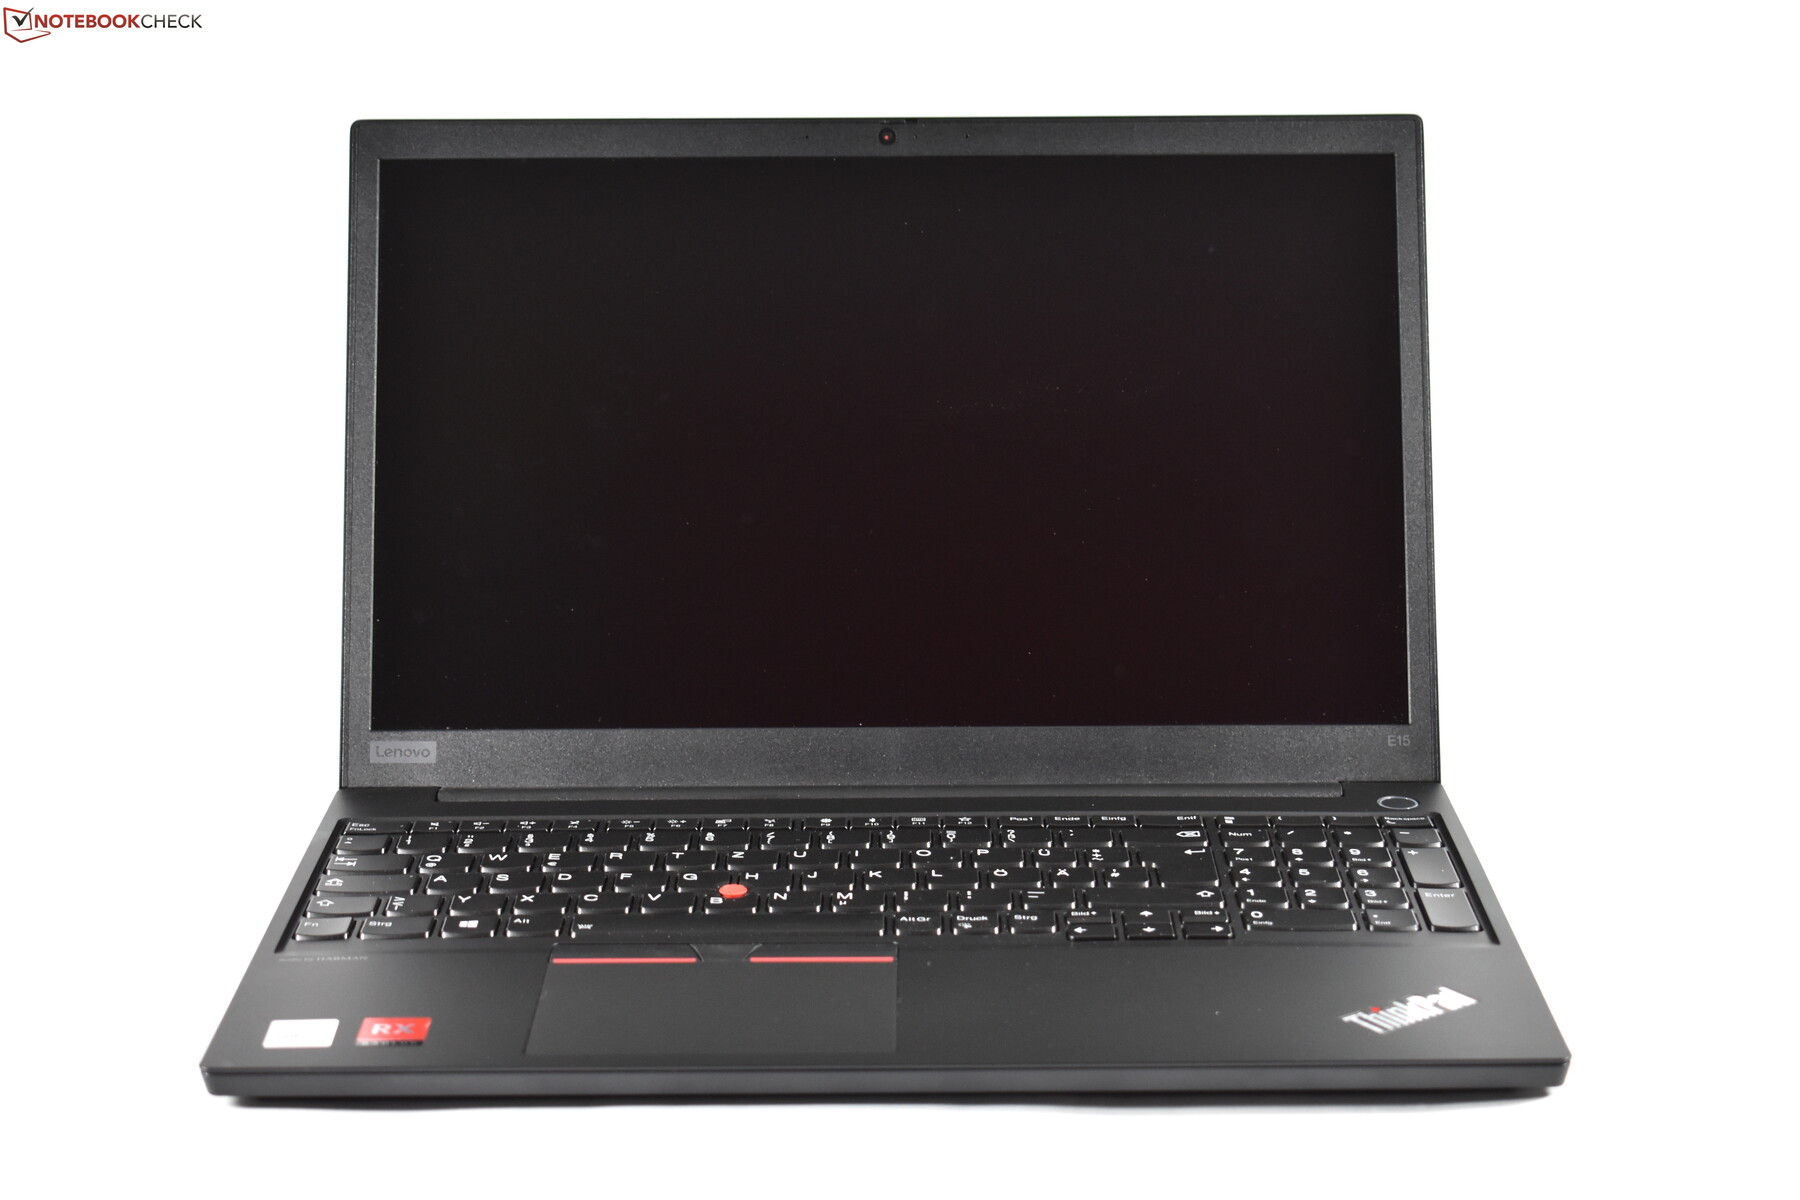
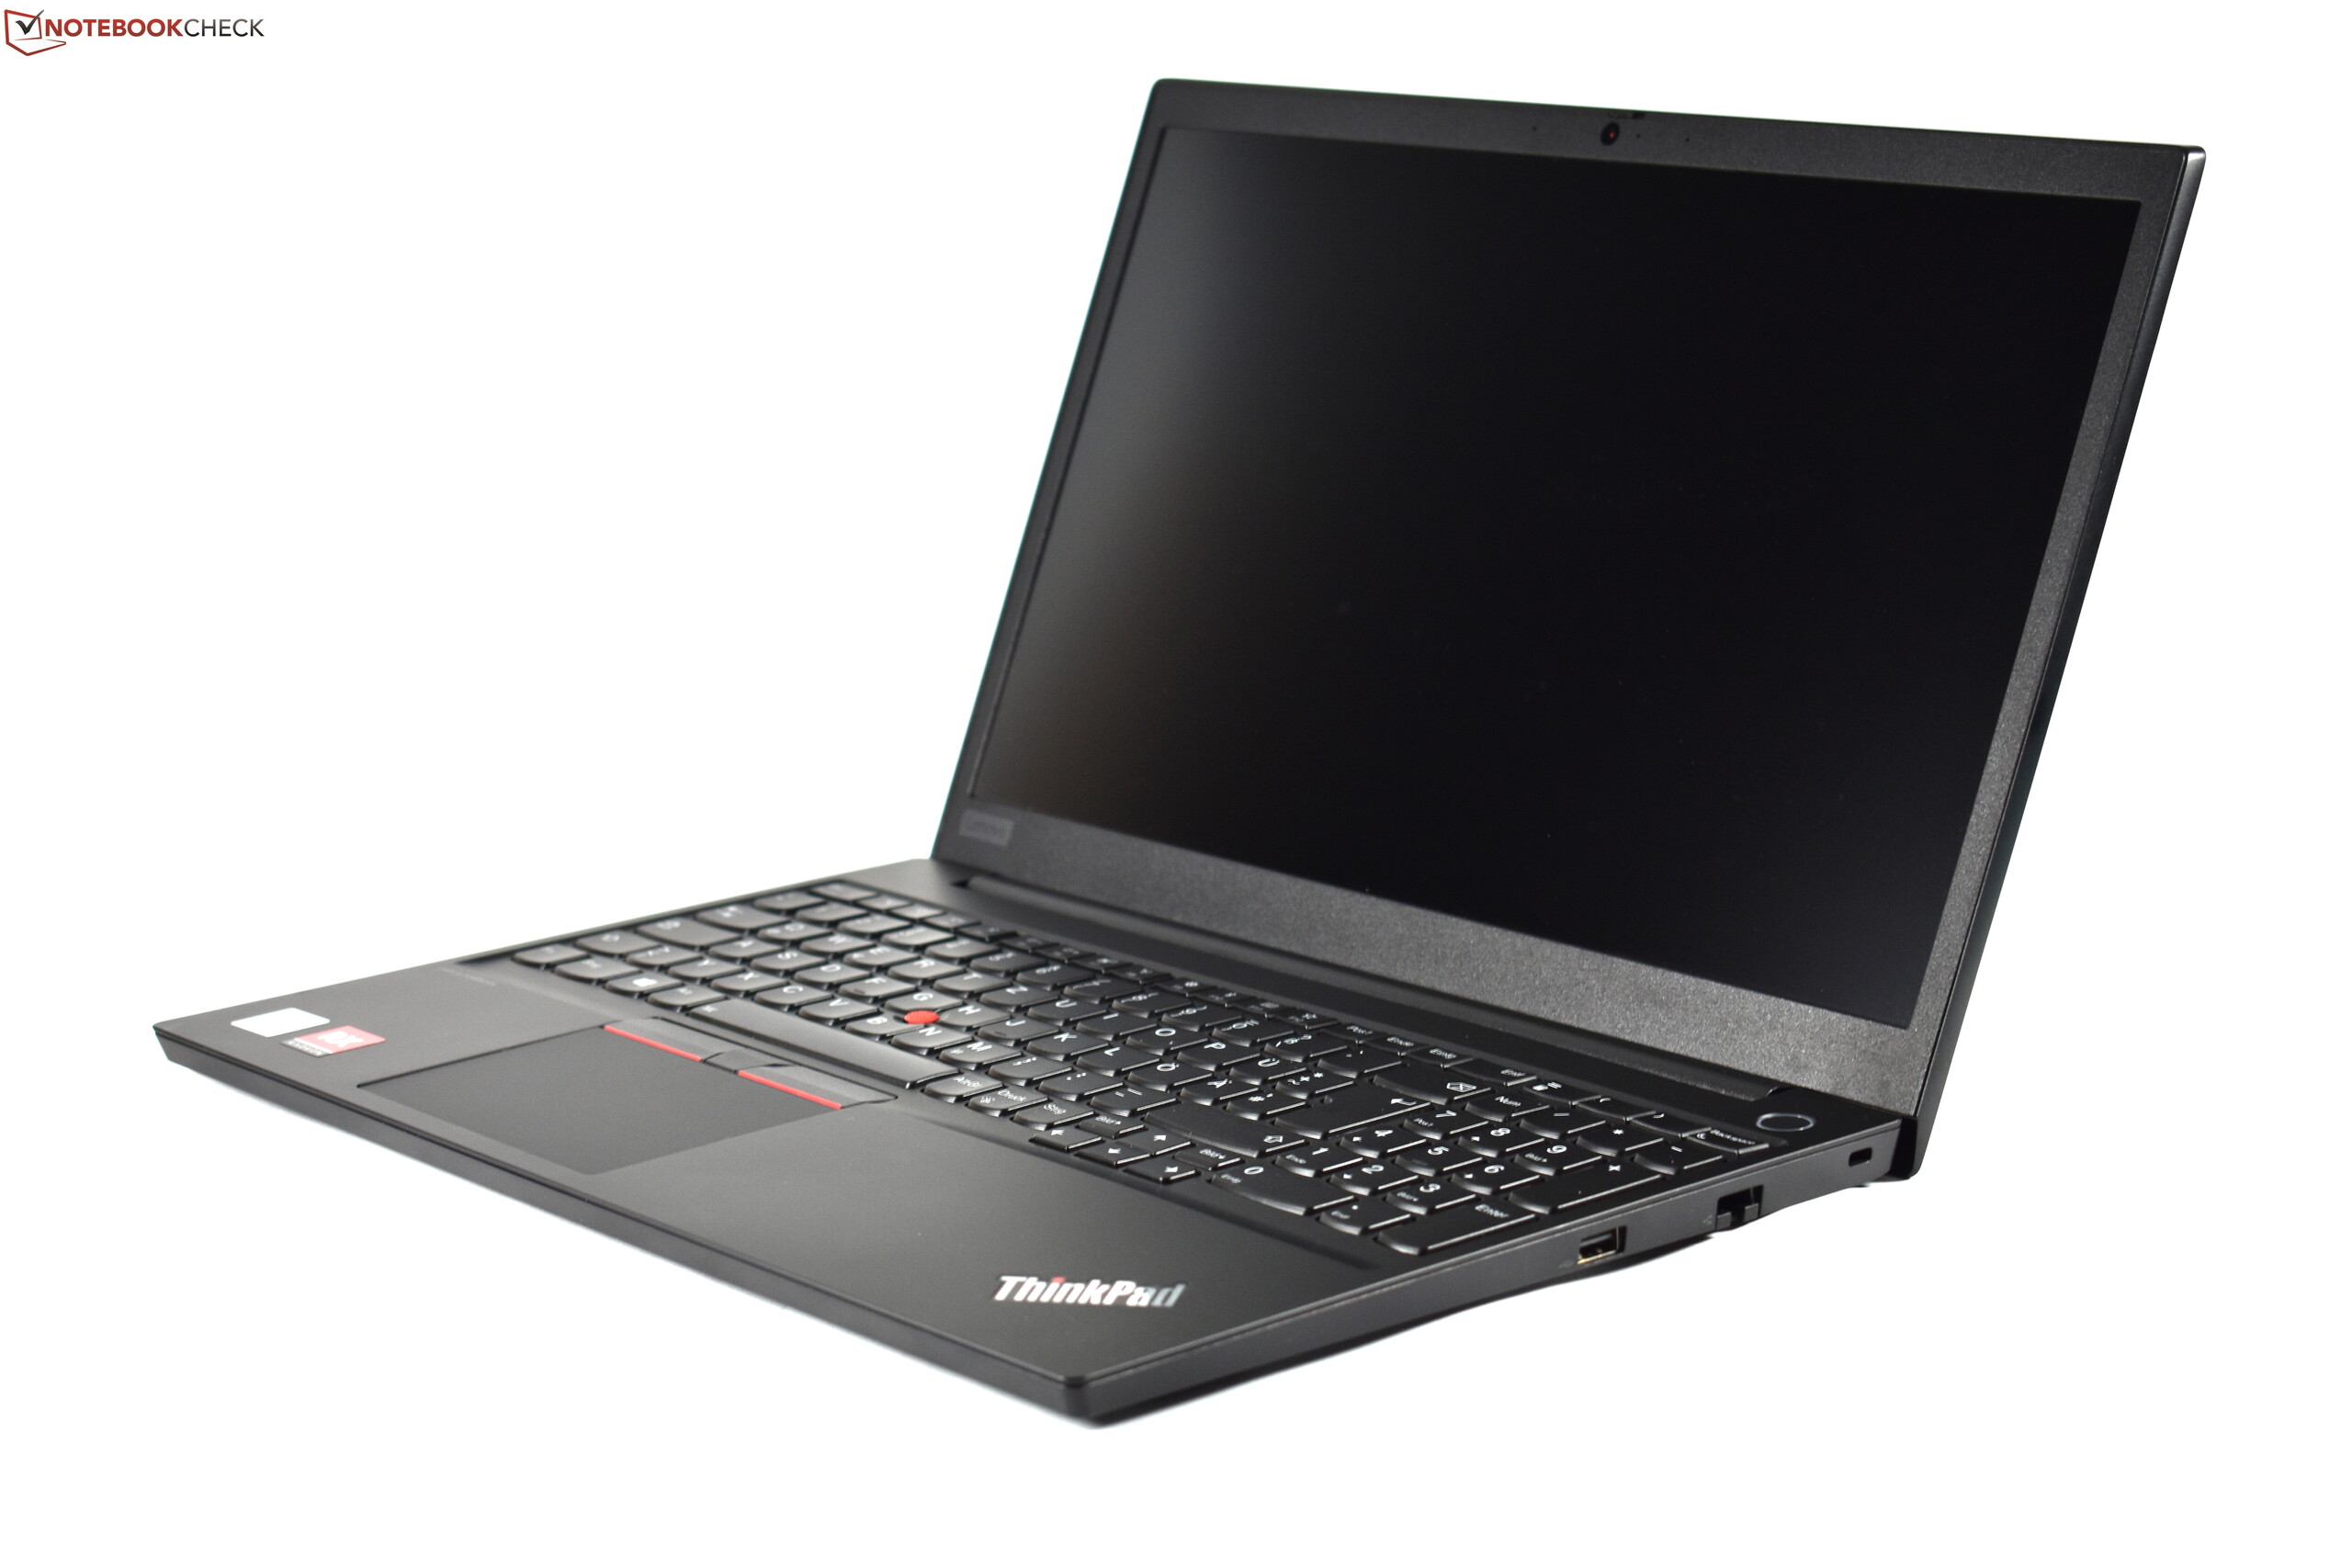
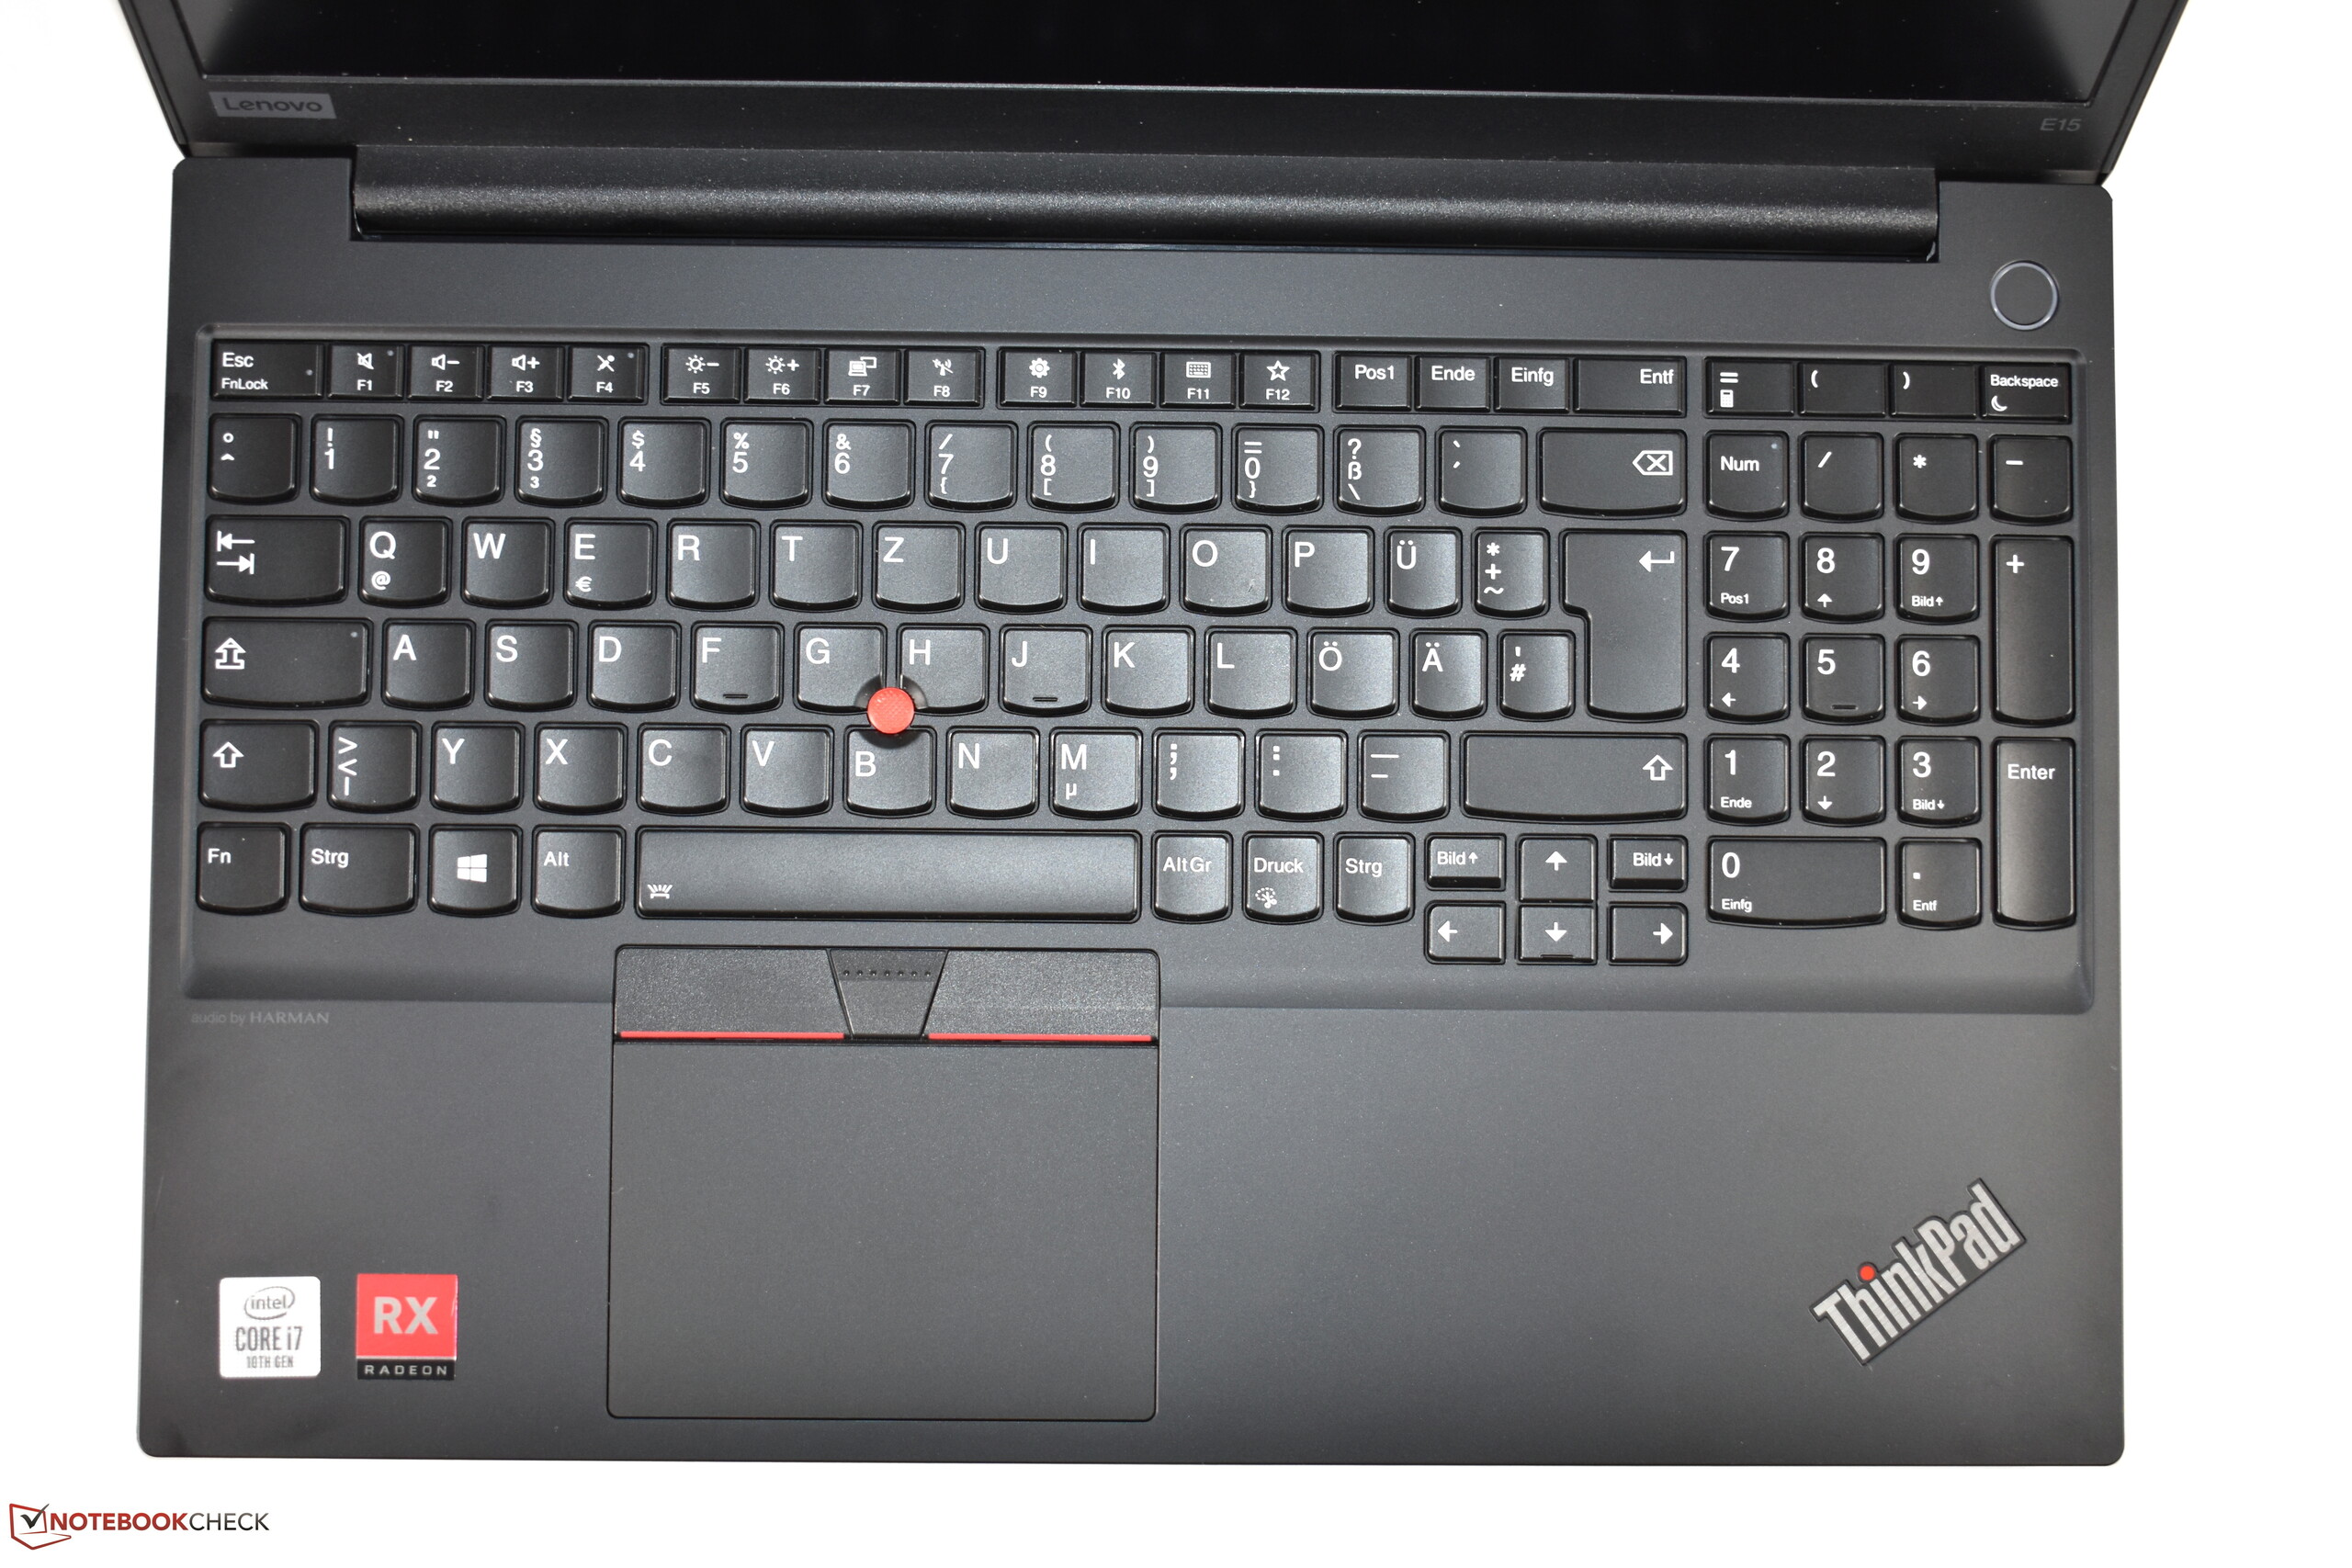
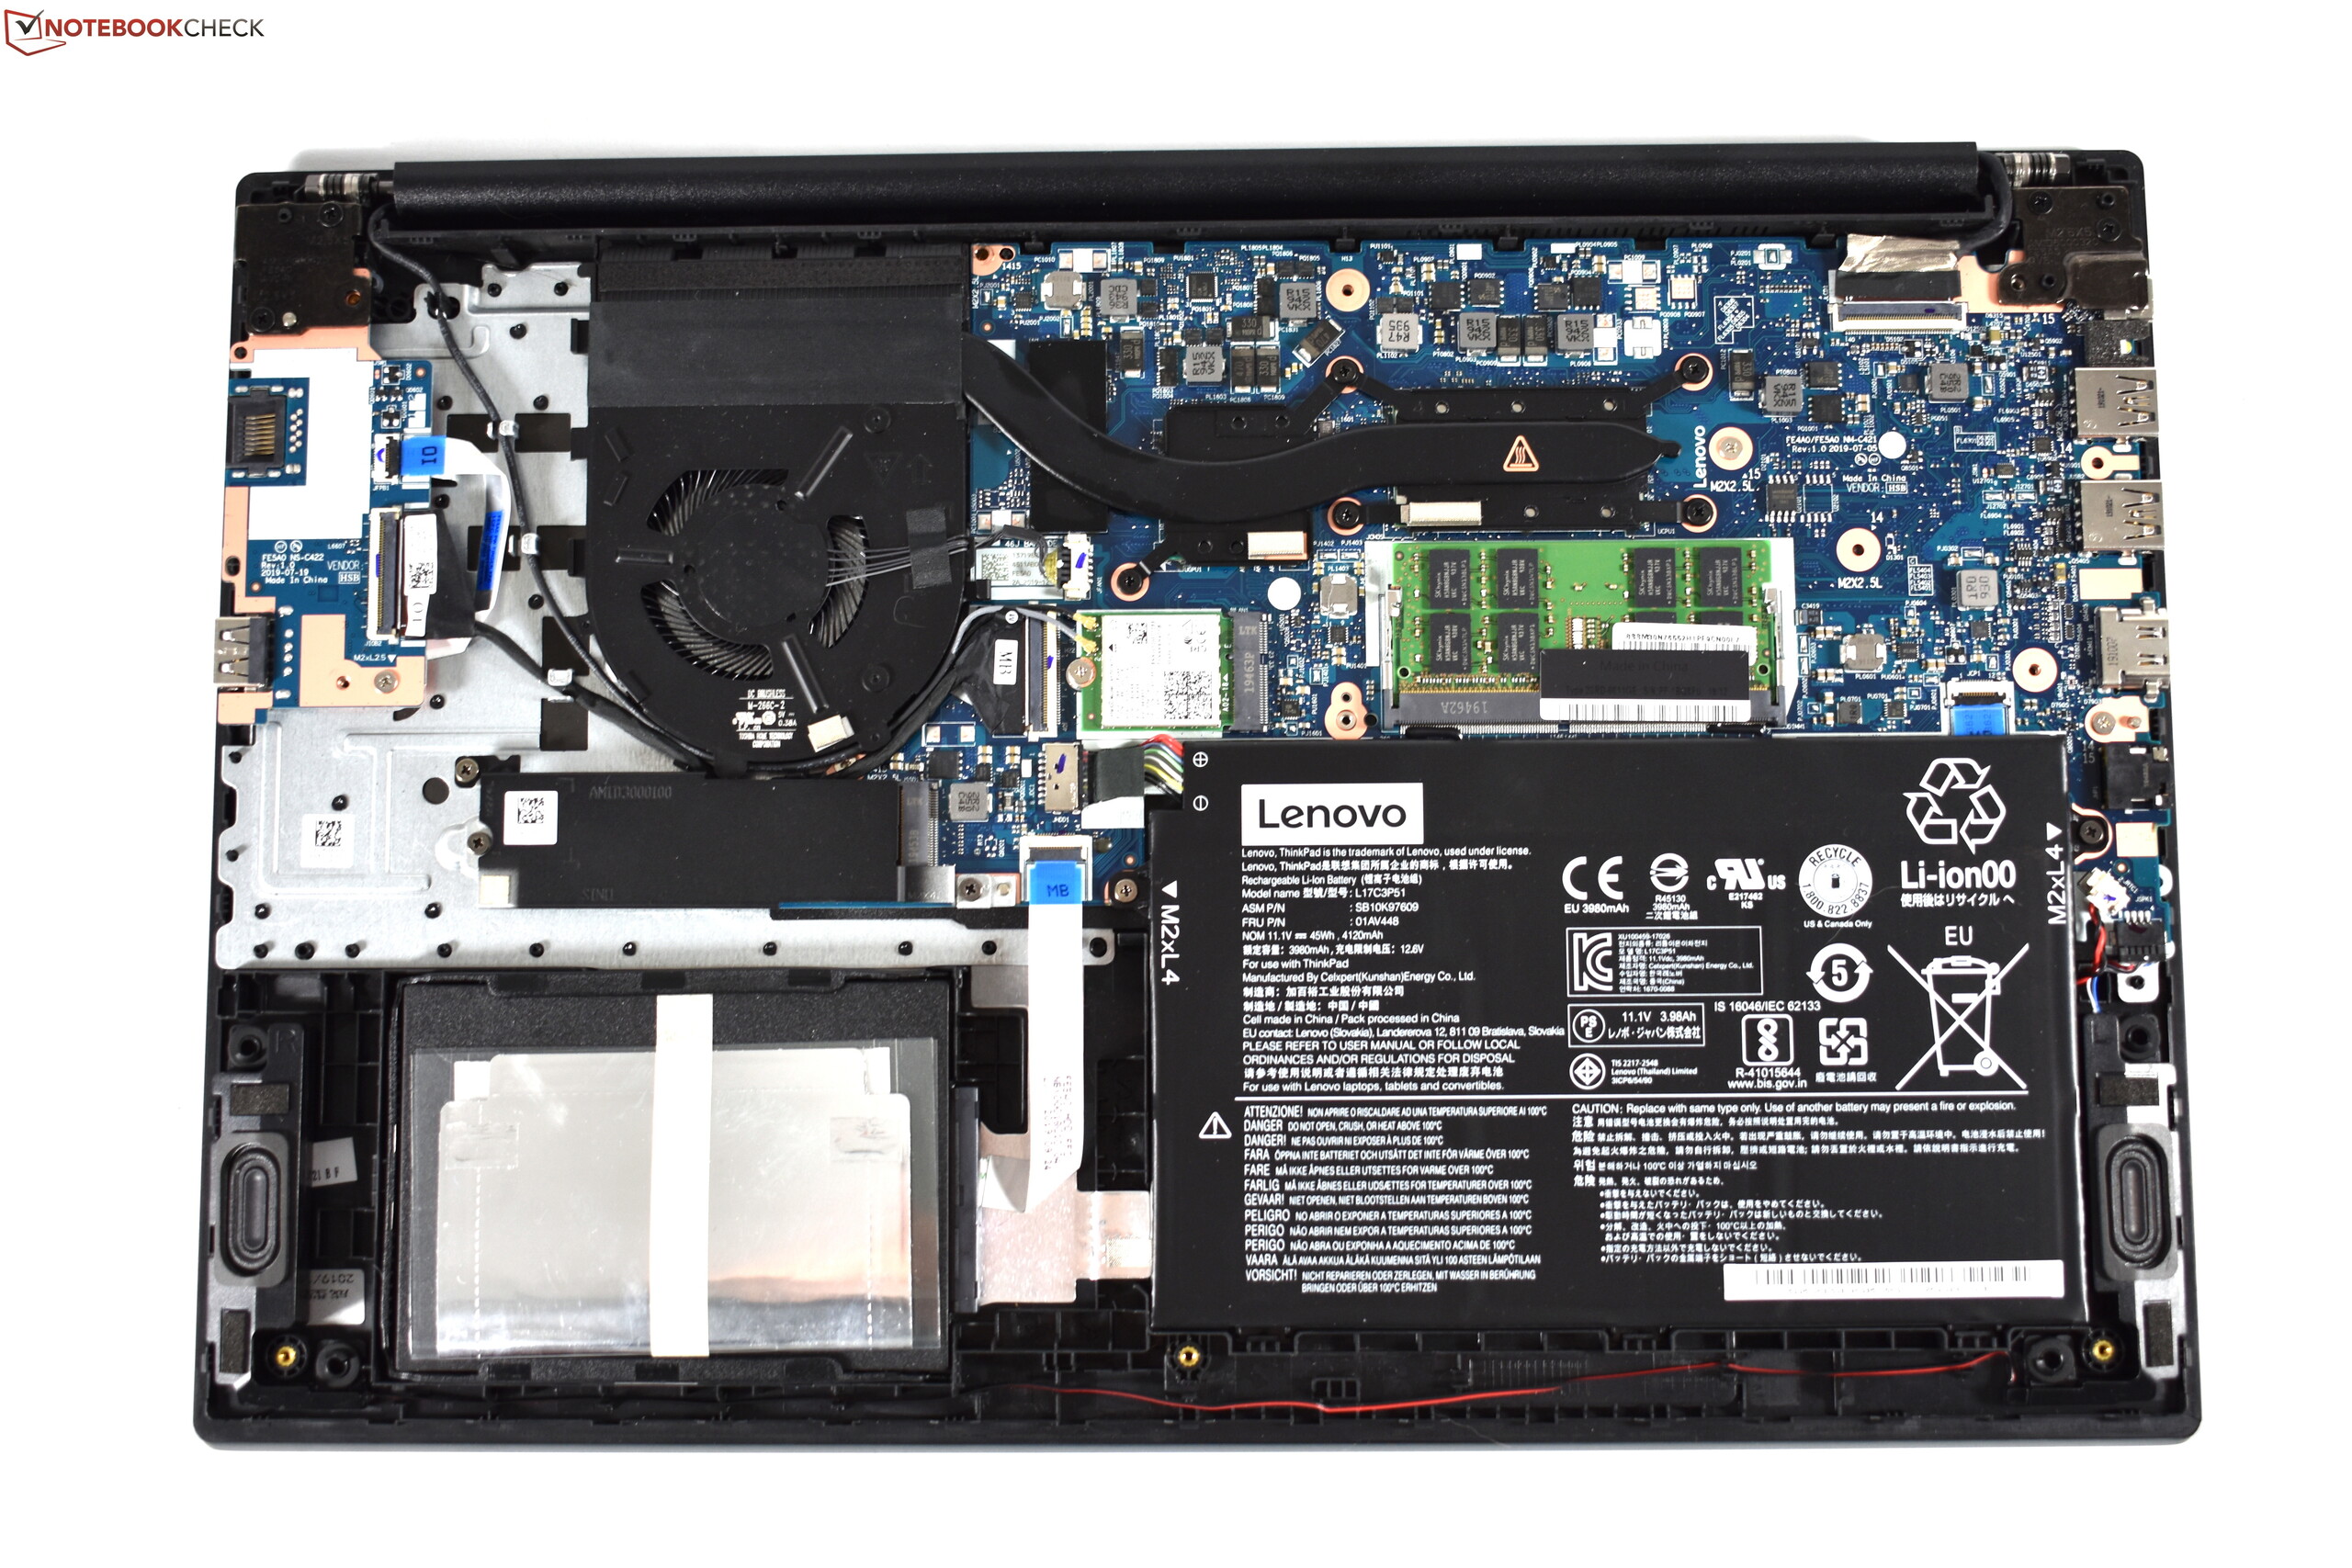
即使听起来像是ThinkPad E590的升级款:但事实是,ThinkPad E15与其前身仍然很像。产品的基本概念没有改变,但联想已在细节上进行了努力。仍然有非常好的ThinkPad键盘和TrackPoint,在这个价格区域中很少见。铝和塑料制成的机身坚固耐用,可升级性堪称典范-至少在大容量存储方面。
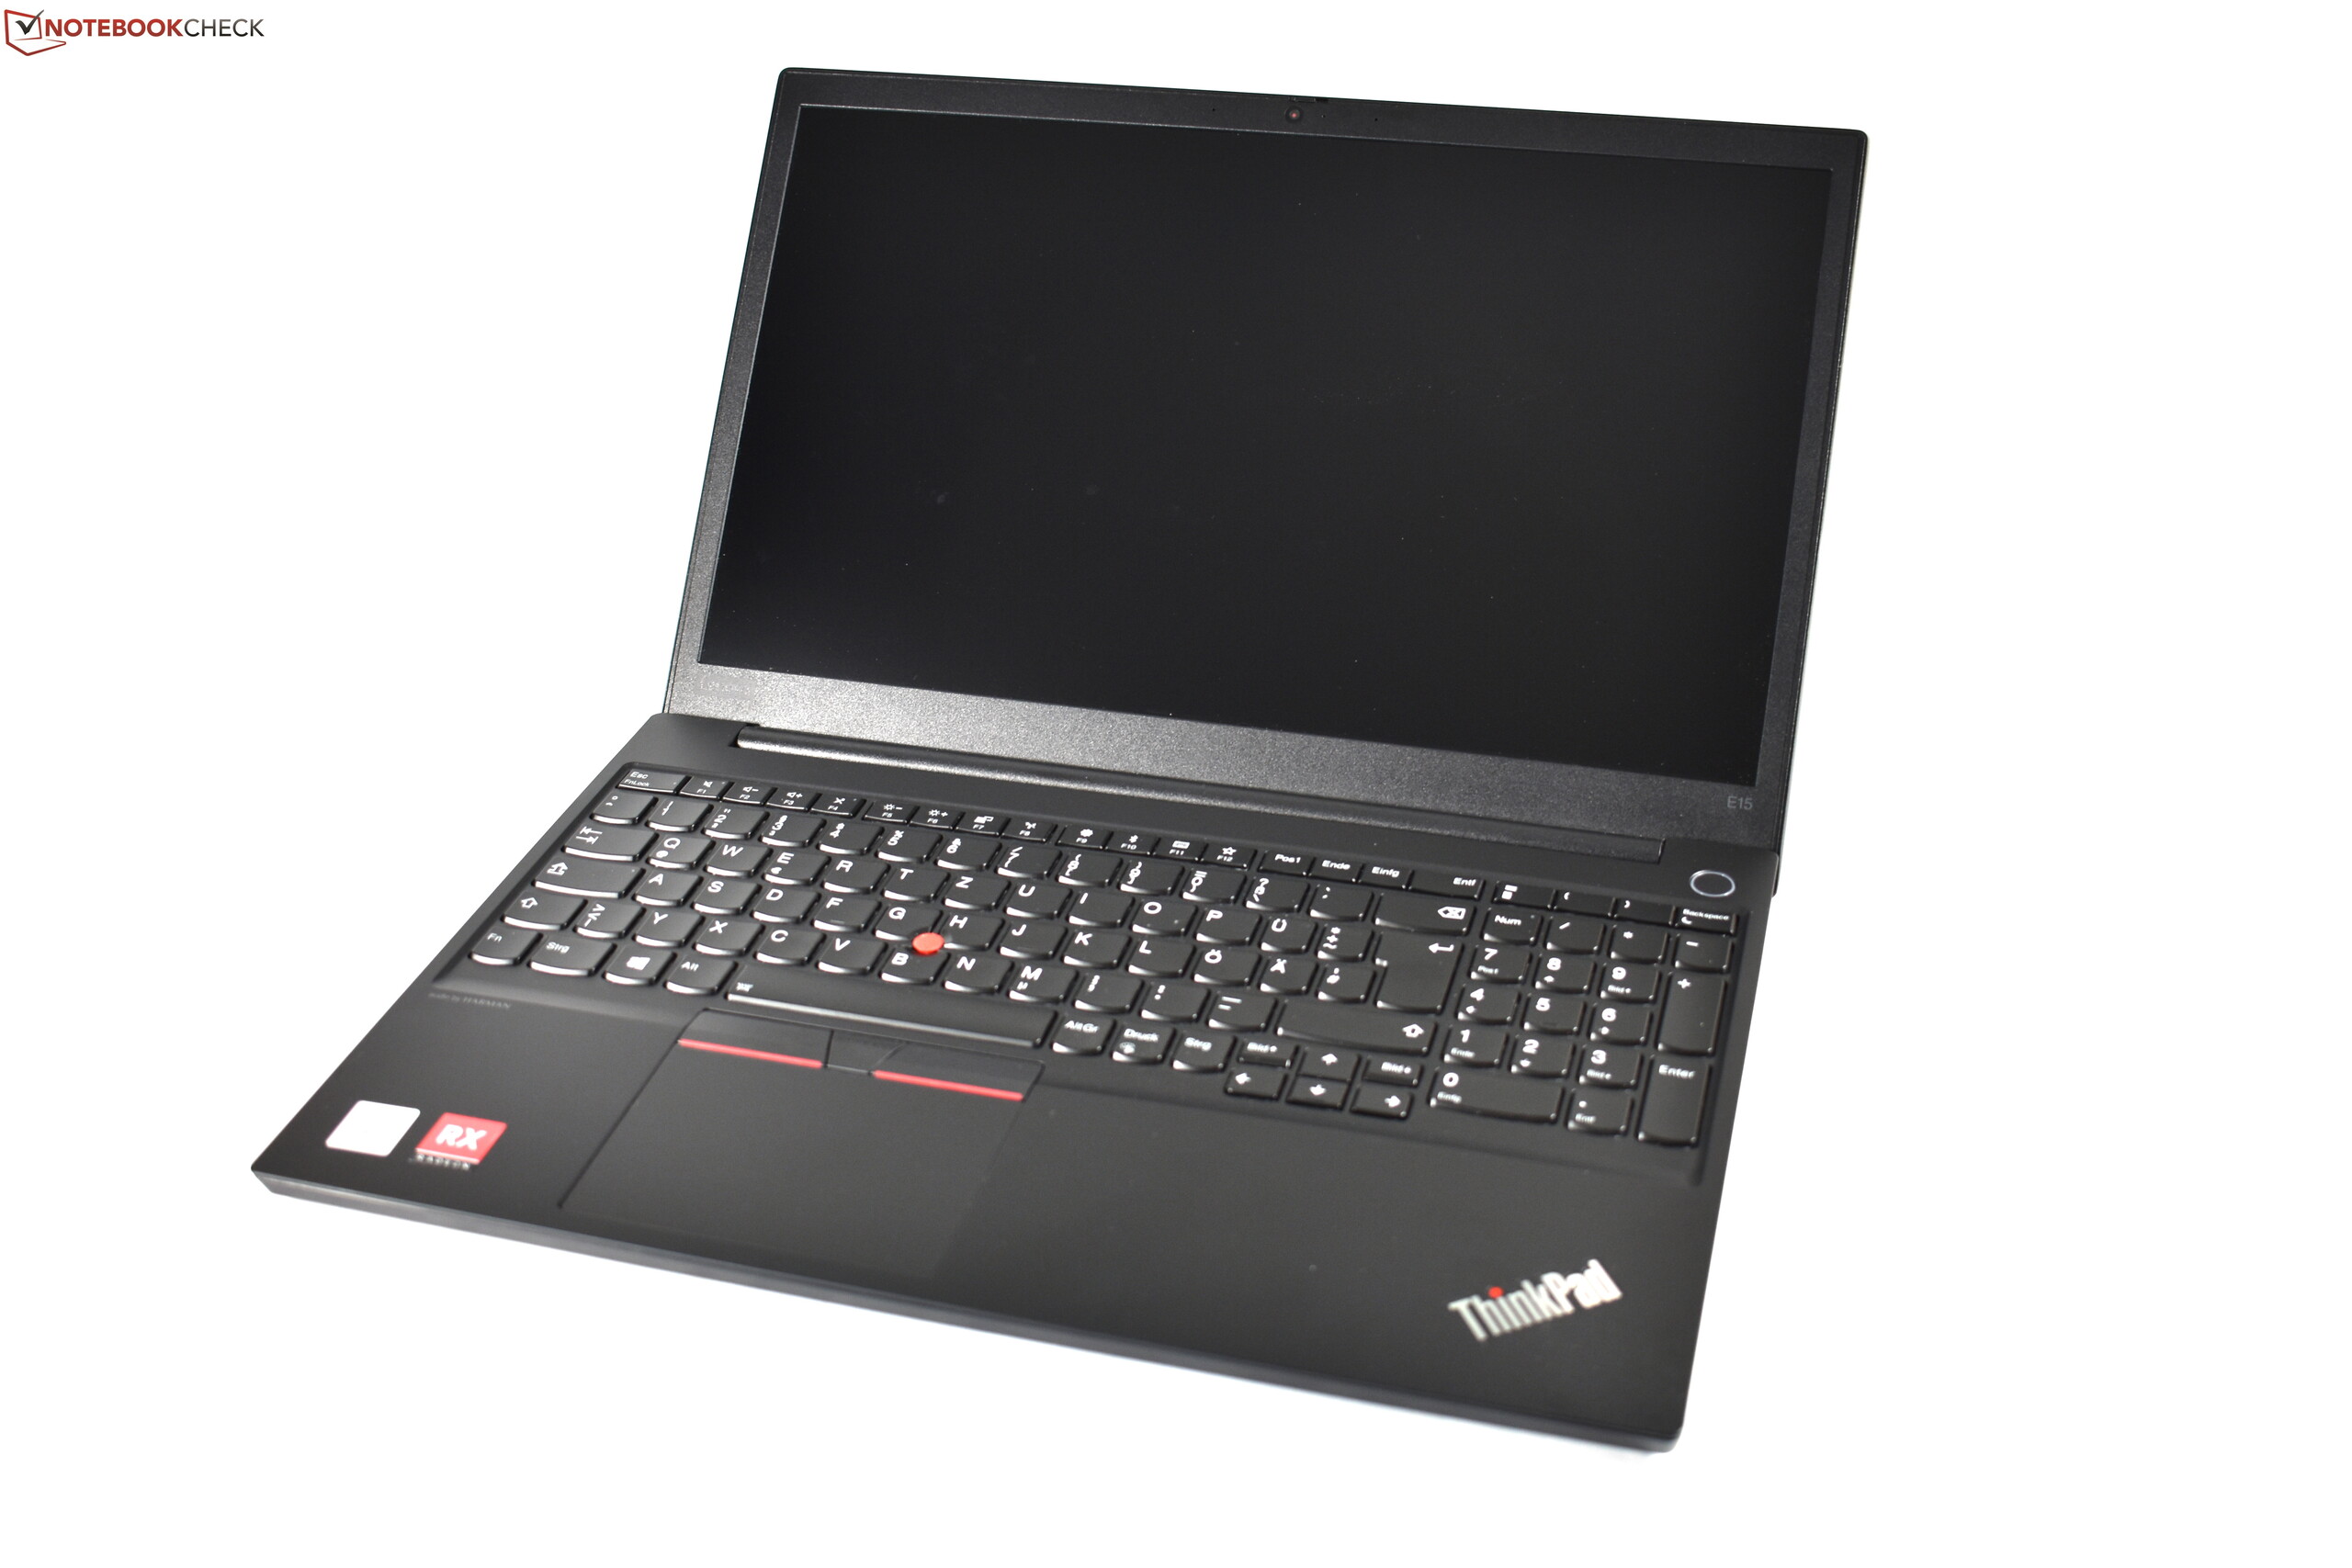
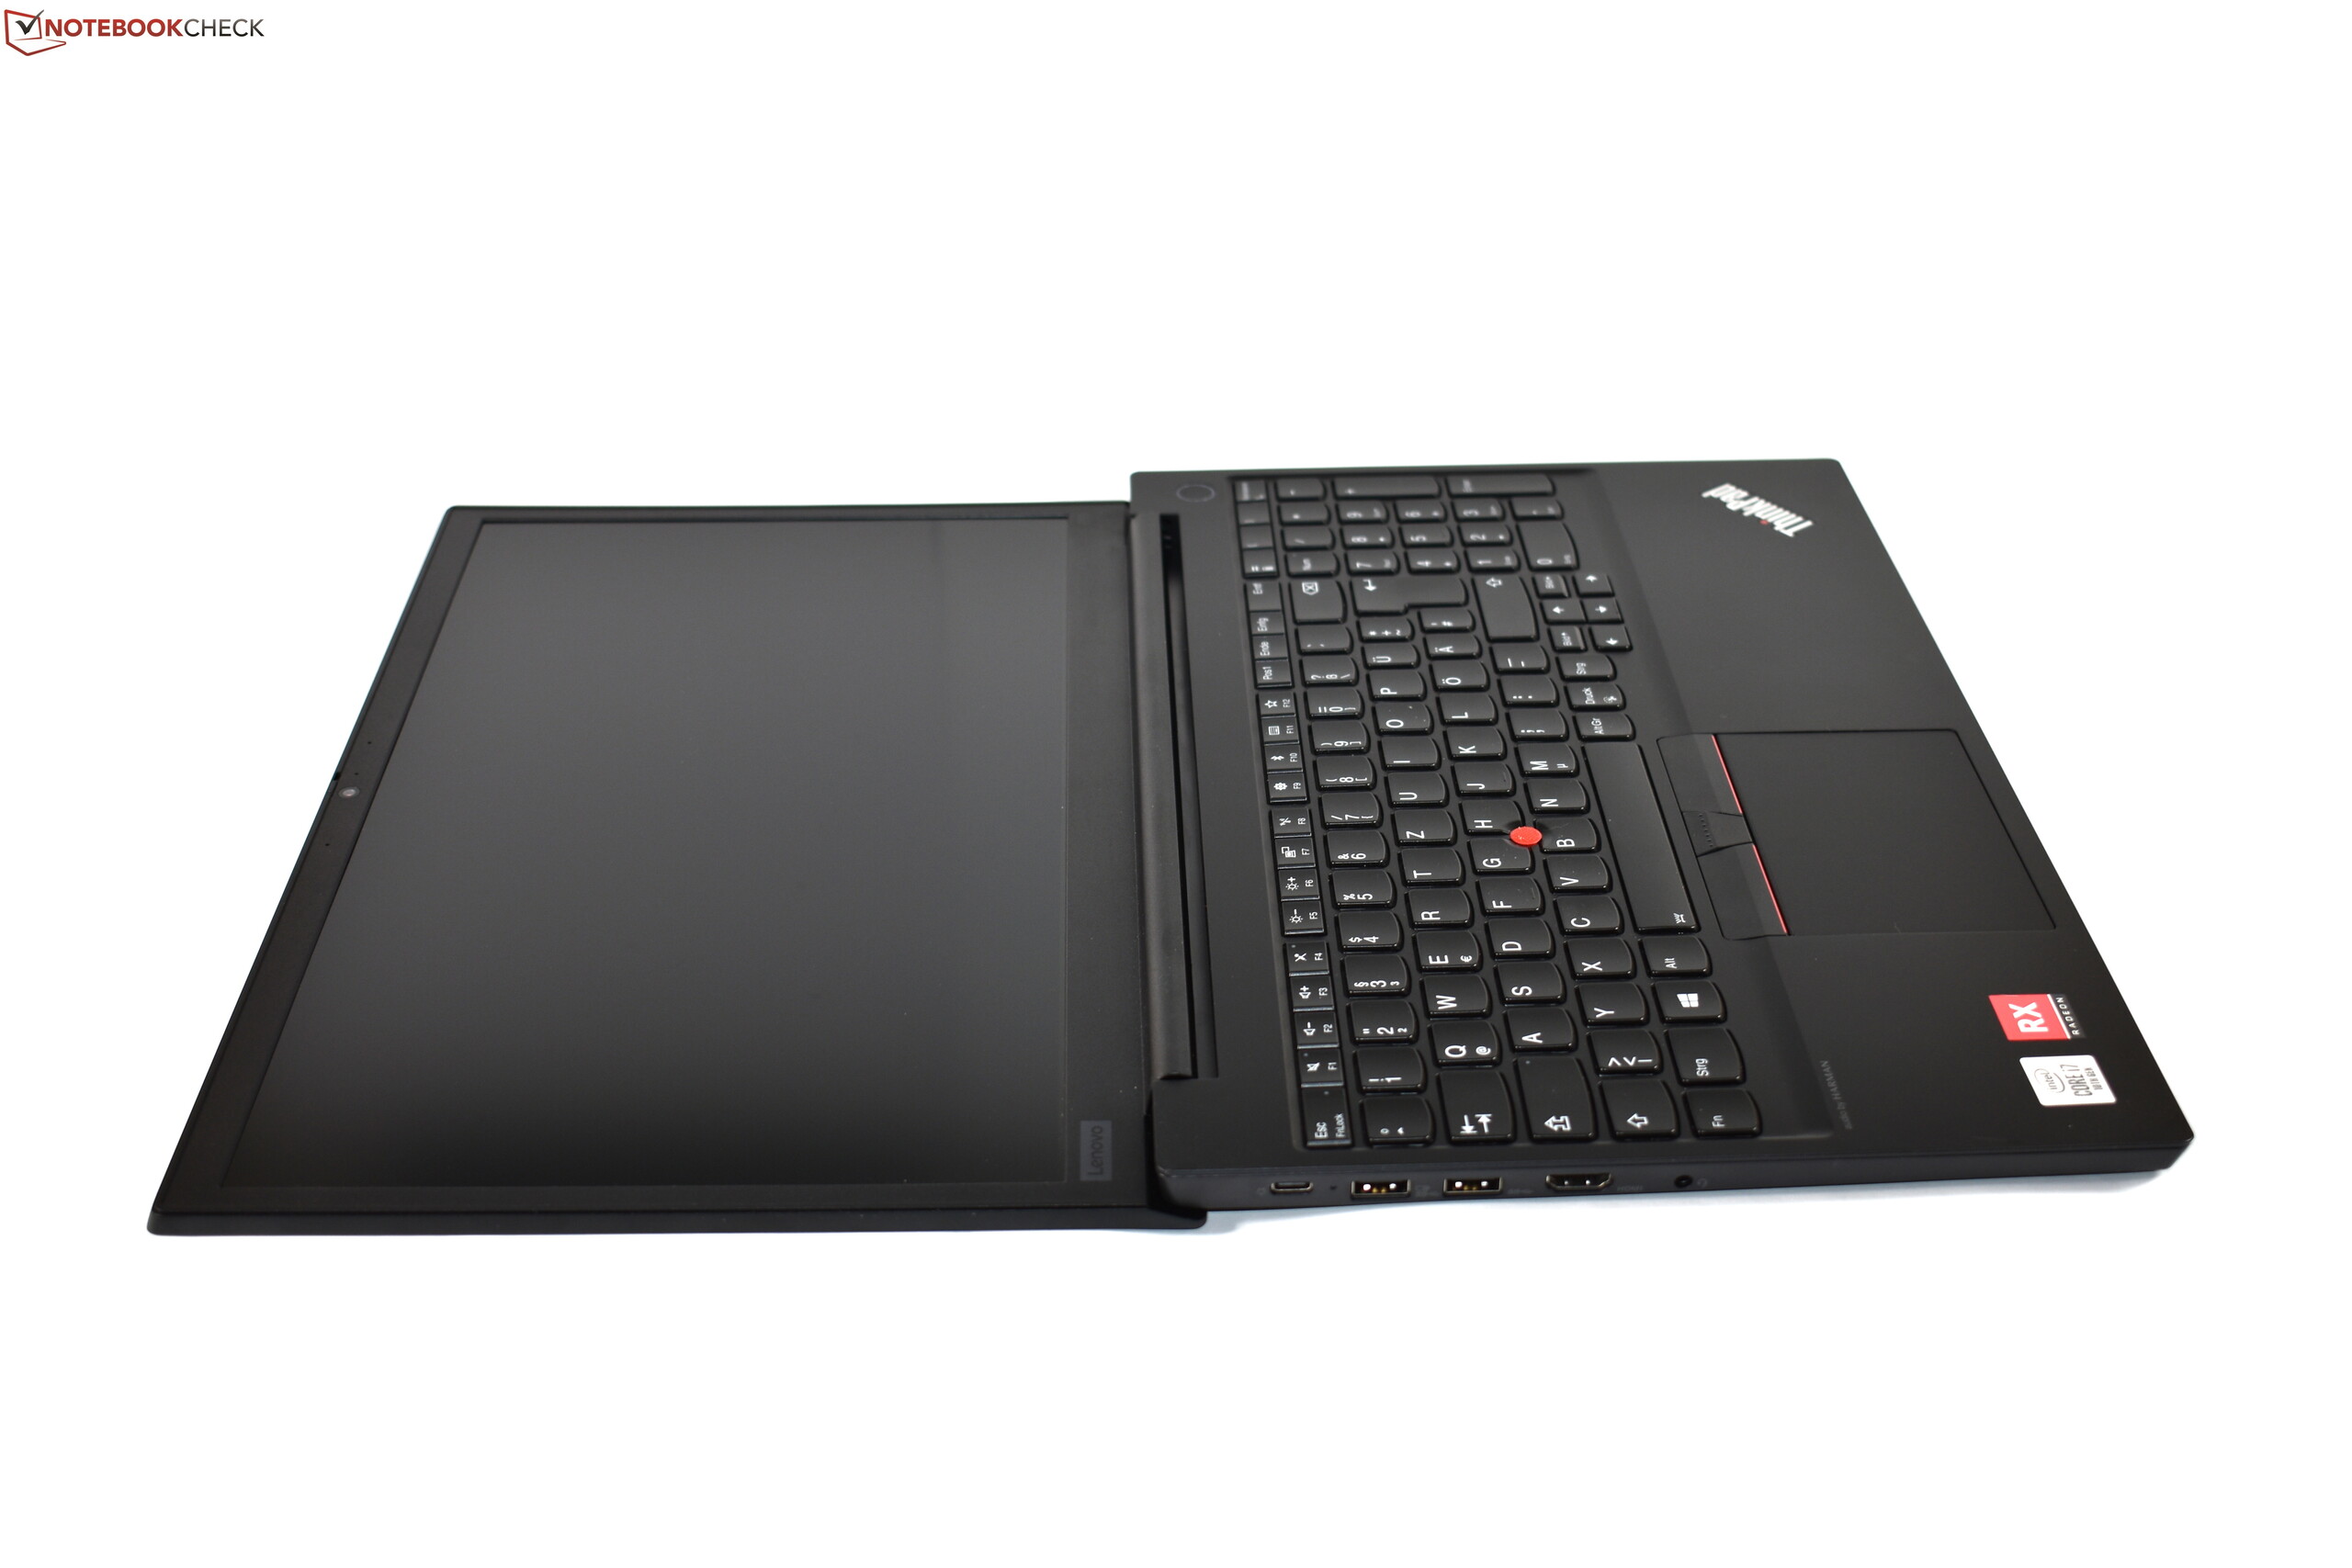
与较小的ThinkPad E14一样,使用较薄的机箱意味着某些功能会丢失。其中之一是microSD插槽。第二个RAM插槽也取消了。 E15与它的较小型号的不同之处在于,缺少的功能并不是这里最大的问题。对于ThinkPad E15,问题在于冷却系统,简直不堪重负。在压力测试中,ThinkPad必须大量限制CPU和GPU性能。在这种情况下,降频也可能发生在日常使用和玩游戏中。此外,机身温度非常高,最热处温度超过65°C。当然,这仅存在在压力测试中,但在要求不高的The Witcher 3测试中,机身变得几乎一样热。
温度太高:只有在散热压得住的情况下,才应内置独立GPU。不幸的是,联想ThinkPad E15并非如此。
总体而言,我们不建议为Lenovo ThinkPad E15选配独显。如果无法充分散热,则将无法发挥完全实力。同时,核显版本可能物有所值–作为ThinkPad E14的较大版本和适用于家庭办公的出色笔记本电脑。
Lenovo ThinkPad E15 20RD0011GE
- 03/17/2020 v7 (old)
Benjamin Herzig
Price comparison

