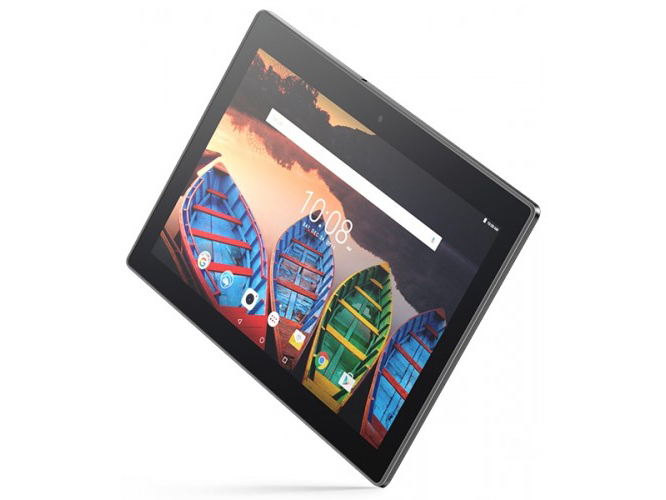
联想 Tab 3 10 Business TB3-X70L 平板电脑简短评测
| Networking | |
| iperf3 transmit AX12 | |
| Apple iPhone 7 (Klaus I211) | |
| OnePlus 3 | |
| Lenovo Tab 3 10 Business TB3-X70L | |
| iperf3 receive AX12 | |
| Apple iPhone 7 (Klaus I211) | |
| OnePlus 3 | |
| Lenovo Tab 3 10 Business TB3-X70L | |


| |||||||||||||||||||||||||
Brightness Distribution: 92 %
Center on Battery: 435 cd/m²
Contrast: 1279:1 (Black: 0.34 cd/m²)
ΔE ColorChecker Calman: 4.1 | ∀{0.5-29.43 Ø4.73}
ΔE Greyscale Calman: 4.4 | ∀{0.09-98 Ø4.97}
Gamma: 2.11
CCT: 7414 K
| Lenovo Tab 3 10 Business TB3-X70L IPS, 1920x1200, 10.1" | Huawei MediaPad M2 10 inch IPS, 1920x1200, 10.1" | HP Pro Tablet 10 EE G1 IPS, 1280x800, 10.1" | Samsung Galaxy Tab A 10.1 2016 SM-T585 TFT, 1920x1200, 10.1" | LG G Pad II 10.1 AH-IPS, 1920x1200, 10.1" | |
|---|---|---|---|---|---|
| Screen | -16% | -12% | -10% | -17% | |
| Brightness middle (cd/m²) | 435 | 385 -11% | 389 -11% | 542 25% | 355 -18% |
| Brightness (cd/m²) | 425 | 383 -10% | 357 -16% | 520 22% | 367 -14% |
| Brightness Distribution (%) | 92 | 91 -1% | 71 -23% | 91 -1% | 89 -3% |
| Black Level * (cd/m²) | 0.34 | 0.41 -21% | 0.41 -21% | 0.68 -100% | 0.53 -56% |
| Contrast (:1) | 1279 | 939 -27% | 949 -26% | 797 -38% | 670 -48% |
| Colorchecker dE 2000 * | 4.1 | 5.31 -30% | 4.64 -13% | 4.2 -2% | 3.2 22% |
| Colorchecker dE 2000 max. * | 8.5 | 8.57 -1% | 11.97 -41% | 6.7 21% | |
| Greyscale dE 2000 * | 4.4 | 5.58 -27% | 1.96 55% | 4.8 -9% | 4.36 1% |
| Gamma | 2.11 104% | 2.4 92% | 2.43 91% | 2.42 91% | 2.2 100% |
| CCT | 7414 88% | 7044 92% | 6414 101% | 7434 87% | 7240 90% |
| Color Space (Percent of AdobeRGB 1998) (%) | 38 | ||||
| Color Space (Percent of sRGB) (%) | 60 |
* ... smaller is better
Display Response Times
| ↔ Response Time Black to White | ||
|---|---|---|
| 26 ms ... rise ↗ and fall ↘ combined | ↗ 11 ms rise | 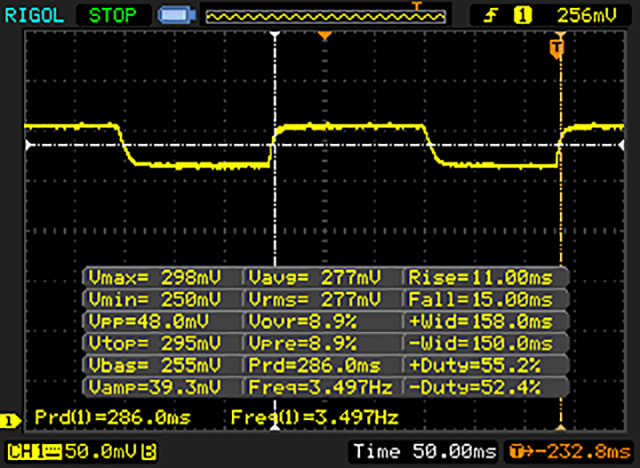 |
| ↘ 15 ms fall | ||
| The screen shows relatively slow response rates in our tests and may be too slow for gamers. In comparison, all tested devices range from 0.1 (minimum) to 240 (maximum) ms. » 62 % of all devices are better. This means that the measured response time is worse than the average of all tested devices (19.9 ms). | ||
| ↔ Response Time 50% Grey to 80% Grey | ||
| 40 ms ... rise ↗ and fall ↘ combined | ↗ 19 ms rise | 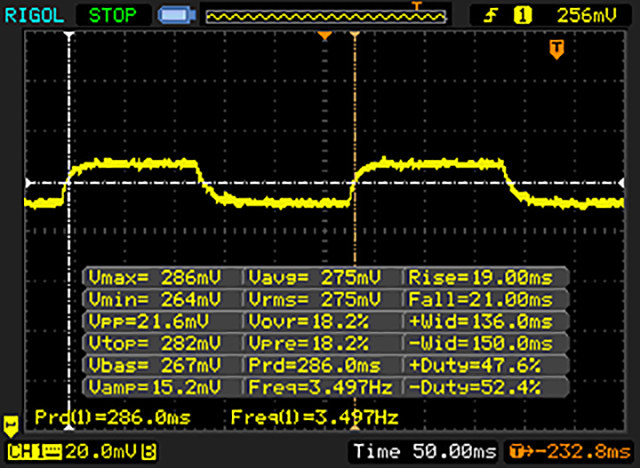 |
| ↘ 21 ms fall | ||
| The screen shows slow response rates in our tests and will be unsatisfactory for gamers. In comparison, all tested devices range from 0.165 (minimum) to 636 (maximum) ms. » 61 % of all devices are better. This means that the measured response time is worse than the average of all tested devices (31.1 ms). | ||
Screen Flickering / PWM (Pulse-Width Modulation)
| Screen flickering / PWM not detected | 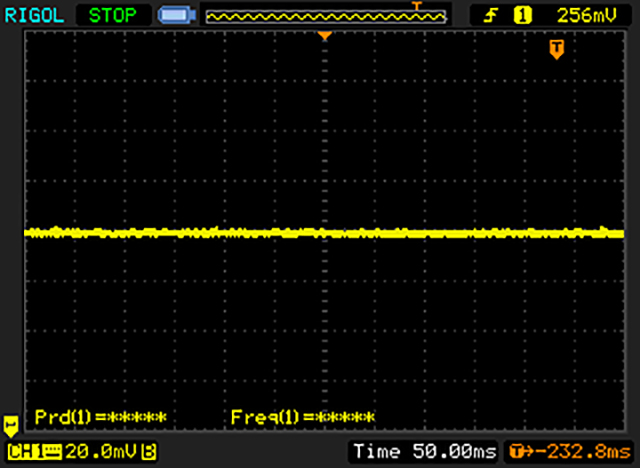 | ||
In comparison: 52 % of all tested devices do not use PWM to dim the display. If PWM was detected, an average of 7798 (minimum: 5 - maximum: 343500) Hz was measured. | |||
| AnTuTu v6 - Total Score | |
| Huawei MediaPad M2 10 inch | |
| Samsung Galaxy Tab A 10.1 2016 SM-T585 | |
| Lenovo Tab 3 10 Business TB3-X70L | |
| 3DMark | |
| 1280x720 offscreen Ice Storm Unlimited Score | |
| LG G Pad II 10.1 | |
| Huawei MediaPad M2 10 inch | |
| Samsung Galaxy Tab A 10.1 2016 SM-T585 | |
| Lenovo Tab 3 10 Business TB3-X70L | |
| 1280x720 offscreen Ice Storm Unlimited Graphics Score | |
| LG G Pad II 10.1 | |
| Huawei MediaPad M2 10 inch | |
| Samsung Galaxy Tab A 10.1 2016 SM-T585 | |
| Lenovo Tab 3 10 Business TB3-X70L | |
| 1280x720 offscreen Ice Storm Unlimited Physics | |
| LG G Pad II 10.1 | |
| Samsung Galaxy Tab A 10.1 2016 SM-T585 | |
| Huawei MediaPad M2 10 inch | |
| Lenovo Tab 3 10 Business TB3-X70L | |
| 2560x1440 Sling Shot OpenGL ES 3.0 | |
| Samsung Galaxy Tab A 10.1 2016 SM-T585 | |
| Lenovo Tab 3 10 Business TB3-X70L | |
| Huawei MediaPad M2 10 inch | |
| 2560x1440 Sling Shot OpenGL ES 3.0 Graphics | |
| Samsung Galaxy Tab A 10.1 2016 SM-T585 | |
| Lenovo Tab 3 10 Business TB3-X70L | |
| 2560x1440 Sling Shot OpenGL ES 3.0 Physics | |
| Samsung Galaxy Tab A 10.1 2016 SM-T585 | |
| Lenovo Tab 3 10 Business TB3-X70L | |
| GFXBench (DX / GLBenchmark) 2.7 | |
| T-Rex Onscreen | |
| LG G Pad II 10.1 | |
| Huawei MediaPad M2 10 inch | |
| Samsung Galaxy Tab A 10.1 2016 SM-T585 | |
| Lenovo Tab 3 10 Business TB3-X70L | |
| 1920x1080 T-Rex Offscreen | |
| LG G Pad II 10.1 | |
| Huawei MediaPad M2 10 inch | |
| Samsung Galaxy Tab A 10.1 2016 SM-T585 | |
| Lenovo Tab 3 10 Business TB3-X70L | |
| GFXBench 3.0 | |
| on screen Manhattan Onscreen OGL | |
| LG G Pad II 10.1 | |
| Huawei MediaPad M2 10 inch | |
| Samsung Galaxy Tab A 10.1 2016 SM-T585 | |
| Lenovo Tab 3 10 Business TB3-X70L | |
| 1920x1080 1080p Manhattan Offscreen | |
| LG G Pad II 10.1 | |
| Huawei MediaPad M2 10 inch | |
| Samsung Galaxy Tab A 10.1 2016 SM-T585 | |
| Lenovo Tab 3 10 Business TB3-X70L | |
| GFXBench 3.1 | |
| on screen Manhattan ES 3.1 Onscreen | |
| Lenovo Tab 3 10 Business TB3-X70L | |
| Samsung Galaxy Tab A 10.1 2016 SM-T585 | |
| 1920x1080 Manhattan ES 3.1 Offscreen | |
| Lenovo Tab 3 10 Business TB3-X70L | |
| Samsung Galaxy Tab A 10.1 2016 SM-T585 | |
| PCMark for Android - Work performance score | |
| Samsung Galaxy Tab A 10.1 2016 SM-T585 | |
| Huawei MediaPad M2 10 inch | |
| Lenovo Tab 3 10 Business TB3-X70L | |
| LG G Pad II 10.1 | |
| Geekbench 4.0 | |
| 64 Bit Single-Core Score | |
| Lenovo Tab 3 10 Business TB3-X70L | |
| 64 Bit Multi-Core Score | |
| Lenovo Tab 3 10 Business TB3-X70L | |
| Compute RenderScript Score | |
| Lenovo Tab 3 10 Business TB3-X70L | |
| Octane V2 - Total Score | |
| LG G Pad II 10.1 | |
| Huawei MediaPad M2 10 inch | |
| Samsung Galaxy Tab A 10.1 2016 SM-T585 | |
| HP Pro Tablet 10 EE G1 | |
| Lenovo Tab 3 10 Business TB3-X70L | |
| Mozilla Kraken 1.1 - Total | |
| Lenovo Tab 3 10 Business TB3-X70L | |
| Huawei MediaPad M2 10 inch | |
| Samsung Galaxy Tab A 10.1 2016 SM-T585 | |
| HP Pro Tablet 10 EE G1 | |
| LG G Pad II 10.1 | |
| JetStream 1.1 - 1.1 Total | |
| Huawei MediaPad M2 10 inch | |
| HP Pro Tablet 10 EE G1 | |
| Samsung Galaxy Tab A 10.1 2016 SM-T585 | |
| Lenovo Tab 3 10 Business TB3-X70L | |
| WebXPRT 2015 - Overall | |
| Huawei MediaPad M2 10 inch | |
| LG G Pad II 10.1 | |
| Samsung Galaxy Tab A 10.1 2016 SM-T585 | |
| Lenovo Tab 3 10 Business TB3-X70L | |
* ... smaller is better
| Asphalt 8: Airborne | |||
| Settings | Value | ||
| high | 18 fps | ||
| very low | 29 fps | ||
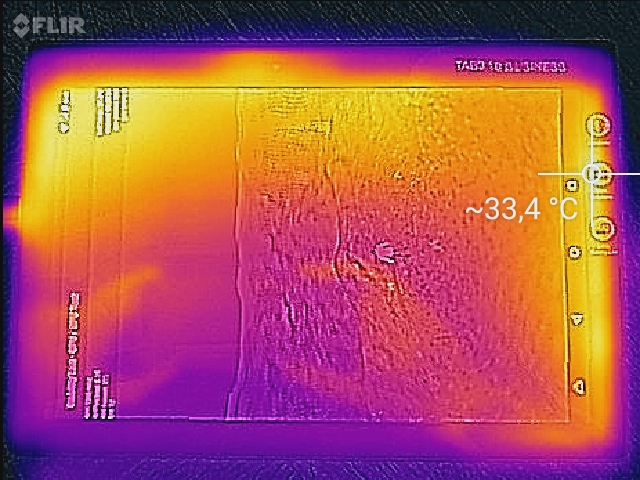
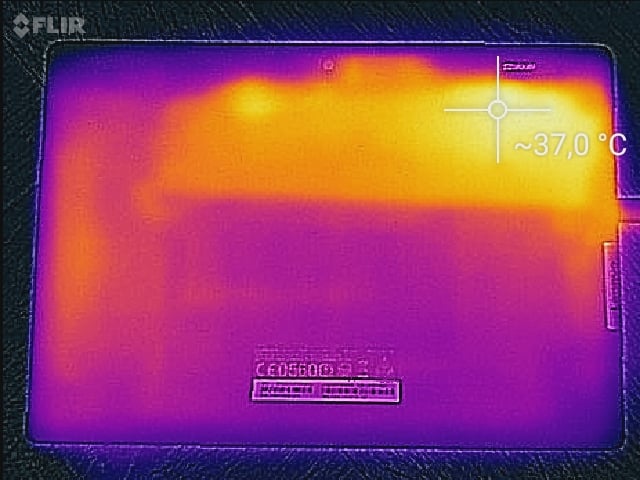
(+) The maximum temperature on the upper side is 34.1 °C / 93 F, compared to the average of 33.6 °C / 92 F, ranging from 20.7 to 53.2 °C for the class Tablet.
(+) The bottom heats up to a maximum of 35.3 °C / 96 F, compared to the average of 33.2 °C / 92 F
(+) In idle usage, the average temperature for the upper side is 31.3 °C / 88 F, compared to the device average of 30 °C / 86 F.
Lenovo Tab 3 10 Business TB3-X70L audio analysis
(+) | speakers can play relatively loud (84.3 dB)
Bass 100 - 315 Hz
(-) | nearly no bass - on average 32.7% lower than median
(±) | linearity of bass is average (11.7% delta to prev. frequency)
Mids 400 - 2000 Hz
(+) | balanced mids - only 4.3% away from median
(±) | linearity of mids is average (7.2% delta to prev. frequency)
Highs 2 - 16 kHz
(+) | balanced highs - only 3.9% away from median
(+) | highs are linear (3.8% delta to prev. frequency)
Overall 100 - 16.000 Hz
(±) | linearity of overall sound is average (24.1% difference to median)
Compared to same class
» 76% of all tested devices in this class were better, 5% similar, 19% worse
» The best had a delta of 7%, average was 20%, worst was 129%
Compared to all devices tested
» 73% of all tested devices were better, 6% similar, 22% worse
» The best had a delta of 4%, average was 24%, worst was 134%
Huawei MediaPad M2 10 inch audio analysis
(+) | speakers can play relatively loud (91.2 dB)
Bass 100 - 315 Hz
(-) | nearly no bass - on average 25.1% lower than median
(±) | linearity of bass is average (11.9% delta to prev. frequency)
Mids 400 - 2000 Hz
(+) | balanced mids - only 1.6% away from median
(+) | mids are linear (3.1% delta to prev. frequency)
Highs 2 - 16 kHz
(+) | balanced highs - only 3.8% away from median
(+) | highs are linear (3.1% delta to prev. frequency)
Overall 100 - 16.000 Hz
(±) | linearity of overall sound is average (17.7% difference to median)
Compared to same class
» 44% of all tested devices in this class were better, 6% similar, 50% worse
» The best had a delta of 7%, average was 20%, worst was 129%
Compared to all devices tested
» 35% of all tested devices were better, 8% similar, 57% worse
» The best had a delta of 4%, average was 24%, worst was 134%
Samsung Galaxy Tab A 10.1 2016 SM-T585 audio analysis
(+) | speakers can play relatively loud (89.4 dB)
Bass 100 - 315 Hz
(-) | nearly no bass - on average 35.7% lower than median
(±) | linearity of bass is average (11% delta to prev. frequency)
Mids 400 - 2000 Hz
(+) | balanced mids - only 4.2% away from median
(+) | mids are linear (5.2% delta to prev. frequency)
Highs 2 - 16 kHz
(+) | balanced highs - only 4.1% away from median
(+) | highs are linear (3.5% delta to prev. frequency)
Overall 100 - 16.000 Hz
(±) | linearity of overall sound is average (21.9% difference to median)
Compared to same class
» 67% of all tested devices in this class were better, 5% similar, 28% worse
» The best had a delta of 7%, average was 20%, worst was 129%
Compared to all devices tested
» 63% of all tested devices were better, 7% similar, 31% worse
» The best had a delta of 4%, average was 24%, worst was 134%
| Off / Standby | |
| Idle | |
| Load |
|
Key:
min: | |
| Lenovo Tab 3 10 Business TB3-X70L 7000 mAh | Huawei MediaPad M2 10 inch 6660 mAh | HP Pro Tablet 10 EE G1 mAh | Samsung Galaxy Tab A 10.1 2016 SM-T585 7300 mAh | LG G Pad II 10.1 7400 mAh | |
|---|---|---|---|---|---|
| Power Consumption | 11% | -42% | 16% | -46% | |
| Idle Minimum * (Watt) | 1.7 | 1.6 6% | 3.5 -106% | 1.18 31% | 3.6 -112% |
| Idle Average * (Watt) | 4.4 | 4.13 6% | 5.5 -25% | 4.65 -6% | 6.2 -41% |
| Idle Maximum * (Watt) | 4.7 | 4.22 10% | 5.7 -21% | 4.74 -1% | 6.3 -34% |
| Load Average * (Watt) | 8.4 | 6.57 22% | 10.7 -27% | 5.75 32% | 10 -19% |
| Load Maximum * (Watt) | 9.2 | 8.32 10% | 12.2 -33% | 6.97 24% | 11.4 -24% |
* ... smaller is better
| Lenovo Tab 3 10 Business TB3-X70L 7000 mAh | Huawei MediaPad M2 10 inch 6660 mAh | HP Pro Tablet 10 EE G1 mAh | Samsung Galaxy Tab A 10.1 2016 SM-T585 7300 mAh | LG G Pad II 10.1 7400 mAh | |
|---|---|---|---|---|---|
| Battery runtime | 2% | -23% | 76% | 46% | |
| Reader / Idle (h) | 16.3 | 16.5 1% | 43.9 169% | 27.9 71% | |
| H.264 (h) | 9.8 | 10 2% | 14.9 52% | 17 73% | |
| WiFi v1.3 (h) | 10 | 11.6 16% | 7.7 -23% | 13.8 38% | 13 30% |
| Load (h) | 4.9 | 4.4 -10% | 7.1 45% | 5.4 10% |
Pros
Cons
联想Tab 3 10 Business有一些很明显的优势:出色的屏幕和丰富的设置选项。它的散热控制很优秀,移动网络模组也十分可靠。而这些只需要300欧元(约2258人民币)。
不过它也有一个严重问题:这台平板电脑的性能相比同类设备低了很多。它很难满足游戏的需要,甚至上网浏览都会遇到困难。
值得庆幸的是,联想没有给它预装垃圾软件,也提供了不错的相机和可靠的GPS模组。它甚至具备一定的防尘防水功能呢个。当然,它不是为建筑工地设计的,但至少有一定的防护性。如果你在寻找更坚固的设备,那么我们推荐松下三防平板电脑或惠普 Pro Tablet 10。
联想Tab 3 10 Business是一款优秀,实惠的办公平板。性能不高,却功能丰富。
它的传统的设计也是一个优势。需要平板电脑用于上网冲浪或玩游戏的用户,可以考虑三星 Galaxy Tab A 10.1。
注:本文是基于完整评测的缩减版本,阅读完整的英文评测,请点击这里。
Lenovo Tab 3 10 Business TB3-X70L
- 10/20/2016 v5.1 (old)
Florian Wimmer