惠普 ProBook 640 G3 (7200U, 全高清) 商务本简短评测
| SD Card Reader | |
| average JPG Copy Test (av. of 3 runs) | |
| Dell Latitude 14 E5470 | |
| Dell Latitude 14 E5470 | |
| HP ProBook 640 G2-T9X60ET | |
| Acer TravelMate P648-M-757N | |
| HP ProBook 640 G3 Z2W33ET | |
| Lenovo ThinkPad L460-20FVS01400 | |
| maximum AS SSD Seq Read Test (1GB) | |
| Dell Latitude 14 E5470 | |
| Dell Latitude 14 E5470 | |
| HP ProBook 640 G2-T9X60ET | |
| Lenovo ThinkPad L460-20FVS01400 | |
| HP ProBook 640 G3 Z2W33ET | |
| Networking | |
| iperf3 transmit AX12 | |
| HP ProBook 640 G3 Z2W33ET (jseb) | |
| Dell Latitude 14 E5470 (jseb) | |
| iperf3 receive AX12 | |
| Dell Latitude 14 E5470 (jseb) | |
| HP ProBook 640 G3 Z2W33ET (jseb) | |
| |||||||||||||||||||||||||
Brightness Distribution: 88 %
Center on Battery: 360 cd/m²
Contrast: 497:1 (Black: 0.69 cd/m²)
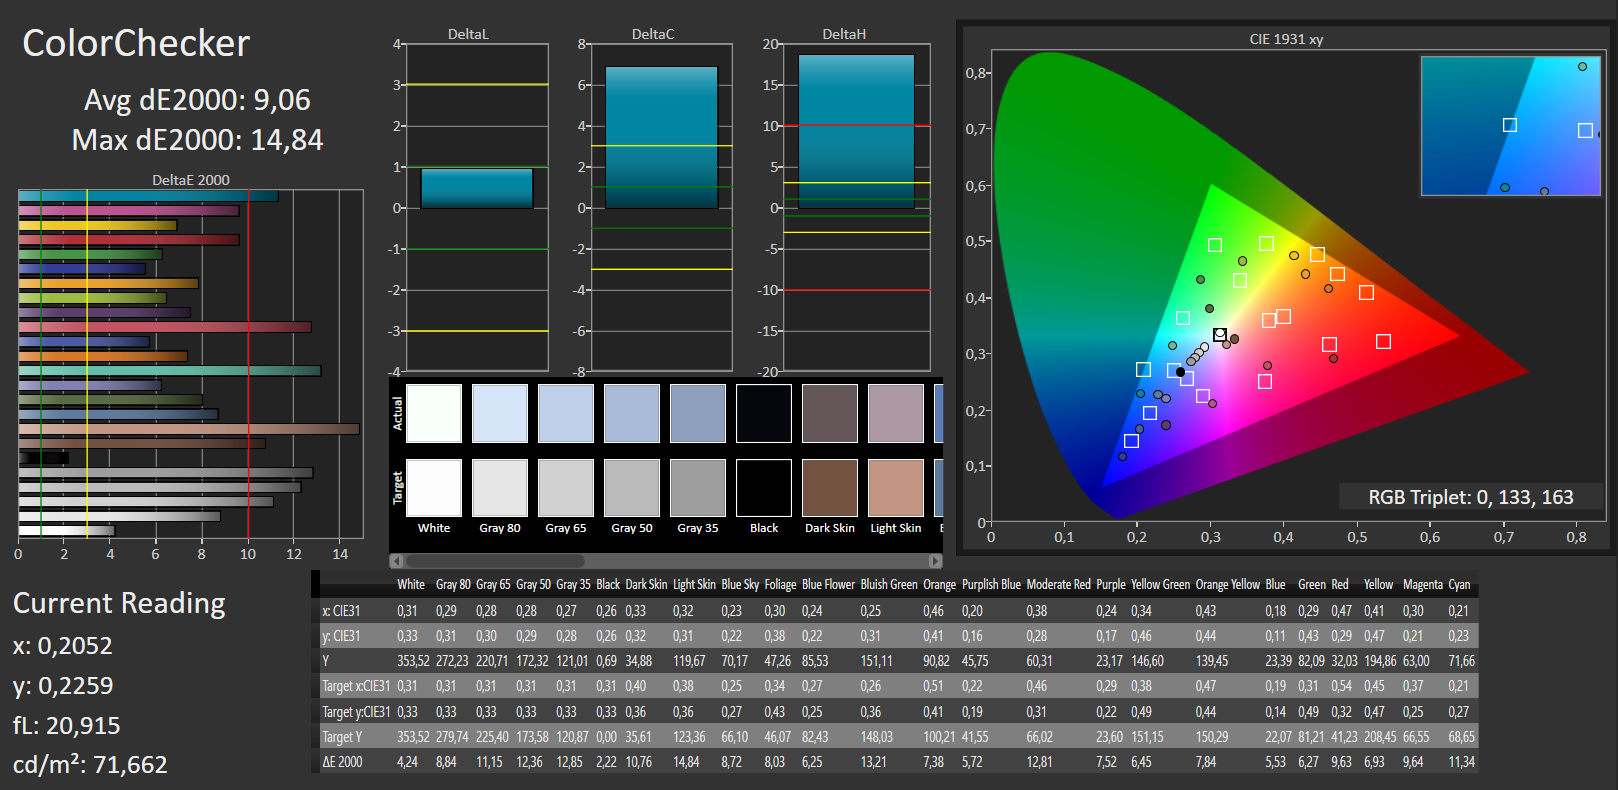
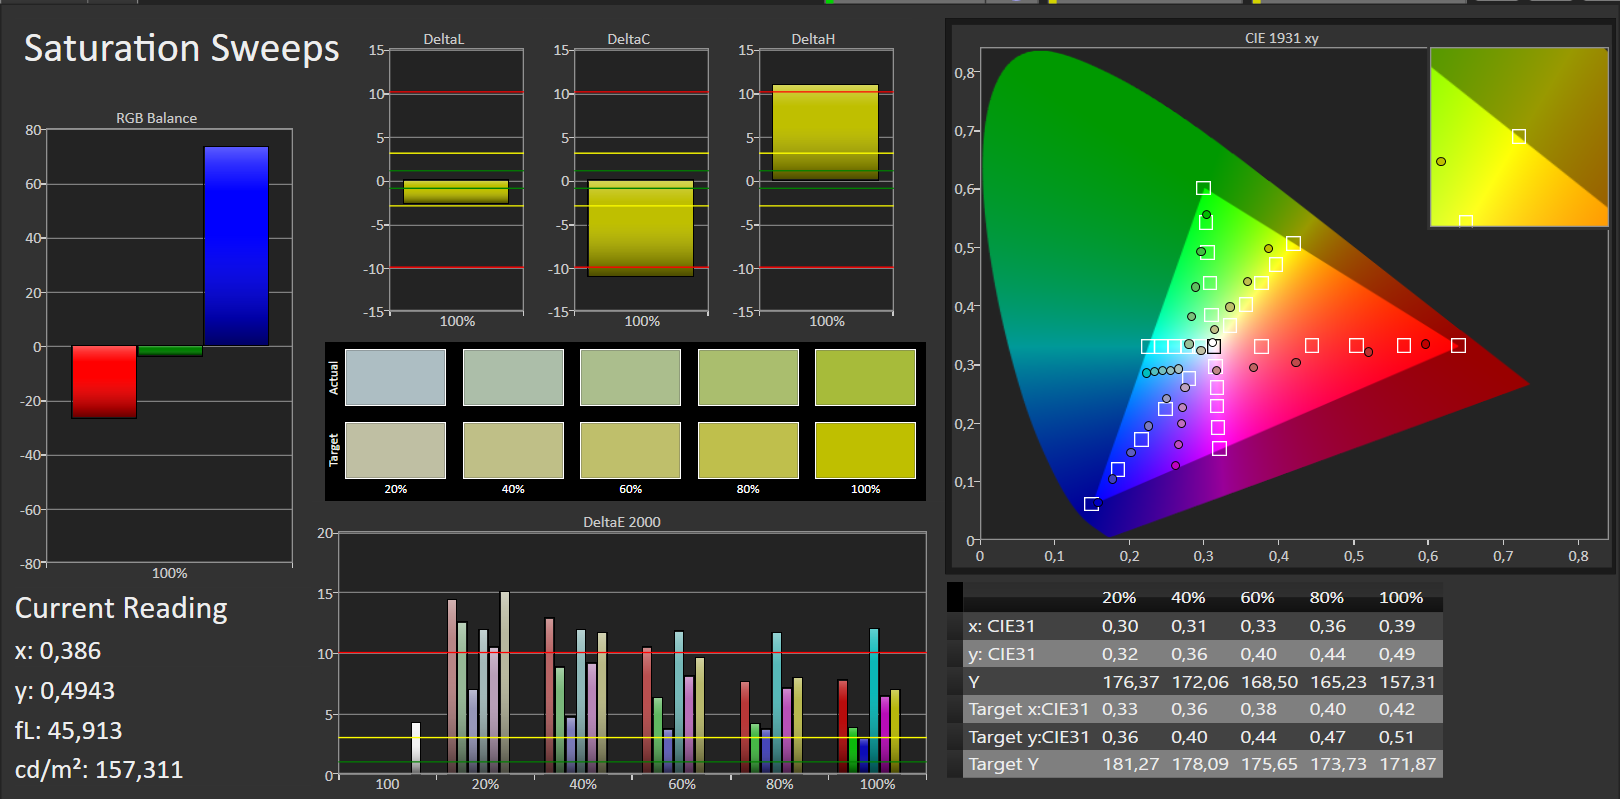
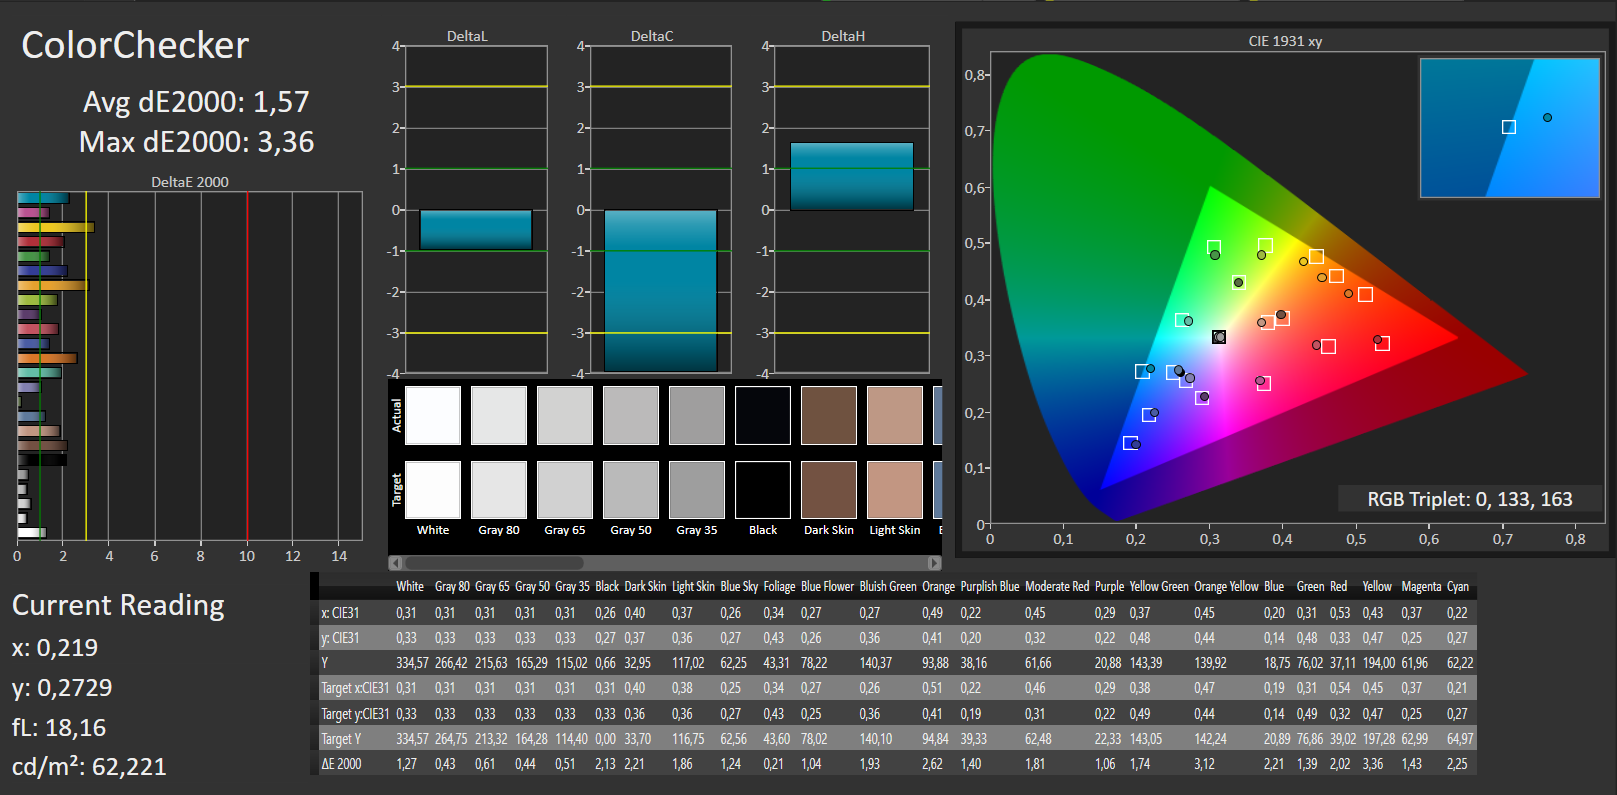
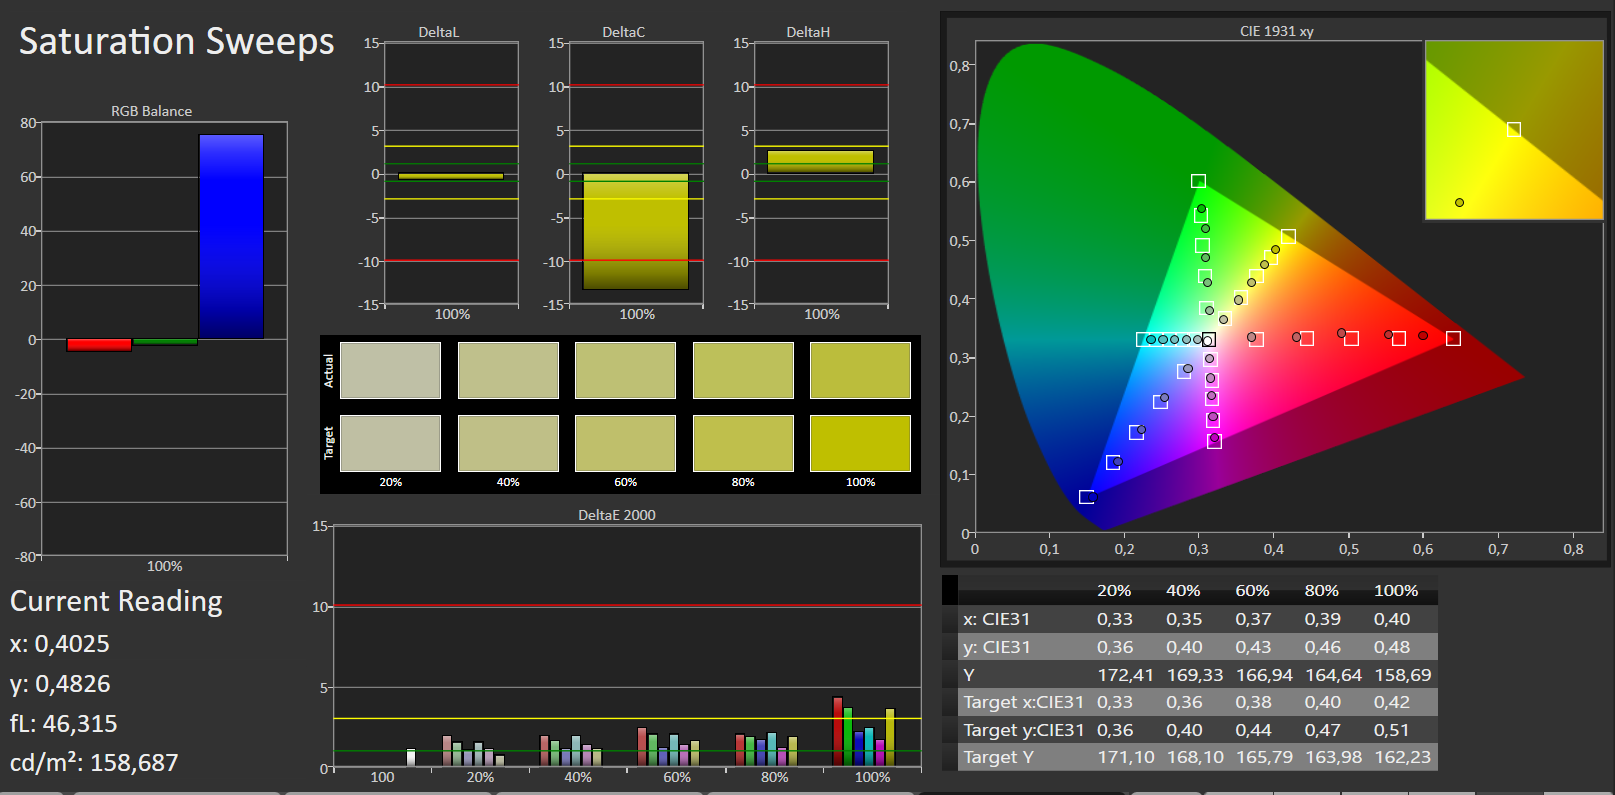
ΔE ColorChecker Calman: 9.06 | ∀{0.5-29.43 Ø4.71}
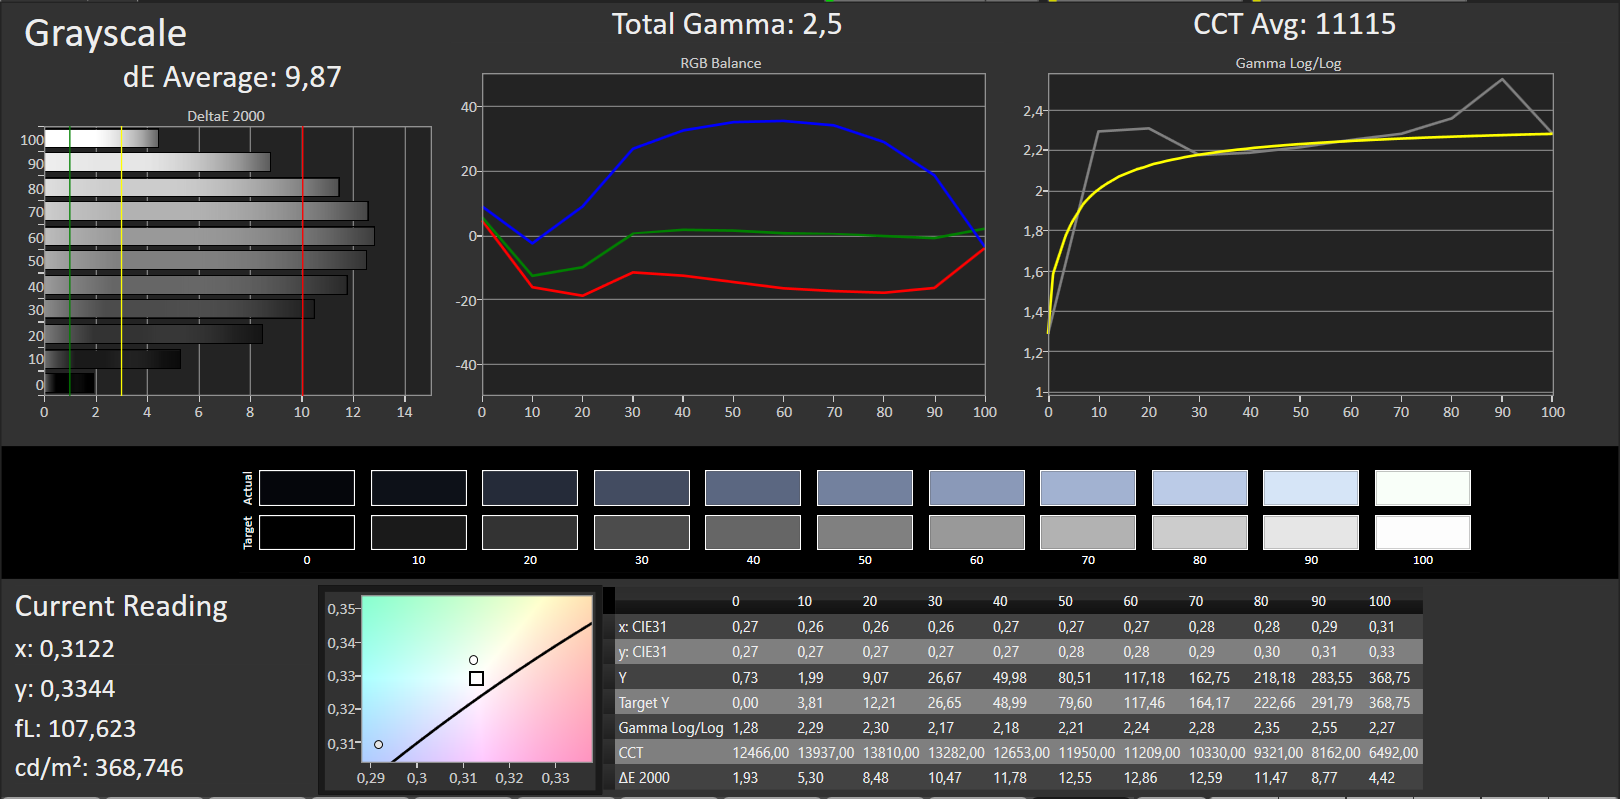
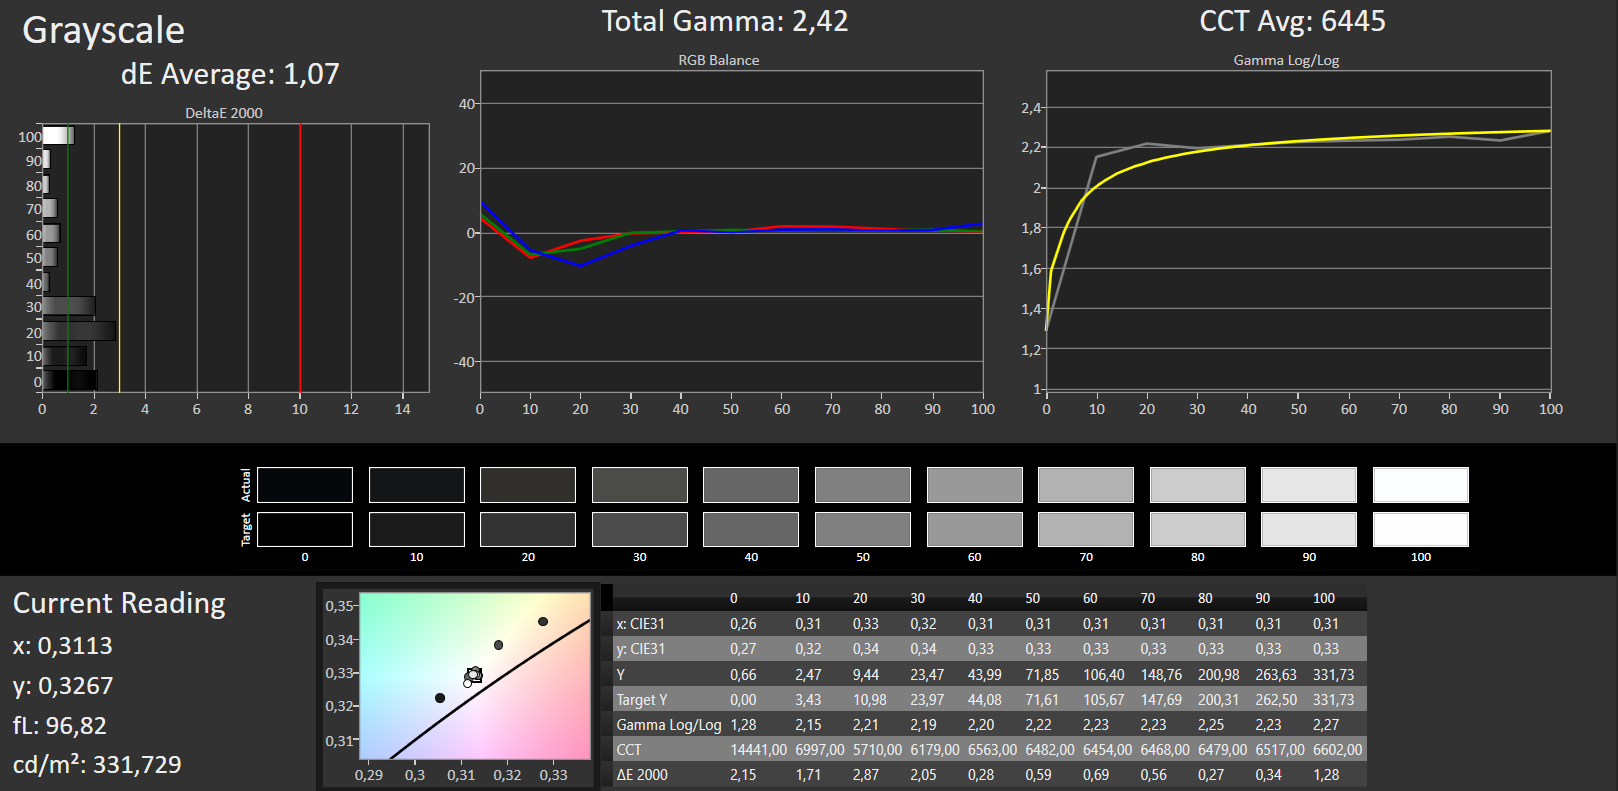
ΔE Greyscale Calman: 9.87 | ∀{0.09-98 Ø4.96}
75% sRGB (Argyll 1.6.3 3D)
47% AdobeRGB 1998 (Argyll 1.6.3 3D)
51.1% AdobeRGB 1998 (Argyll 3D)
74.5% sRGB (Argyll 3D)
49.46% Display P3 (Argyll 3D)
Gamma: 2.5
CCT: 11115 K
| HP ProBook 640 G3 Z2W33ET TN LED, 1920x1080, 14" | HP ProBook 640 G2-T9X60ET TN-Panel, 1920x1080, 14" | Dell Latitude 14 E5470 AH-IPS, WLED, 1920x1080, 14" | Dell Latitude 14 E5470 TN, 1366x768, 14" | Lenovo ThinkPad L460-20FVS01400 IPS, 1920x1080, 14" | Acer TravelMate P648-M-757N IPS, 1920x1080, 14" | |
|---|---|---|---|---|---|---|
| Display | 0% | 22% | -19% | -15% | -28% | |
| Display P3 Coverage (%) | 49.46 | 49.54 0% | 64.8 31% | 40.06 -19% | 42.2 -15% | 35.53 -28% |
| sRGB Coverage (%) | 74.5 | 74.6 0% | 84.8 14% | 60.3 -19% | 62.3 -16% | 53.3 -28% |
| AdobeRGB 1998 Coverage (%) | 51.1 | 51.2 0% | 62 21% | 41.42 -19% | 43.72 -14% | 36.72 -28% |
| Response Times | 8% | 9% | -18% | -4% | 5% | |
| Response Time Grey 50% / Grey 80% * (ms) | 41 ? | 43.2 ? -5% | 39 ? 5% | 56.8 ? -39% | 44.4 ? -8% | 44 ? -7% |
| Response Time Black / White * (ms) | 30 ? | 24 ? 20% | 26 ? 13% | 28.8 ? 4% | 29.6 ? 1% | 25 ? 17% |
| PWM Frequency (Hz) | 192 ? | 200 ? | ||||
| Screen | 1% | 21% | -19% | 11% | 28% | |
| Brightness middle (cd/m²) | 343 | 315 -8% | 323 -6% | 229 -33% | 245 -29% | 254 -26% |
| Brightness (cd/m²) | 332 | 304 -8% | 316 -5% | 207 -38% | 225 -32% | 243 -27% |
| Brightness Distribution (%) | 88 | 93 6% | 79 -10% | 80 -9% | 83 -6% | 90 2% |
| Black Level * (cd/m²) | 0.69 | 0.61 12% | 0.57 17% | 0.69 -0% | 0.24 65% | 0.19 72% |
| Contrast (:1) | 497 | 516 4% | 567 14% | 332 -33% | 1021 105% | 1337 169% |
| Colorchecker dE 2000 * | 9.06 | 8.8 3% | 3.68 59% | 10.16 -12% | 6.89 24% | 4.93 46% |
| Colorchecker dE 2000 max. * | 14.84 | 15.03 -1% | 8.33 44% | 17.18 -16% | 17.62 -19% | 10.14 32% |
| Greyscale dE 2000 * | 9.87 | 9.44 4% | 2.99 70% | 10.87 -10% | 6.45 35% | 2.71 73% |
| Gamma | 2.5 88% | 2.53 87% | 2.49 88% | 2.41 91% | 2.46 89% | 2.36 93% |
| CCT | 11115 58% | 11794 55% | 6572 99% | 12881 50% | 6857 95% | 6914 94% |
| Color Space (Percent of AdobeRGB 1998) (%) | 47 | 47.37 1% | 55 17% | 38.4 -18% | 40.1 -15% | 34 -28% |
| Color Space (Percent of sRGB) (%) | 75 | 74.78 0% | 85 13% | 60.4 -19% | 61.8 -18% | 53 -29% |
| Total Average (Program / Settings) | 3% /
2% | 17% /
20% | -19% /
-19% | -3% /
4% | 2% /
14% |
* ... smaller is better
Screen Flickering / PWM (Pulse-Width Modulation)
| Screen flickering / PWM detected | 192 Hz | ≤ 90 % brightness setting | 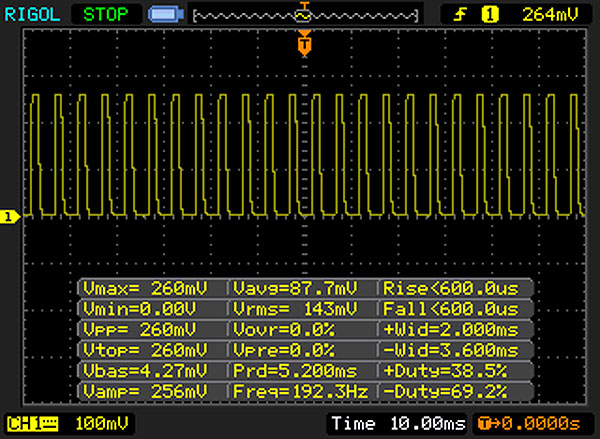 |
The display backlight flickers at 192 Hz (worst case, e.g., utilizing PWM) Flickering detected at a brightness setting of 90 % and below. There should be no flickering or PWM above this brightness setting. The frequency of 192 Hz is relatively low, so sensitive users will likely notice flickering and experience eyestrain at the stated brightness setting and below. In comparison: 52 % of all tested devices do not use PWM to dim the display. If PWM was detected, an average of 7751 (minimum: 5 - maximum: 343500) Hz was measured. | |||
Display Response Times
| ↔ Response Time Black to White | ||
|---|---|---|
| 30 ms ... rise ↗ and fall ↘ combined | ↗ 13 ms rise | 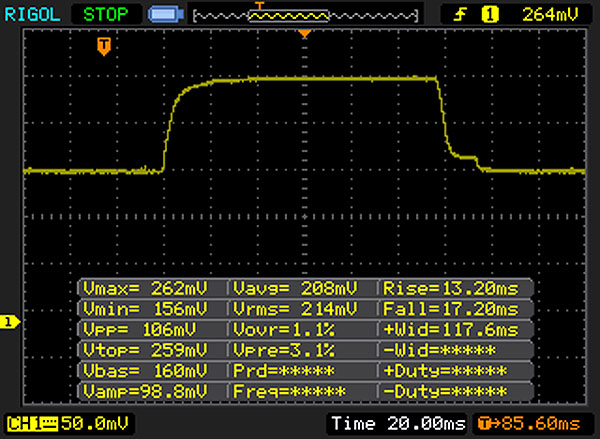 |
| ↘ 17 ms fall | ||
| The screen shows slow response rates in our tests and will be unsatisfactory for gamers. In comparison, all tested devices range from 0.1 (minimum) to 240 (maximum) ms. » 80 % of all devices are better. This means that the measured response time is worse than the average of all tested devices (19.8 ms). | ||
| ↔ Response Time 50% Grey to 80% Grey | ||
| 41 ms ... rise ↗ and fall ↘ combined | ↗ 19 ms rise | 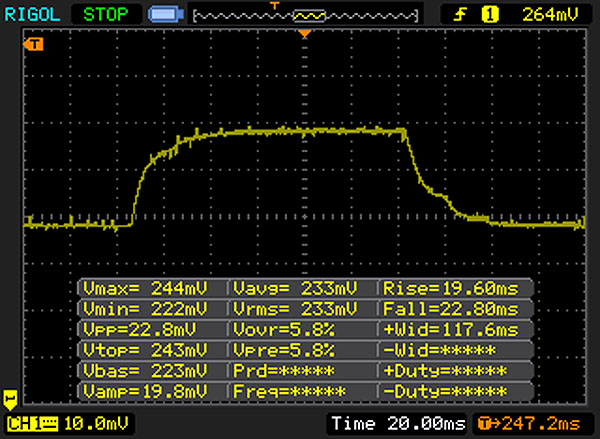 |
| ↘ 22 ms fall | ||
| The screen shows slow response rates in our tests and will be unsatisfactory for gamers. In comparison, all tested devices range from 0.165 (minimum) to 636 (maximum) ms. » 65 % of all devices are better. This means that the measured response time is worse than the average of all tested devices (31 ms). | ||
| Geekbench 3 | |
| 32 Bit Single-Core Score | |
| Acer TravelMate P648-M-757N | |
| HP ProBook 640 G3 Z2W33ET | |
| Lenovo ThinkPad L460-20FVS01400 | |
| 32 Bit Multi-Core Score | |
| Acer TravelMate P648-M-757N | |
| HP ProBook 640 G3 Z2W33ET | |
| Lenovo ThinkPad L460-20FVS01400 | |
| Geekbench 4.0 | |
| 64 Bit Single-Core Score | |
| HP ProBook 640 G3 Z2W33ET | |
| 64 Bit Multi-Core Score | |
| HP ProBook 640 G3 Z2W33ET | |
| JetStream 1.1 - 1.1 Total | |
| HP ProBook 640 G3 Z2W33ET | |
| Dell Latitude 14 E5470 | |
| Lenovo ThinkPad L460-20FVS01400 | |
| HP ProBook 640 G2-T9X60ET | |
| Acer TravelMate P648-M-757N | |
| PCMark 7 Score | 5067 points | |
| PCMark 8 Home Score Accelerated v2 | 3414 points | |
| PCMark 8 Creative Score Accelerated v2 | 4274 points | |
| PCMark 8 Work Score Accelerated v2 | 4545 points | |
Help | ||

| HP ProBook 640 G3 Z2W33ET Samsung PM951 NVMe MZVLV256 | HP ProBook 640 G2-T9X60ET Samsung SSD PM871 MZNLN256HCHP | Dell Latitude 14 E5470 Micron SSD 1100 (MTFDDAV256TBN) | Dell Latitude 14 E5470 Liteon L8H-256V2G | Lenovo ThinkPad L460-20FVS01400 Toshiba HG6 THNSFJ256GCSU | Acer TravelMate P648-M-757N Lite-On CV1-8B256 | |
|---|---|---|---|---|---|---|
| CrystalDiskMark 3.0 | -22% | -34% | -26% | -31% | -25% | |
| Read Seq (MB/s) | 1285 | 492.8 -62% | 465.4 -64% | 508 -60% | 480.9 -63% | 531 -59% |
| Write Seq (MB/s) | 283.6 | 303.2 7% | 363.1 28% | 360.6 27% | 426.4 50% | 358.8 27% |
| Read 512 (MB/s) | 679 | 417.4 -39% | 338.4 -50% | 374.1 -45% | 361.8 -47% | 384.8 -43% |
| Write 512 (MB/s) | 300.8 | 301.5 0% | 246.1 -18% | 300.2 0% | 220.9 -27% | 363 21% |
| Read 4k (MB/s) | 41.79 | 33.28 -20% | 25.83 -38% | 31.98 -23% | 21.51 -49% | 31.3 -25% |
| Write 4k (MB/s) | 138.6 | 84.6 -39% | 80.3 -42% | 93.1 -33% | 71.5 -48% | 80.3 -42% |
| Read 4k QD32 (MB/s) | 507 | 394.2 -22% | 246.1 -51% | 274.7 -46% | 277.6 -45% | 239.4 -53% |
| Write 4k QD32 (MB/s) | 293.3 | 295.5 1% | 197.7 -33% | 205.6 -30% | 230.4 -21% | 225.3 -23% |
| 3DMark 06 Standard Score | 7879 points | |
| 3DMark 11 Performance | 1541 points | |
| 3DMark Ice Storm Standard Score | 52206 points | |
| 3DMark Cloud Gate Standard Score | 5693 points | |
| 3DMark Fire Strike Score | 754 points | |
| 3DMark Fire Strike Extreme Score | 337 points | |
Help | ||
| 3DMark 11 - 1280x720 Performance GPU | |
| Lenovo ThinkPad L460-20FVS01400 | |
| HP ProBook 640 G3 Z2W33ET | |
| HP ProBook 640 G2-T9X60ET | |
| Dell Latitude 14 E5470 | |
| Dell Latitude 14 E5470 | |
| Acer TravelMate P648-M-757N | |
| low | med. | high | ultra | |
|---|---|---|---|---|
| Tomb Raider (2013) | 65.6 | 33.4 | 19.2 | 9.7 |
| BioShock Infinite (2013) | 39.9 | 24.5 | 20.2 | 7.1 |
| Battlefield 4 (2013) | 30.7 | 24.5 | 15.9 | 5.3 |
Noise level
| Idle |
| 30.7 / 30.7 / 31.5 dB(A) |
| DVD |
| 35.7 / dB(A) |
| Load |
| 31.4 / 31.1 dB(A) |
 | ||
30 dB silent 40 dB(A) audible 50 dB(A) loud |
||
min: | ||
| HP ProBook 640 G3 Z2W33ET i5-7200U, HD Graphics 620 | HP ProBook 640 G2-T9X60ET 6200U, HD Graphics 520 | Dell Latitude 14 E5470 6440HQ, HD Graphics 530 | Dell Latitude 14 E5470 6300U, HD Graphics 520 | Lenovo ThinkPad L460-20FVS01400 6500U, Radeon R5 M330 | Acer TravelMate P648-M-757N 6500U, HD Graphics 520 | |
|---|---|---|---|---|---|---|
| Noise | 2% | -1% | 0% | -0% | -3% | |
| off / environment * (dB) | 30.7 | 29 6% | 30.3 1% | 29.2 5% | 29.2 5% | 31.2 -2% |
| Idle Minimum * (dB) | 30.7 | 29 6% | 30.3 1% | 29.2 5% | 29.2 5% | 31.2 -2% |
| Idle Average * (dB) | 30.7 | 29.8 3% | 30.3 1% | 29.2 5% | 29.2 5% | 31.2 -2% |
| Idle Maximum * (dB) | 31.5 | 30.2 4% | 30.3 4% | 29.2 7% | 29.2 7% | 31.6 -0% |
| Load Average * (dB) | 31.4 | 30.2 4% | 31.6 -1% | 32.1 -2% | 32.5 -4% | 33.3 -6% |
| Load Maximum * (dB) | 31.1 | 33.9 -9% | 35 -13% | 36.8 -18% | 37.2 -20% | 32.4 -4% |
* ... smaller is better
(+) The maximum temperature on the upper side is 34 °C / 93 F, compared to the average of 34.3 °C / 94 F, ranging from 21.2 to 62.5 °C for the class Office.
(+) The bottom heats up to a maximum of 33.2 °C / 92 F, compared to the average of 36.8 °C / 98 F
(+) In idle usage, the average temperature for the upper side is 24.9 °C / 77 F, compared to the device average of 29.5 °C / 85 F.
(+) The palmrests and touchpad are cooler than skin temperature with a maximum of 25.6 °C / 78.1 F and are therefore cool to the touch.
(±) The average temperature of the palmrest area of similar devices was 27.5 °C / 81.5 F (+1.9 °C / 3.4 F).
| HP ProBook 640 G3 Z2W33ET i5-7200U, HD Graphics 620 | HP ProBook 640 G2-T9X60ET 6200U, HD Graphics 520 | Dell Latitude 14 E5470 6440HQ, HD Graphics 530 | Dell Latitude 14 E5470 6300U, HD Graphics 520 | Lenovo ThinkPad L460-20FVS01400 6500U, Radeon R5 M330 | Acer TravelMate P648-M-757N 6500U, HD Graphics 520 | |
|---|---|---|---|---|---|---|
| Heat | -21% | -25% | -17% | -20% | -15% | |
| Maximum Upper Side * (°C) | 34 | 40.7 -20% | 43 -26% | 41.5 -22% | 40.8 -20% | 38.5 -13% |
| Maximum Bottom * (°C) | 33.2 | 42.6 -28% | 43 -30% | 41.4 -25% | 51.9 -56% | 36.7 -11% |
| Idle Upper Side * (°C) | 25.6 | 29.9 -17% | 31.2 -22% | 26.9 -5% | 25.2 2% | 31.5 -23% |
| Idle Bottom * (°C) | 26 | 30.3 -17% | 31.3 -20% | 29.6 -14% | 27.6 -6% | 29.6 -14% |
* ... smaller is better
HP ProBook 640 G3 Z2W33ET audio analysis
(-) | not very loud speakers (70 dB)
Bass 100 - 315 Hz
(-) | nearly no bass - on average 15% lower than median
(±) | linearity of bass is average (7.5% delta to prev. frequency)
Mids 400 - 2000 Hz
(+) | balanced mids - only 4.1% away from median
(+) | mids are linear (6.1% delta to prev. frequency)
Highs 2 - 16 kHz
(±) | higher highs - on average 8.8% higher than median
(+) | highs are linear (4.6% delta to prev. frequency)
Overall 100 - 16.000 Hz
(±) | linearity of overall sound is average (22.2% difference to median)
Compared to same class
» 58% of all tested devices in this class were better, 9% similar, 33% worse
» The best had a delta of 7%, average was 21%, worst was 53%
Compared to all devices tested
» 65% of all tested devices were better, 6% similar, 29% worse
» The best had a delta of 4%, average was 23%, worst was 134%
Apple MacBook 12 (Early 2016) 1.1 GHz audio analysis
(+) | speakers can play relatively loud (83.6 dB)
Bass 100 - 315 Hz
(±) | reduced bass - on average 11.3% lower than median
(±) | linearity of bass is average (14.2% delta to prev. frequency)
Mids 400 - 2000 Hz
(+) | balanced mids - only 2.4% away from median
(+) | mids are linear (5.5% delta to prev. frequency)
Highs 2 - 16 kHz
(+) | balanced highs - only 2% away from median
(+) | highs are linear (4.5% delta to prev. frequency)
Overall 100 - 16.000 Hz
(+) | overall sound is linear (10.2% difference to median)
Compared to same class
» 7% of all tested devices in this class were better, 2% similar, 90% worse
» The best had a delta of 5%, average was 18%, worst was 53%
Compared to all devices tested
» 5% of all tested devices were better, 1% similar, 94% worse
» The best had a delta of 4%, average was 23%, worst was 134%
| Off / Standby | |
| Idle | |
| Load |
|
Key:
min: | |
| HP ProBook 640 G3 Z2W33ET i5-7200U, HD Graphics 620 | HP ProBook 640 G2-T9X60ET 6200U, HD Graphics 520 | Dell Latitude 14 E5470 6440HQ, HD Graphics 530 | Dell Latitude 14 E5470 6300U, HD Graphics 520 | Lenovo ThinkPad L460-20FVS01400 6500U, Radeon R5 M330 | Acer TravelMate P648-M-757N 6500U, HD Graphics 520 | |
|---|---|---|---|---|---|---|
| Power Consumption | -22% | -66% | -17% | -41% | -68% | |
| Idle Minimum * (Watt) | 2.3 | 3.3 -43% | 4.1 -78% | 3.5 -52% | 3.1 -35% | 5.3 -130% |
| Idle Average * (Watt) | 5.2 | 6 -15% | 8.1 -56% | 5.3 -2% | 6.3 -21% | 9.3 -79% |
| Idle Maximum * (Watt) | 5.6 | 6.9 -23% | 11.4 -104% | 6 -7% | 7.9 -41% | 11.5 -105% |
| Load Average * (Watt) | 27.2 | 27.7 -2% | 33.5 -23% | 26.3 3% | 29.5 -8% | 30.8 -13% |
| Load Maximum * (Watt) | 28.7 | 36.6 -28% | 49 -71% | 36.6 -28% | 57.3 -100% | 32 -11% |
* ... smaller is better
| HP ProBook 640 G3 Z2W33ET i5-7200U, HD Graphics 620, 46 Wh | HP ProBook 640 G2-T9X60ET 6200U, HD Graphics 520, 46 Wh | Dell Latitude 14 E5470 6440HQ, HD Graphics 530, 62 Wh | Dell Latitude 14 E5470 6300U, HD Graphics 520, 62 Wh | Lenovo ThinkPad L460-20FVS01400 6500U, Radeon R5 M330, 48 Wh | Acer TravelMate P648-M-757N 6500U, HD Graphics 520, 54 Wh | |
|---|---|---|---|---|---|---|
| Battery runtime | -9% | -32% | 9% | -26% | -14% | |
| Reader / Idle (h) | 24.6 | 16.6 -33% | 15.2 -38% | 21.7 -12% | 19.2 -22% | 18.1 -26% |
| H.264 (h) | 8.7 | 6.9 -21% | 10.8 24% | 7.2 -17% | 9.1 5% | |
| WiFi v1.3 (h) | 8.7 | 9.6 10% | 7.2 -17% | 11.1 28% | 7.1 -18% | 9.1 5% |
| Load (h) | 3 | 2.9 -3% | 1.4 -53% | 2.9 -3% | 1.6 -47% | 1.8 -40% |
Pros
Cons
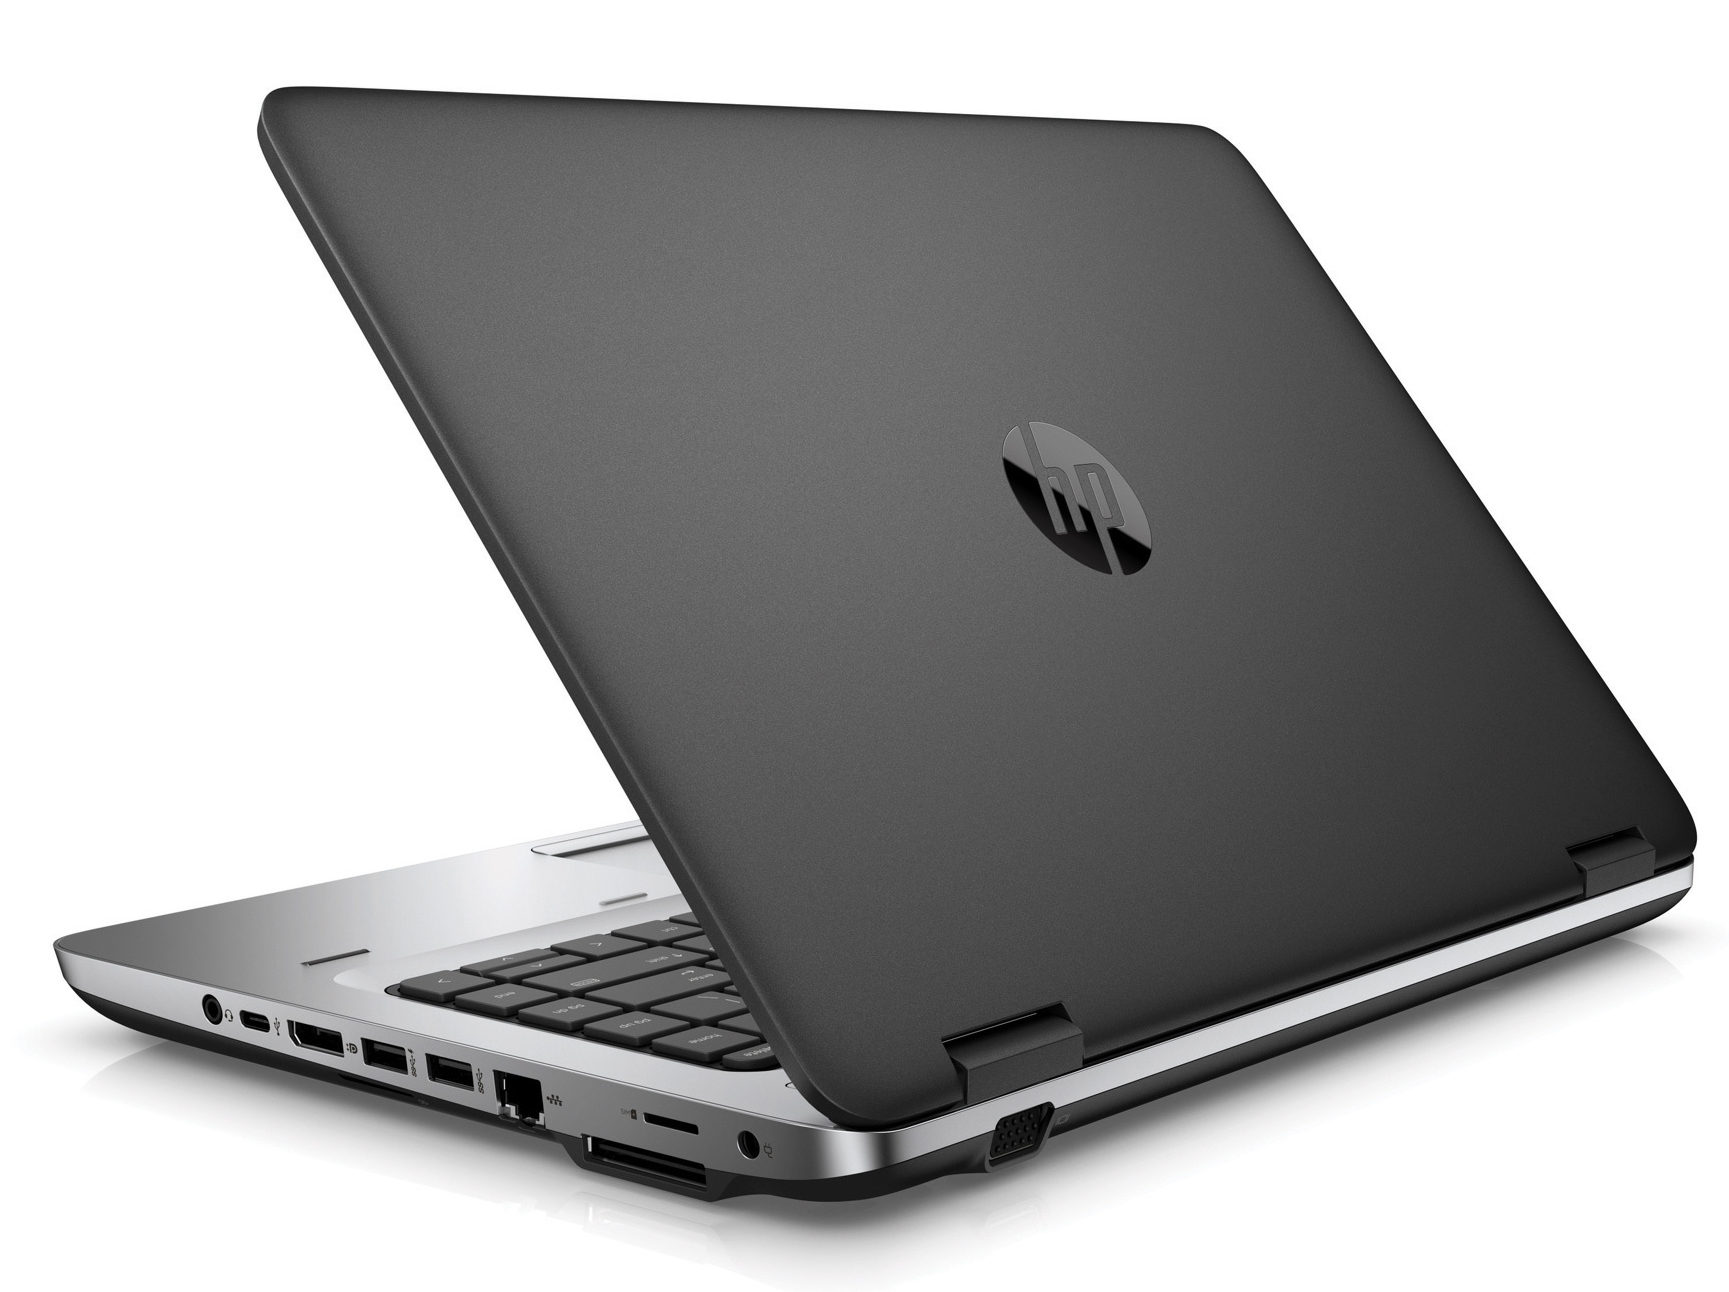
归功于Kaby Lake 处理器,ProBook提供了高性能体验。然而,相较于Skylake处理器的性能提升有限。这台笔记本在全负载时运行几乎没有噪声,温度控制也相对不错-对于办公设备来说是很好的优点。内置的NVMe 固态硬盘保障了流畅的系统操作以及快速的载入时间。想要更换固态硬盘也是很方便的,只需要打开笔记本的背壳,这个操作将会简单方便。
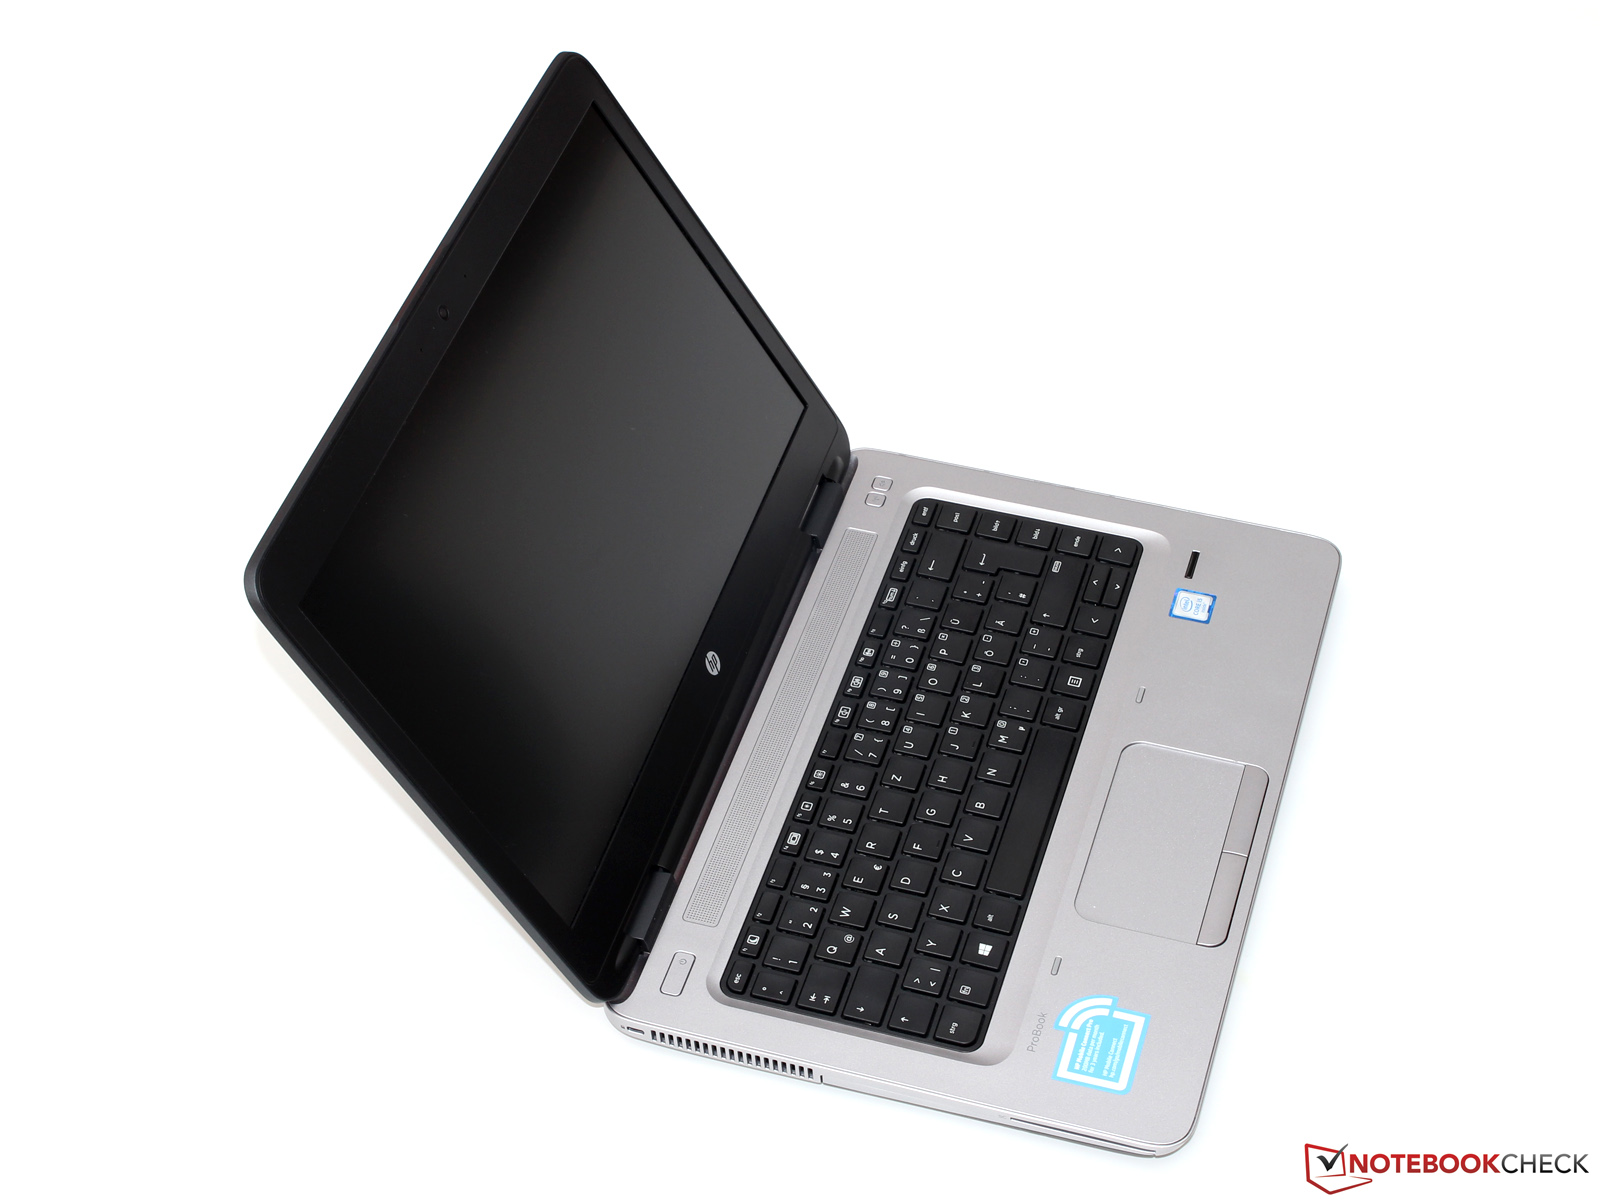
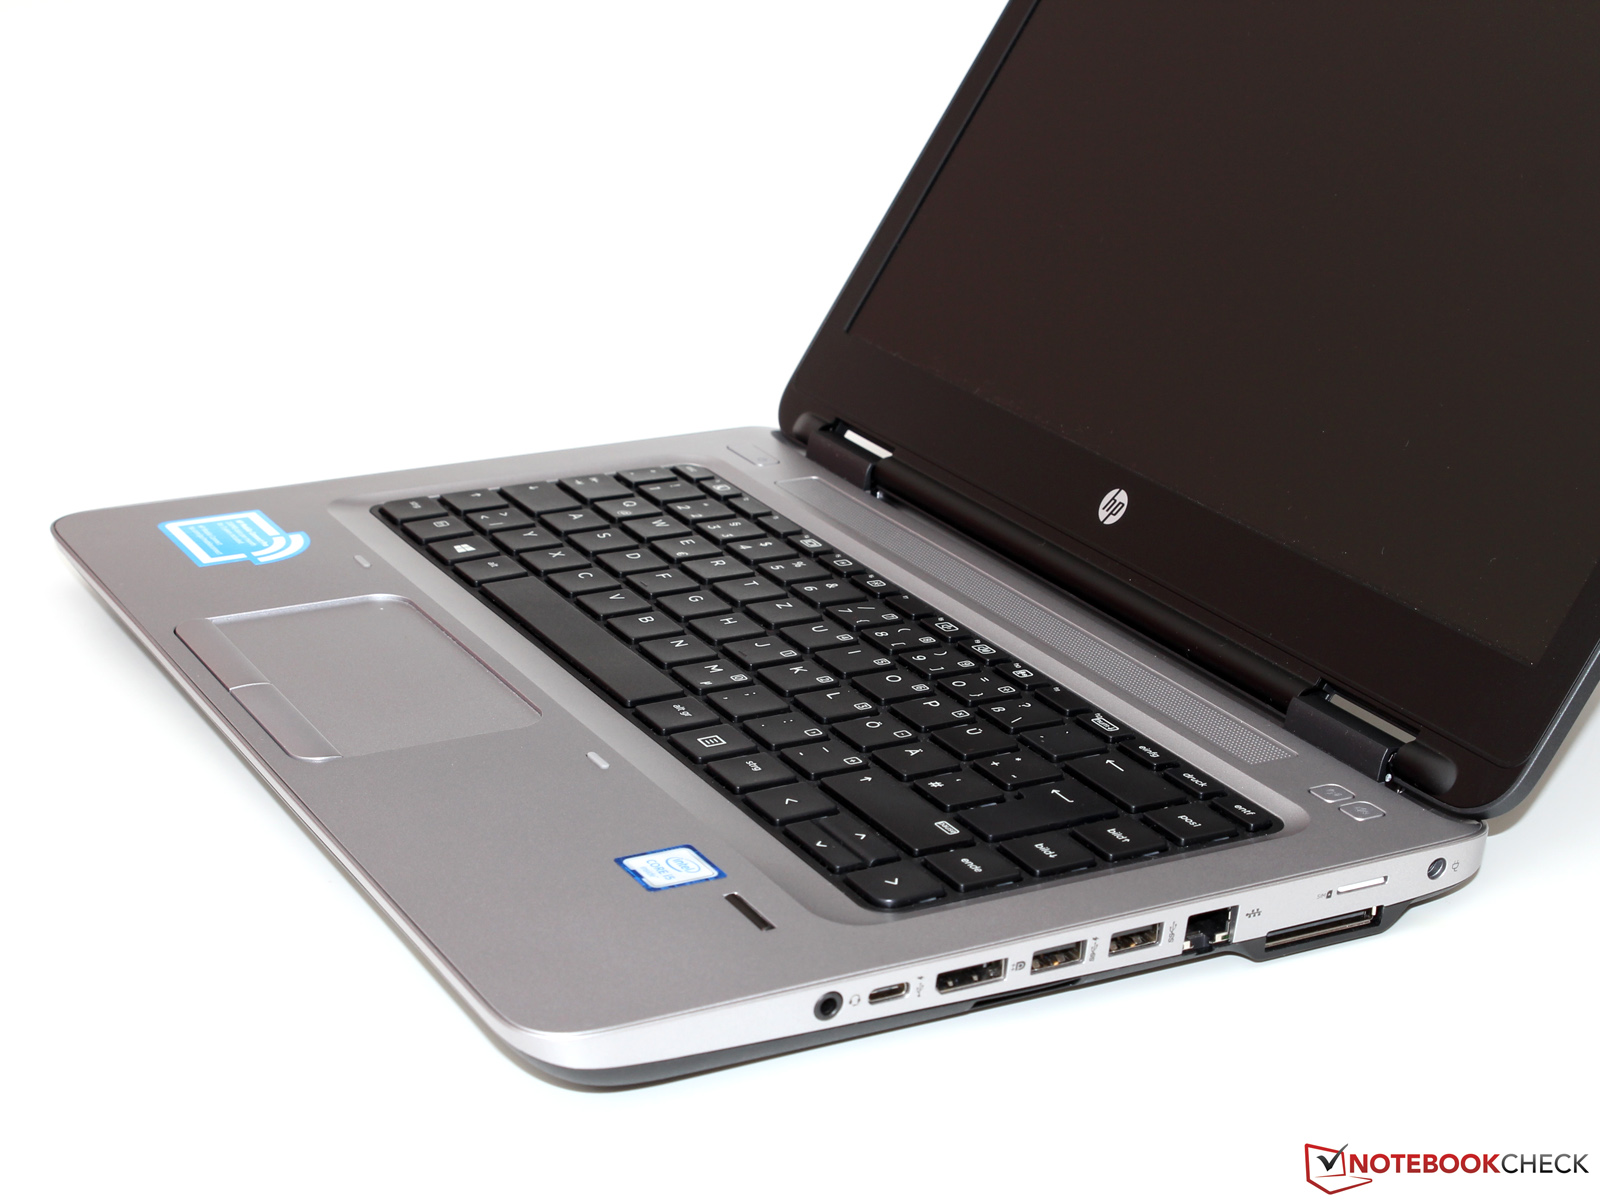
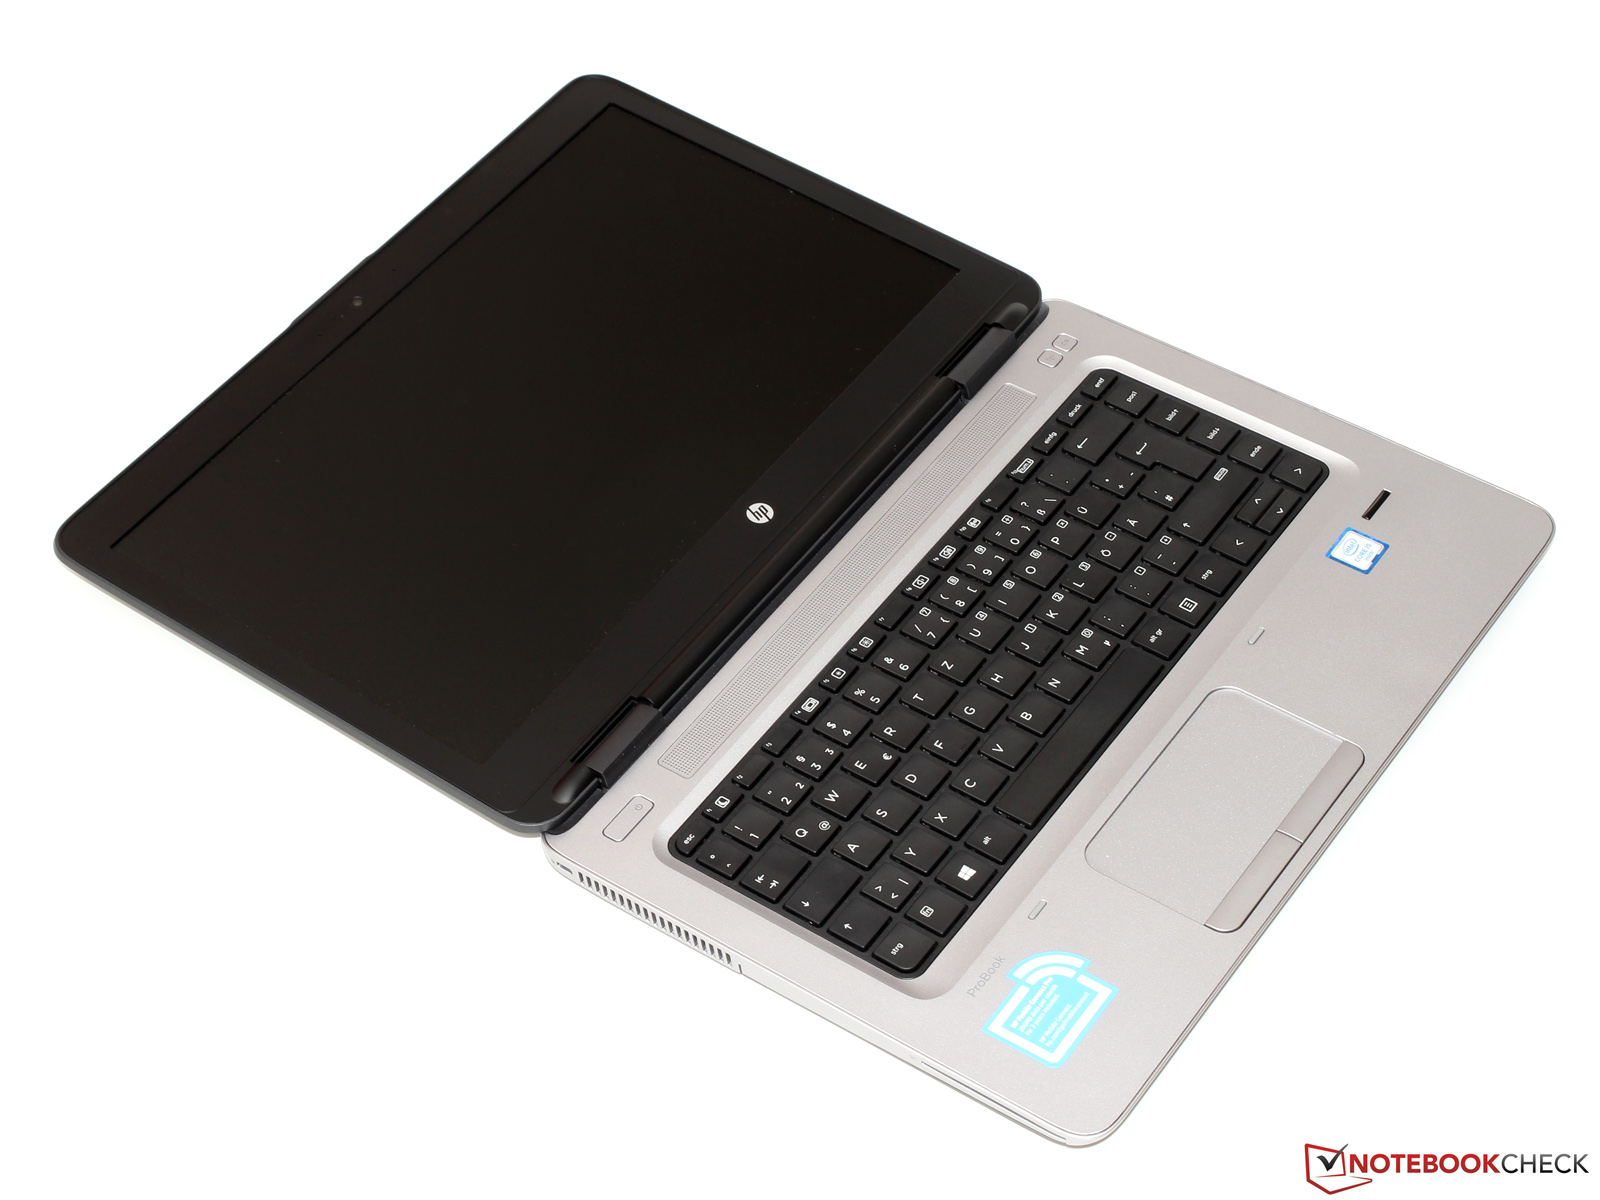
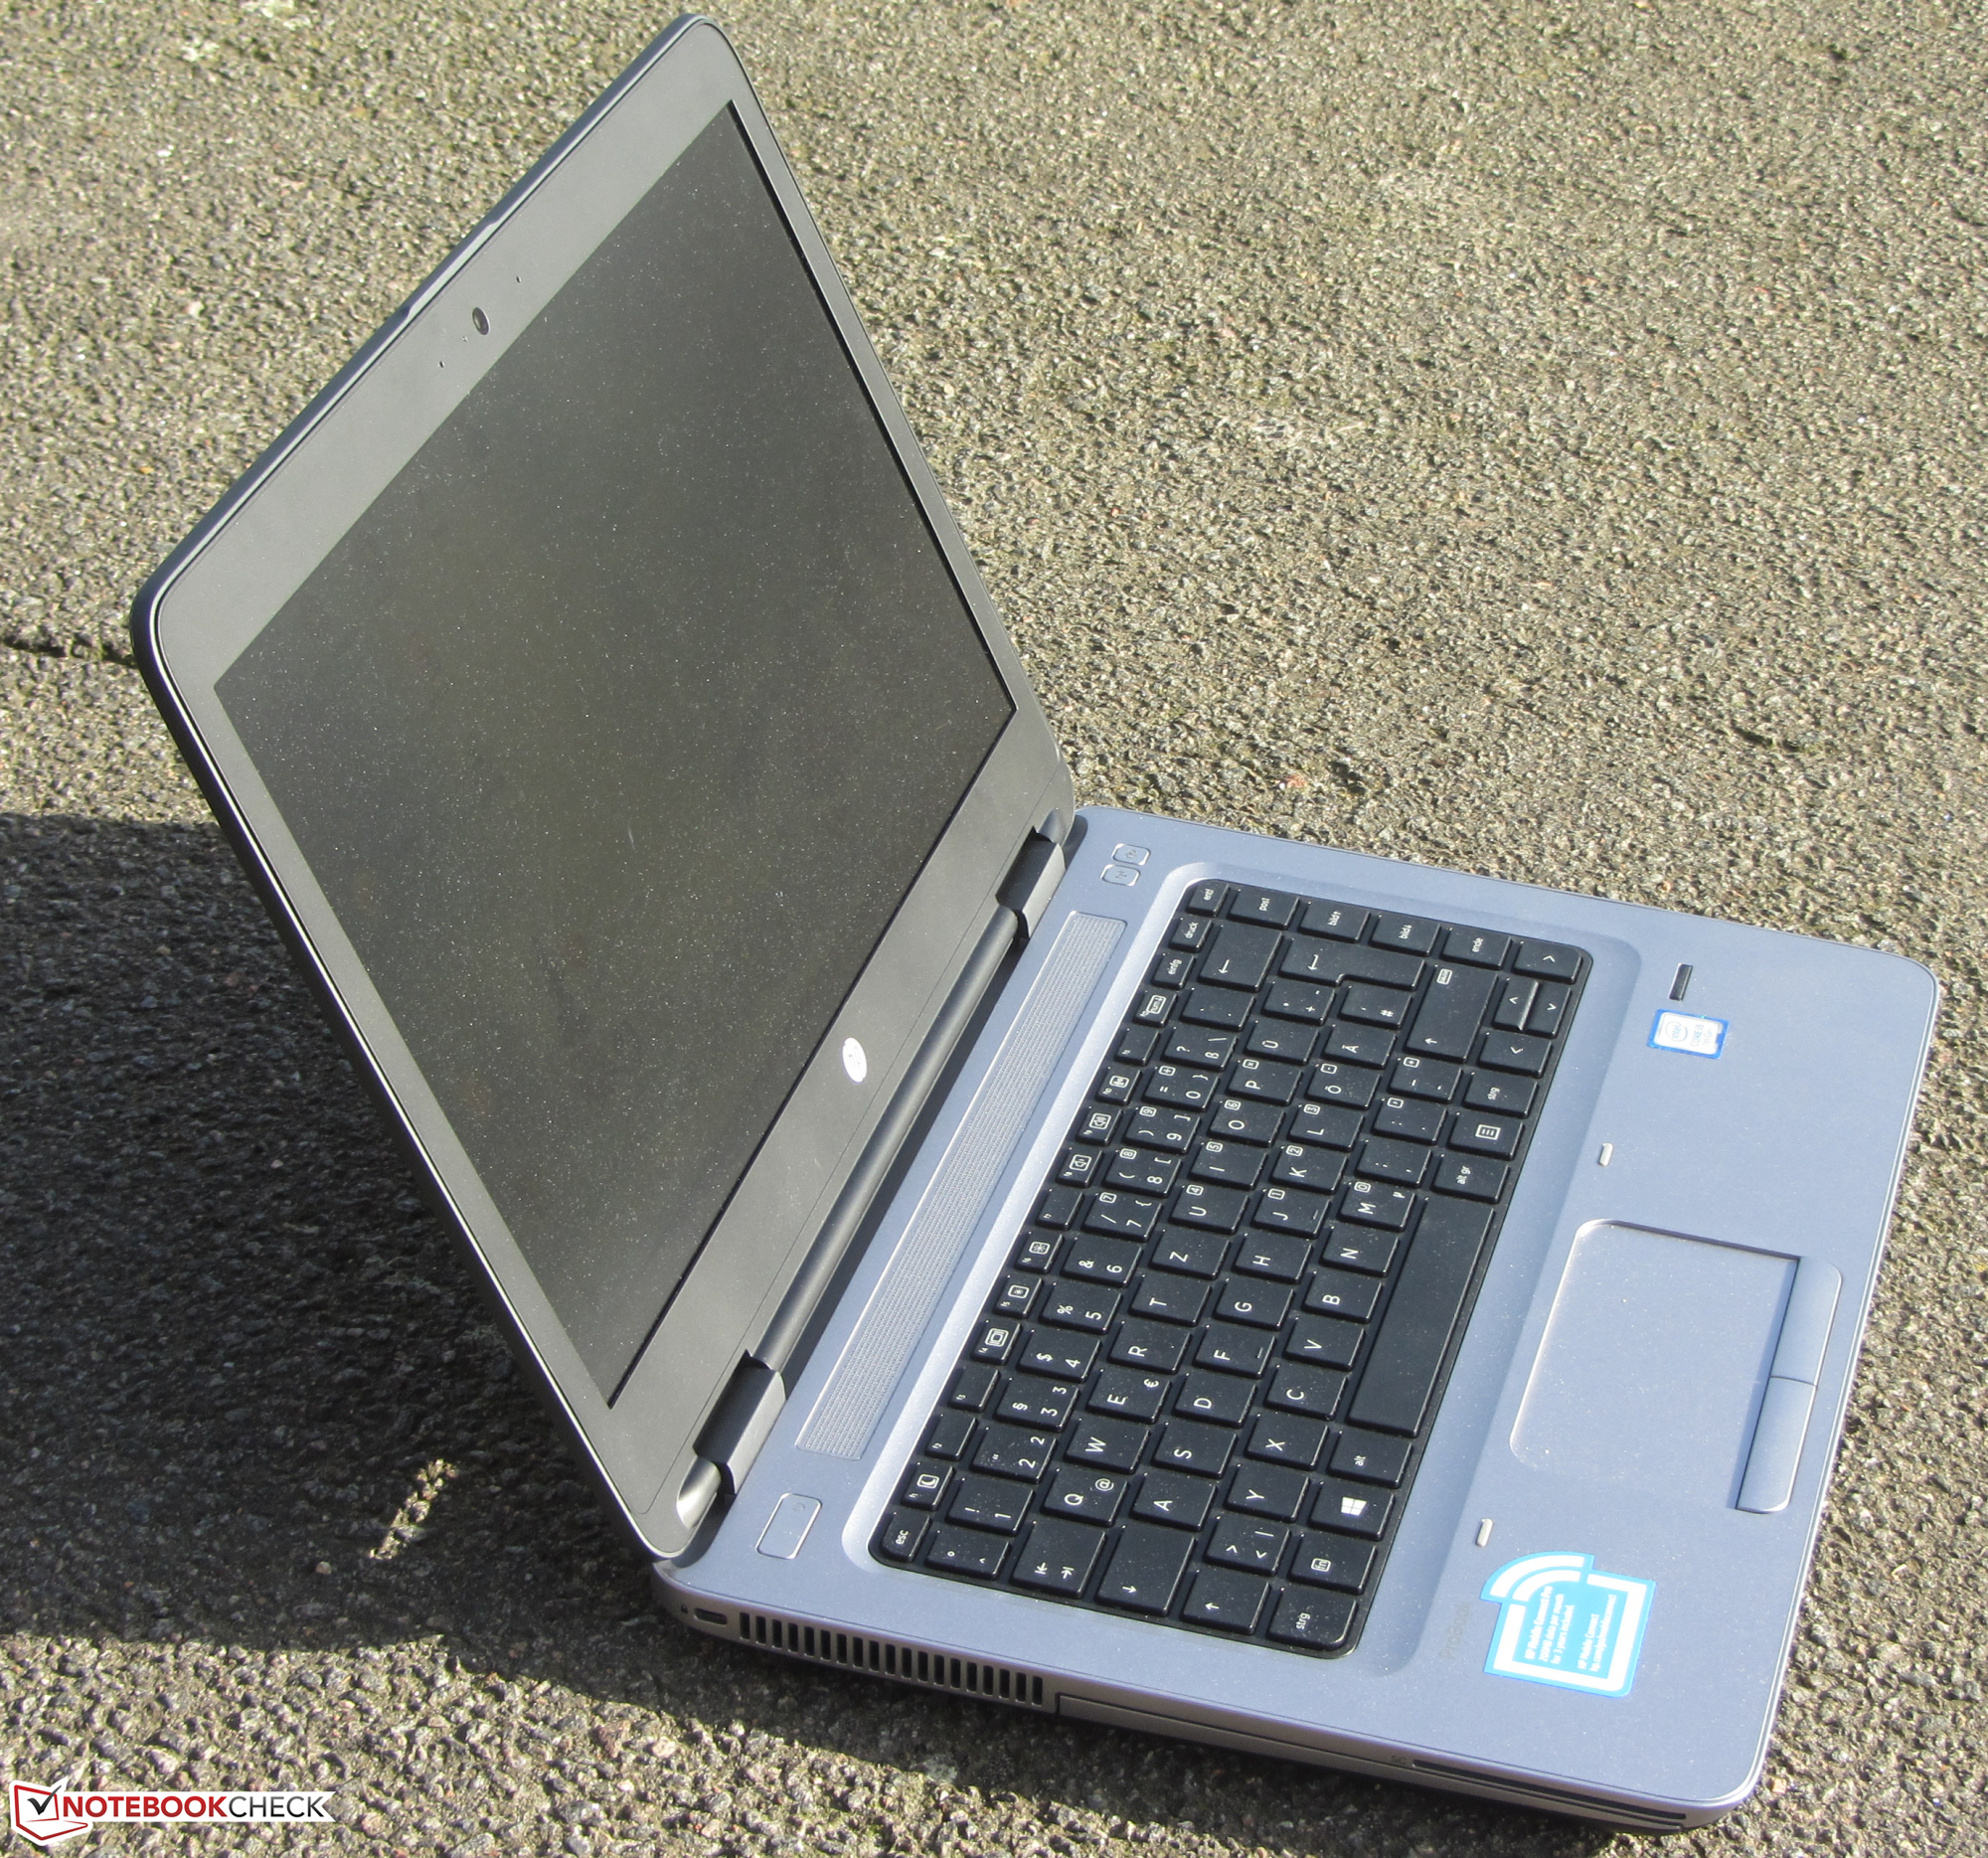
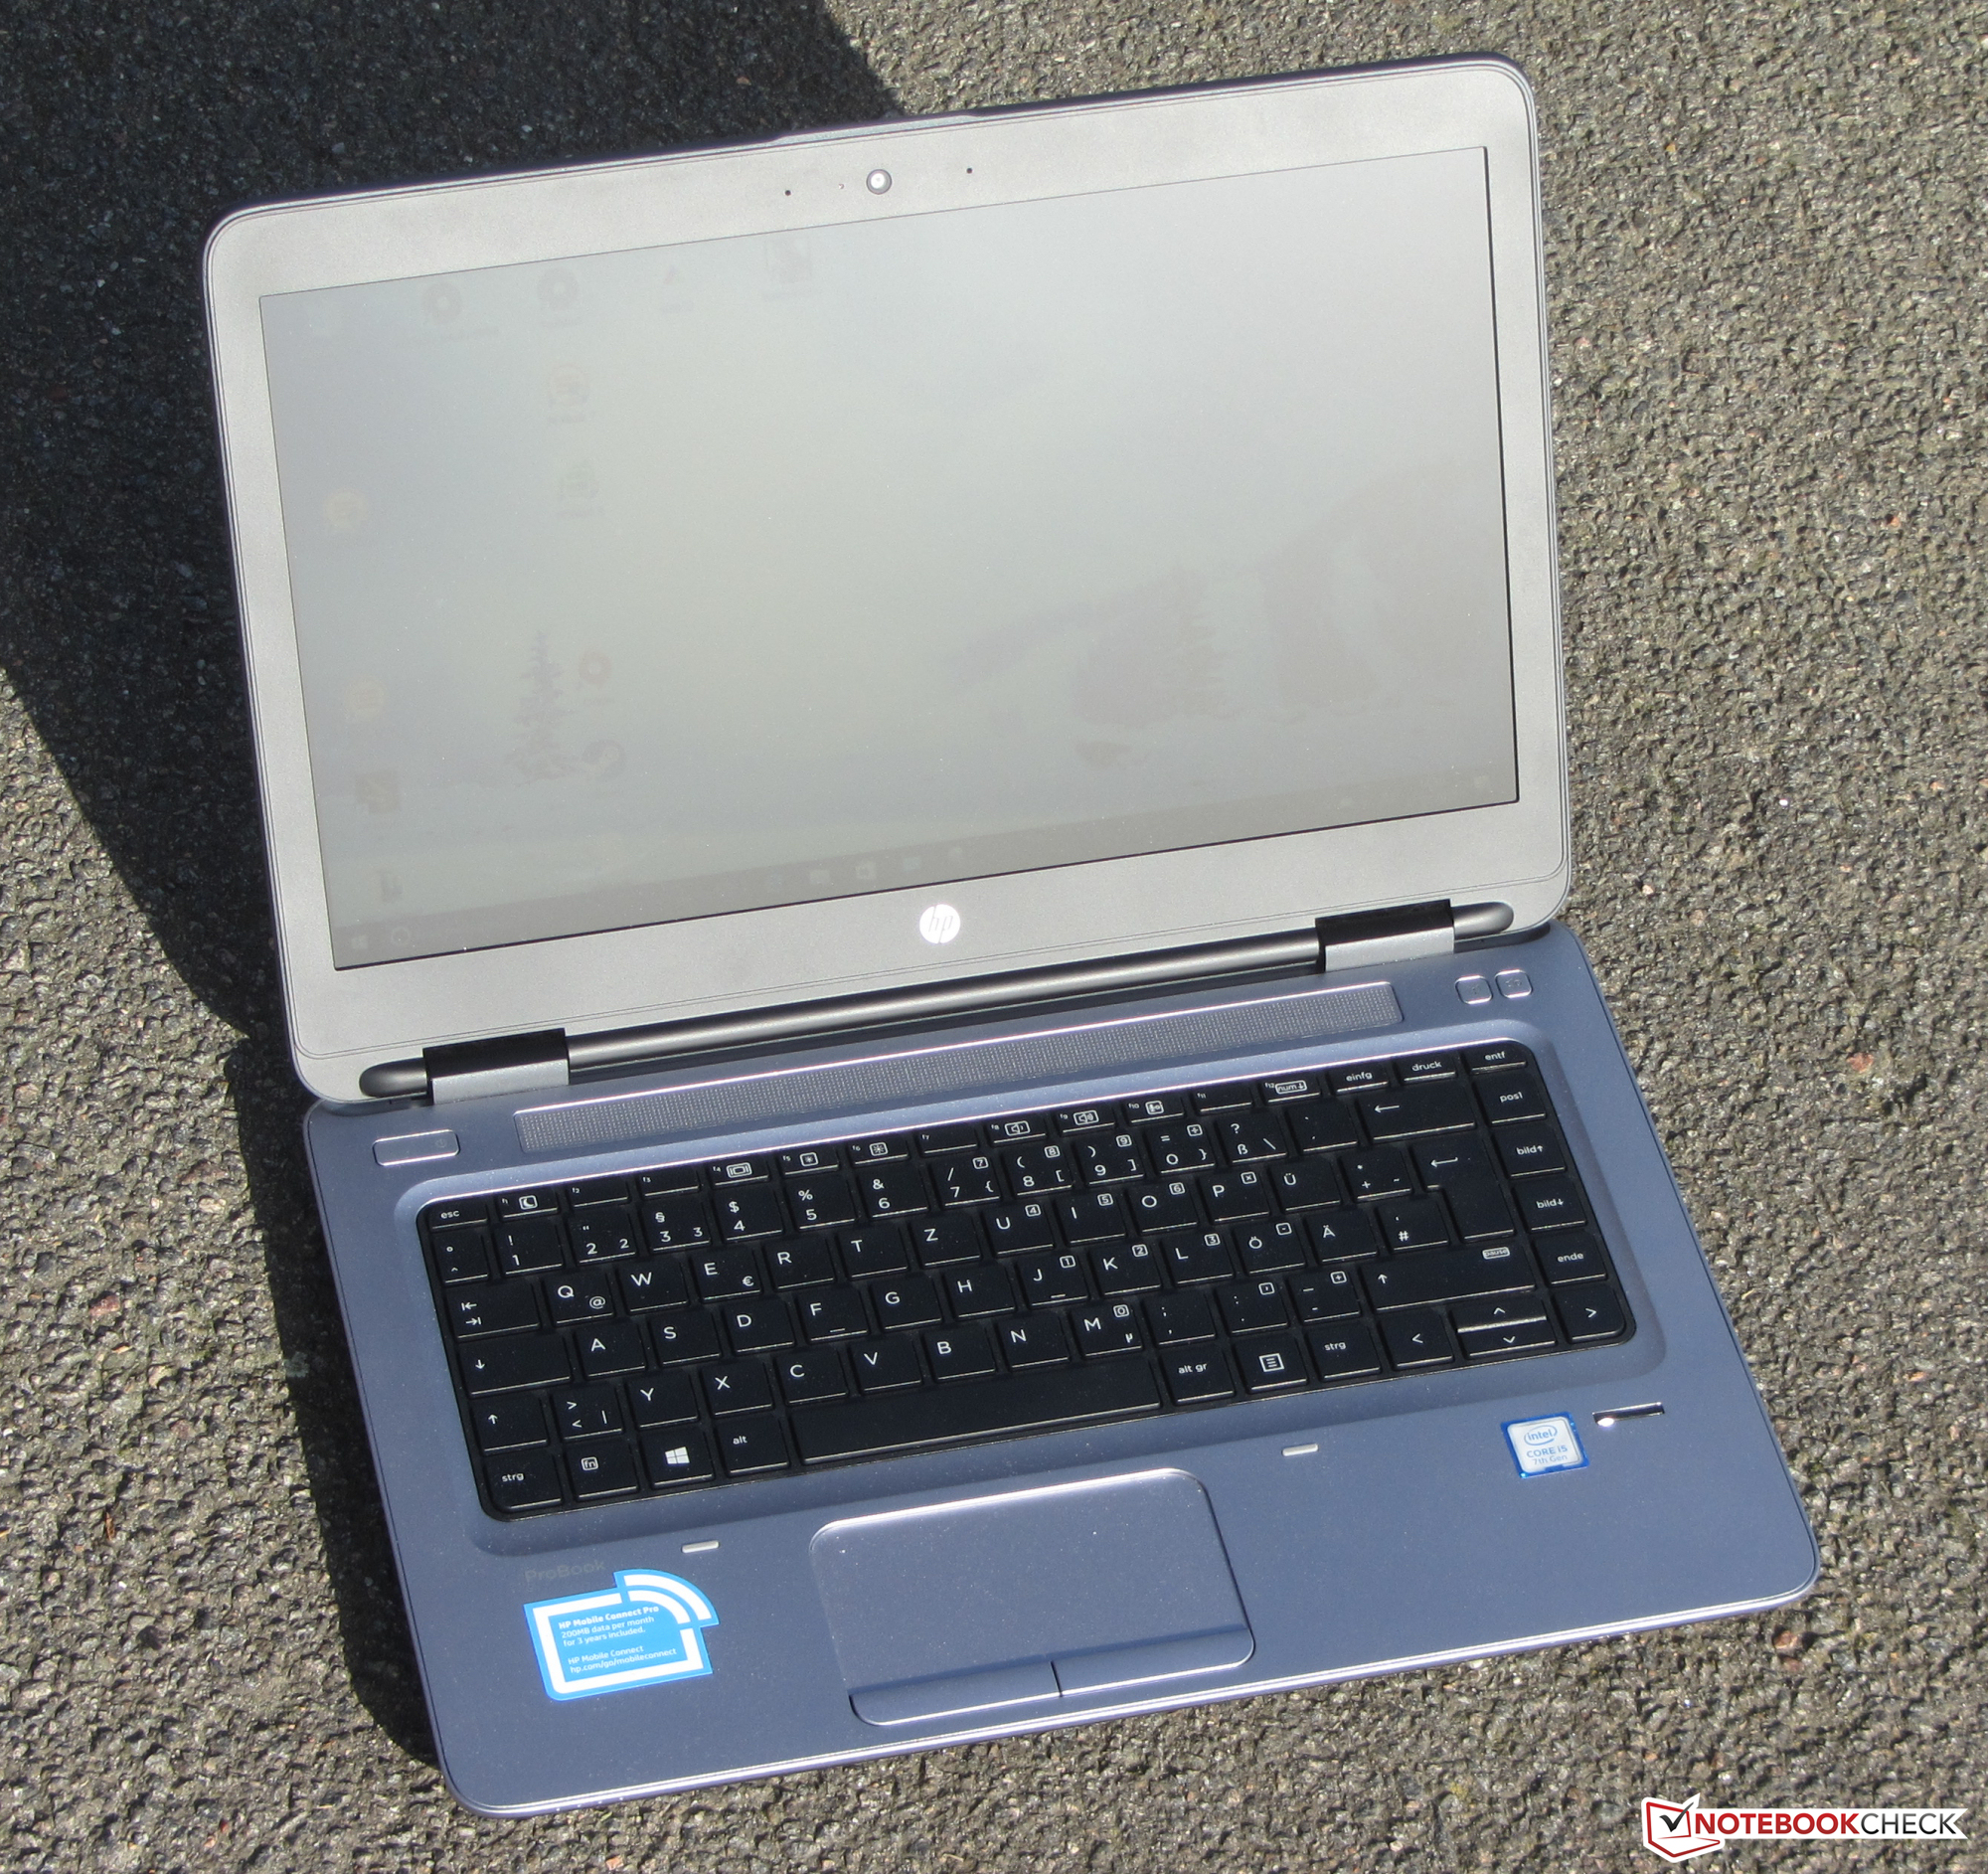
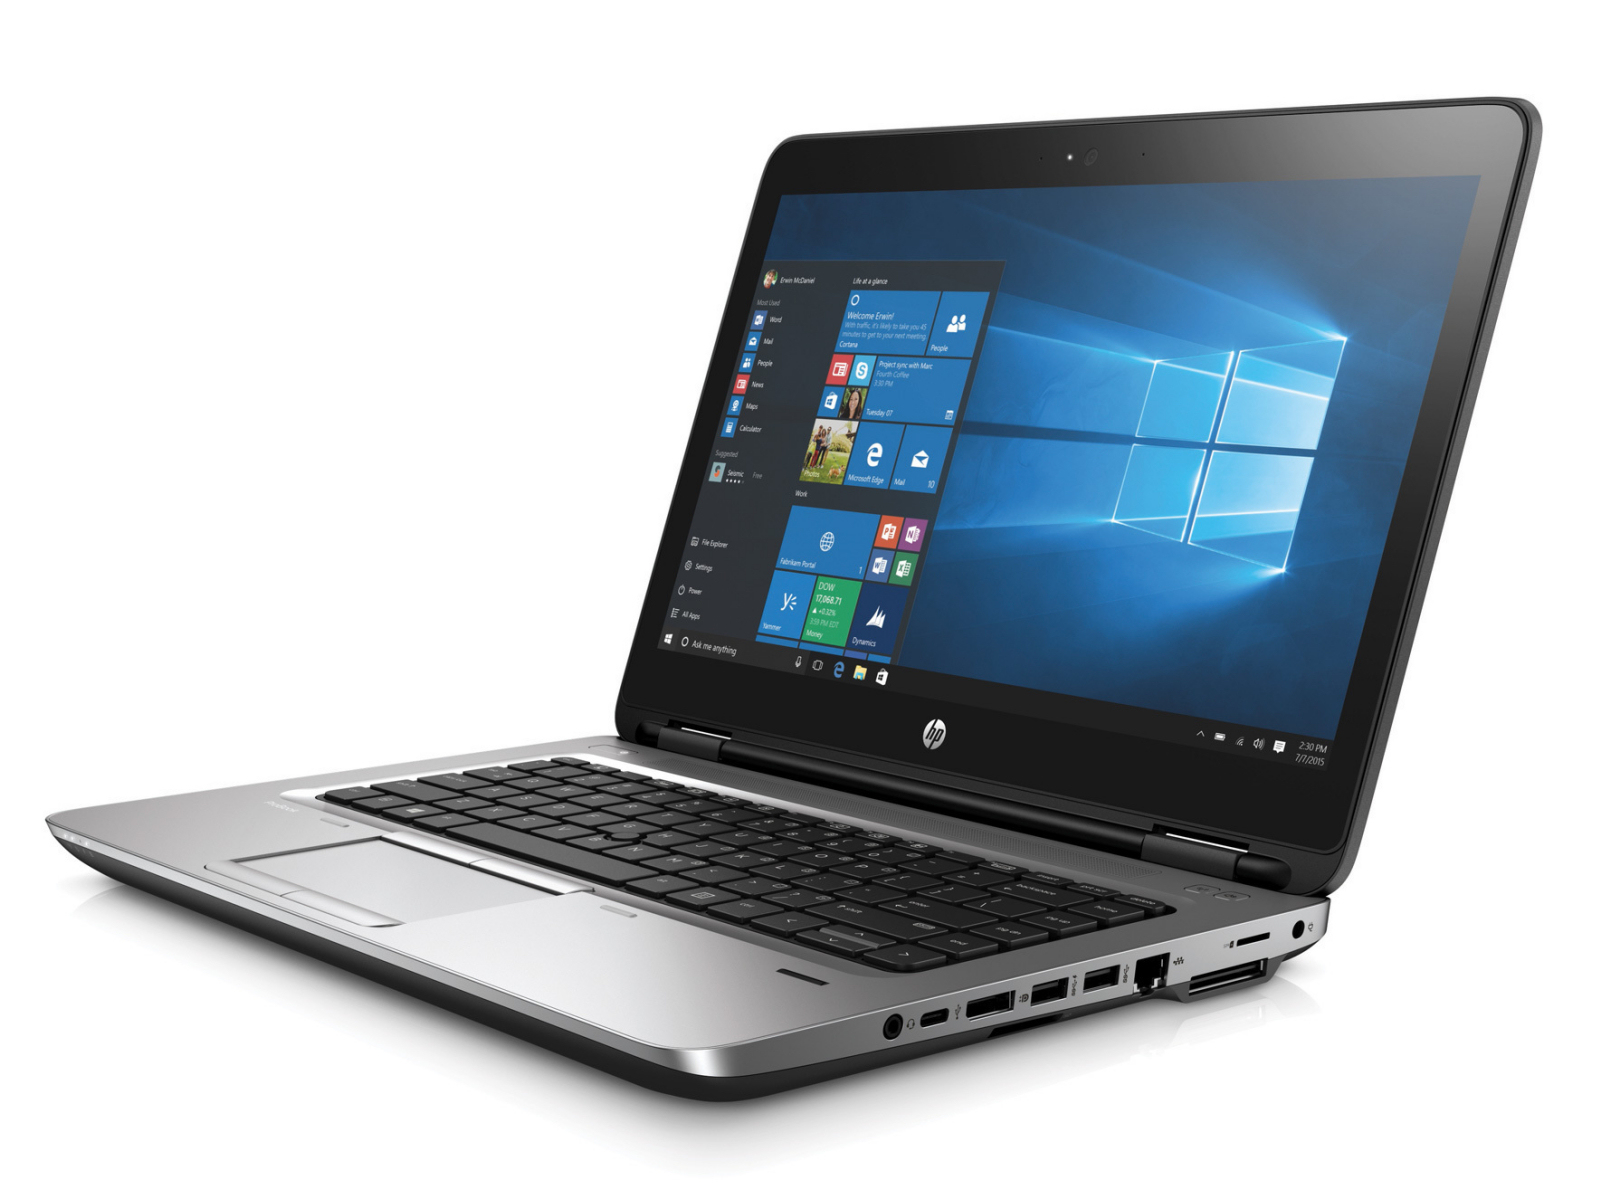
外壳和输入设备并没有变化,惠普沿用了上一代的设计。我们没有怨言因为两者都给我们留下了很好的印象。电池续航时间,和上一代一样,是十分出色的,足够一天的使用。LTE/HSPA+网络模块能够让你获得互联网链接或者是通过移动网络接入公司内网。 虽然惠普在这台笔记本上做了很多正确的事,但也有很多缺点能被列数。
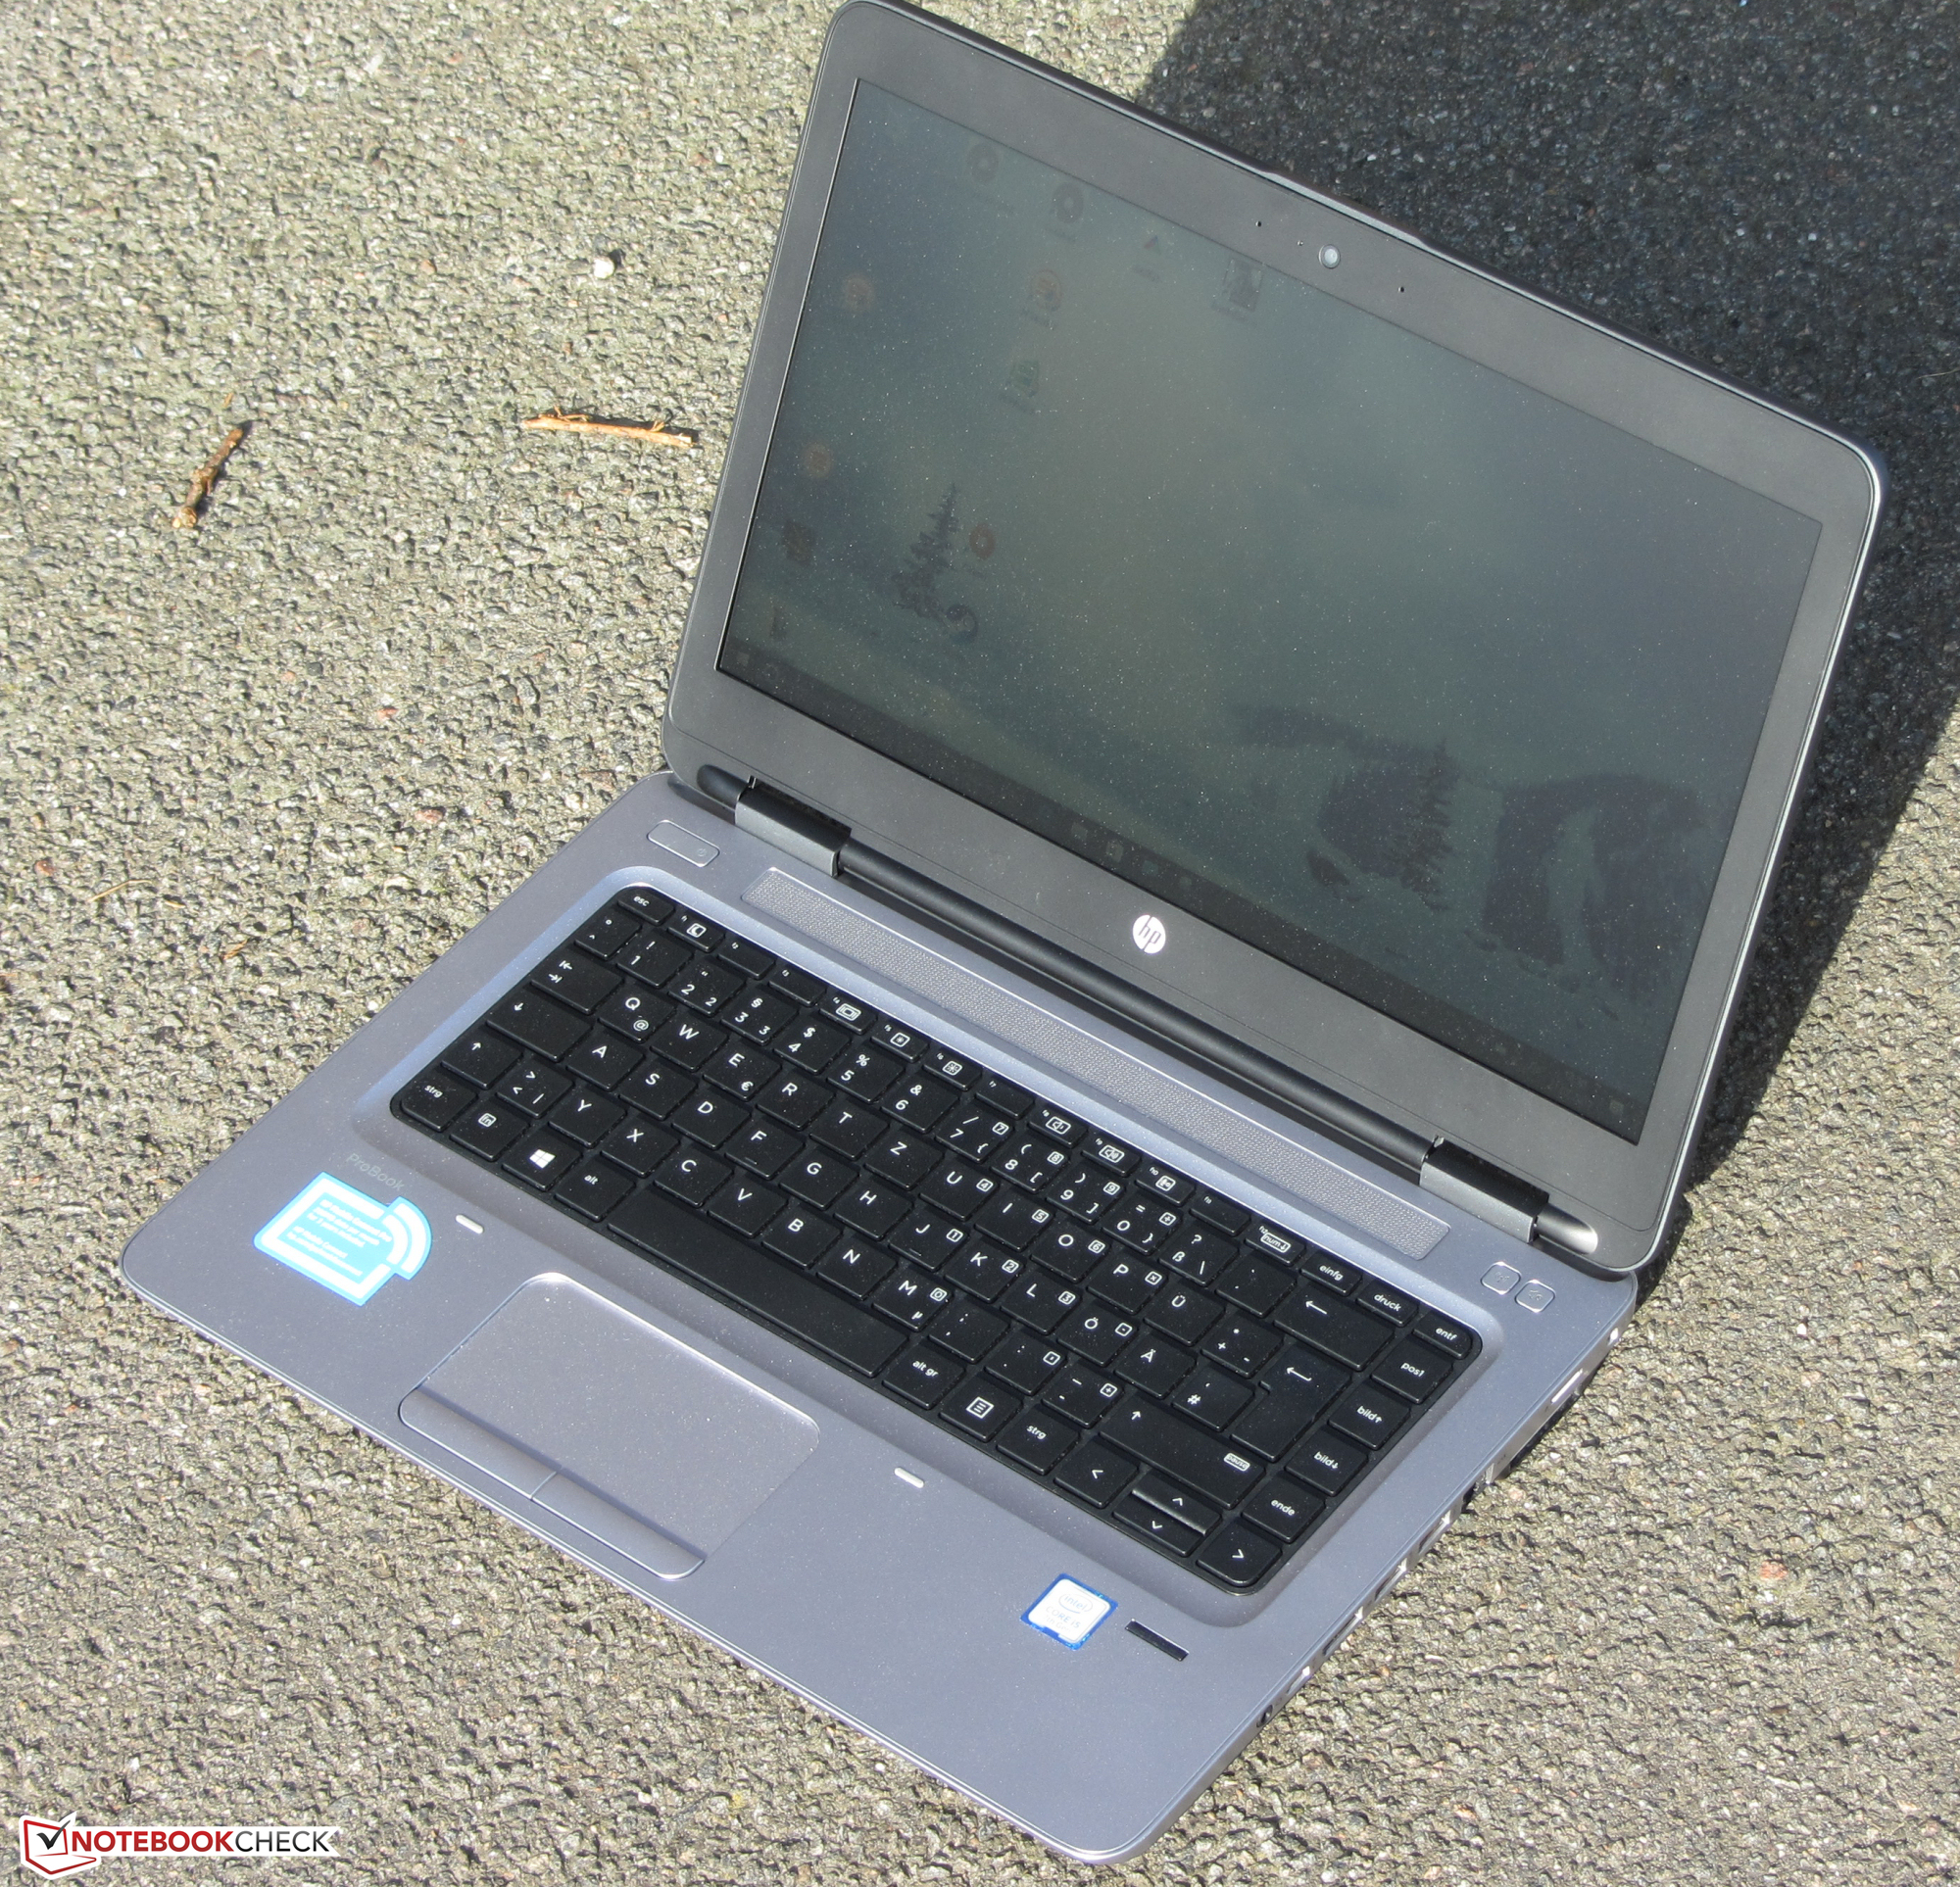
我们的批评再一次落在了屏幕上。它的可视角度偏小,对比度偏低。这是令人无法接受的。超过1000欧元(约合1062美元)的价位应该有一块更好的屏幕。还有一点,在这个价位,键盘应该有背光。最后但同样重要的是,惠普只提供了一年的保修。
注:本文是基于完整评测的缩减版本,阅读完整的英文评测,请点击这里。
HP ProBook 640 G3 Z2W33ET
- 02/27/2017 v6 (old)
Sascha Mölck