联想 Moto G5 智能手机简短评测
| Networking | |
| iperf3 transmit AX12 | |
| Lenovo Moto G5 | |
| Lenovo Moto G5 Plus | |
| LG K10 2017 | |
| Huawei P8 lite 2017 | |
| Asus Zenfone 3 Max ZC520TL | |
| iperf3 receive AX12 | |
| Lenovo Moto G5 | |
| Lenovo Moto G5 Plus | |
| Huawei P8 lite 2017 | |
| Asus Zenfone 3 Max ZC520TL | |
| LG K10 2017 | |


| |||||||||||||||||||||||||
Brightness Distribution: 92 %
Center on Battery: 660 cd/m²
Contrast: 2276:1 (Black: 0.29 cd/m²)
ΔE ColorChecker Calman: 4.9 | ∀{0.5-29.43 Ø4.71}
ΔE Greyscale Calman: 4.8 | ∀{0.09-98 Ø4.96}
Gamma: 2.18
CCT: 7357 K
| Lenovo Moto G5 IPS, 1920x1080, 5" | Lenovo Moto G5 Plus IPS, 1920x1080, 5.2" | Lenovo Moto G4 IPS, 1920x1080, 5.5" | LG K10 2017 IPS, 1280x720, 5.3" | Huawei P8 lite 2017 IPS, 1920x1080, 5.2" | Asus Zenfone 3 Max ZC520TL IPS, 1280x720, 5.2" | |
|---|---|---|---|---|---|---|
| Screen | -22% | -23% | -38% | -23% | -23% | |
| Brightness middle (cd/m²) | 660 | 503 -24% | 724 10% | 384 -42% | 575 -13% | 507 -23% |
| Brightness (cd/m²) | 625 | 495 -21% | 723 16% | 350 -44% | 559 -11% | 474 -24% |
| Brightness Distribution (%) | 92 | 96 4% | 87 -5% | 85 -8% | 91 -1% | 85 -8% |
| Black Level * (cd/m²) | 0.29 | 0.31 -7% | 0.71 -145% | 0.36 -24% | 0.39 -34% | 0.53 -83% |
| Contrast (:1) | 2276 | 1623 -29% | 1020 -55% | 1067 -53% | 1474 -35% | 957 -58% |
| Colorchecker dE 2000 * | 4.9 | 6.2 -27% | 4.5 8% | 6 -22% | 5.2 -6% | 4.7 4% |
| Colorchecker dE 2000 max. * | 7.6 | 9.8 -29% | 8.4 -11% | 14 -84% | 10.3 -36% | 7.2 5% |
| Greyscale dE 2000 * | 4.8 | 6.8 -42% | 4.9 -2% | 5.9 -23% | 7.2 -50% | 4.8 -0% |
| Gamma | 2.18 101% | 2.33 94% | 2.44 90% | 2 110% | 2.4 92% | 2.25 98% |
| CCT | 7357 88% | 8113 80% | 6496 100% | 8042 81% | 7224 90% | 6441 101% |
* ... smaller is better
Screen Flickering / PWM (Pulse-Width Modulation)
| Screen flickering / PWM detected | 2358 Hz | ≤ 1 % brightness setting | 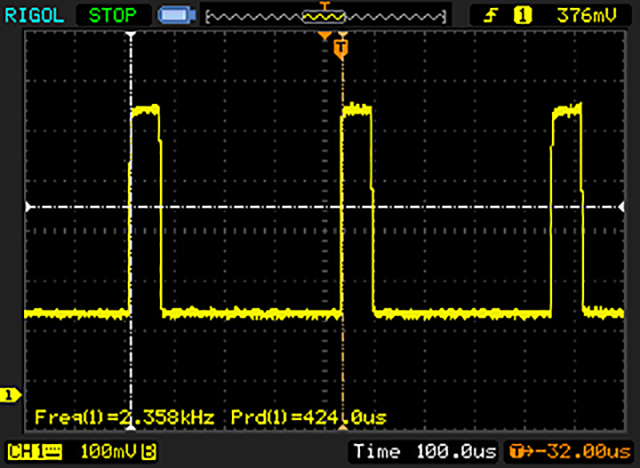 |
The display backlight flickers at 2358 Hz (worst case, e.g., utilizing PWM) Flickering detected at a brightness setting of 1 % and below. There should be no flickering or PWM above this brightness setting. The frequency of 2358 Hz is quite high, so most users sensitive to PWM should not notice any flickering. In comparison: 52 % of all tested devices do not use PWM to dim the display. If PWM was detected, an average of 7754 (minimum: 5 - maximum: 343500) Hz was measured. | |||
Display Response Times
| ↔ Response Time Black to White | ||
|---|---|---|
| 26 ms ... rise ↗ and fall ↘ combined | ↗ 11 ms rise | 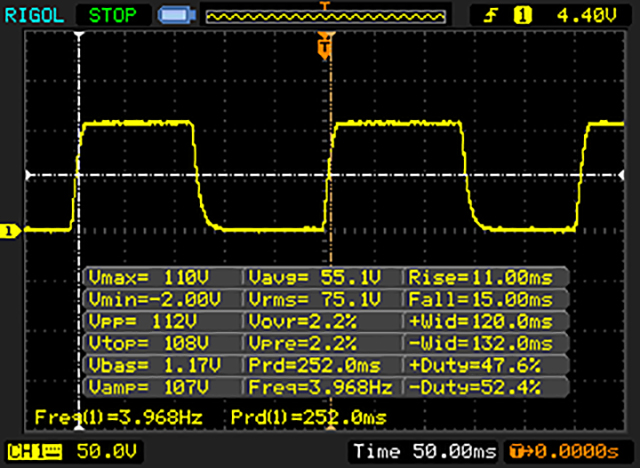 |
| ↘ 15 ms fall | ||
| The screen shows relatively slow response rates in our tests and may be too slow for gamers. In comparison, all tested devices range from 0.1 (minimum) to 240 (maximum) ms. » 63 % of all devices are better. This means that the measured response time is worse than the average of all tested devices (19.8 ms). | ||
| ↔ Response Time 50% Grey to 80% Grey | ||
| 56 ms ... rise ↗ and fall ↘ combined | ↗ 31 ms rise | 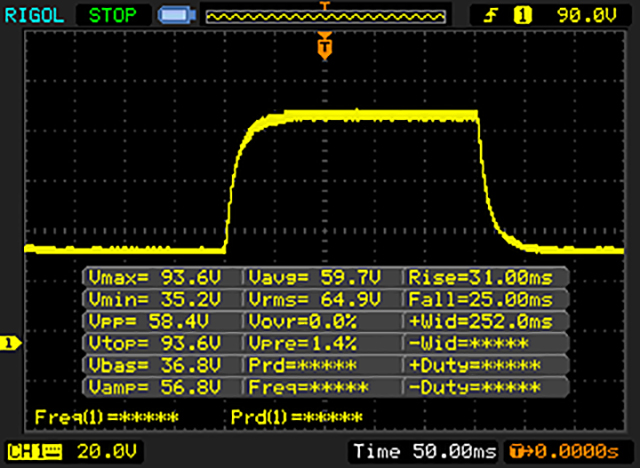 |
| ↘ 25 ms fall | ||
| The screen shows slow response rates in our tests and will be unsatisfactory for gamers. In comparison, all tested devices range from 0.165 (minimum) to 636 (maximum) ms. » 93 % of all devices are better. This means that the measured response time is worse than the average of all tested devices (31 ms). | ||
(±) The maximum temperature on the upper side is 43 °C / 109 F, compared to the average of 35.3 °C / 96 F, ranging from 21.9 to 247 °C for the class Smartphone.
(+) The bottom heats up to a maximum of 36.6 °C / 98 F, compared to the average of 34 °C / 93 F
(±) In idle usage, the average temperature for the upper side is 32.2 °C / 90 F, compared to the device average of 33 °C / 91 F.
Lenovo Moto G5 audio analysis
(+) | speakers can play relatively loud (82.1 dB)
Bass 100 - 315 Hz
(-) | nearly no bass - on average 26.5% lower than median
(±) | linearity of bass is average (10.3% delta to prev. frequency)
Mids 400 - 2000 Hz
(±) | higher mids - on average 5.4% higher than median
(+) | mids are linear (6.3% delta to prev. frequency)
Highs 2 - 16 kHz
(+) | balanced highs - only 3.8% away from median
(+) | highs are linear (3.2% delta to prev. frequency)
Overall 100 - 16.000 Hz
(±) | linearity of overall sound is average (23.8% difference to median)
Compared to same class
» 55% of all tested devices in this class were better, 8% similar, 37% worse
» The best had a delta of 11%, average was 34%, worst was 134%
Compared to all devices tested
» 71% of all tested devices were better, 6% similar, 22% worse
» The best had a delta of 4%, average was 23%, worst was 134%
Lenovo Moto G4 audio analysis
(+) | speakers can play relatively loud (86.6 dB)
Bass 100 - 315 Hz
(-) | nearly no bass - on average 24.6% lower than median
(±) | linearity of bass is average (10.2% delta to prev. frequency)
Mids 400 - 2000 Hz
(+) | balanced mids - only 4.4% away from median
(+) | mids are linear (4.7% delta to prev. frequency)
Highs 2 - 16 kHz
(+) | balanced highs - only 3.4% away from median
(+) | highs are linear (3.1% delta to prev. frequency)
Overall 100 - 16.000 Hz
(±) | linearity of overall sound is average (18.6% difference to median)
Compared to same class
» 22% of all tested devices in this class were better, 9% similar, 69% worse
» The best had a delta of 11%, average was 34%, worst was 134%
Compared to all devices tested
» 42% of all tested devices were better, 8% similar, 50% worse
» The best had a delta of 4%, average was 23%, worst was 134%
| Off / Standby | |
| Idle | |
| Load |
|
Key:
min: | |
| Lenovo Moto G5 2800 mAh | Lenovo Moto G5 Plus 3000 mAh | Lenovo Moto G4 3000 mAh | LG K10 2017 2800 mAh | Huawei P8 lite 2017 3000 mAh | Asus Zenfone 3 Max ZC520TL 4100 mAh | |
|---|---|---|---|---|---|---|
| Power Consumption | -4% | -19% | 8% | -47% | -25% | |
| Idle Minimum * (Watt) | 0.73 | 0.91 -25% | 0.65 11% | 0.76 -4% | 1.44 -97% | 0.74 -1% |
| Idle Average * (Watt) | 1.64 | 1.83 -12% | 1.89 -15% | 1.59 3% | 2.47 -51% | 2.04 -24% |
| Idle Maximum * (Watt) | 1.68 | 1.87 -11% | 1.92 -14% | 1.61 4% | 2.58 -54% | 2.22 -32% |
| Load Average * (Watt) | 3.46 | 3.17 8% | 5.28 -53% | 3.24 6% | 4.55 -32% | 5.57 -61% |
| Load Maximum * (Watt) | 6.13 | 4.87 21% | 7.45 -22% | 4.15 32% | 6.3 -3% | 6.59 -8% |
* ... smaller is better
Pros
Cons
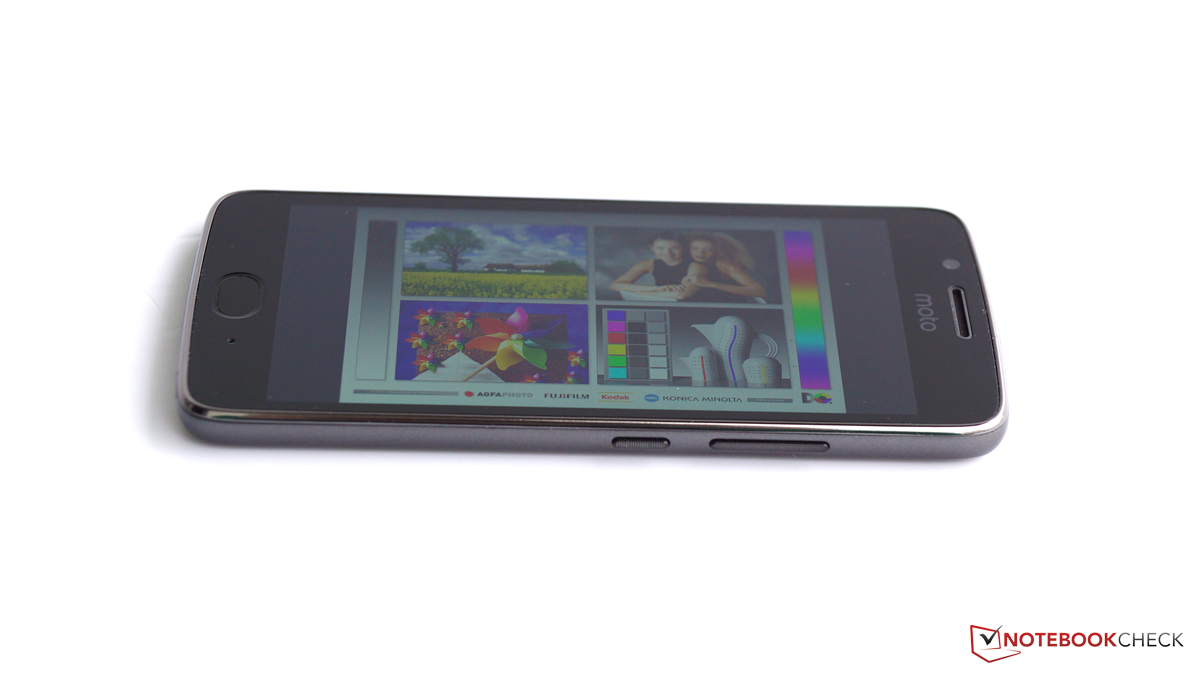
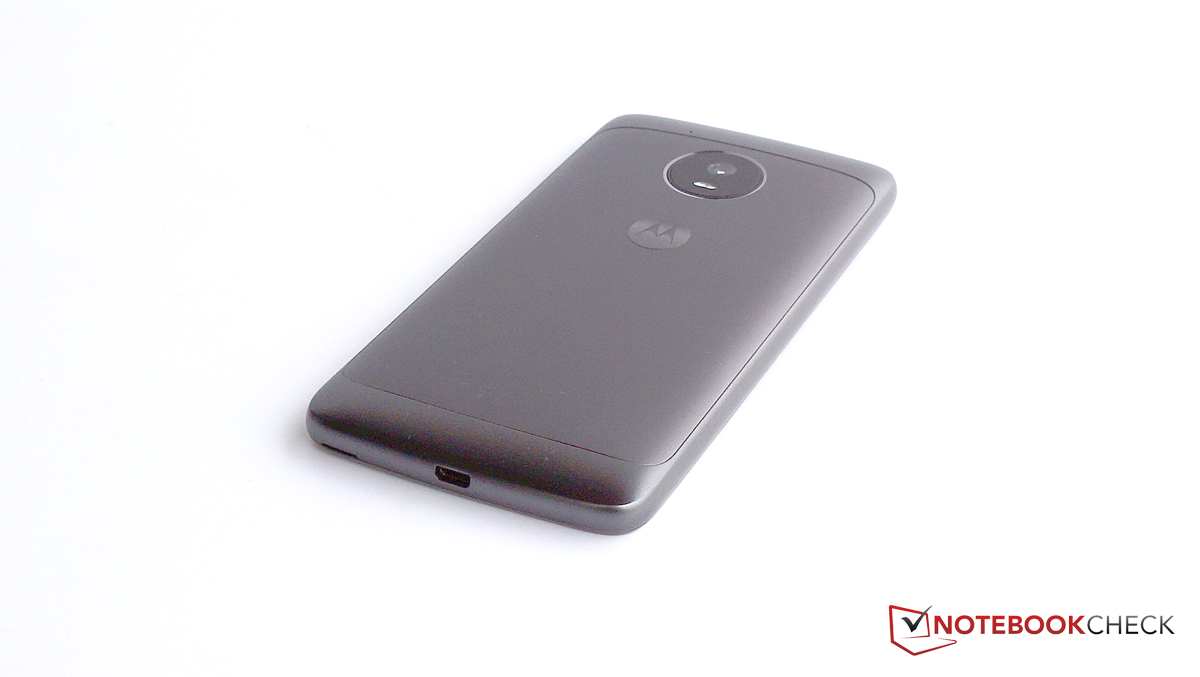
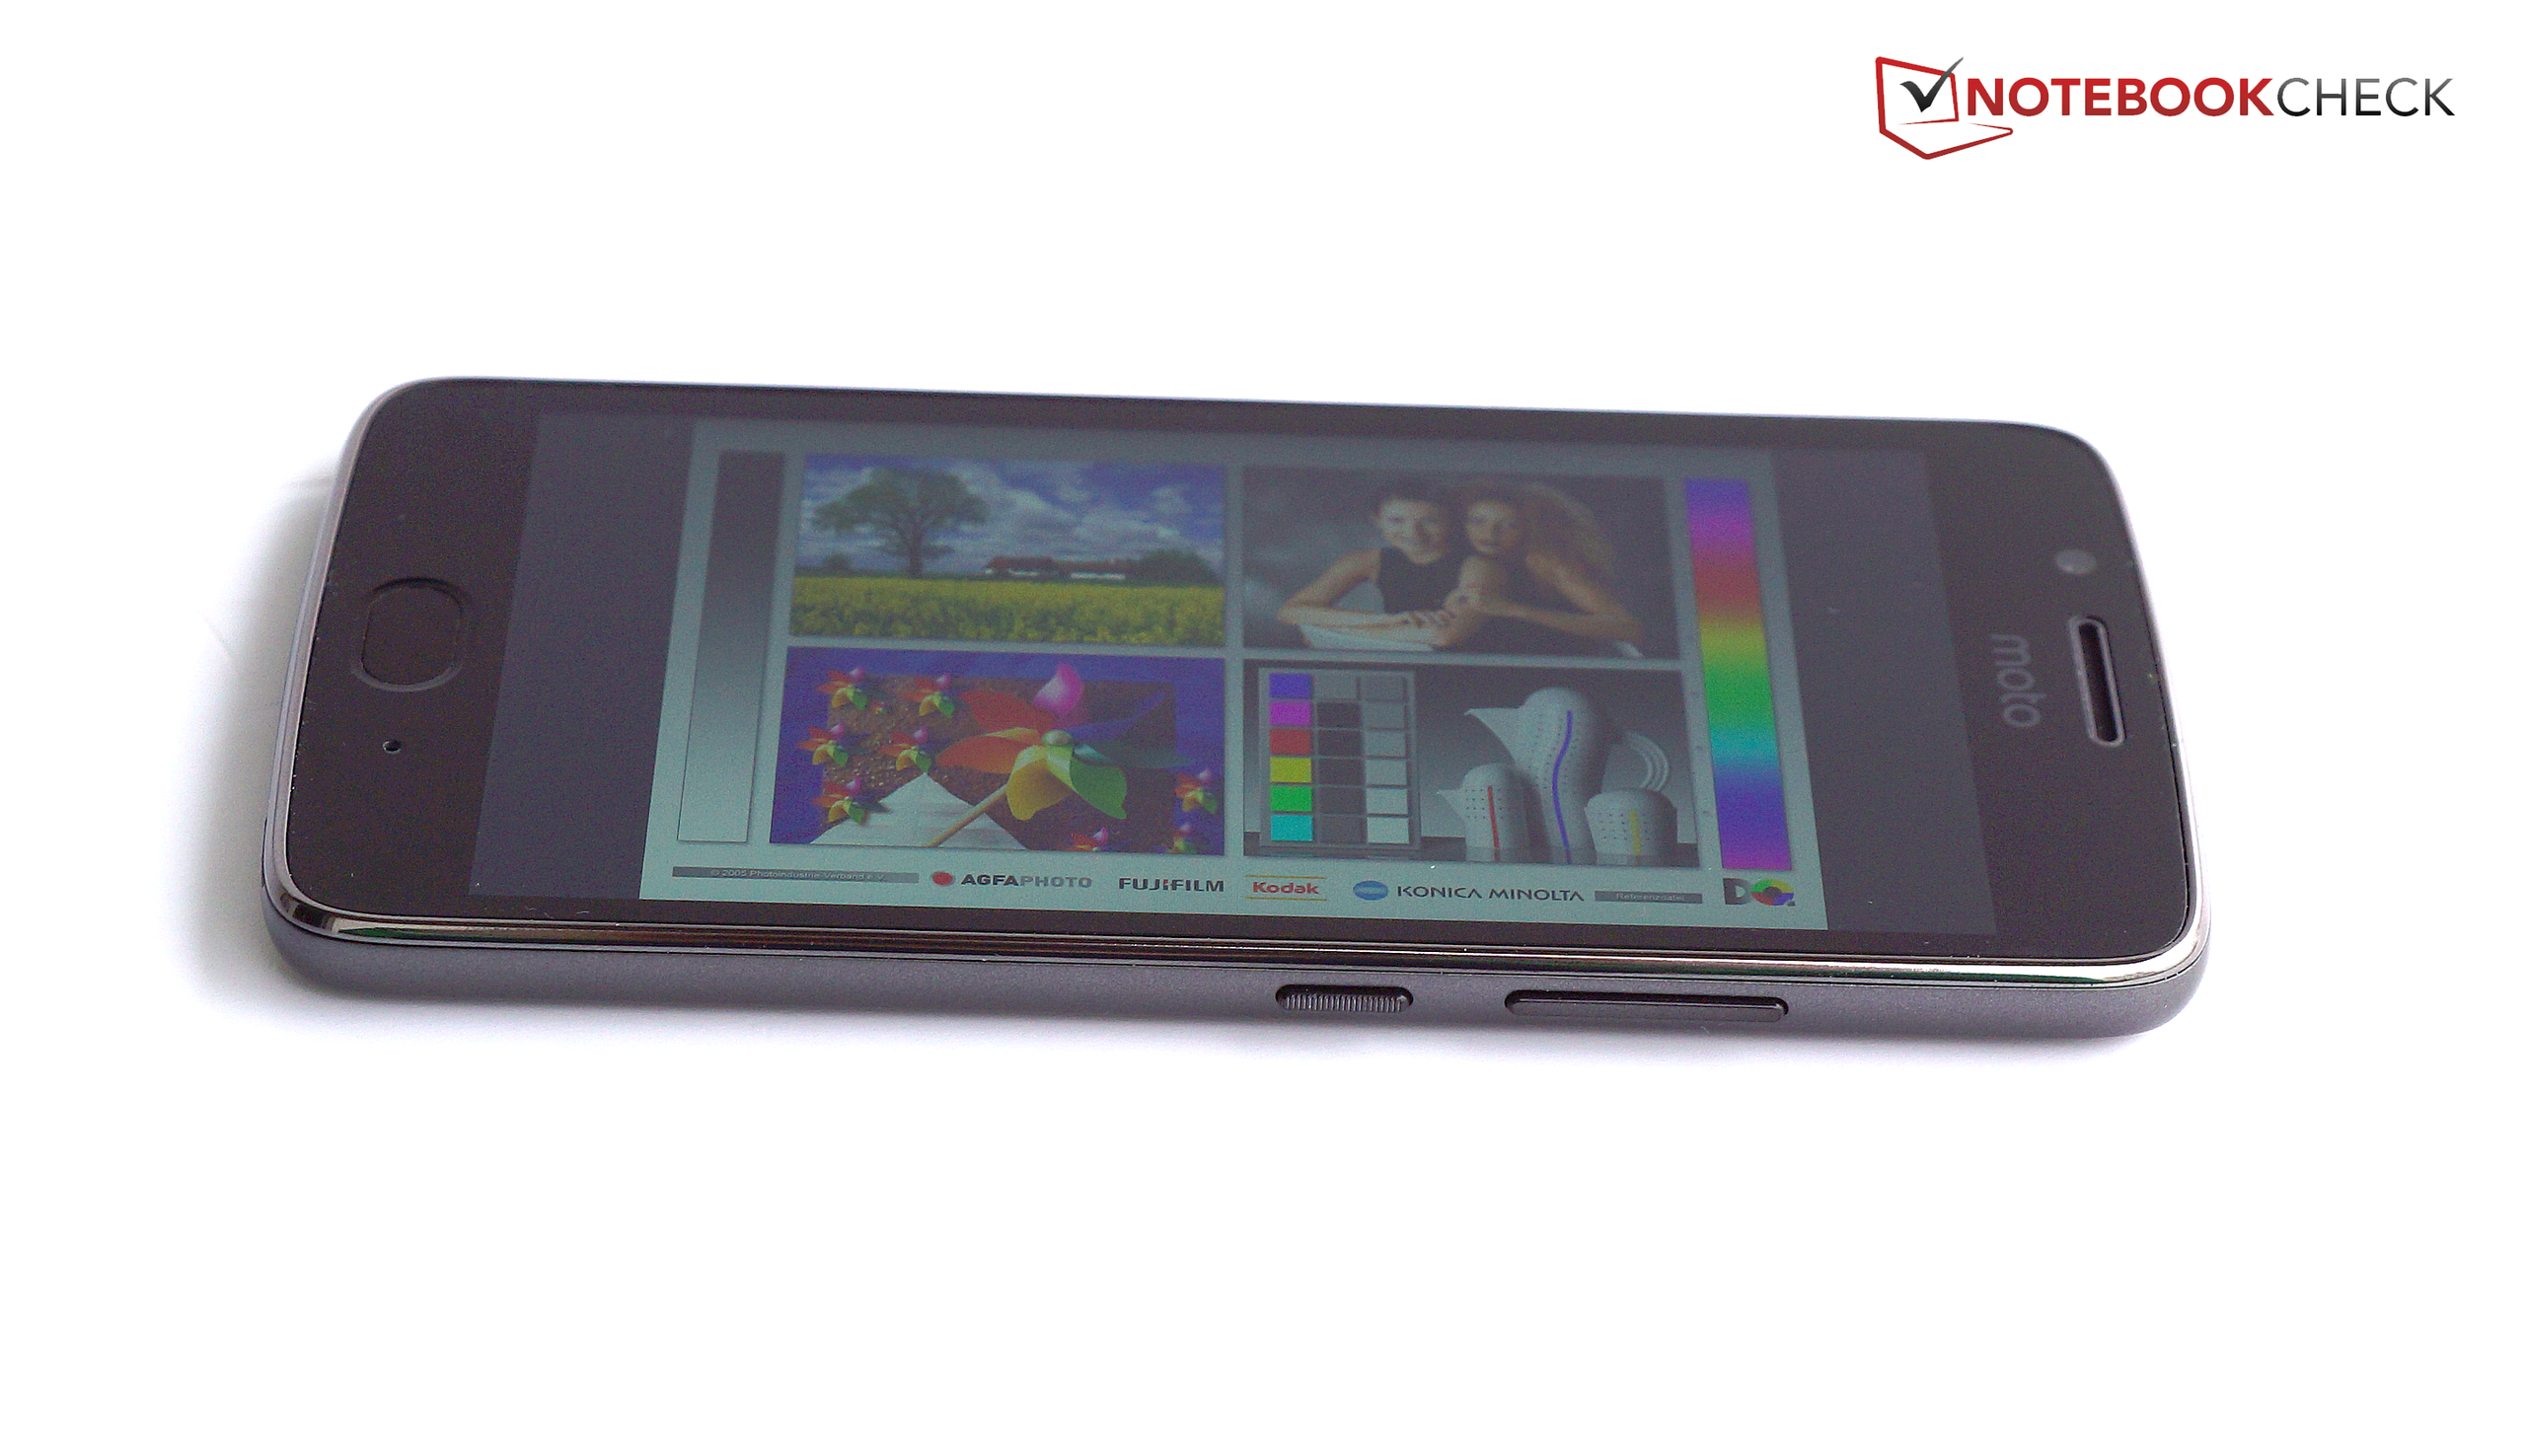
第一眼看到Moto G5,我们就确定它会是一台十分有趣的智能手机:在保持实惠价位的同时搭配了高品质屏幕,轻盈金属机身,不错的硬件配置和可更换电池设计。联想很好地证明了在中低端市场保持竞争力并不一定需要让用户被迫接受一块昏暗、低对比度的屏幕和缓慢的通信模组。
拿出250美元(约1725人民币)的预算,用户可以得到一块低黑值、高对比度的明亮屏幕,不错的扬声器,坚固金属机身,可更换电池,和指纹感应器。除此之外它还提供了高速的无线模组和内部闪存,不错的性能和优秀的通话品质让它在这个价位上近乎完美。它需要改进的方面包括:相机在暗光环境下的拍摄效果,负载下较高的发热量,一般般的电池续航。
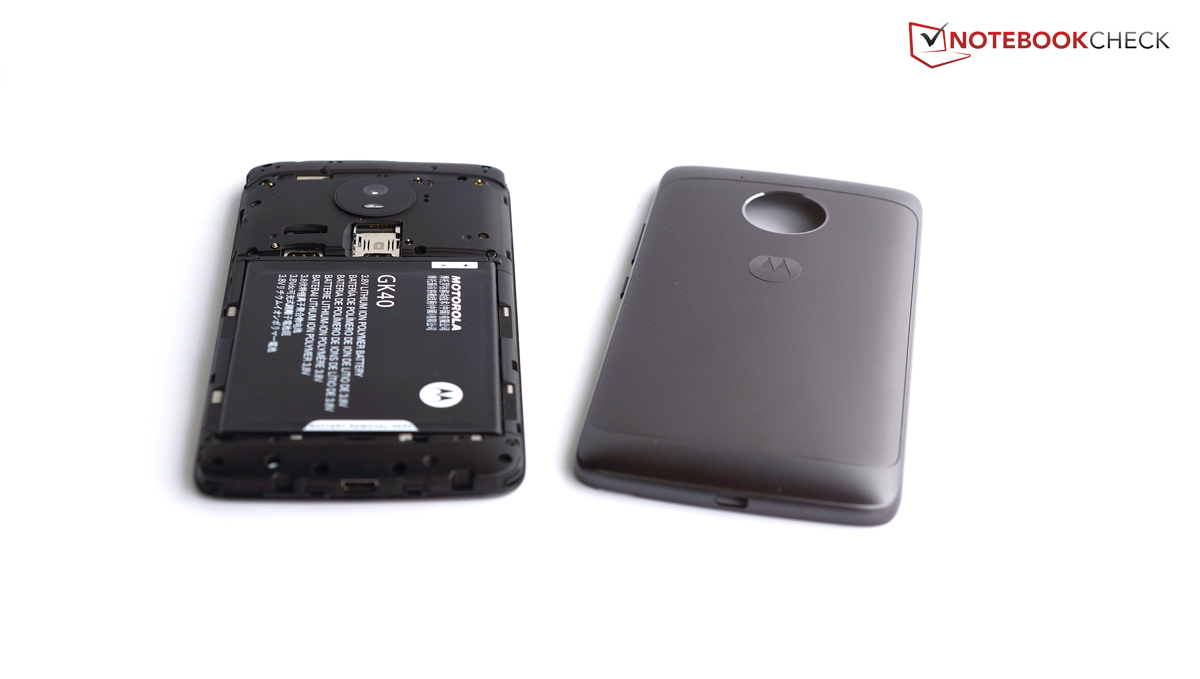
Moto G5提供了优秀的功能和很高的性价比。电池续航相对不足的问题可以通过支持更换电池功能得到解决。
G5和G5 Plus之间的价差现在变得越来越大,这也要归功于相比G4联想成功地进一步降低了G5的售价。联想得以在降低售价的同时改进组件的品质让我们十分钦佩,这也让G5在中低端价位上成为了非常值得参考的一款机型。
注:本文是基于完整评测的缩减版本,阅读完整的英文评测,请点击这里。
Price comparison
