
结论经济实惠的家用平板电脑
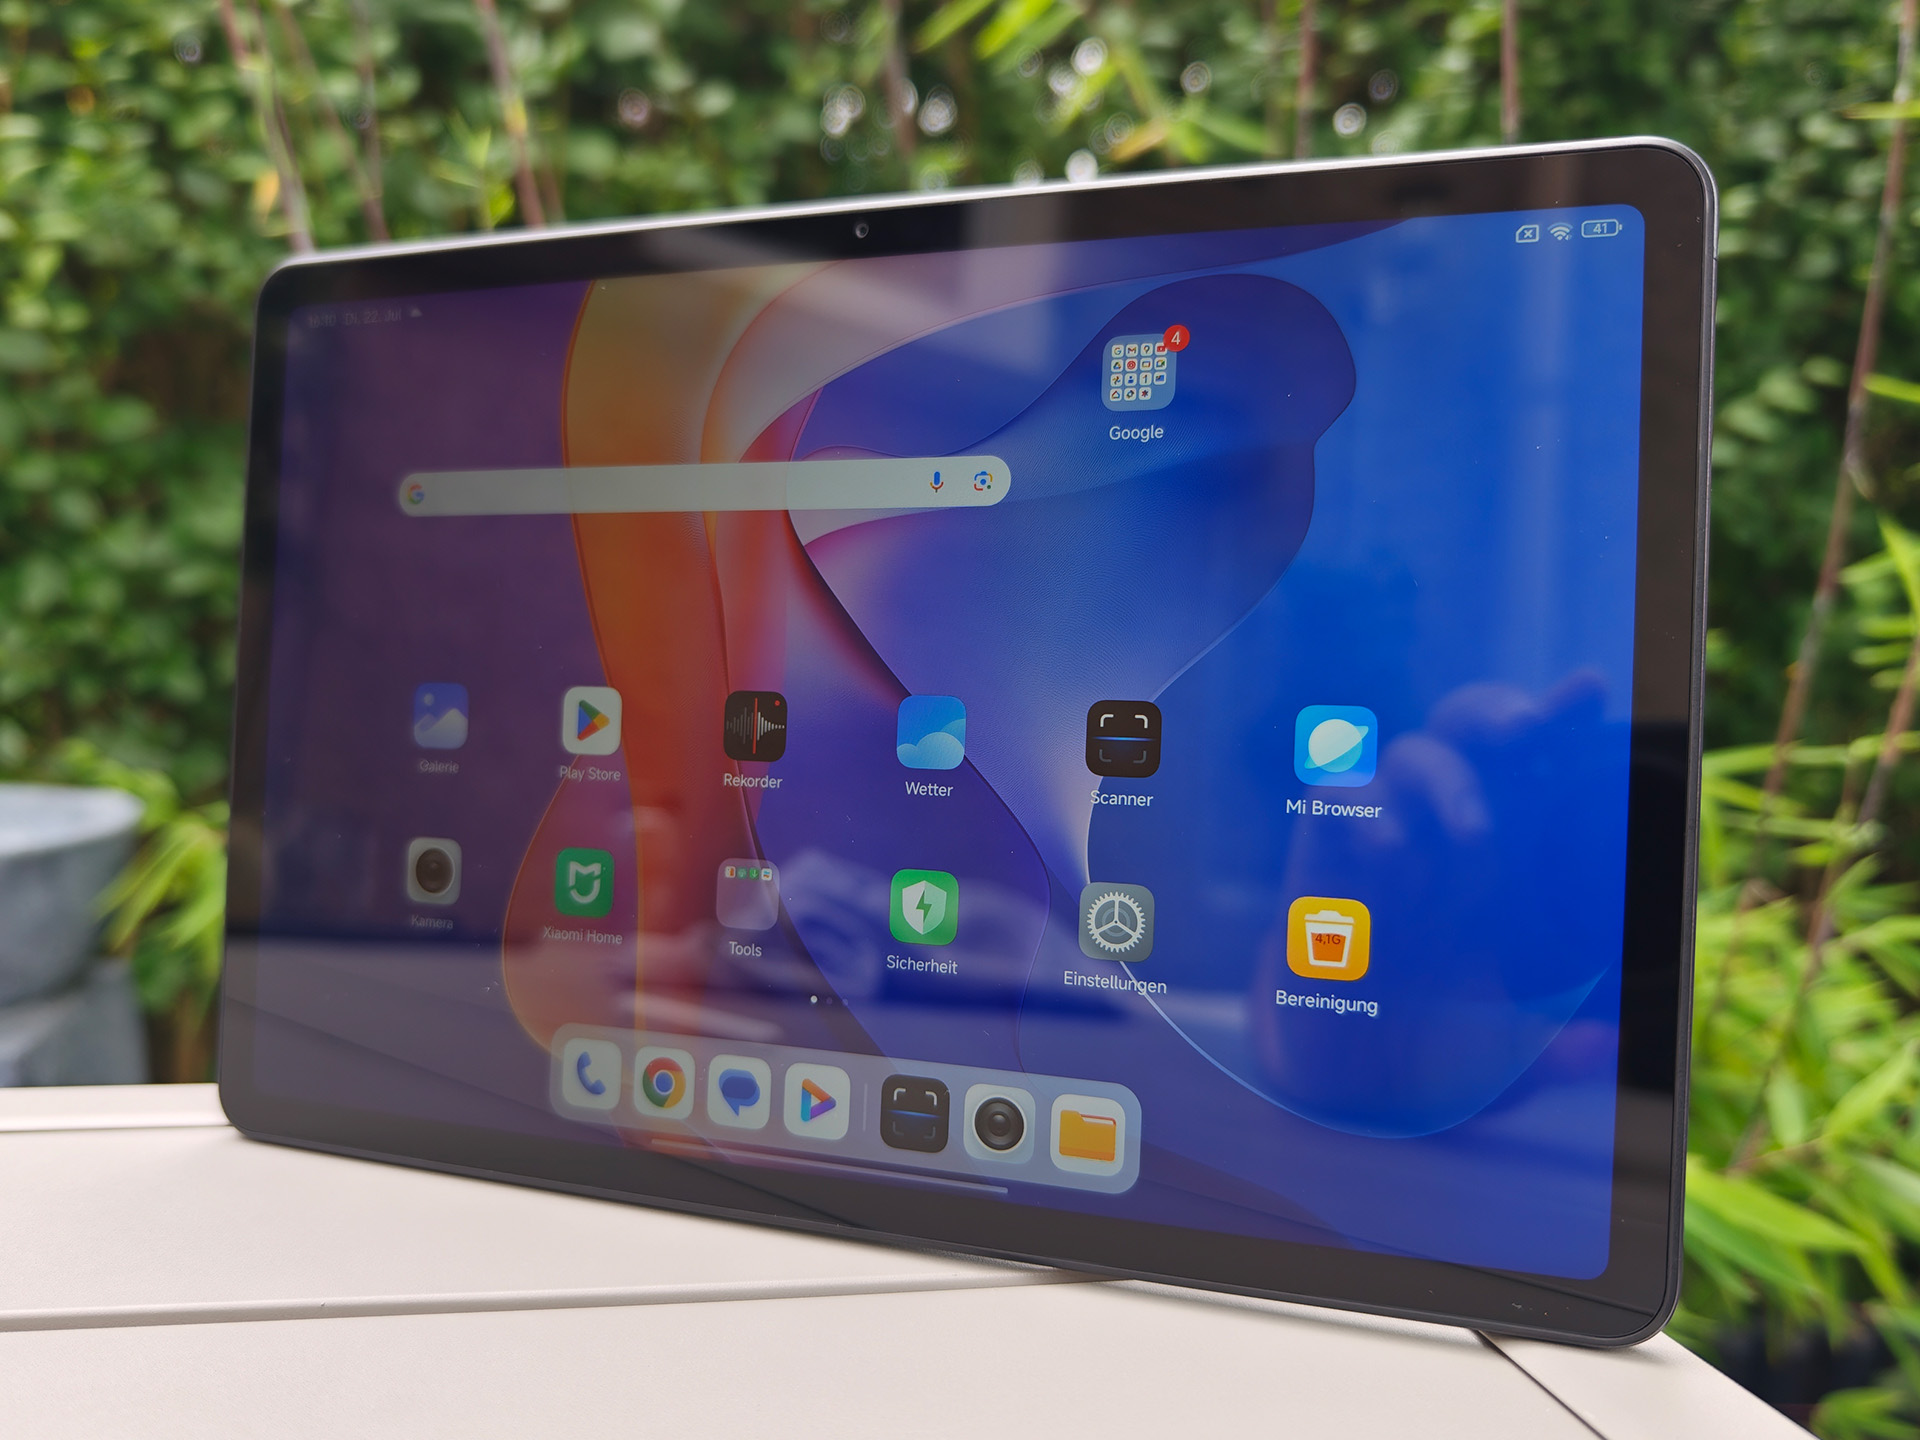
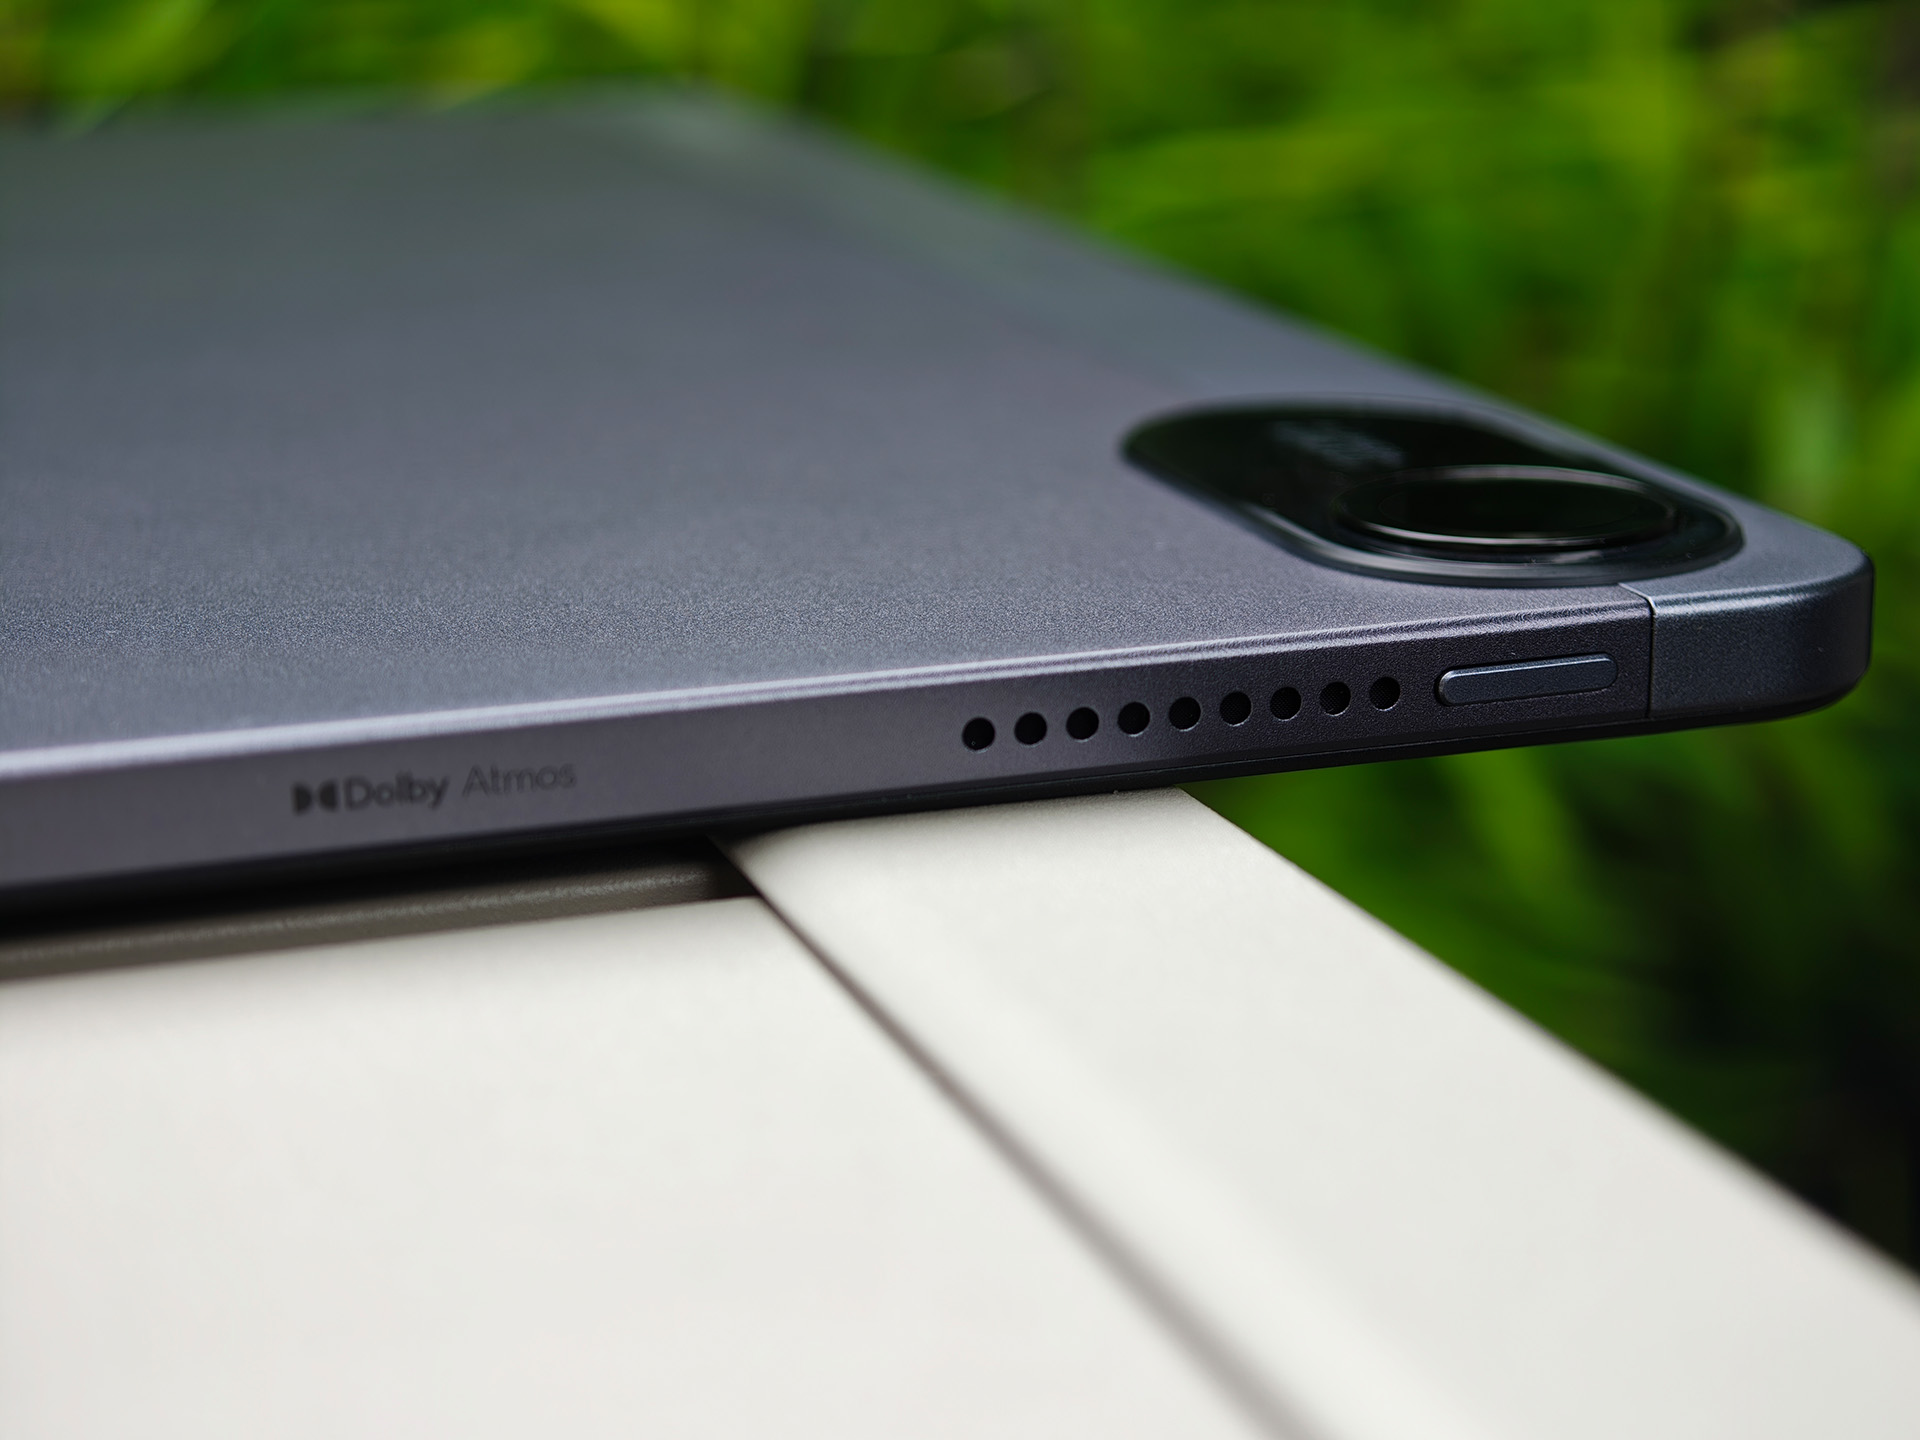
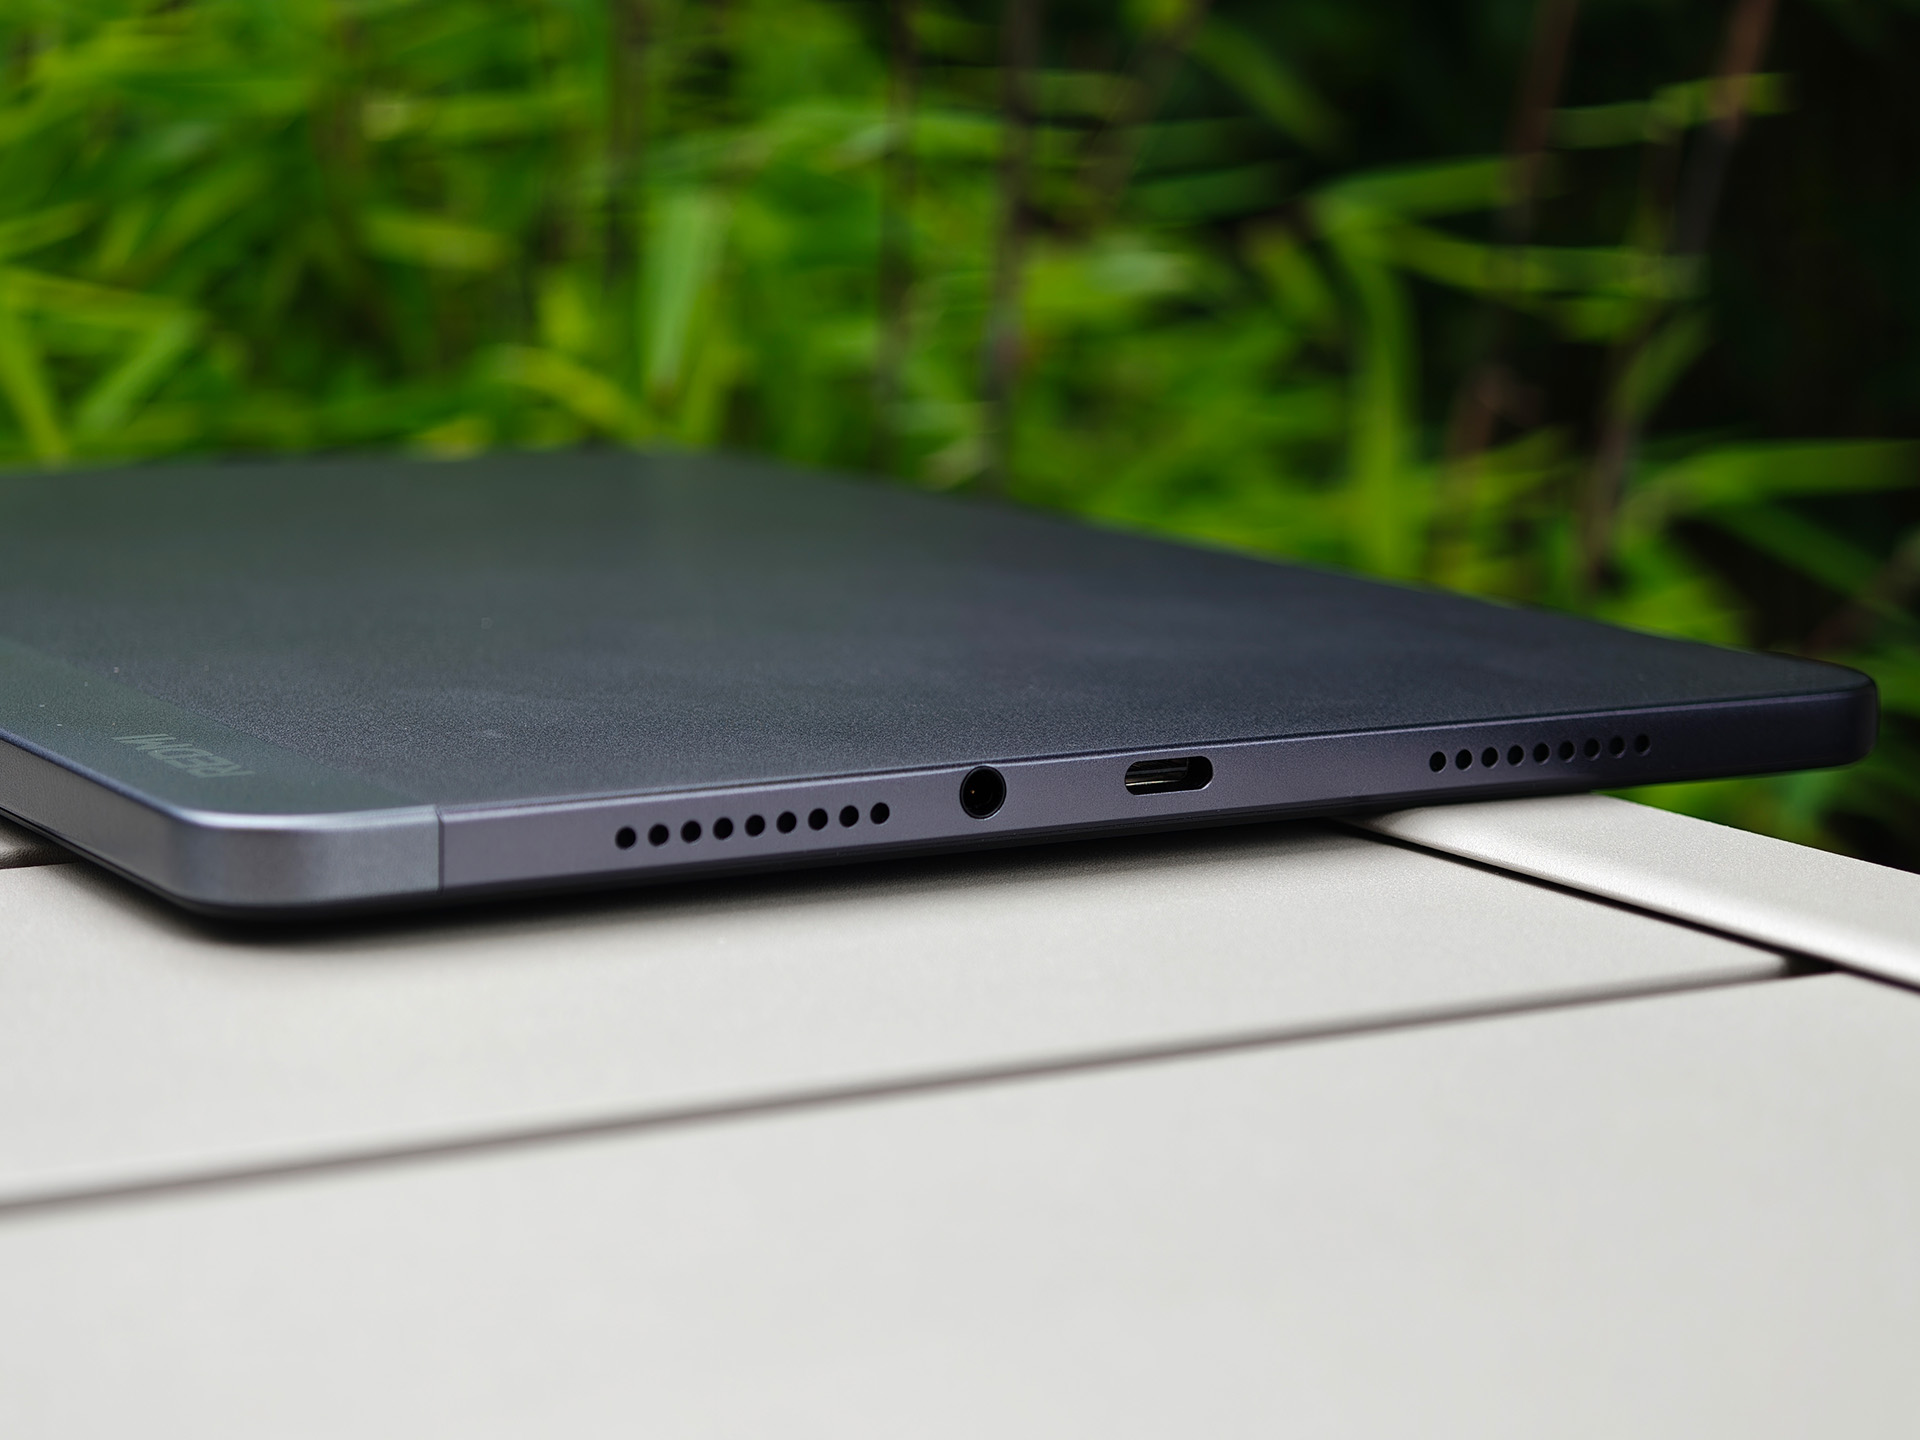
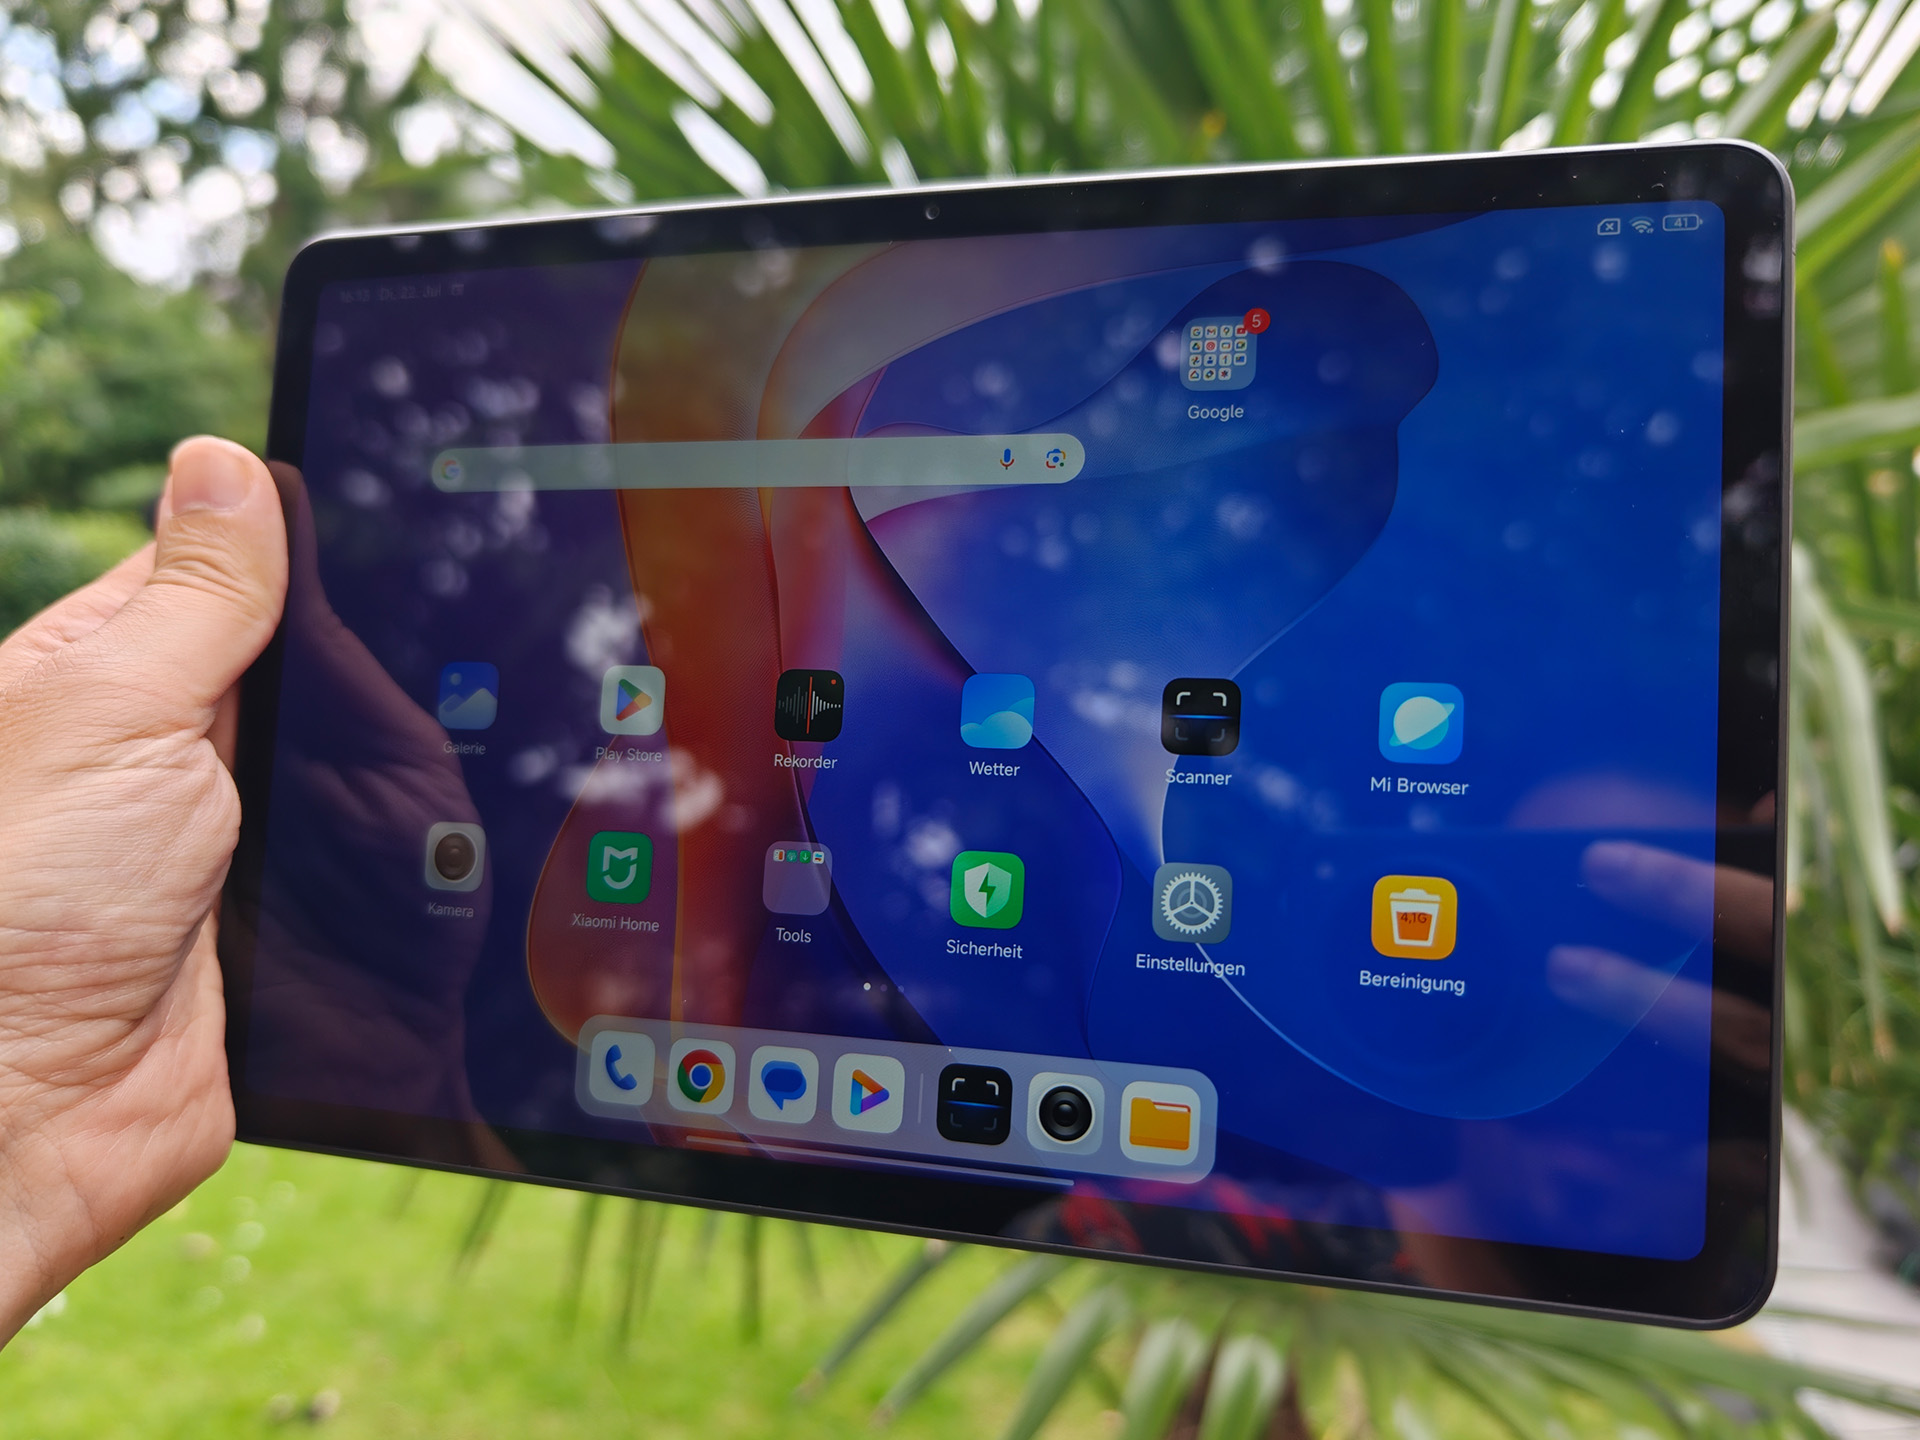
小米红米 Pad 2 4G 是一款具有良好多媒体功能的平板电脑。四个扬声器提供了动人的音效体验。此外,还配备了音频插孔、FM 收音机、LTE 支持和 microSD 支持。11 英寸显示屏经过精心调校,对比度清晰。
另一方面,显示屏的亮度不是特别高,只在有限的范围内适合户外使用,而且也没有 HDR 功能。虚拟环境光线传感器运行缓慢。系统速度尚可,但 SoC 的储备不多。
最大的优点是红米平板电脑的价格已经大幅下降,很难再找到功能相当的便宜平板电脑了。
Pros
Cons
- $234.99XIAOMI Redmi Pad 2 4G LTE (Compatible with Tmobile Mint Tello & Global) 11" 2.5K Octa Core 4 Speakers Global ROM 9000mAh Bluetooth 5.3 8MP Model 25040RP0AL (Graphite Gray, 128GB + 6GB)
- $274.79XIAOMI Redmi Pad 2 4G LTE (Compatible with Tmobile Mint Tello & Global) GSM 11" 2.5K Octa Core 4 Speakers Global ROM 9000mAh Bluetooth 5.3 8MP Model 25040RP0AL (Graphite Gray, 256GB + 8GB)
- $232.99XIAOMI Redmi Pad 2 4G LTE (Compatible with Tmobile Mint Tello & Global) 11" 2.5K Octa Core 4 Speakers Global ROM 9000mAh Bluetooth 5.3 8MP Model 25040RP0AL (Mint Green, 128GB + 6GB)
继 红米 Pad在经历了如此长的时间之后,它的创新比预期的要少。
不过,由于配备了音频插孔和可选的 microSD 扩展功能,这款小米平板电脑仍然忠实于其核心价值,现在还可以选择连接到移动网络。
规格 小米红米 Pad 2 4G
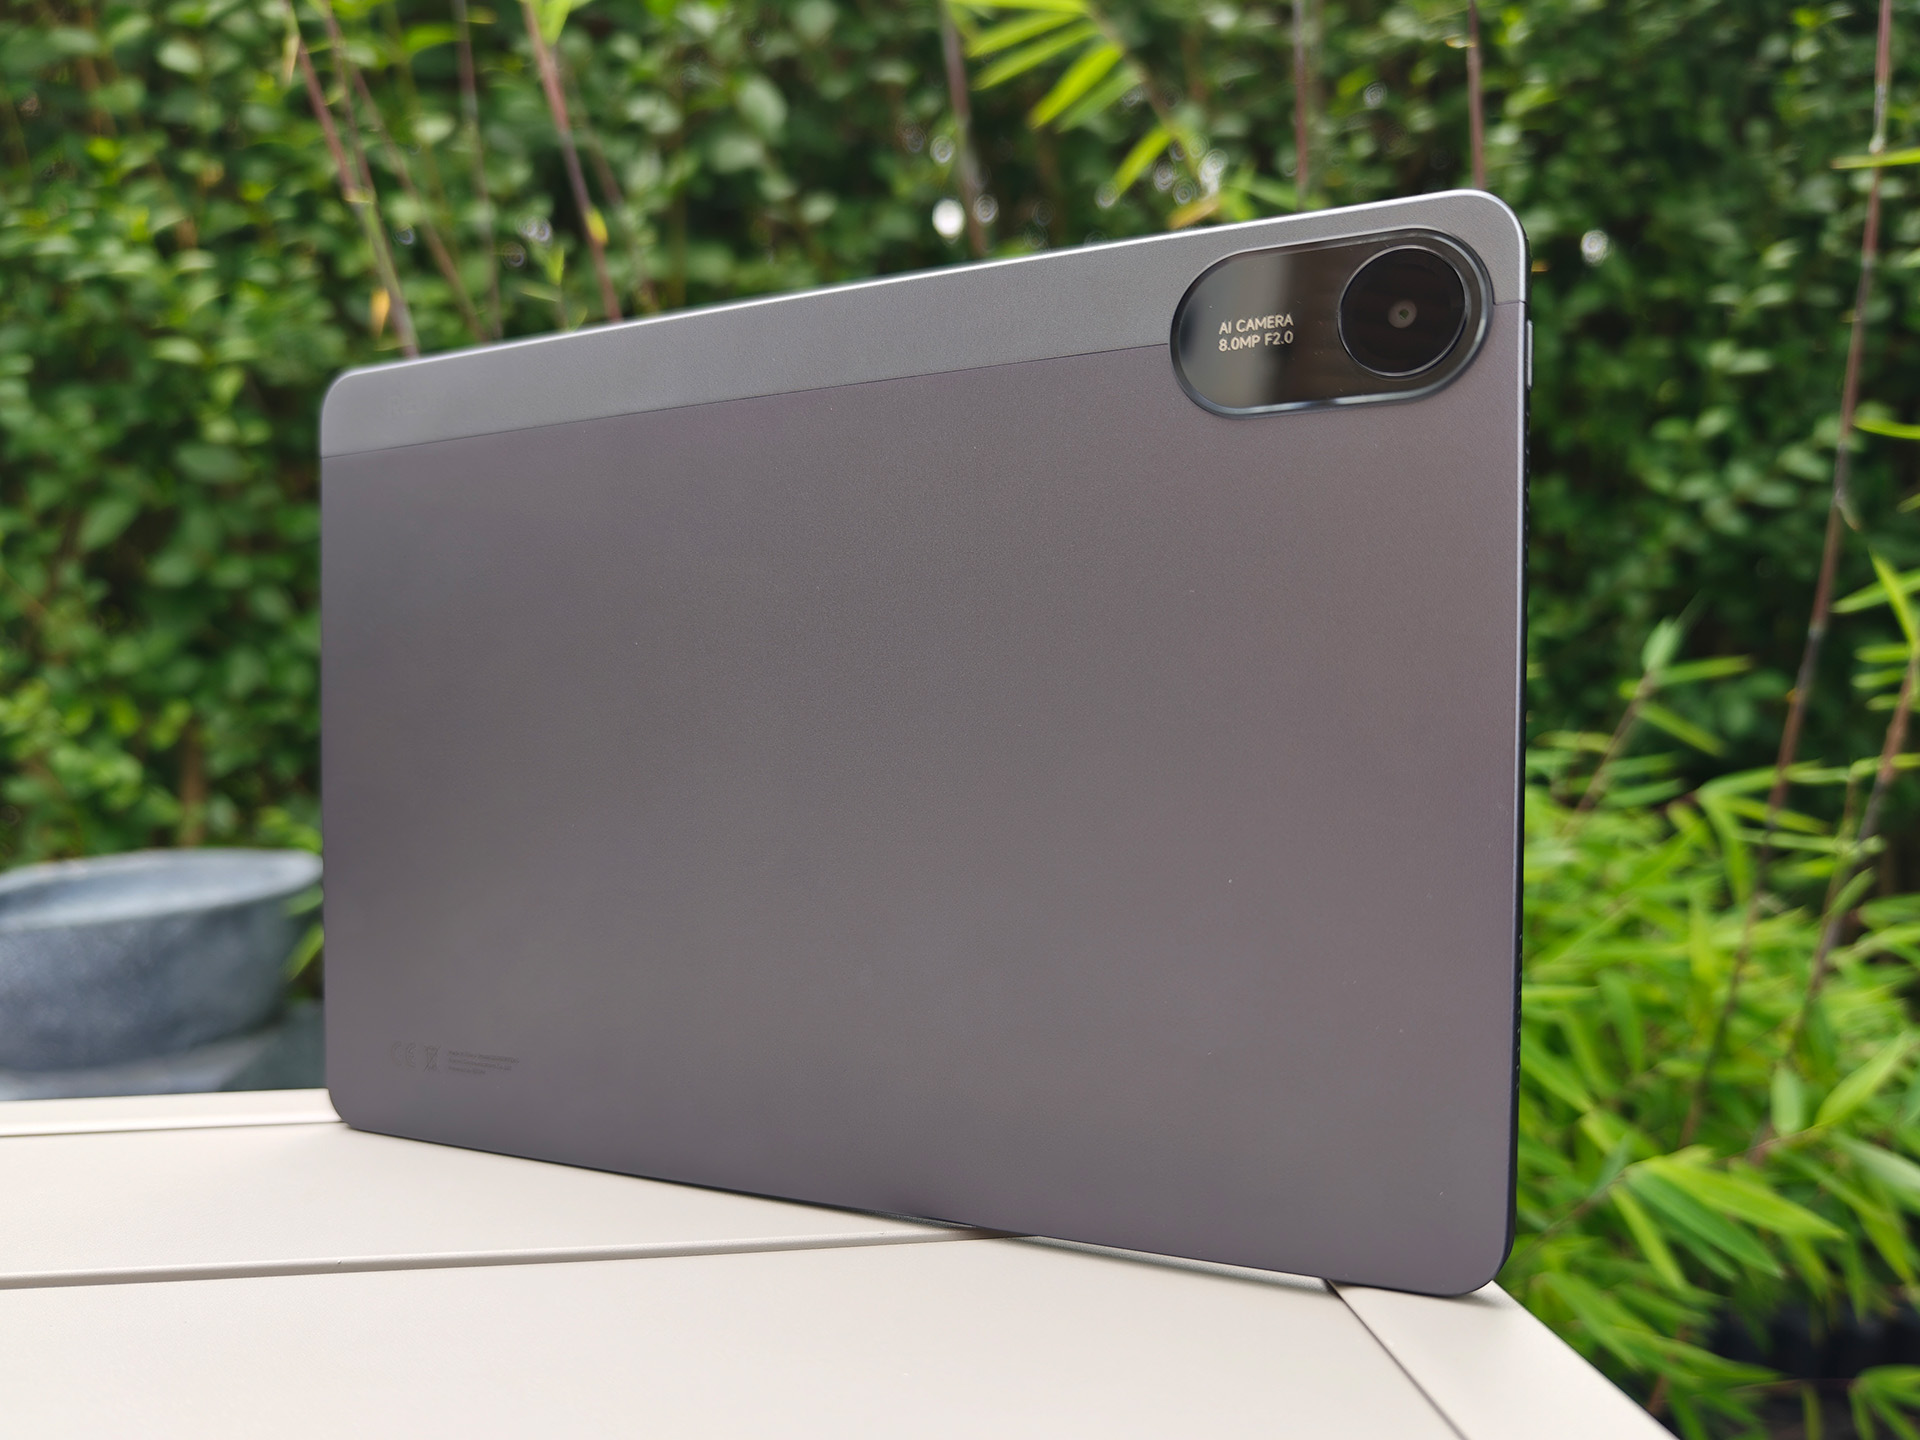
外壳和功能 - 红米 Pad 2 采用铝制外壳
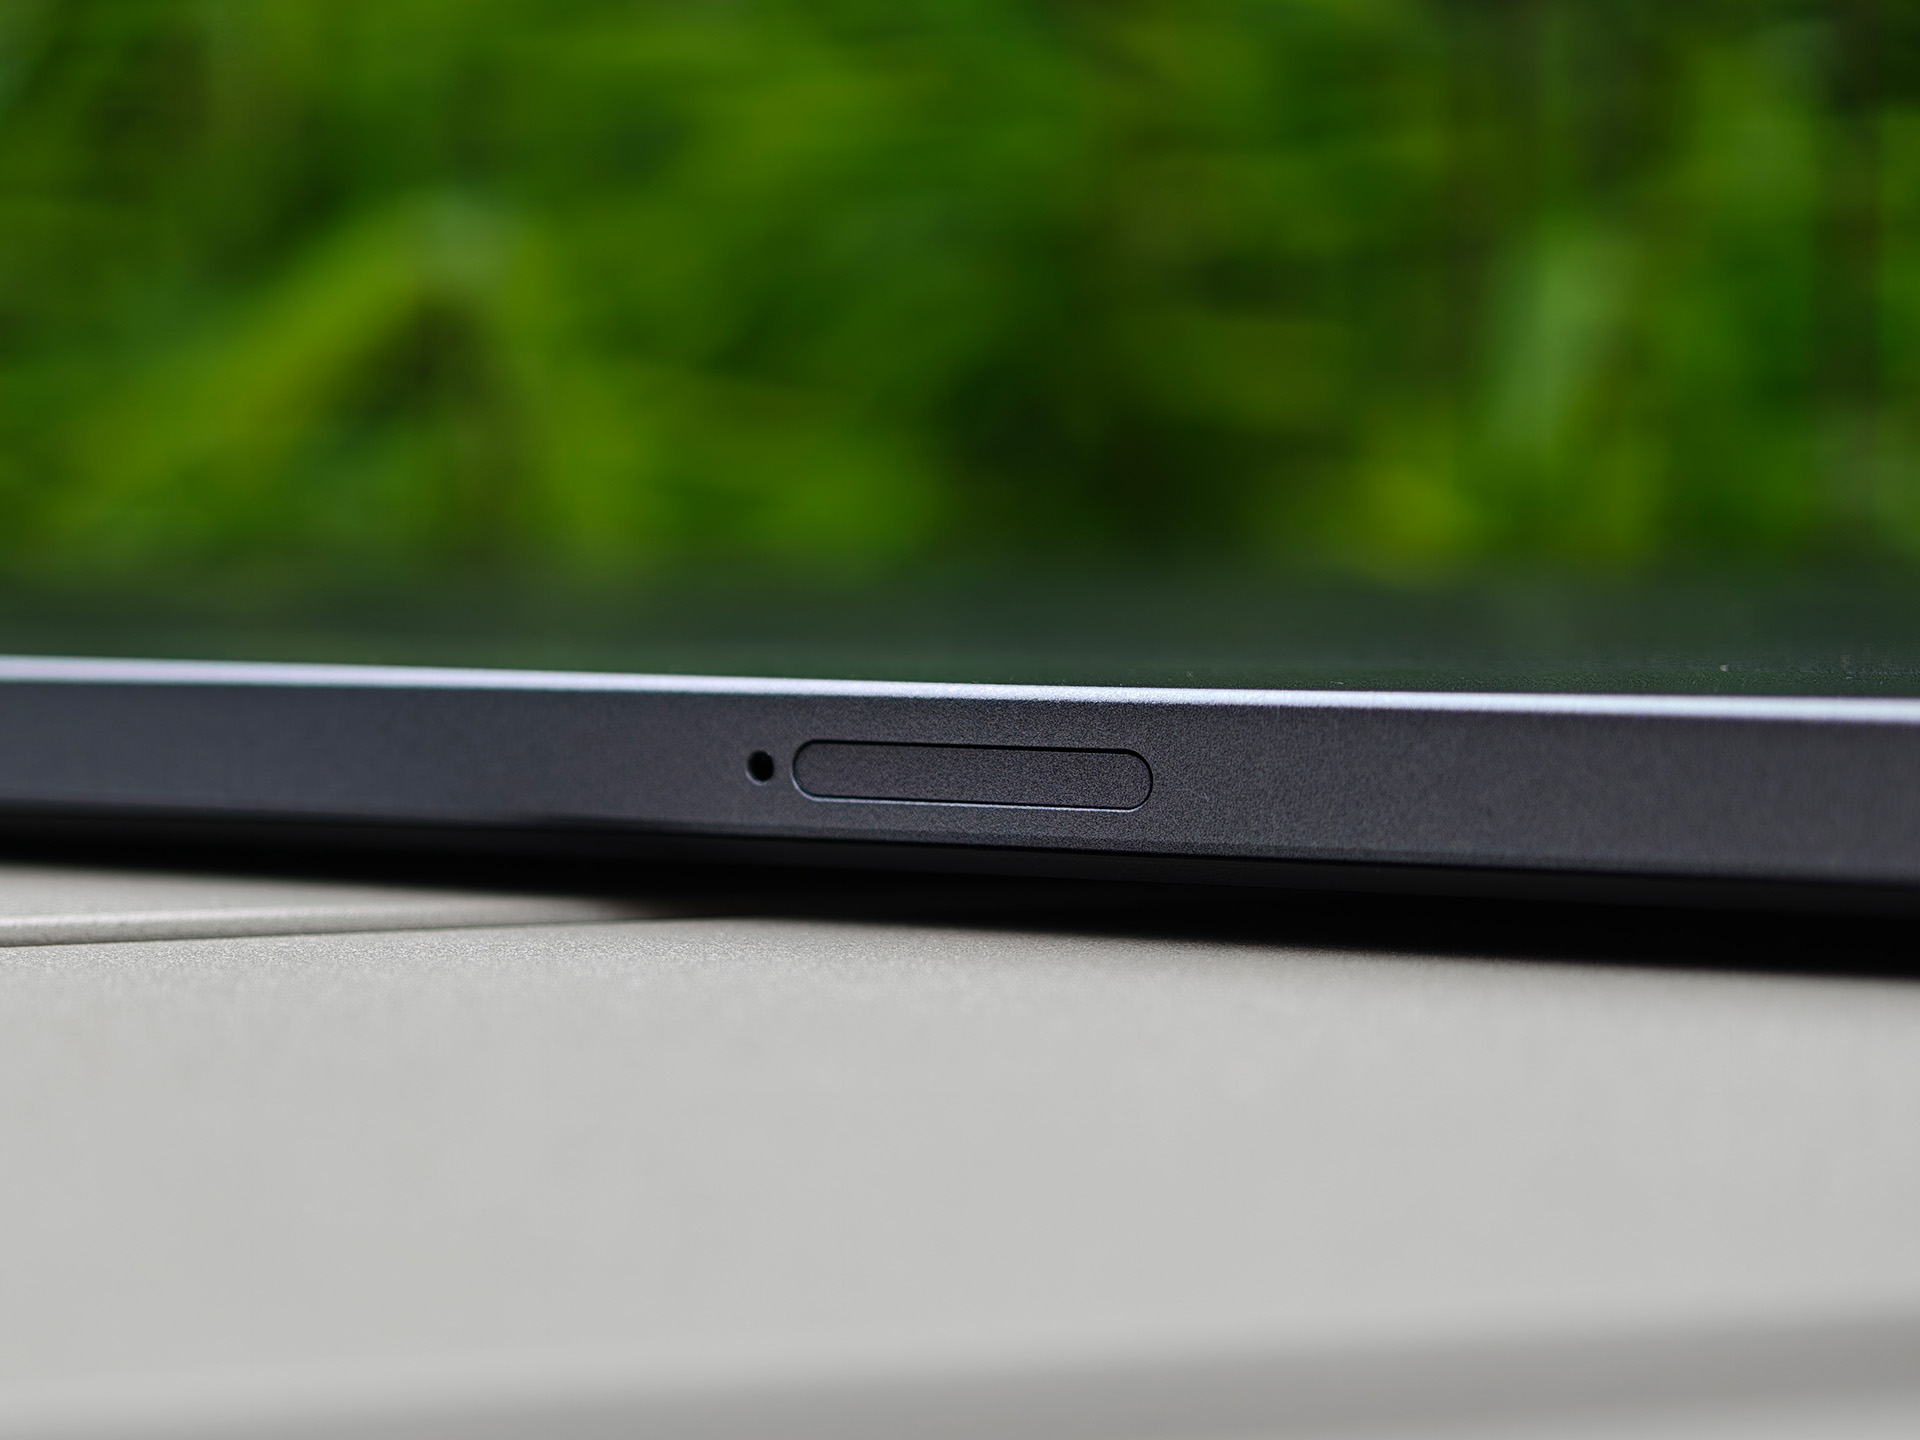
小米红米 Pad 2 比上一代产品重了 74 克,但仍在同类产品的典型重量范围内。做工不错,给人留下了坚固耐用的印象。不过,这款平板电脑不再采用一体式机身设计,因为背面顶部边缘有一条明显的塑料条。卡槽也没有与边框齐平,而是略微向内凹陷。
这是一个混合插槽。因此,它既可以容纳两张 nano-SIM 卡,也可以容纳一张 microSD 卡来代替第二张 SIM 卡。使用我们的参考卡,后者的传输速率不错。由于采用了 Wi-Fi 5,Wi-Fi 标准有点过时,但速度完全够用。
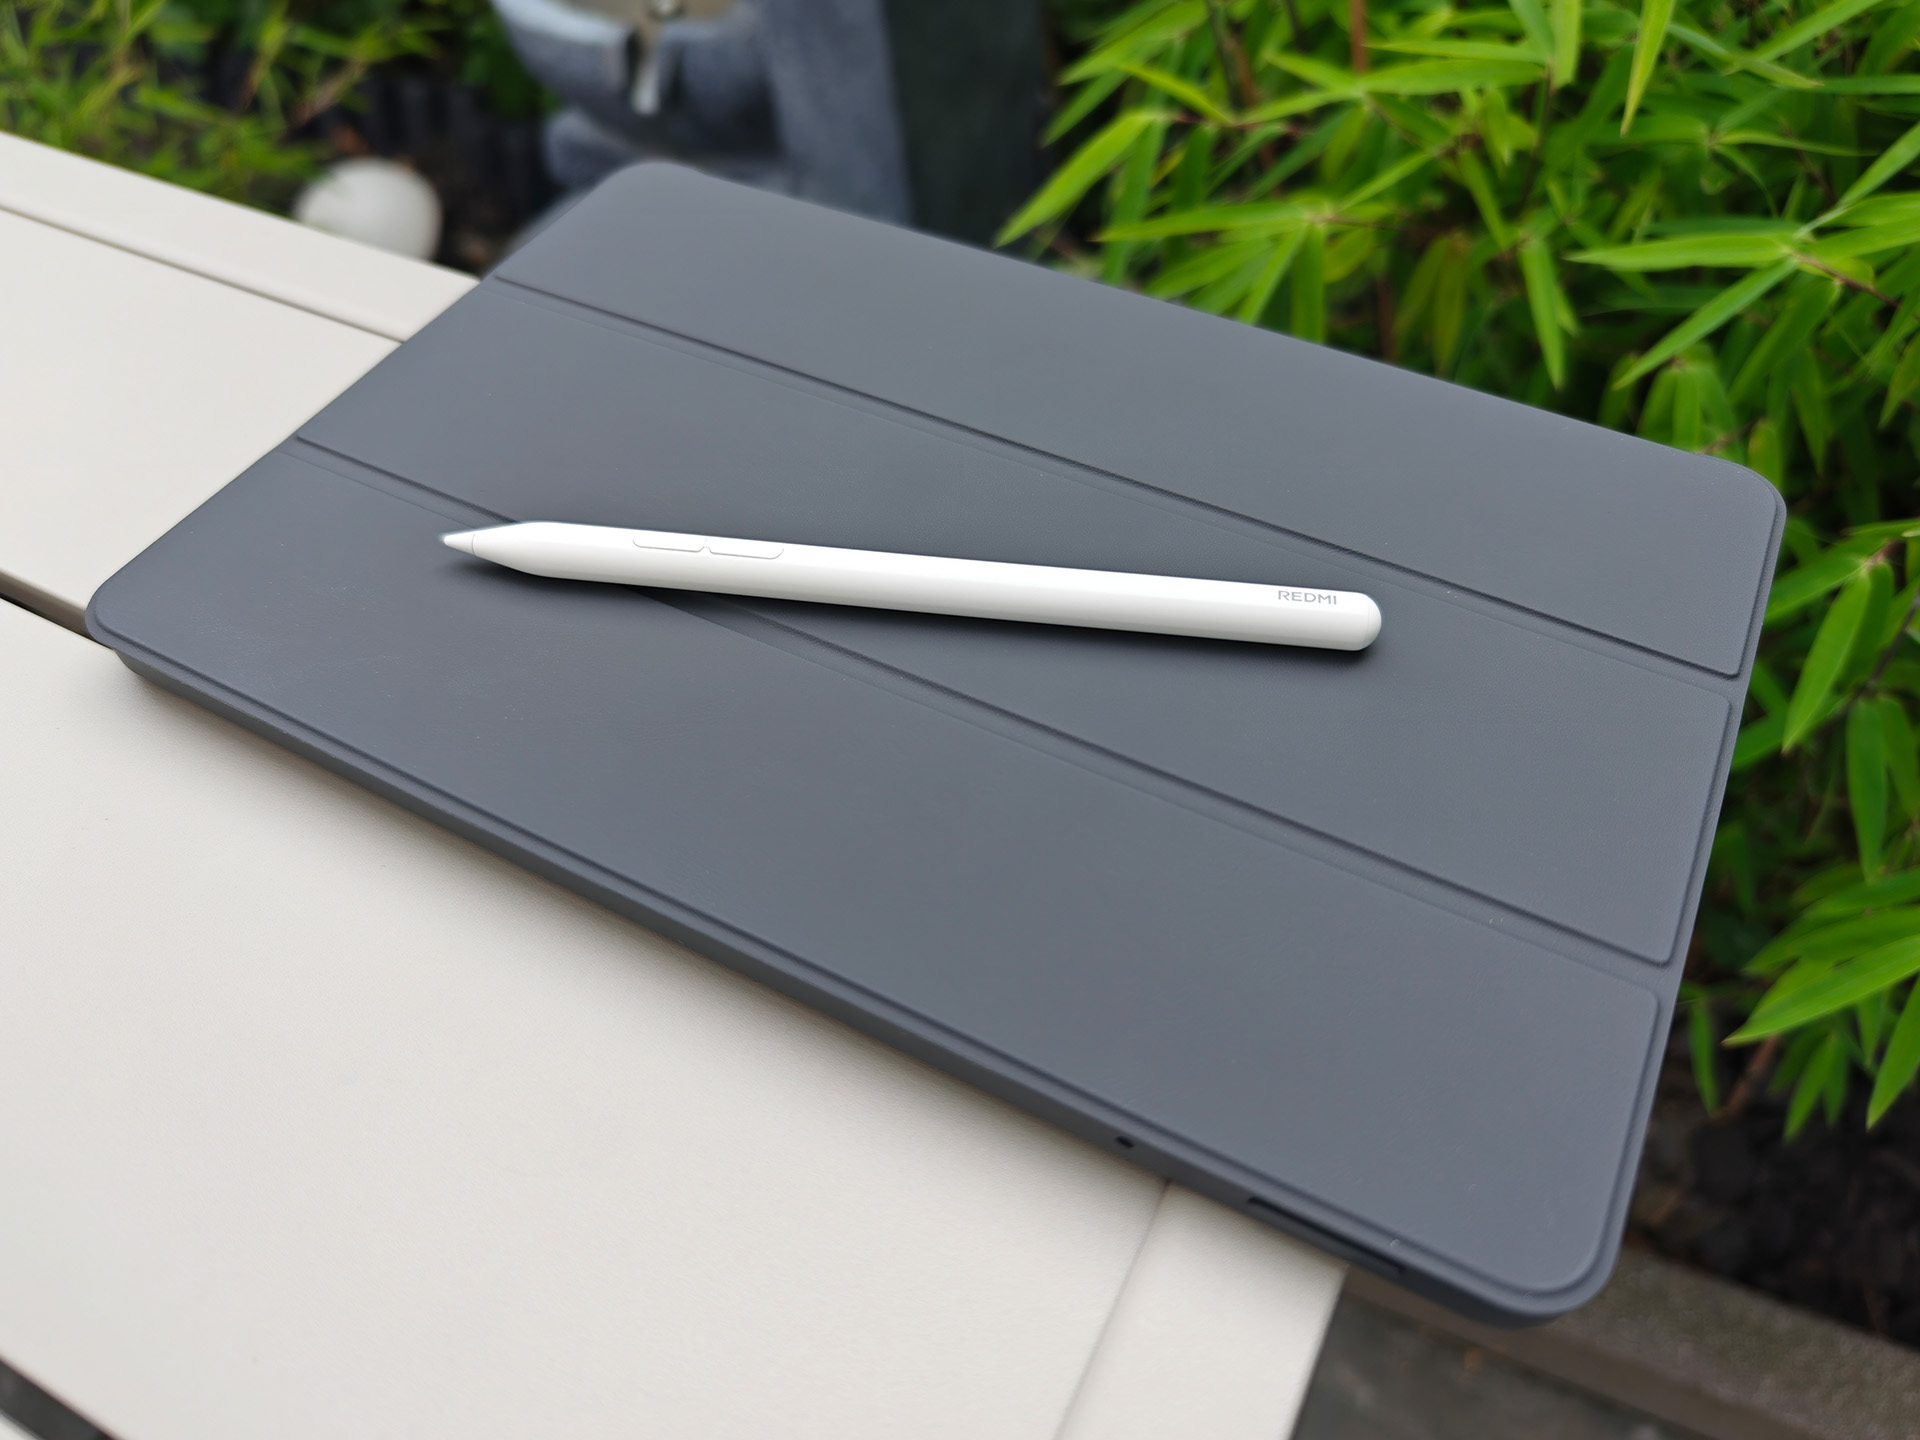
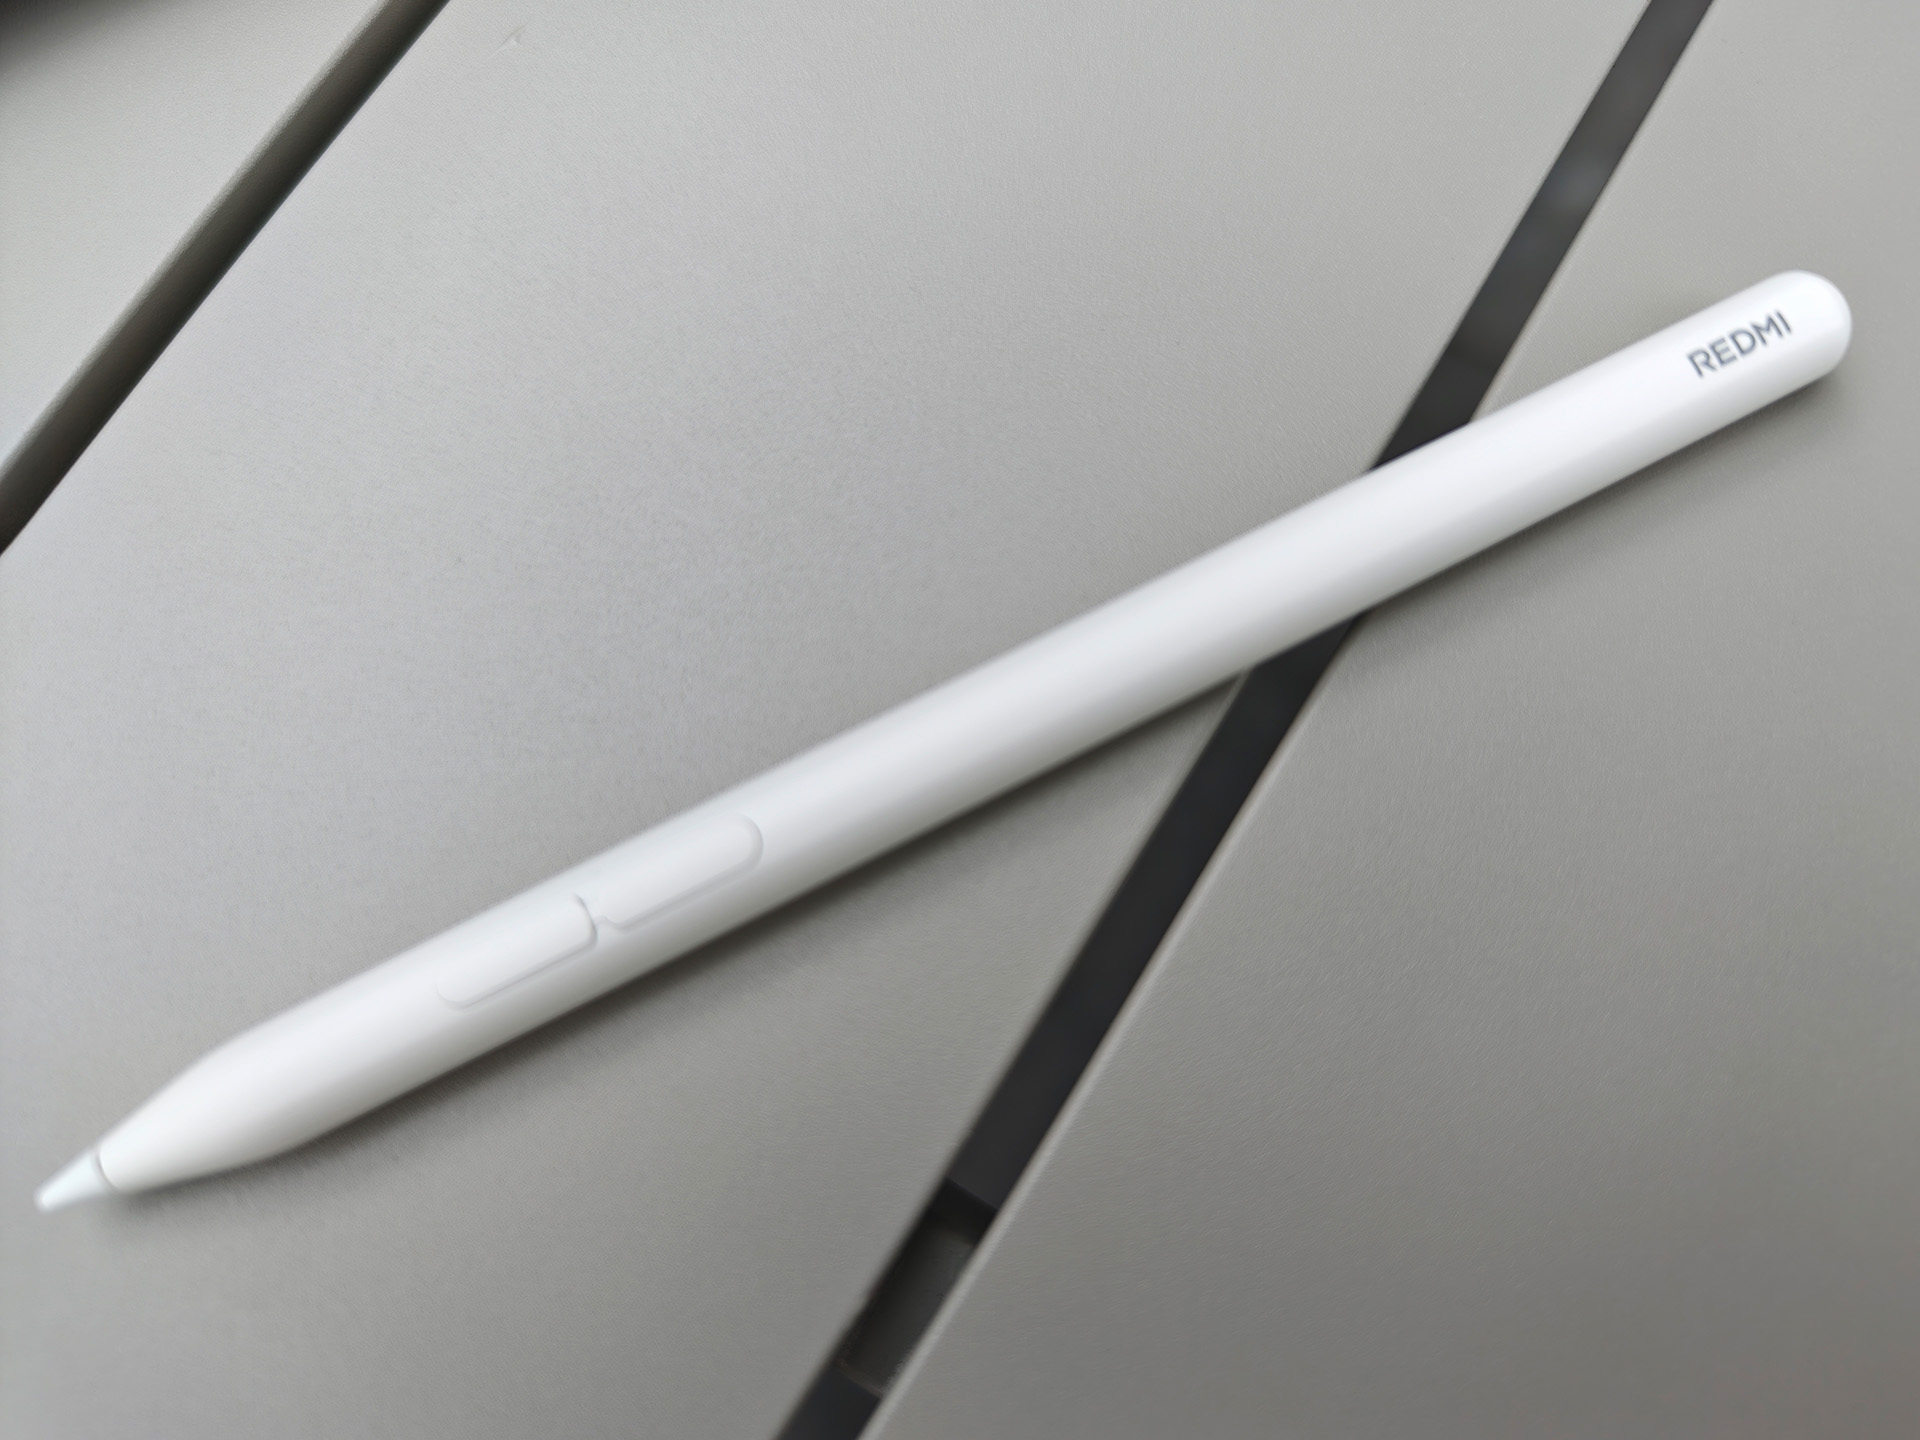
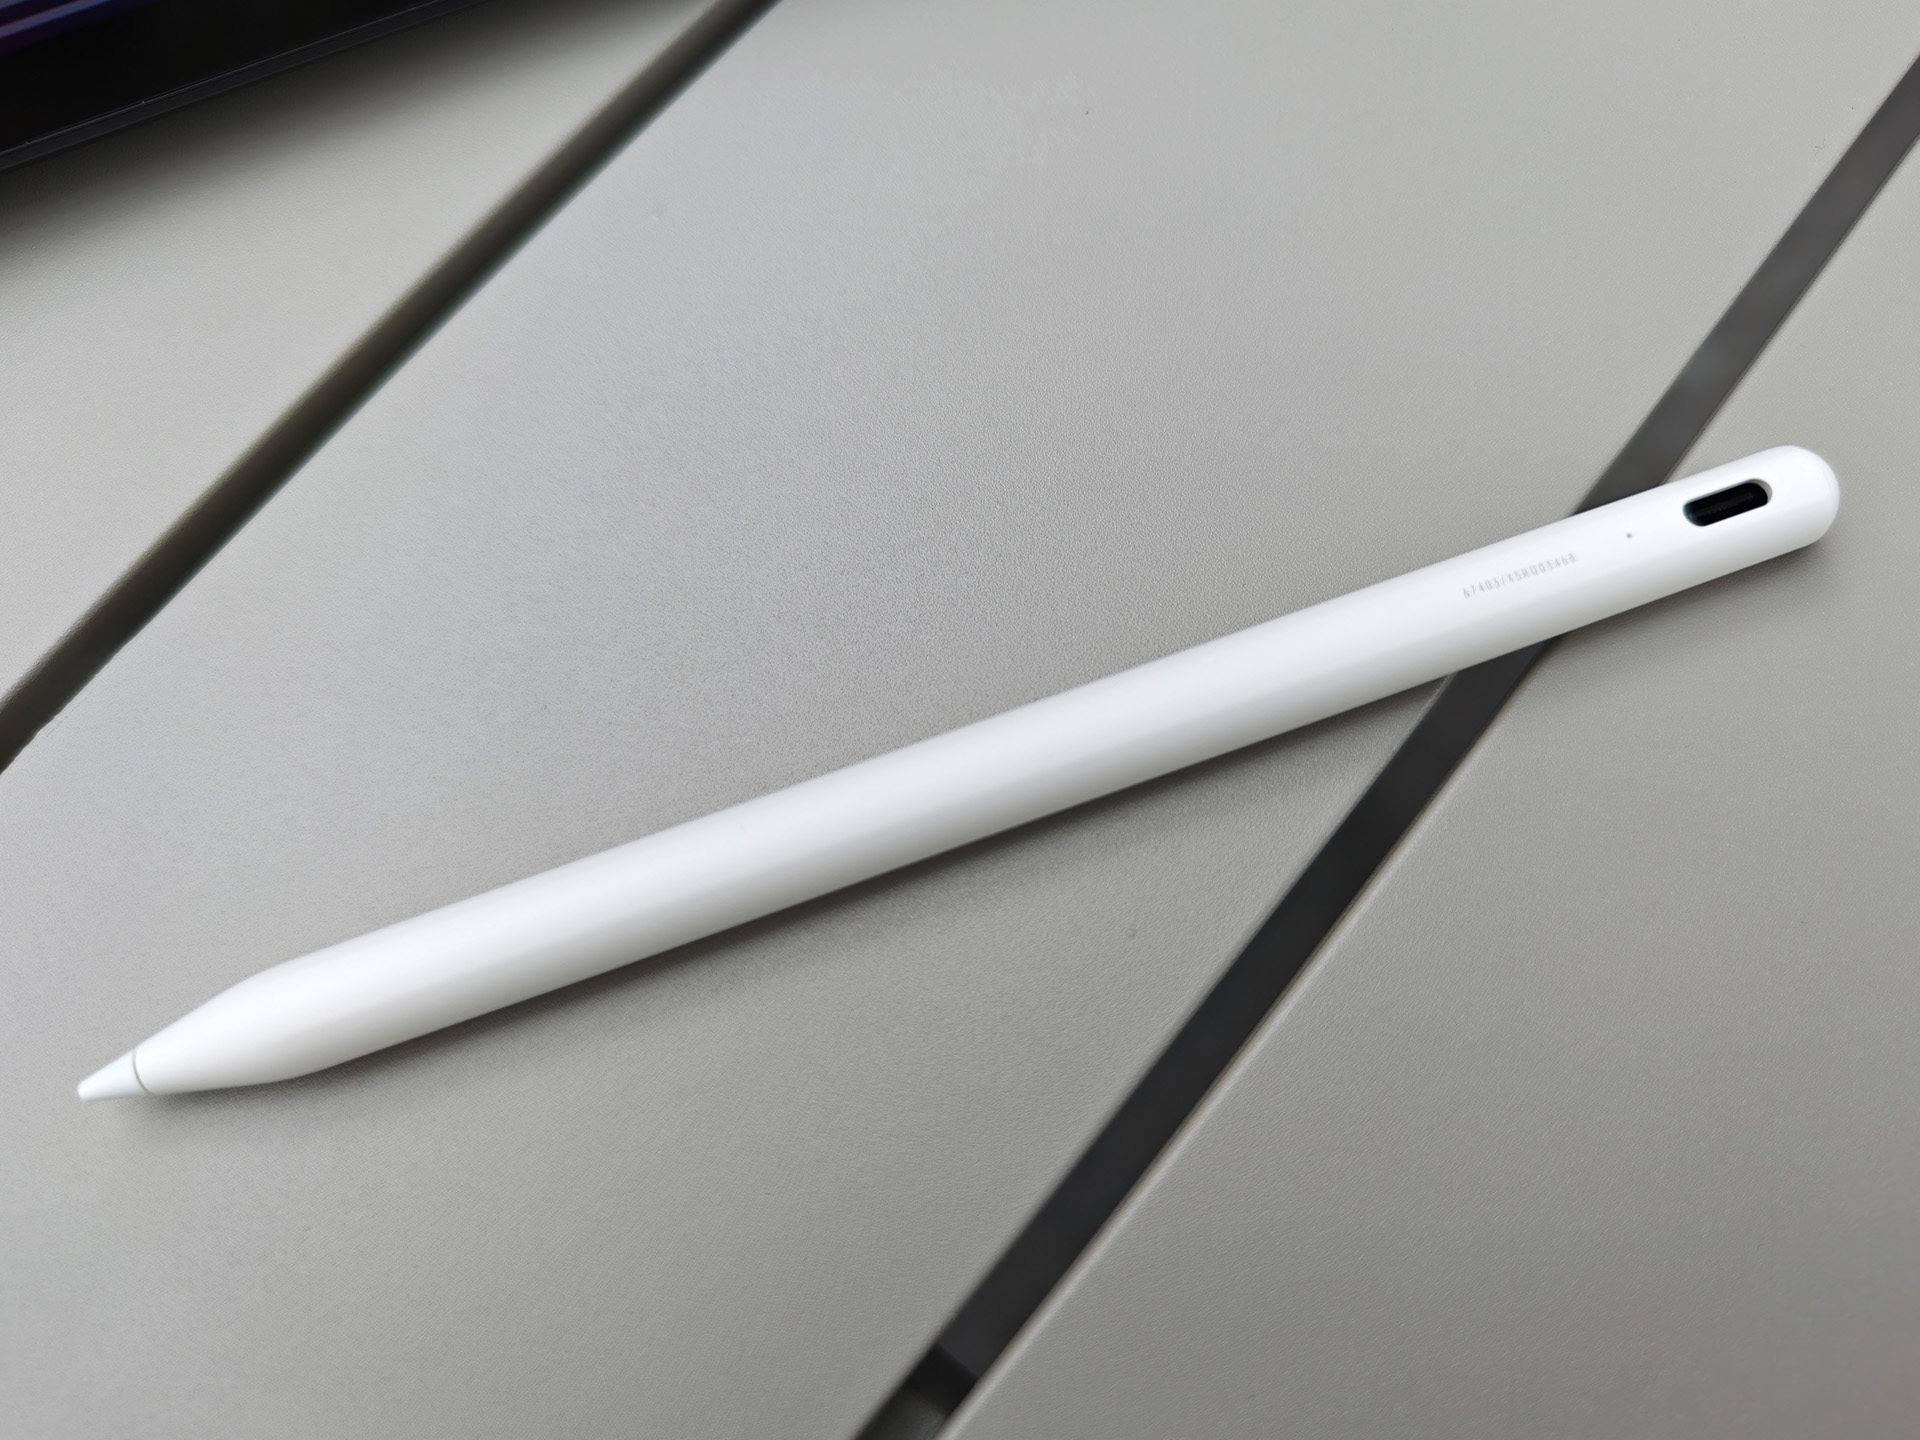
选配的红米手写笔效果不错,但在平板电脑光滑的表面上感觉不是很自然。在生物识别安全方面,只能通过前置摄像头进行不安全的面部识别。没有振动马达。
| SD Card Reader - average JPG Copy Test (av. of 3 runs) | |
| Samsung Galaxy Tab A9+ (Angelbird AV Pro V60) | |
| Average of class Tablet (10.2 - 79.2, n=42, last 2 years) | |
| Xiaomi Redmi Pad 2 4G (Angelbird AV Pro V60) | |
| Lenovo Tab K11 Plus (Angelbird V60) | |
软件和可持续性 - 红米平板电脑更新至 2032 年
小米红米 Pad 2 4G 预装了Android 15 和 HyperOS 2.0。它的更新将持续七年(直到 2032 年 6 月 15 日)。制造商尚未公布其中包括多少次版本升级,也未公布安全补丁的间隔时间,测试时安全补丁已更新至 2025 年 5 月 1 日。Play 系统更新(截至 2025 年 4 月 1 日)也不是最新的。
在可持续发展方面,产品上没有具体信息,只有欧盟能源标签上的信息.外包装不含塑料。
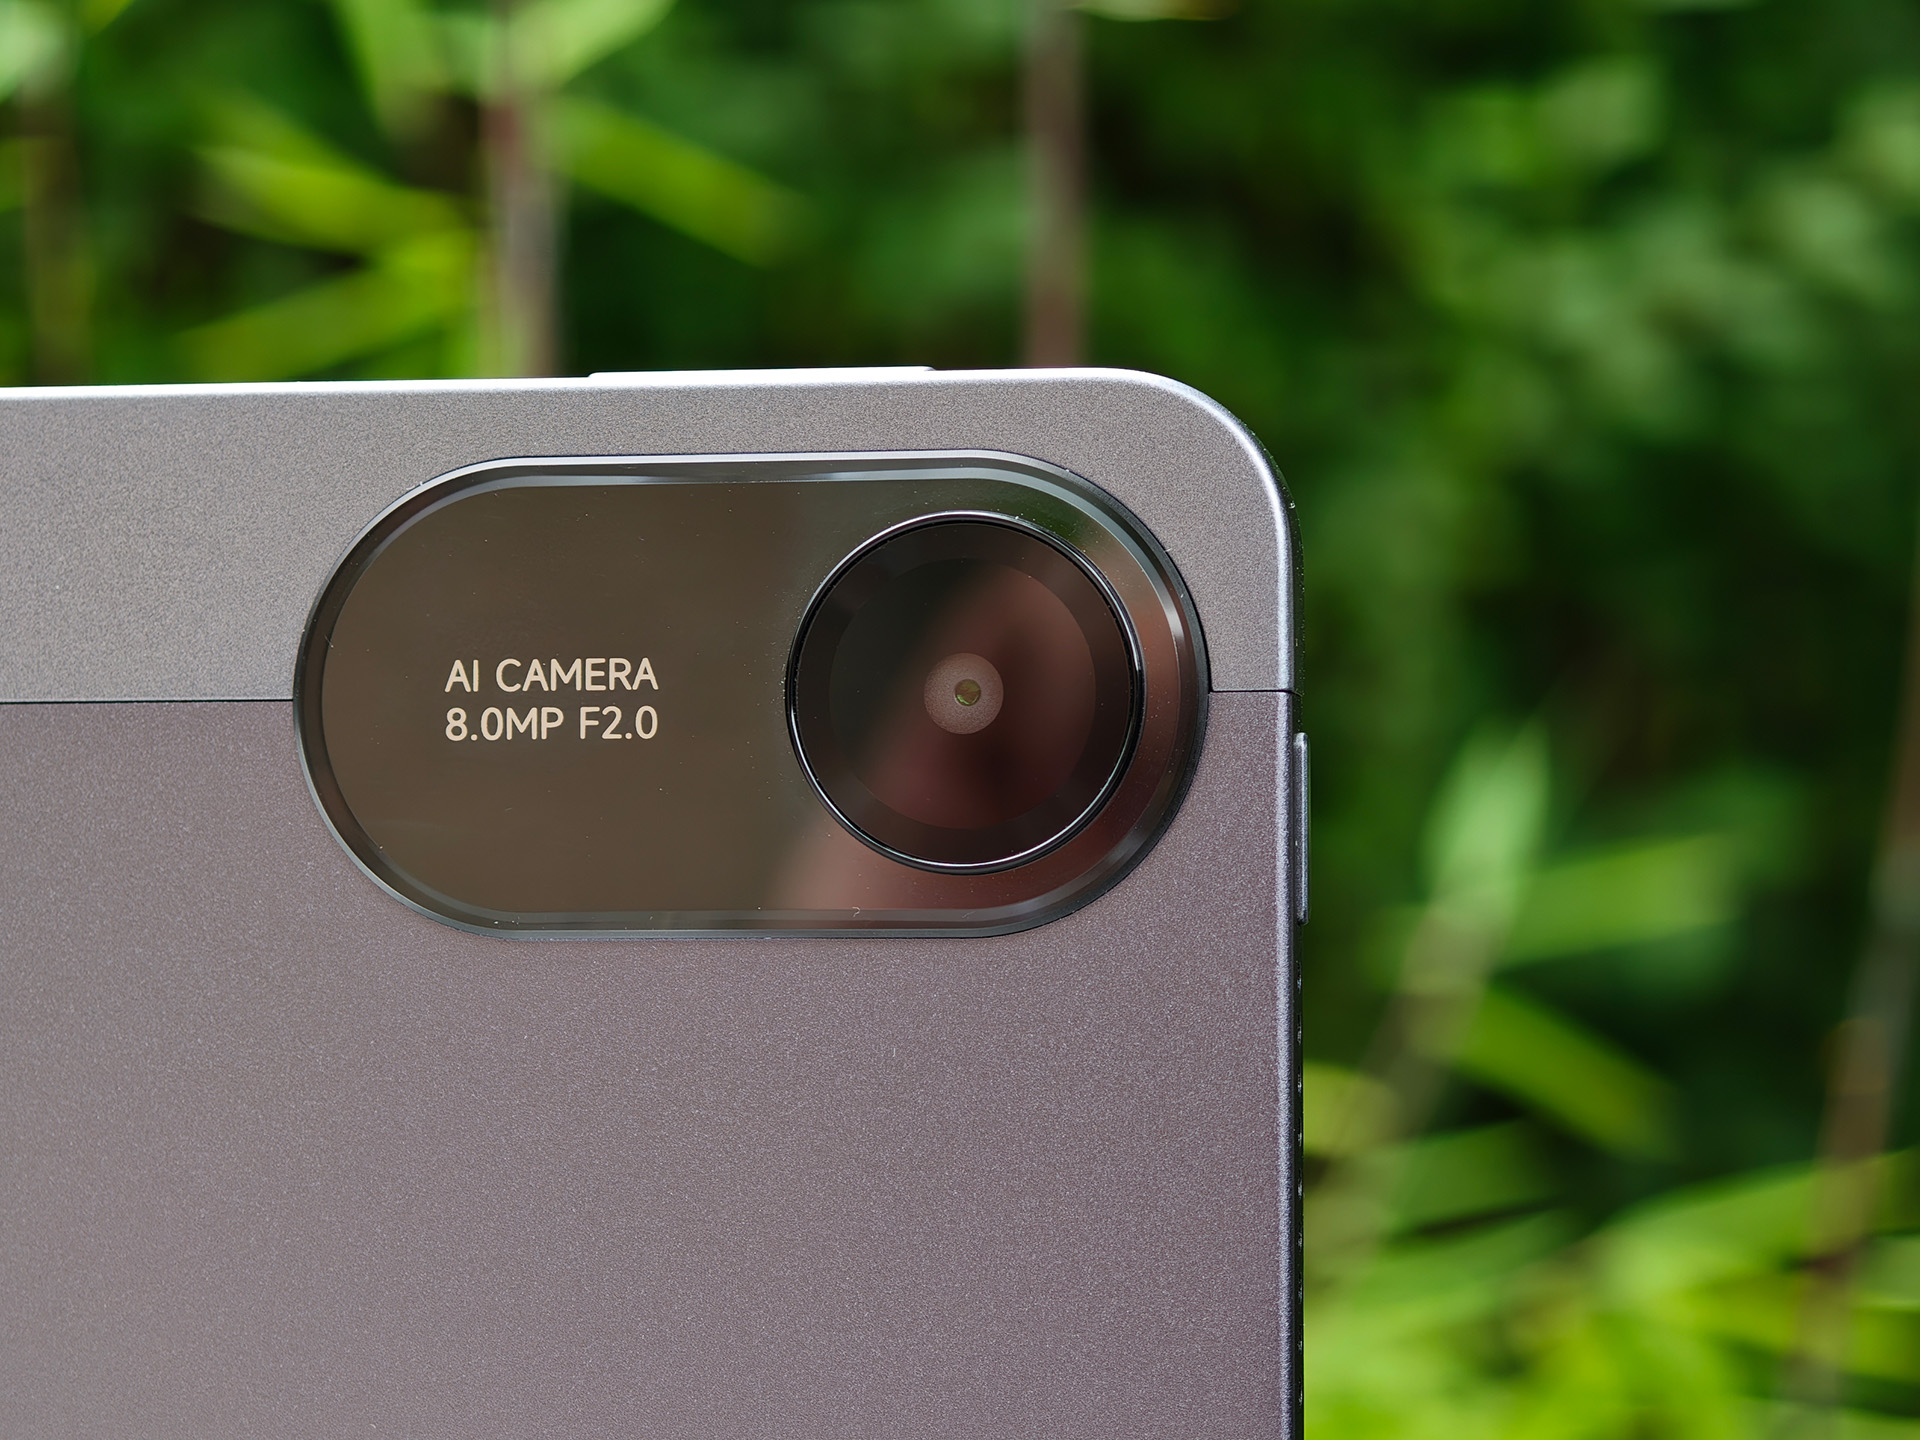
相机 - 红米 Pad 2 的轻便型相机
红米 Pad 2 4G 的前置摄像头只能提供一些细节,清晰度参差不齐,但色彩平衡良好。这对于视频通话来说已经足够了。
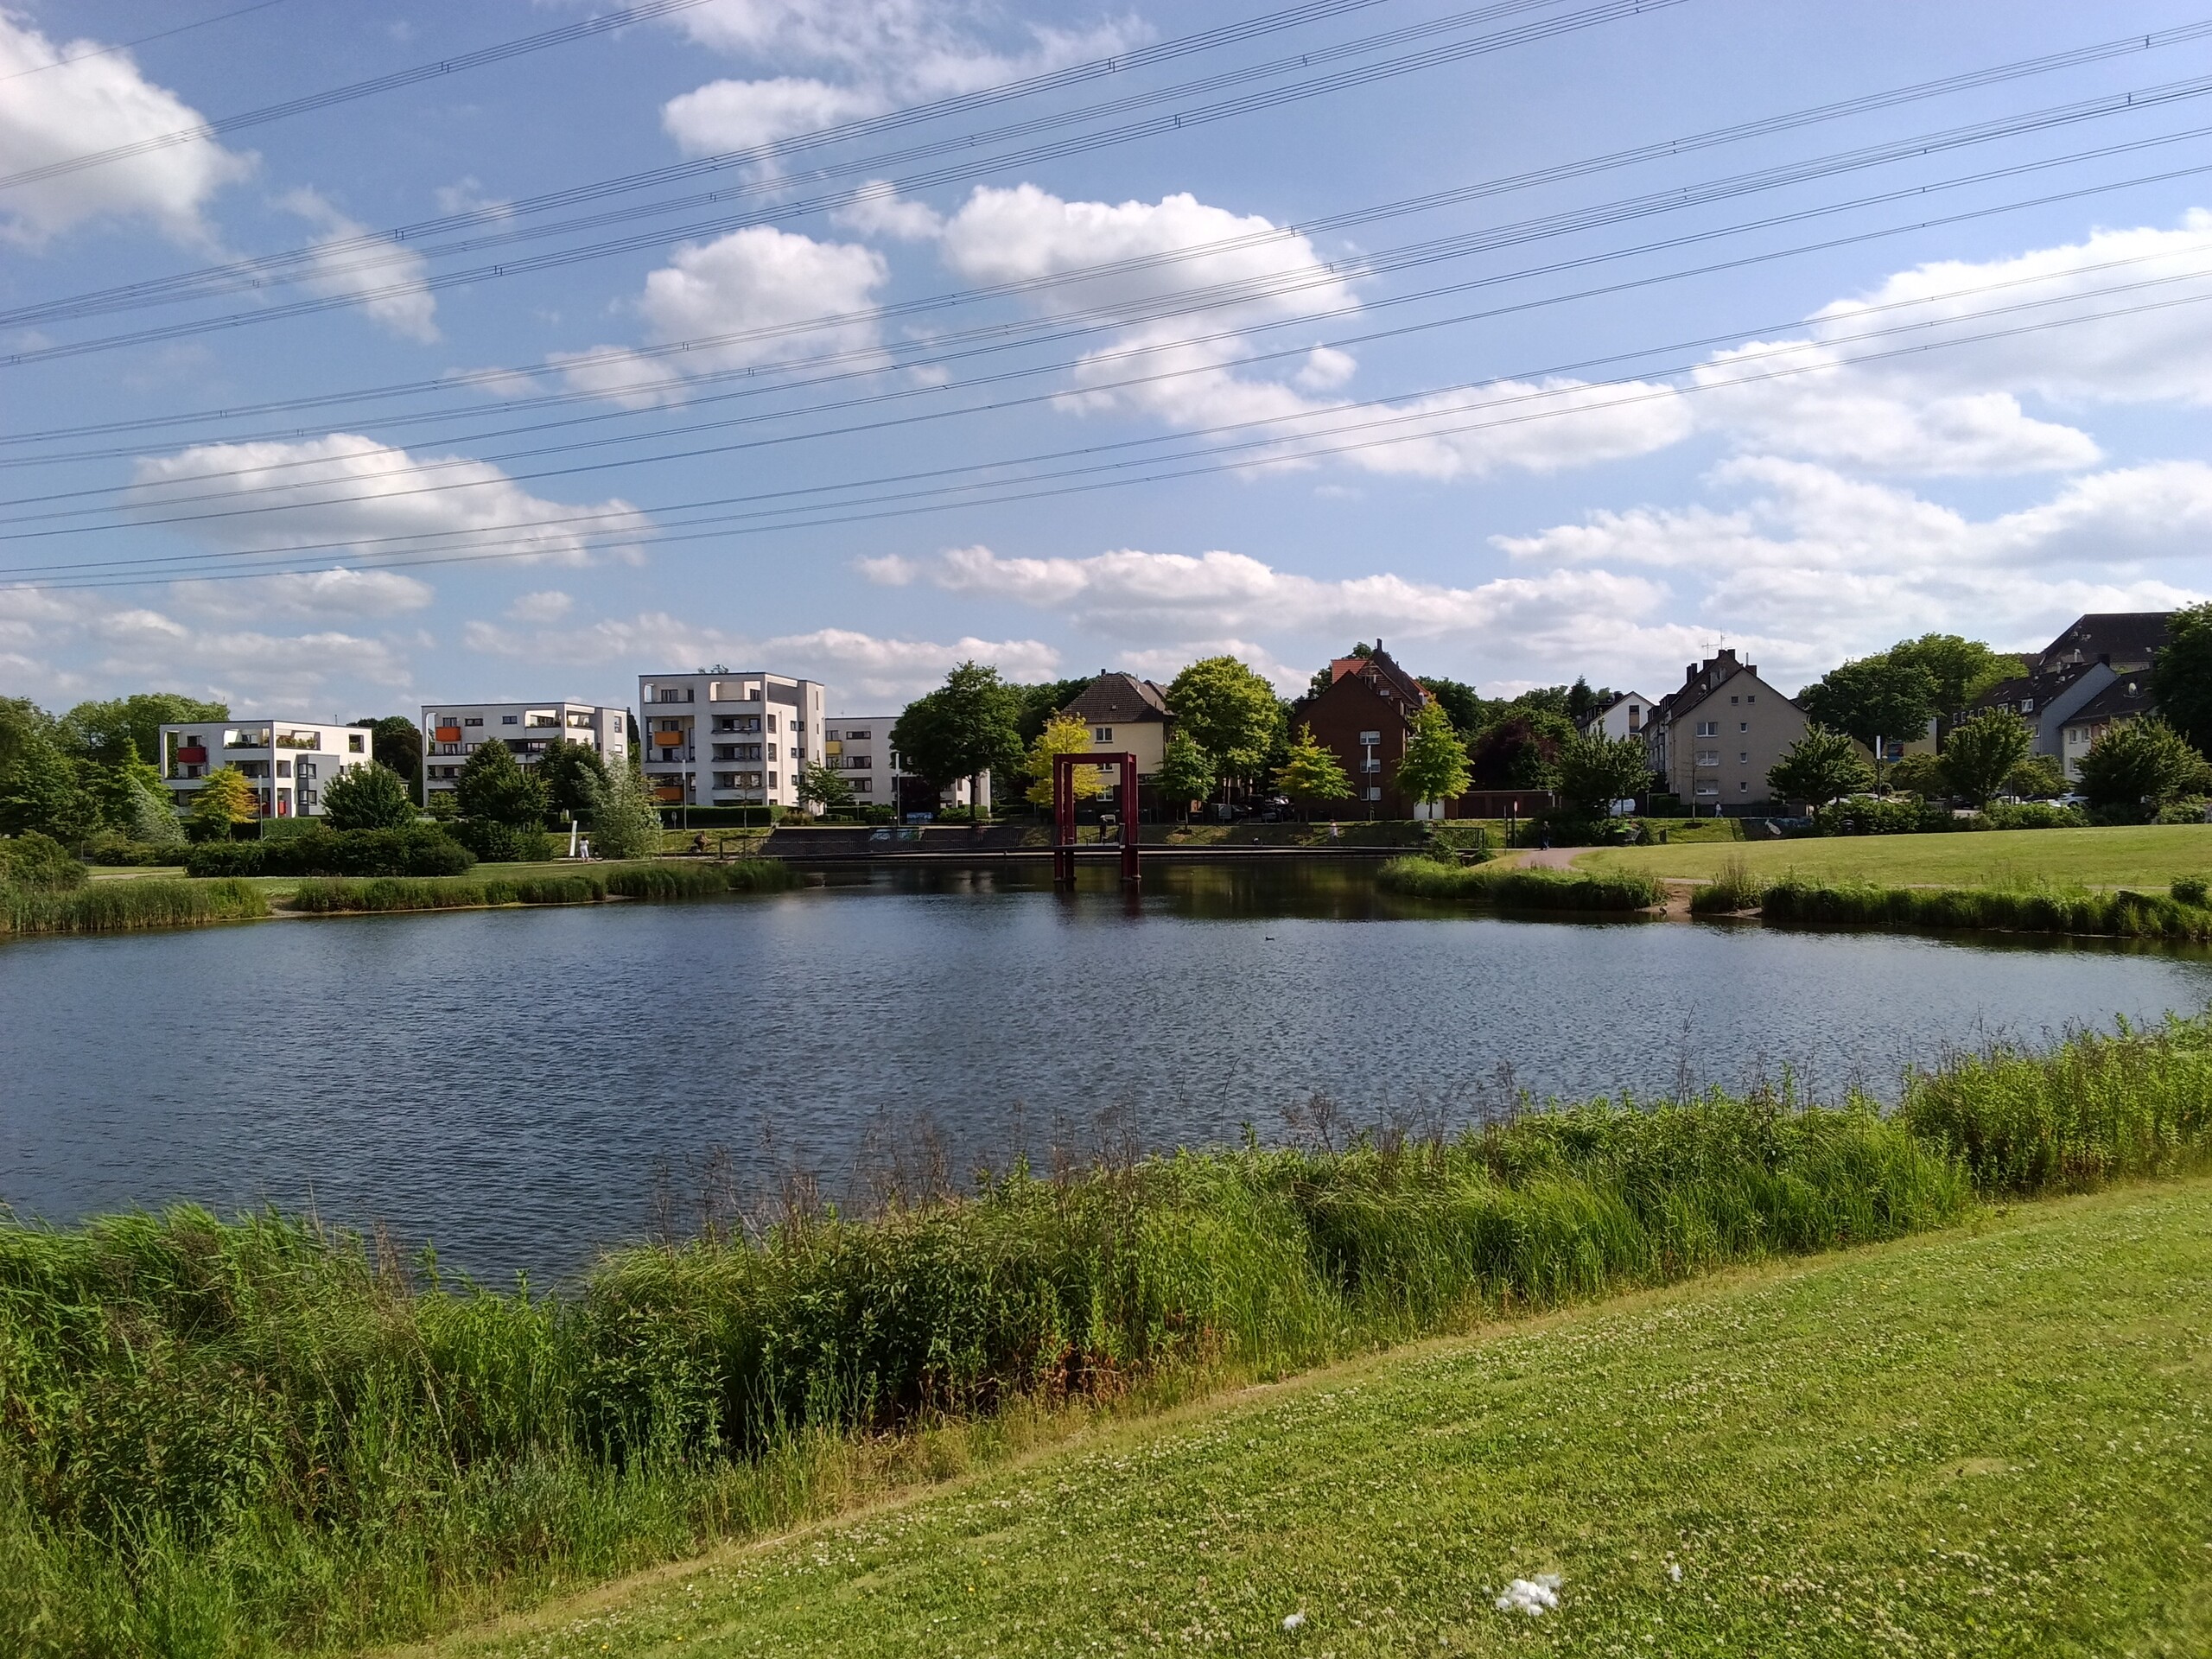
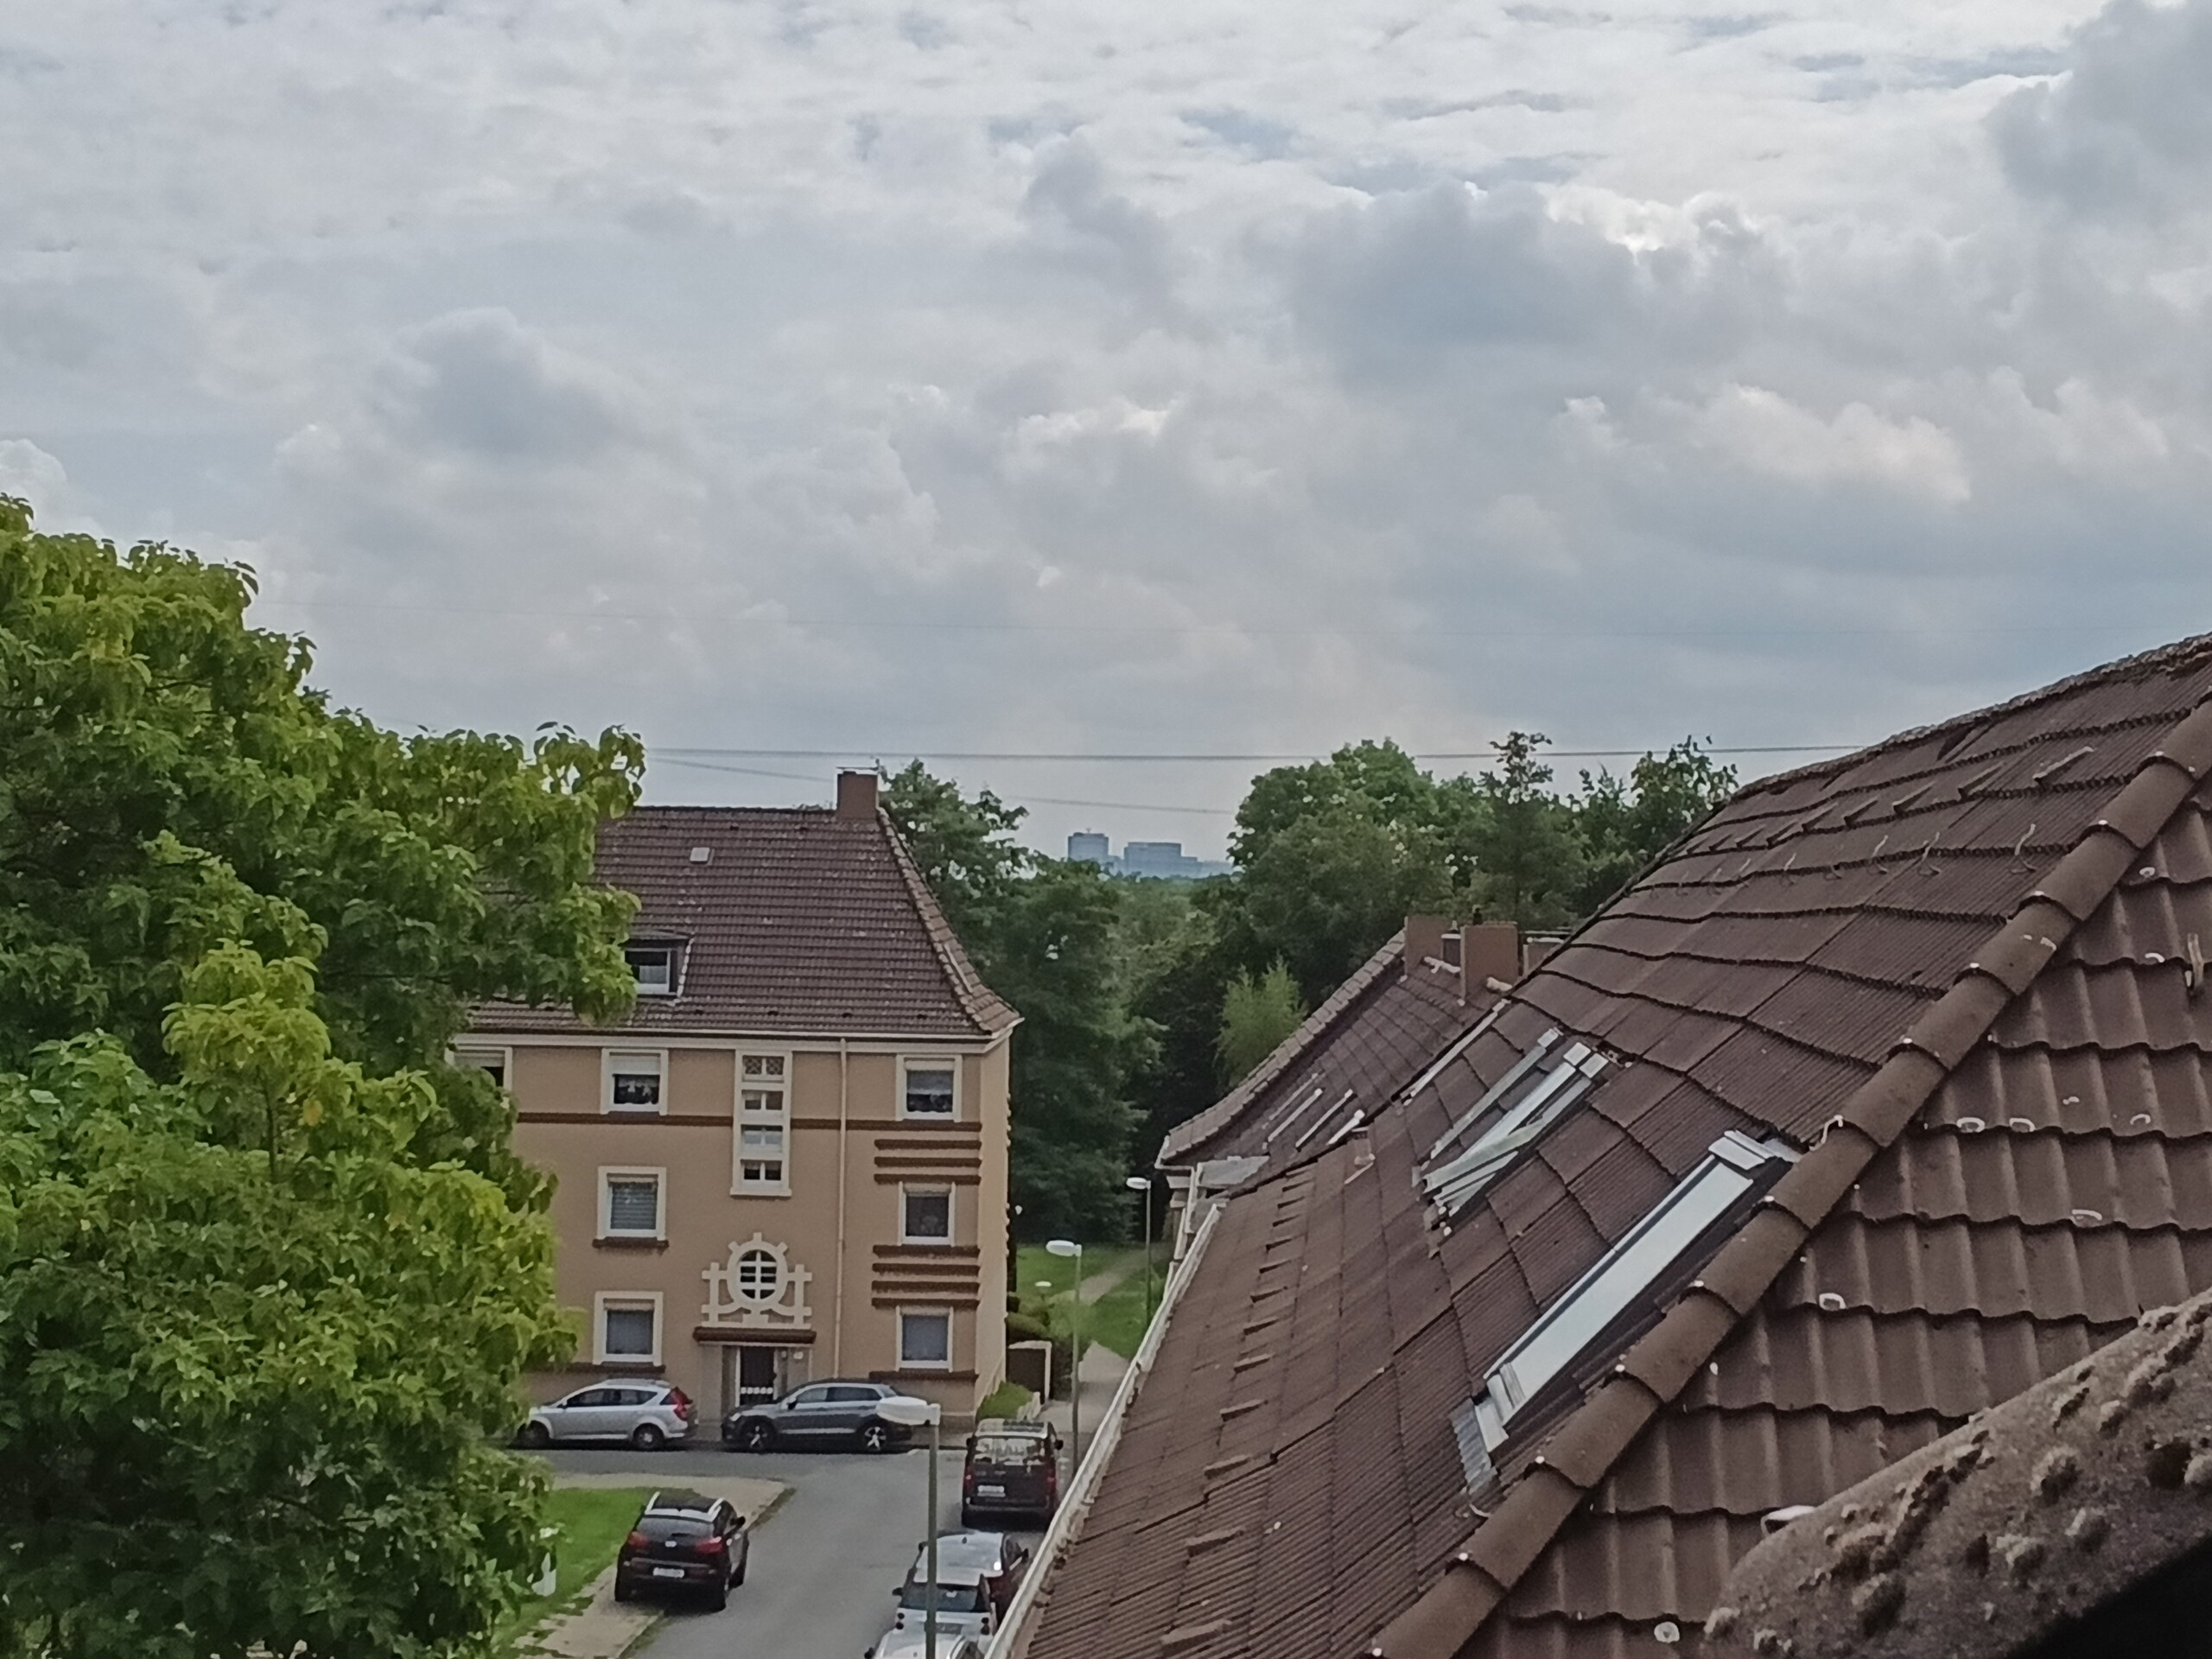
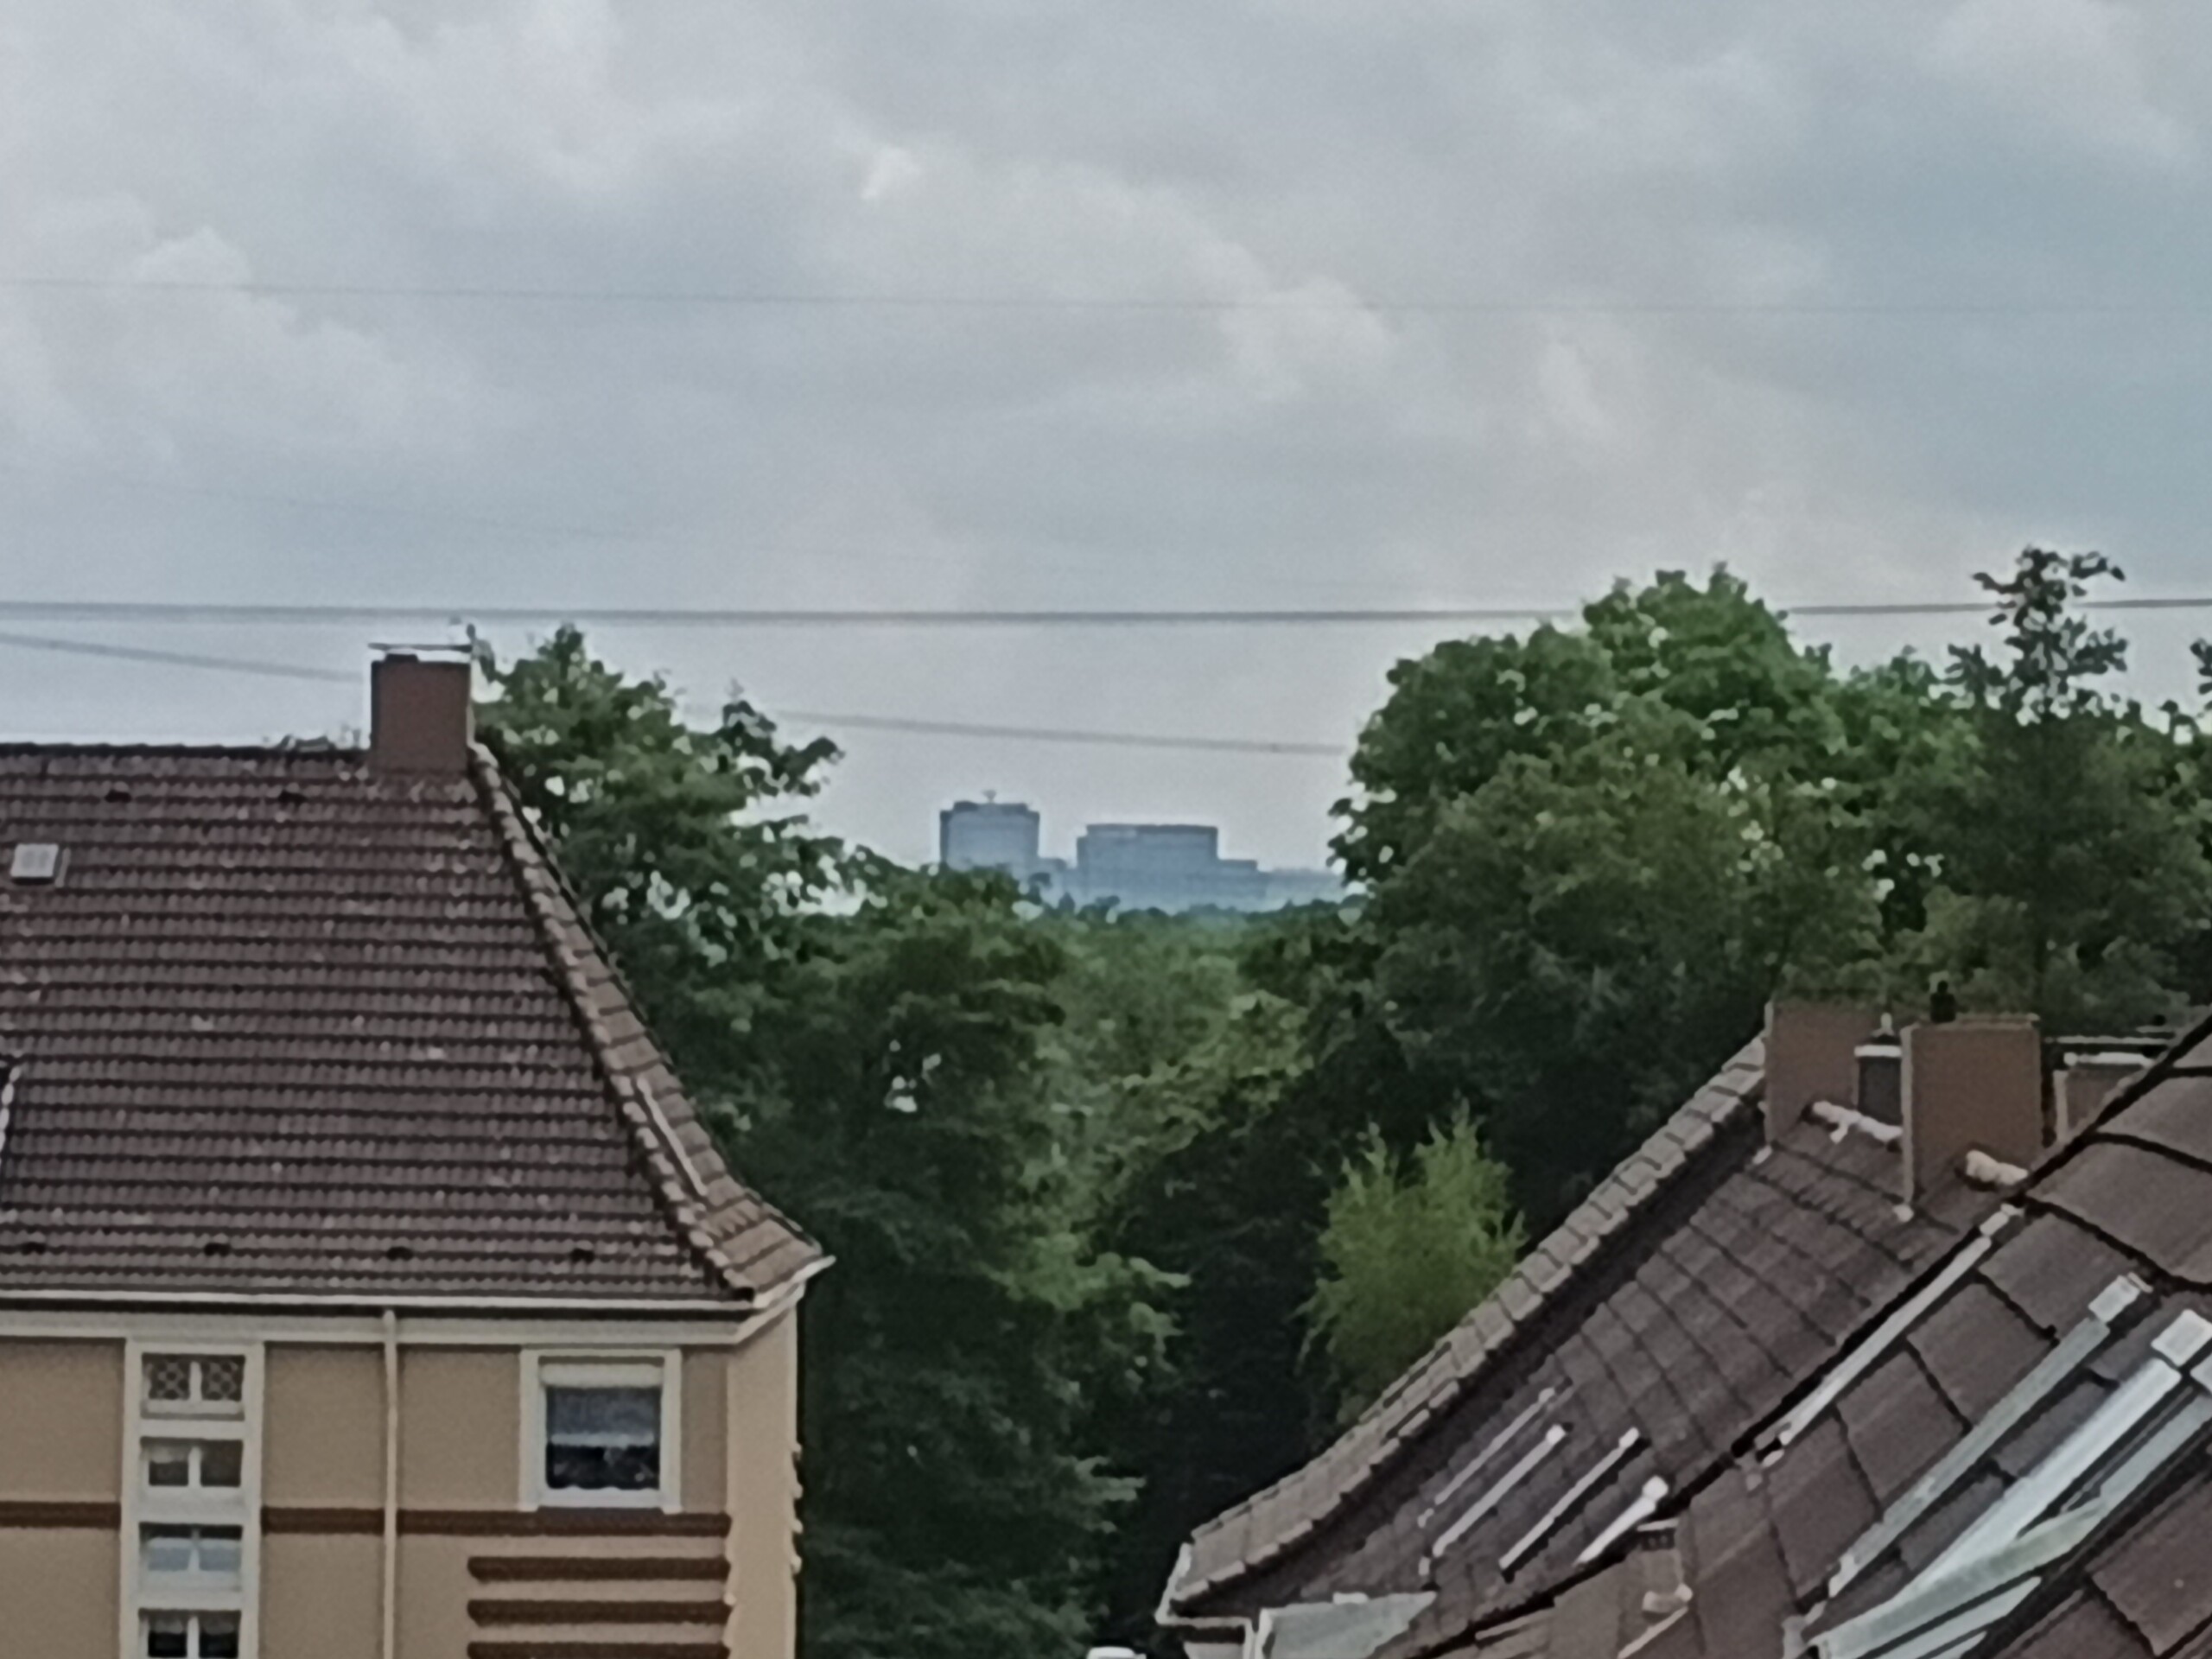
背面的主摄像头在日光下也能提供不错的效果,即使是 2 倍变焦也能用于文档记录。最大可放大 5 倍,但只能拍摄出浑浊的图像。
平板电脑的所有摄像头都能以全高清(30 FPS)格式录制视频。不提供光学防抖功能。


显示屏 - 深色液晶显示屏,不支持 HDR
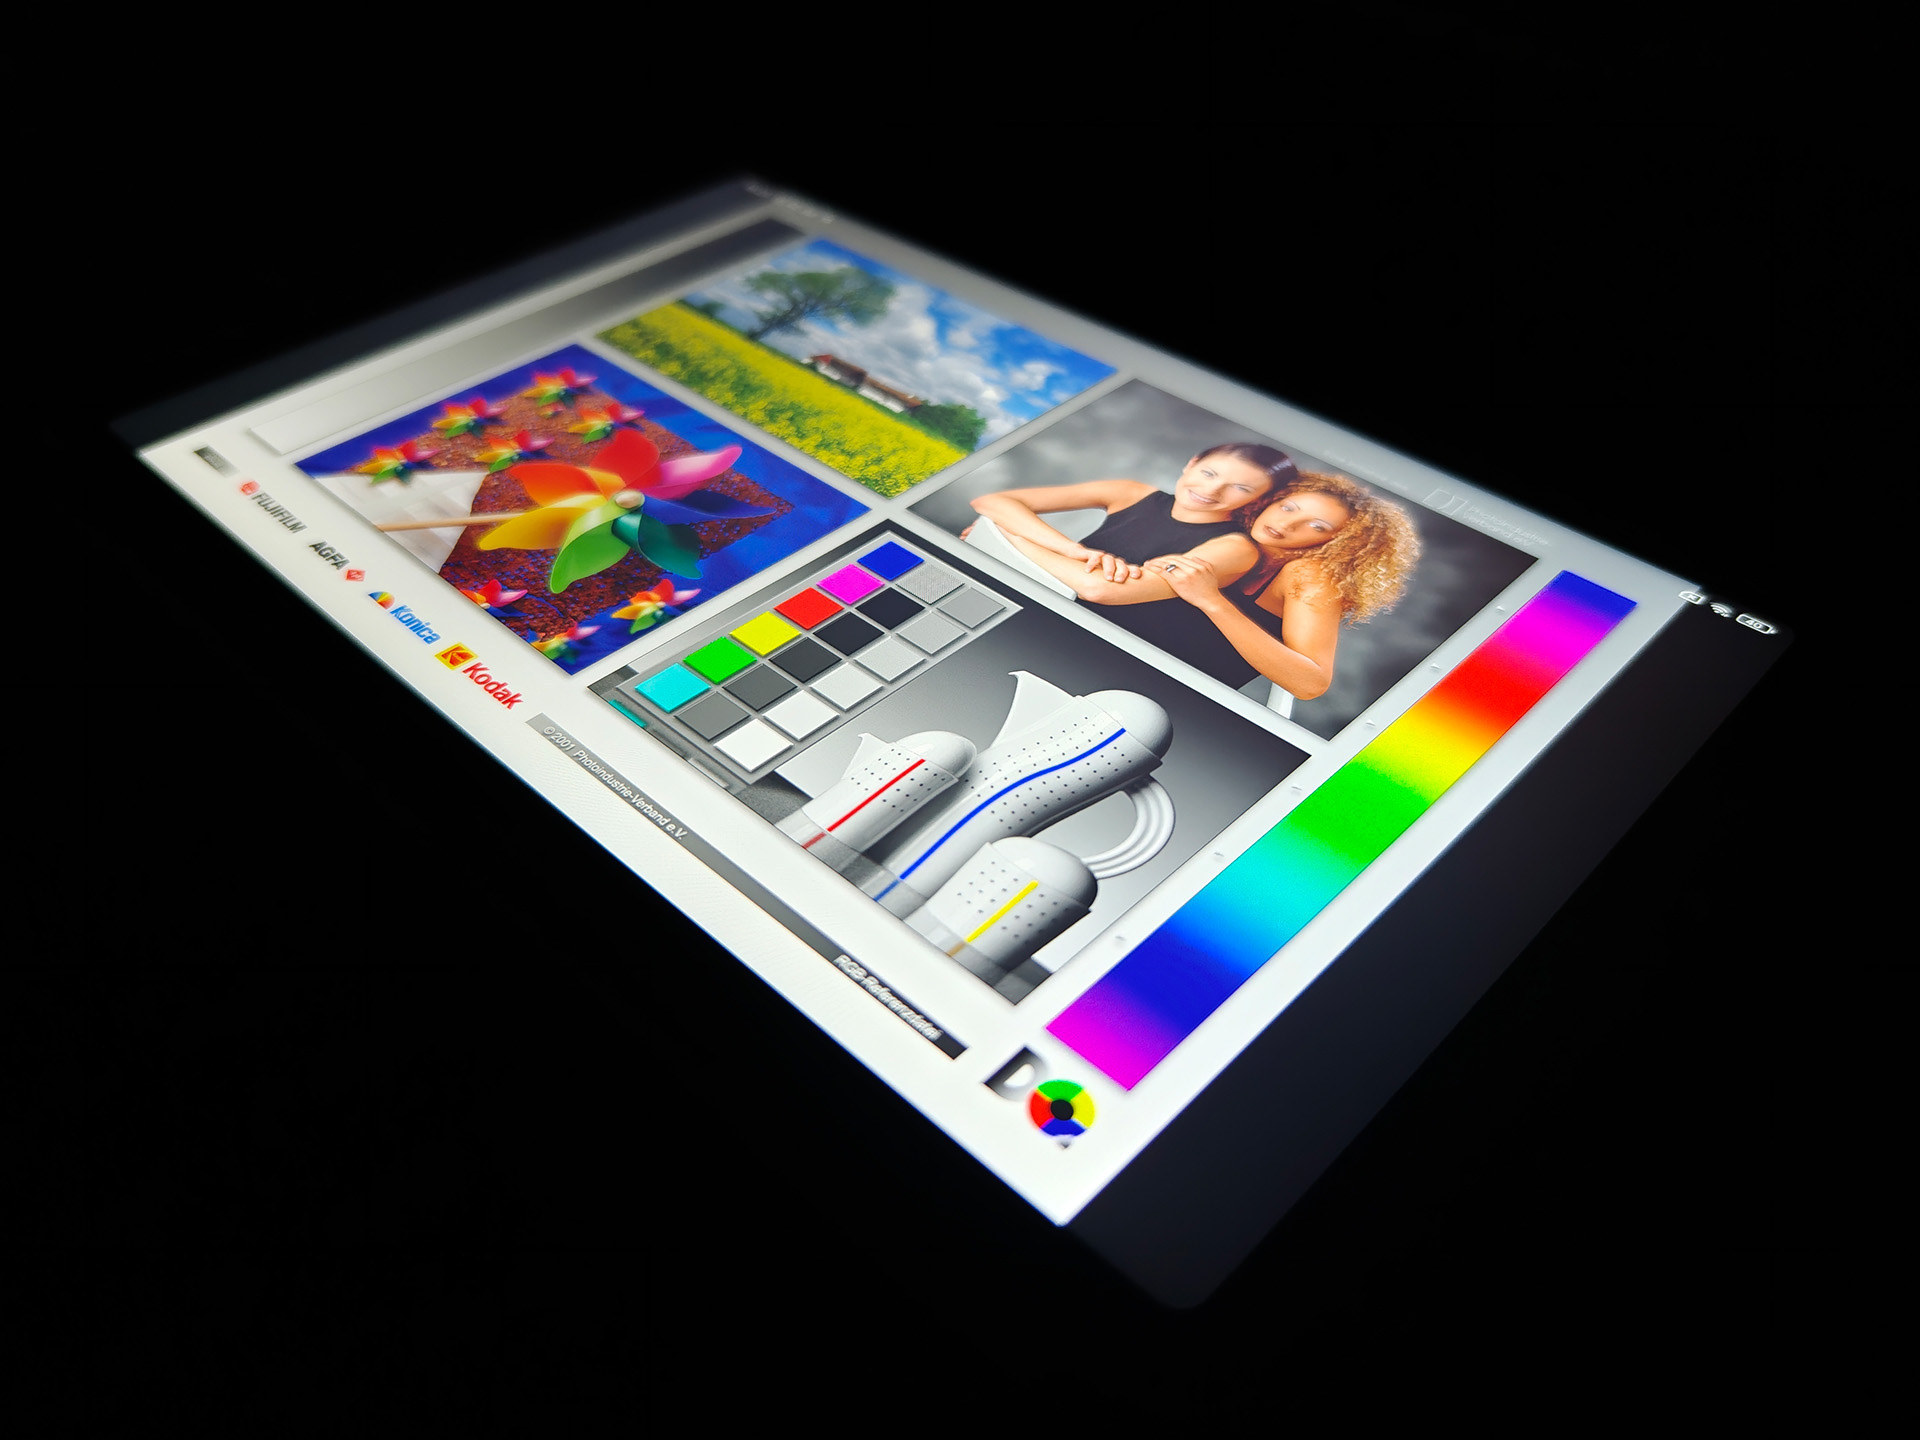
红米 Pad 2 4G 的液晶显示屏尺寸为 11 英寸,像素密度很高。由于黑度较低,它能显示出丰富的对比度。我们注意到在最低亮度时会出现高频闪烁,但这不是 PWM,在日常使用中不会造成任何问题。
根据小米的说法,Pad 2 的亮度可达 500 cd/m²,在室外模式下甚至可提升至 600 cd/m²。不过,我们在测量中无法验证这一点,因为这款平板电脑只有一个虚拟的环境光传感器,在调节亮度方面并不十分可靠。
因此,我们只在手动模式下测量了亮度,最多只能达到 400 cd/m² 的极限;在室外模式下,我们也没有发现更高的亮度值。虽然这对于室内使用来说已经足够,但在室外,红米 Pad 2 4G 很快就达到了极限。
| |||||||||||||||||||||||||
Brightness Distribution: 84 %
Center on Battery: 398 cd/m²
Contrast: 1421:1 (Black: 0.28 cd/m²)
ΔE ColorChecker Calman: 1.6 | ∀{0.5-29.43 Ø4.71}
ΔE Greyscale Calman: 3.2 | ∀{0.09-98 Ø4.96}
92.5% sRGB (Calman 2D)
Gamma: 2.67
CCT: 6542 K
| Xiaomi Redmi Pad 2 4G TFT-LCD, 2560x1600, 11" | Huawei MatePad 11.5 IPS, 2200x1440, 11.5" | Lenovo Tab K11 Plus IPS, 2000x1200, 11.5" | Samsung Galaxy Tab A9+ TFT-LCD, 1920x1200, 11" | |
|---|---|---|---|---|
| Screen | -38% | 17% | -83% | |
| Brightness middle (cd/m²) | 398 | 472 19% | 473 19% | 493 24% |
| Brightness (cd/m²) | 354 | 432 22% | 449 27% | 460 30% |
| Brightness Distribution (%) | 84 | 86 2% | 87 4% | 90 7% |
| Black Level * (cd/m²) | 0.28 | 0.44 -57% | 0.25 11% | 0.35 -25% |
| Contrast (:1) | 1421 | 1073 -24% | 1892 33% | 1409 -1% |
| Colorchecker dE 2000 * | 1.6 | 3.4 -113% | 1.56 2% | 6 -275% |
| Colorchecker dE 2000 max. * | 3.2 | 6.6 -106% | 3.8 -19% | 11.7 -266% |
| Greyscale dE 2000 * | 3.2 | 4.8 -50% | 1.3 59% | 8.2 -156% |
| Gamma | 2.67 82% | 2.41 91% | 2.178 101% | 2.21 100% |
| CCT | 6542 99% | 7035 92% | 6726 97% | 9131 71% |
* ... smaller is better
Screen Flickering / PWM (Pulse-Width Modulation)
| Screen flickering / PWM detected | 14990 Hz | 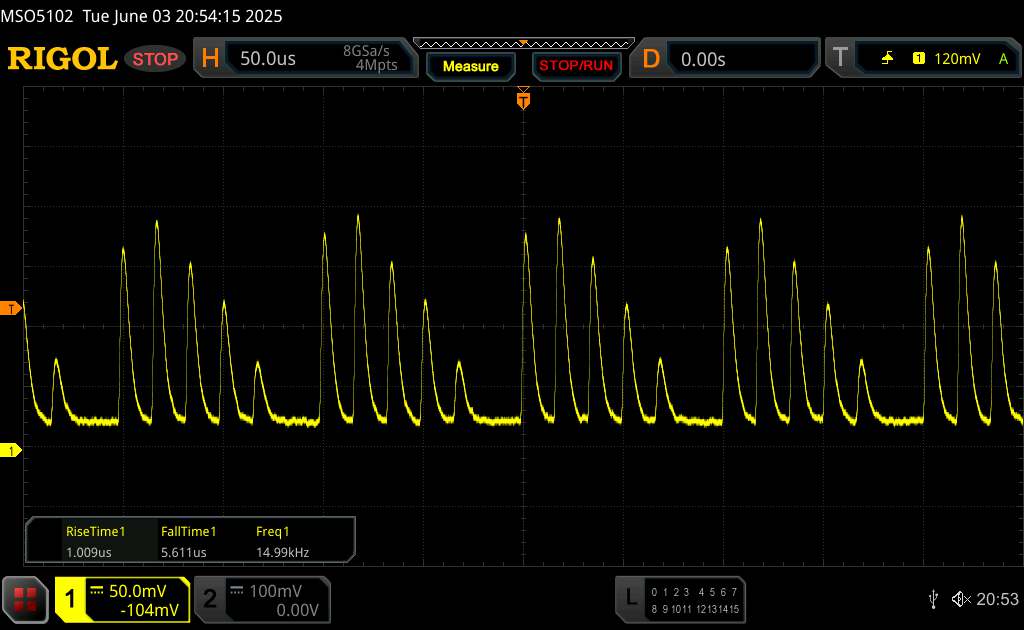 | |
The display backlight flickers at 14990 Hz (worst case, e.g., utilizing PWM) . The frequency of 14990 Hz is quite high, so most users sensitive to PWM should not notice any flickering. In comparison: 52 % of all tested devices do not use PWM to dim the display. If PWM was detected, an average of 7747 (minimum: 5 - maximum: 343500) Hz was measured. | |||
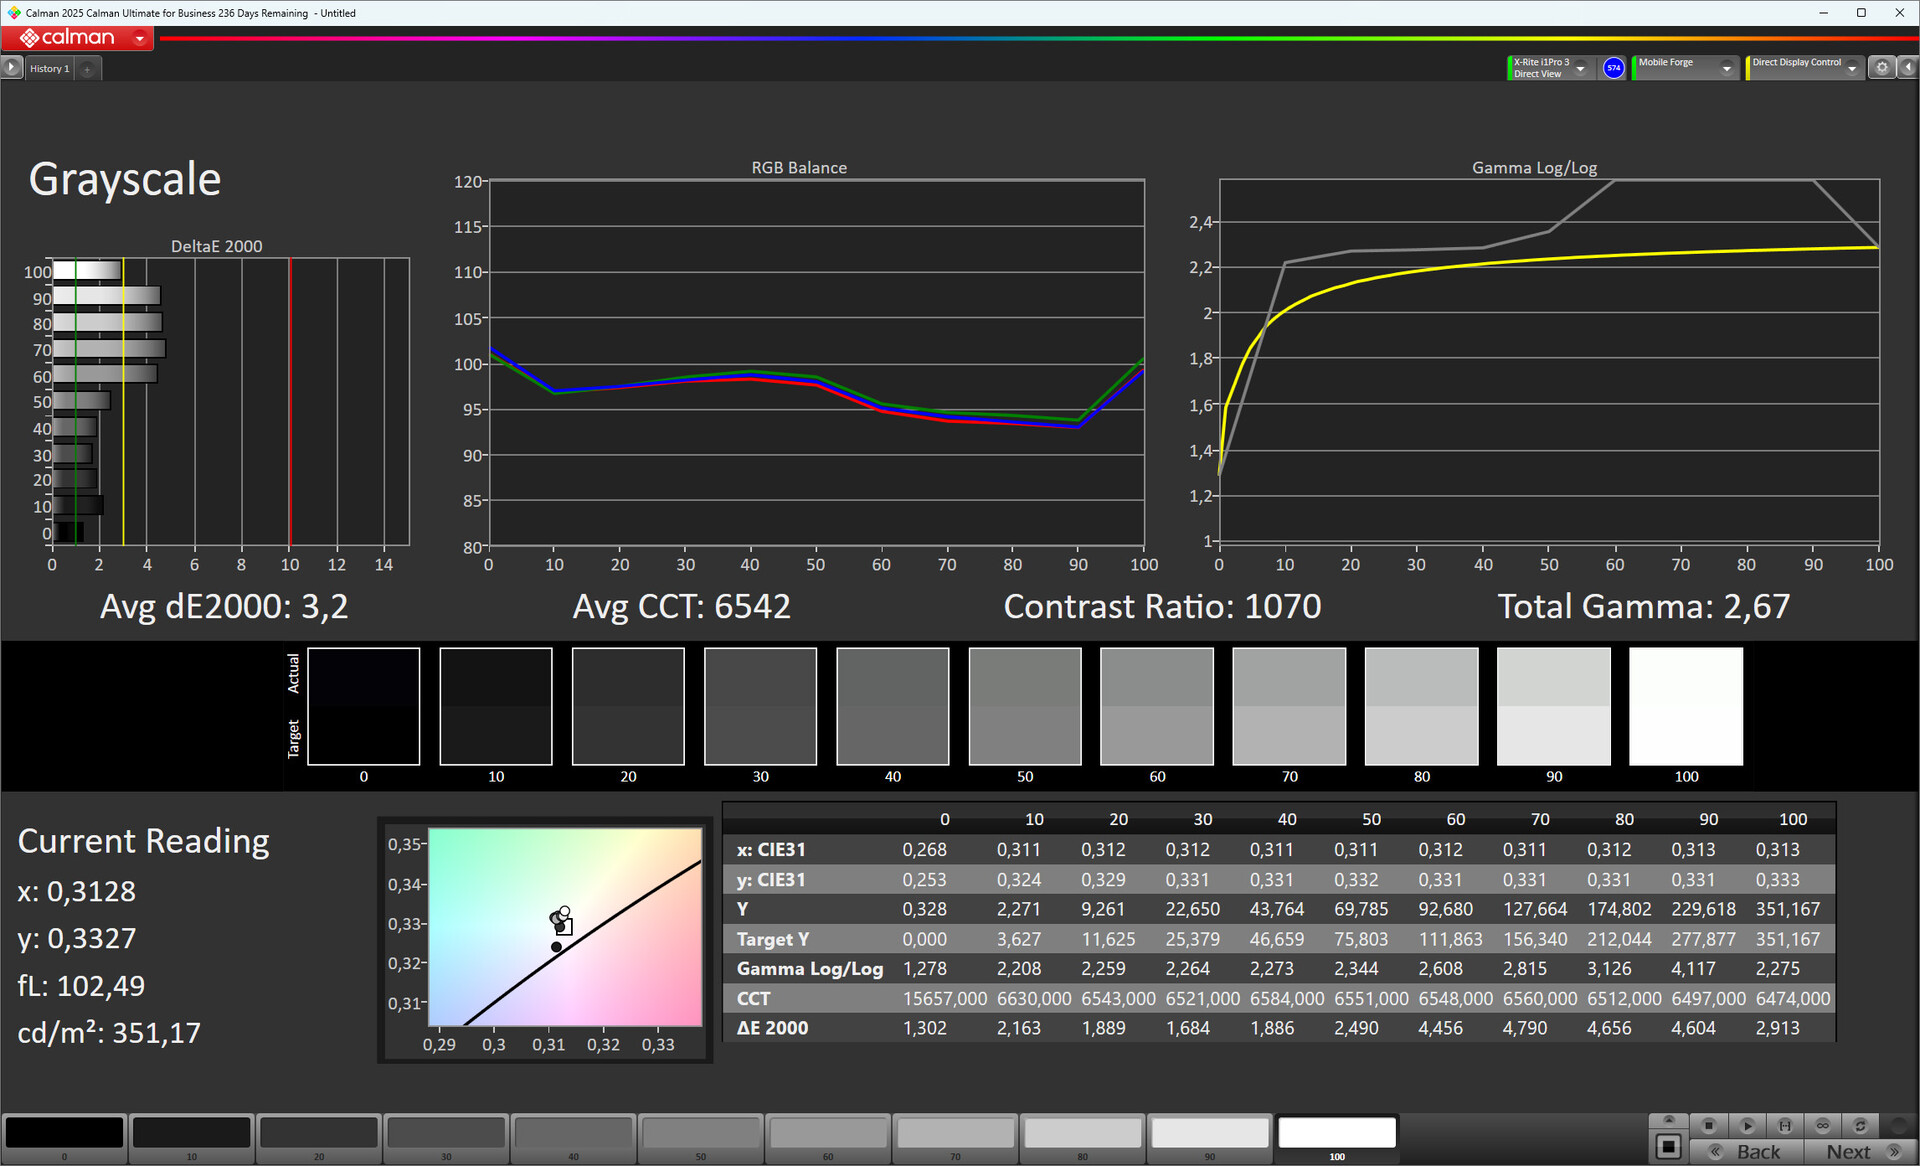


Display Response Times
| ↔ Response Time Black to White | ||
|---|---|---|
| 24.2 ms ... rise ↗ and fall ↘ combined | ↗ 11.68 ms rise | 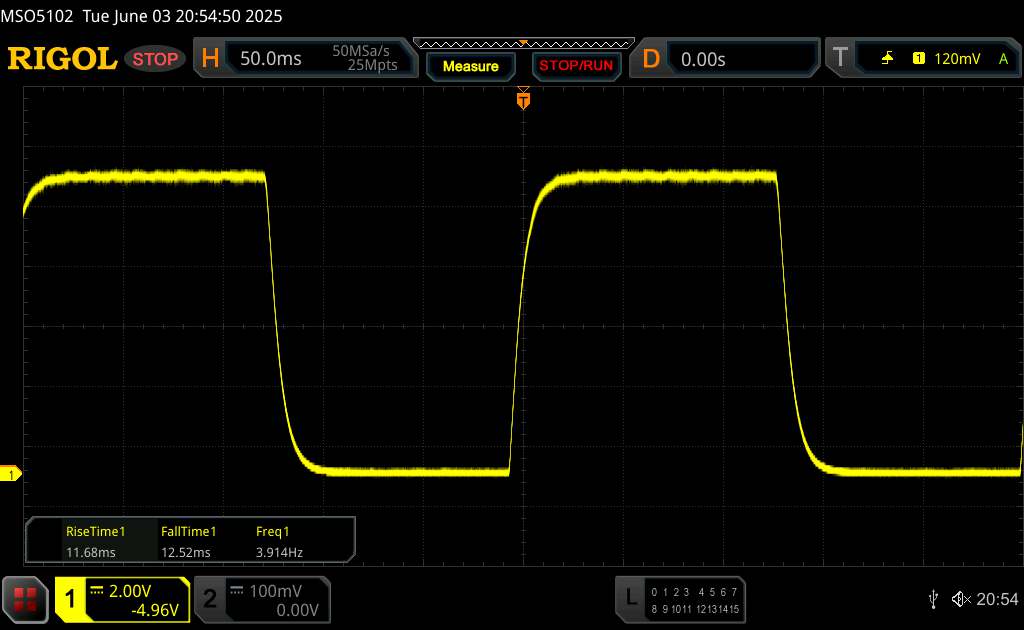 |
| ↘ 12.52 ms fall | ||
| The screen shows good response rates in our tests, but may be too slow for competitive gamers. In comparison, all tested devices range from 0.1 (minimum) to 240 (maximum) ms. » 57 % of all devices are better. This means that the measured response time is worse than the average of all tested devices (19.8 ms). | ||
| ↔ Response Time 50% Grey to 80% Grey | ||
| 33.04 ms ... rise ↗ and fall ↘ combined | ↗ 14.46 ms rise | 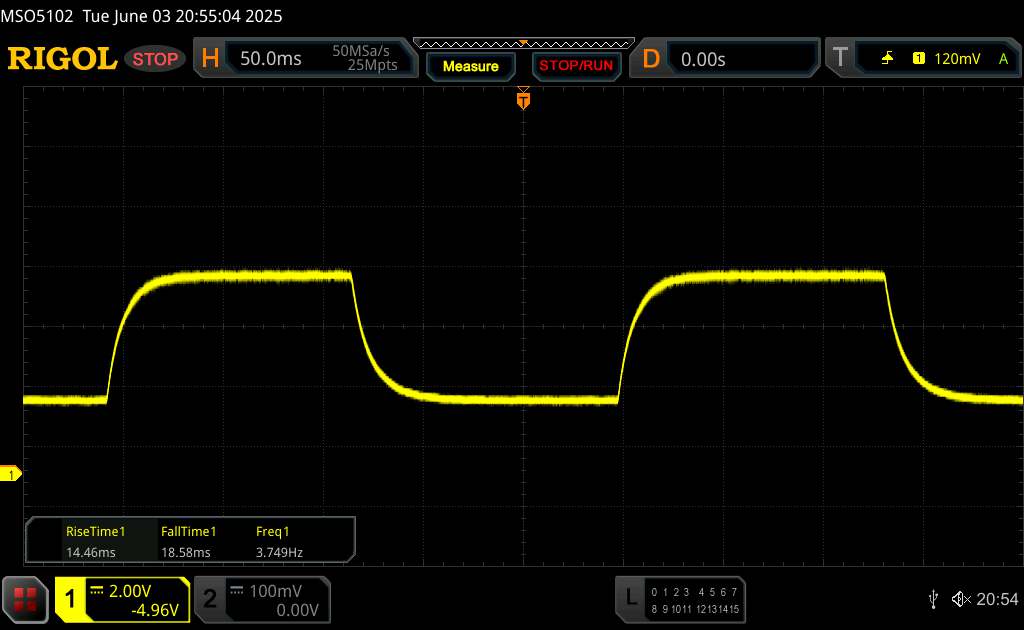 |
| ↘ 18.58 ms fall | ||
| The screen shows slow response rates in our tests and will be unsatisfactory for gamers. In comparison, all tested devices range from 0.165 (minimum) to 636 (maximum) ms. » 46 % of all devices are better. This means that the measured response time is similar to the average of all tested devices (31 ms). | ||
红米 Pad 2 4G 的进一步测量和基准测试
| Networking | |
| Xiaomi Redmi Pad 2 4G | |
| iperf3 transmit AXE11000 | |
| iperf3 receive AXE11000 | |
| Huawei MatePad 11.5 | |
| iperf3 transmit AXE11000 | |
| iperf3 receive AXE11000 | |
| Lenovo Tab K11 Plus | |
| iperf3 transmit AXE11000 | |
| iperf3 receive AXE11000 | |
| Samsung Galaxy Tab A9+ | |
| iperf3 transmit AXE11000 | |
| iperf3 receive AXE11000 | |
| Average 802.11 a/b/g/n/ac | |
| iperf3 transmit AXE11000 | |
| iperf3 receive AXE11000 | |
| Average of class Tablet | |
| iperf3 transmit AXE11000 | |
| iperf3 receive AXE11000 | |
| PCMark for Android - Work 3.x | |
| Average of class Tablet (7084 - 27428, n=59, last 2 years) | |
| Average Mediatek Helio G100 (10703 - 10723, n=2) | |
| Samsung Galaxy Tab A9+ | |
| Huawei MatePad 11.5 | |
| Lenovo Tab K11 Plus | |
| Geekbench AI | |
| Single Precision NPU 1.7 | |
| Average of class Tablet (166 - 5295, n=45, last 2 years) | |
| Average Mediatek Helio G100 (n=1) | |
| Xiaomi Redmi Pad 2 4G | |
| Half Precision NPU 1.7 | |
| Average of class Tablet (154 - 41155, n=45, last 2 years) | |
| Average Mediatek Helio G100 (n=1) | |
| Xiaomi Redmi Pad 2 4G | |
| Quantized NPU 1.7 | |
| Average of class Tablet (88 - 57388, n=45, last 2 years) | |
| Average Mediatek Helio G100 (n=1) | |
| Xiaomi Redmi Pad 2 4G | |
| Xiaomi Redmi Pad 2 4G | Huawei MatePad 11.5 | Lenovo Tab K11 Plus | Samsung Galaxy Tab A9+ | Average 256 GB UFS 2.2 Flash | Average of class Tablet | |
|---|---|---|---|---|---|---|
| AndroBench 3-5 | 32% | 4% | -42% | -3% | 64% | |
| Sequential Read 256KB (MB/s) | 975.3 | 1037.71 6% | 1003.25 3% | 485.96 -50% | 901 ? -8% | 2048 ? 110% |
| Sequential Write 256KB (MB/s) | 913.33 | 903.32 -1% | 876.29 -4% | 476.37 -48% | 732 ? -20% | 1640 ? 80% |
| Random Read 4KB (MB/s) | 214.81 | 297.25 38% | 244.03 14% | 130.67 -39% | 225 ? 5% | 273 ? 27% |
| Random Write 4KB (MB/s) | 228.14 | 418.84 84% | 232.16 2% | 162.9 -29% | 250 ? 10% | 319 ? 40% |
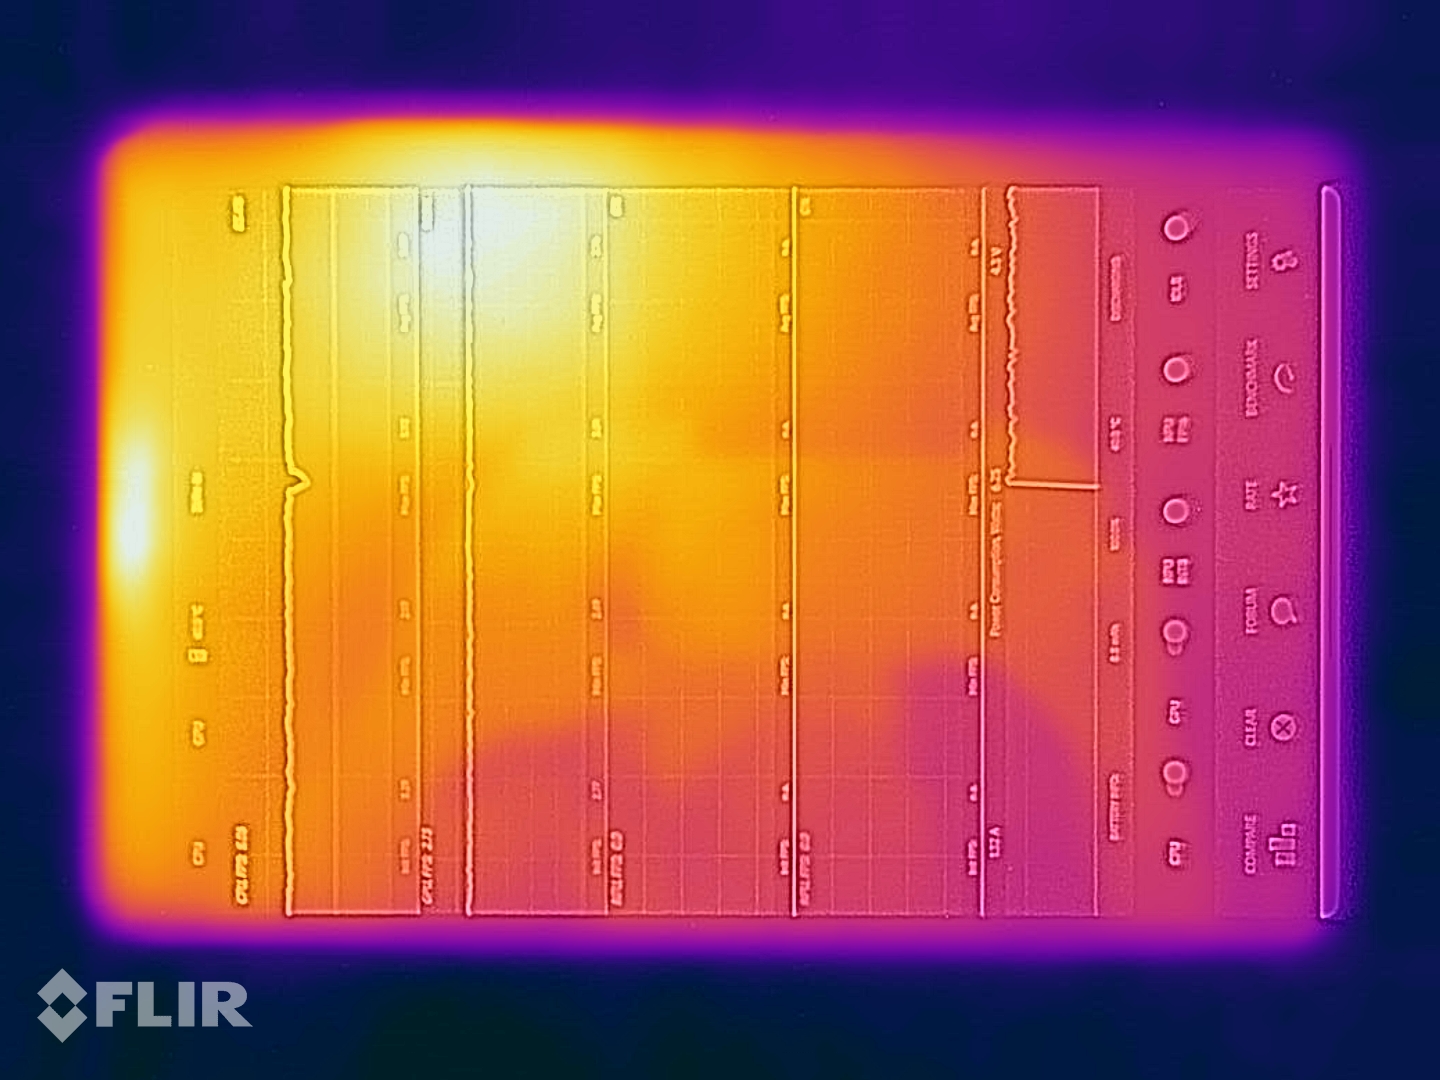
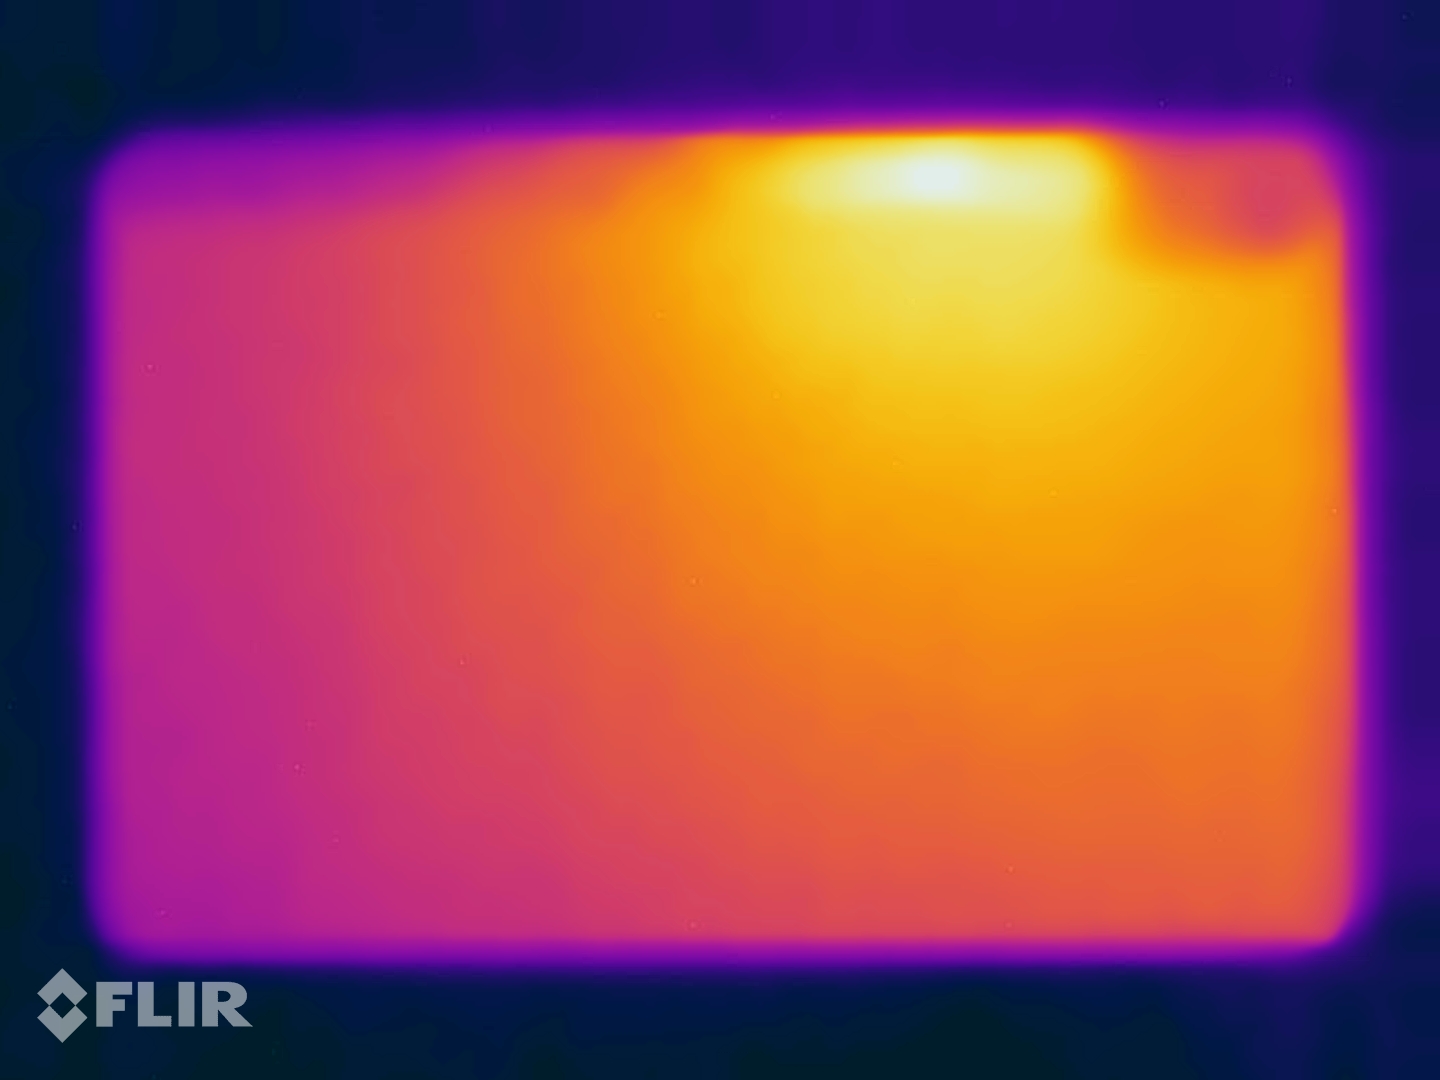
(+) The maximum temperature on the upper side is 36.1 °C / 97 F, compared to the average of 33.7 °C / 93 F, ranging from 20.7 to 53.2 °C for the class Tablet.
(+) The bottom heats up to a maximum of 35.3 °C / 96 F, compared to the average of 33.2 °C / 92 F
(+) In idle usage, the average temperature for the upper side is 26.7 °C / 80 F, compared to the device average of 30 °C / 86 F.
3DMark Steel Nomad Stress Test
| 3DMark | |
| Wild Life Stress Test Stability | |
| Huawei MatePad 11.5 | |
| Lenovo Tab K11 Plus | |
| Samsung Galaxy Tab A9+ | |
| Xiaomi Redmi Pad 2 4G | |
| Steel Nomad Light Stress Test Stability | |
| Xiaomi Redmi Pad 2 4G | |
| Lenovo Tab K11 Plus | |
Xiaomi Redmi Pad 2 4G audio analysis
(+) | speakers can play relatively loud (86.3 dB)
Bass 100 - 315 Hz
(-) | nearly no bass - on average 19.8% lower than median
(±) | linearity of bass is average (10.9% delta to prev. frequency)
Mids 400 - 2000 Hz
(±) | higher mids - on average 6.7% higher than median
(+) | mids are linear (5.3% delta to prev. frequency)
Highs 2 - 16 kHz
(+) | balanced highs - only 3.3% away from median
(+) | highs are linear (6.3% delta to prev. frequency)
Overall 100 - 16.000 Hz
(±) | linearity of overall sound is average (16.4% difference to median)
Compared to same class
» 38% of all tested devices in this class were better, 5% similar, 57% worse
» The best had a delta of 7%, average was 20%, worst was 129%
Compared to all devices tested
» 27% of all tested devices were better, 6% similar, 67% worse
» The best had a delta of 4%, average was 23%, worst was 134%
Samsung Galaxy Tab A9+ audio analysis
(+) | speakers can play relatively loud (89.3 dB)
Bass 100 - 315 Hz
(-) | nearly no bass - on average 22.4% lower than median
(±) | linearity of bass is average (10% delta to prev. frequency)
Mids 400 - 2000 Hz
(±) | higher mids - on average 5.7% higher than median
(+) | mids are linear (5.8% delta to prev. frequency)
Highs 2 - 16 kHz
(+) | balanced highs - only 2.4% away from median
(+) | highs are linear (3.7% delta to prev. frequency)
Overall 100 - 16.000 Hz
(±) | linearity of overall sound is average (15.5% difference to median)
Compared to same class
» 35% of all tested devices in this class were better, 3% similar, 62% worse
» The best had a delta of 7%, average was 20%, worst was 129%
Compared to all devices tested
» 23% of all tested devices were better, 4% similar, 73% worse
» The best had a delta of 4%, average was 23%, worst was 134%
| Battery runtime - WiFi v1.3 | |
| Xiaomi Redmi Pad 2 4G | |
| Huawei MatePad 11.5 | |
| Lenovo Tab K11 Plus | |
| Samsung Galaxy Tab A9+ | |
Notebookcheck 总体评分
小米红米 Pad 2 4G 是一款物美价廉的平板电脑,具有良好的音质、不错的 11 英寸显示屏和稳定的性能,适合日常使用。摄像头和显示屏足以满足简单应用的需求,但很快就会达到极限。LTE、插孔连接、FM 收音机、microSD 和低廉的价格都是实用的功能。
Xiaomi Redmi Pad 2 4G
- 07/24/2025 v8
Daniel Schmidt
 Total Sustainability Score:
 可能的替代品比较
Transparency
The selection of devices to be reviewed is made by our editorial team. The test sample was given to the author by the manufacturer free of charge for the purposes of review. There was no third-party influence on this review, nor did the manufacturer receive a copy of this review before publication. There was no obligation to publish this review. As an independent media company, Notebookcheck is not subjected to the authority of manufacturers, retailers or publishers.
This is how Notebookcheck is testing
Every year, Notebookcheck independently reviews hundreds of laptops and smartphones using standardized procedures to ensure that all results are comparable. We have continuously developed our test methods for around 20 years and set industry standards in the process. In our test labs, high-quality measuring equipment is utilized by experienced technicians and editors. These tests involve a multi-stage validation process. Our complex rating system is based on hundreds of well-founded measurements and benchmarks, which maintains objectivity. Further information on our test methods can be found here.

