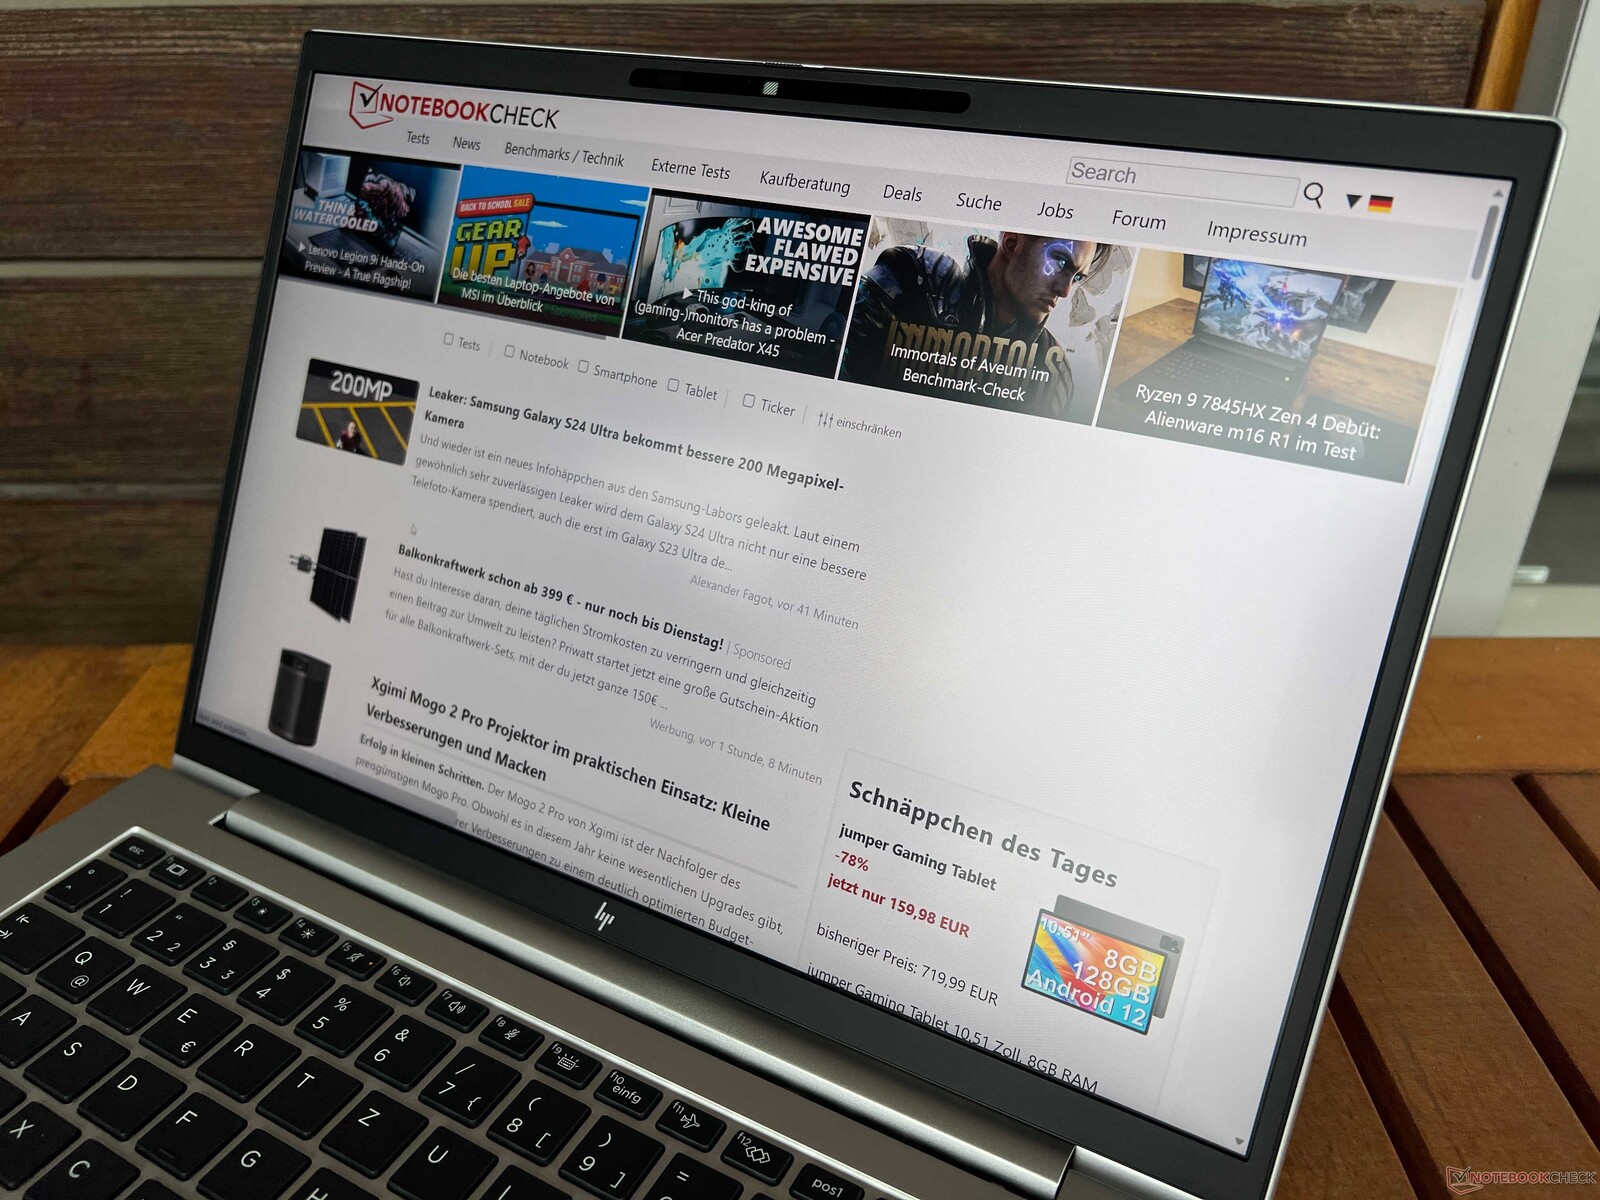
惠普 EliteBook 1040 G10 笔记本电脑评测--惠普对 ThinkPad X1 Carbon 的回应
EliteBook 1040 G10 是惠普的商务旗舰产品。就价格而言,它的定位甚至高于 EliteBook 845 G10的价格。因此,它的直接竞争对手是联想的 ThinkPad X1 Carbon G11的直接竞争对手。惠普为其高端笔记本电脑配备了丰富的安全功能和镁合金外壳。此外,英特尔当前的 U 或 P 系列 CPU 还有许多不同的配置选项。
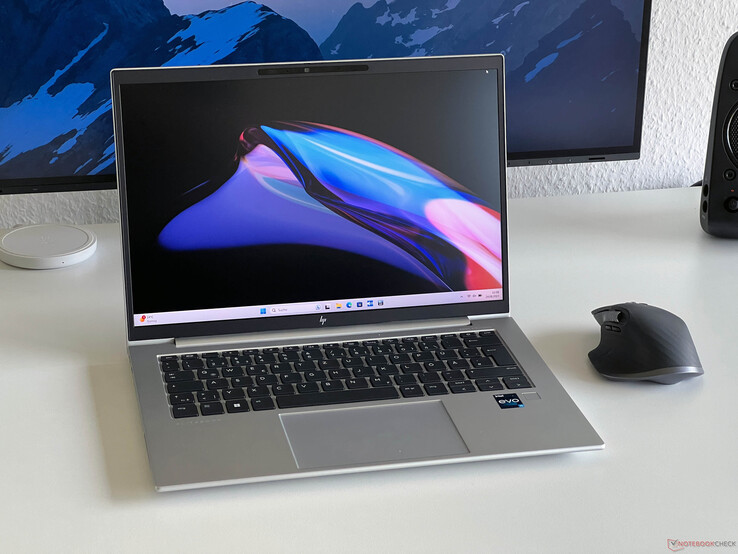
我们的测试机售价 1669 欧元(约合 1785 美元),是最经济实惠的 EliteBook 1040 G10 版本之一。它配备了 400 尼特的低功耗 1080p 显示屏、一个 酷睿 i5-1335U16GB内存、512GB固态硬盘和LTE调制解调器。在惠普的校园计划中,该版本的售价已经达到 1379 欧元(约合 1475 美元)。
潜在的竞争对手比较
Rating | Date | Model | Weight | Height | Size | Resolution | Price |
|---|---|---|---|---|---|---|---|
| 88.4 % v7 (old) | 09 / 2023 | HP EliteBook 1040 G10 818N7EA i5-1335U, Iris Xe G7 80EUs | 1.3 kg | 17.9 mm | 14.00" | 1920x1200 | |
| 90.1 % v7 (old) | 08 / 2023 | HP EliteBook 845 G10 818N0EA R9 PRO 7940HS, Radeon 780M | 1.5 kg | 17.9 mm | 14.00" | 2560x1600 | |
| 88.9 % v7 (old) | 06 / 2023 | Lenovo ThinkPad X1 Carbon G11-21HNS00000 i7-1365U, Iris Xe G7 96EUs | 1.2 kg | 15.36 mm | 14.00" | 1920x1200 | |
| 89.6 % v7 (old) | 06 / 2023 | Huawei MateBook X Pro 2023 i7-1360P, Iris Xe G7 96EUs | 1.3 kg | 15.6 mm | 14.20" | 3120x2080 | |
| 88.8 % v7 (old) | 10 / 2022 | Schenker Vision 14 2022 RTX 3050 Ti i7-12700H, GeForce RTX 3050 Ti Laptop GPU | 1.3 kg | 16.6 mm | 14.00" | 2880x1800 |
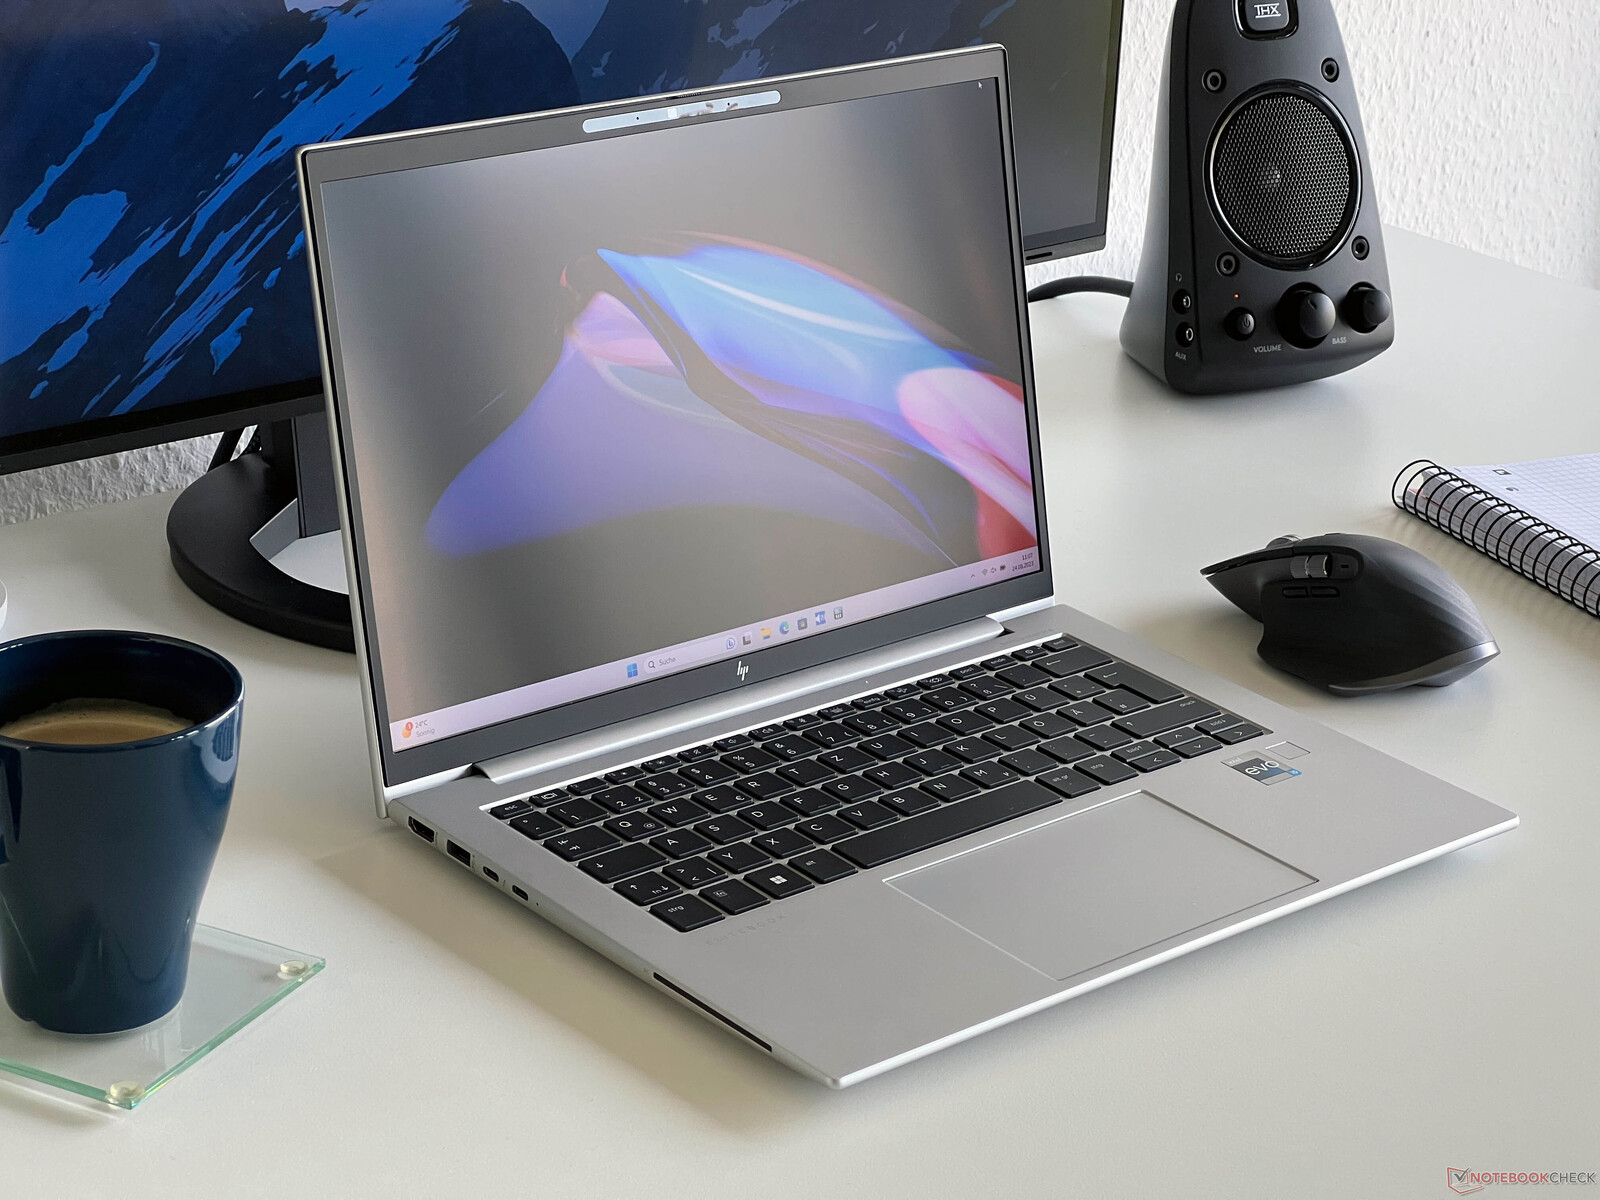
外壳 - 配备镁合金外壳的 EliteBook
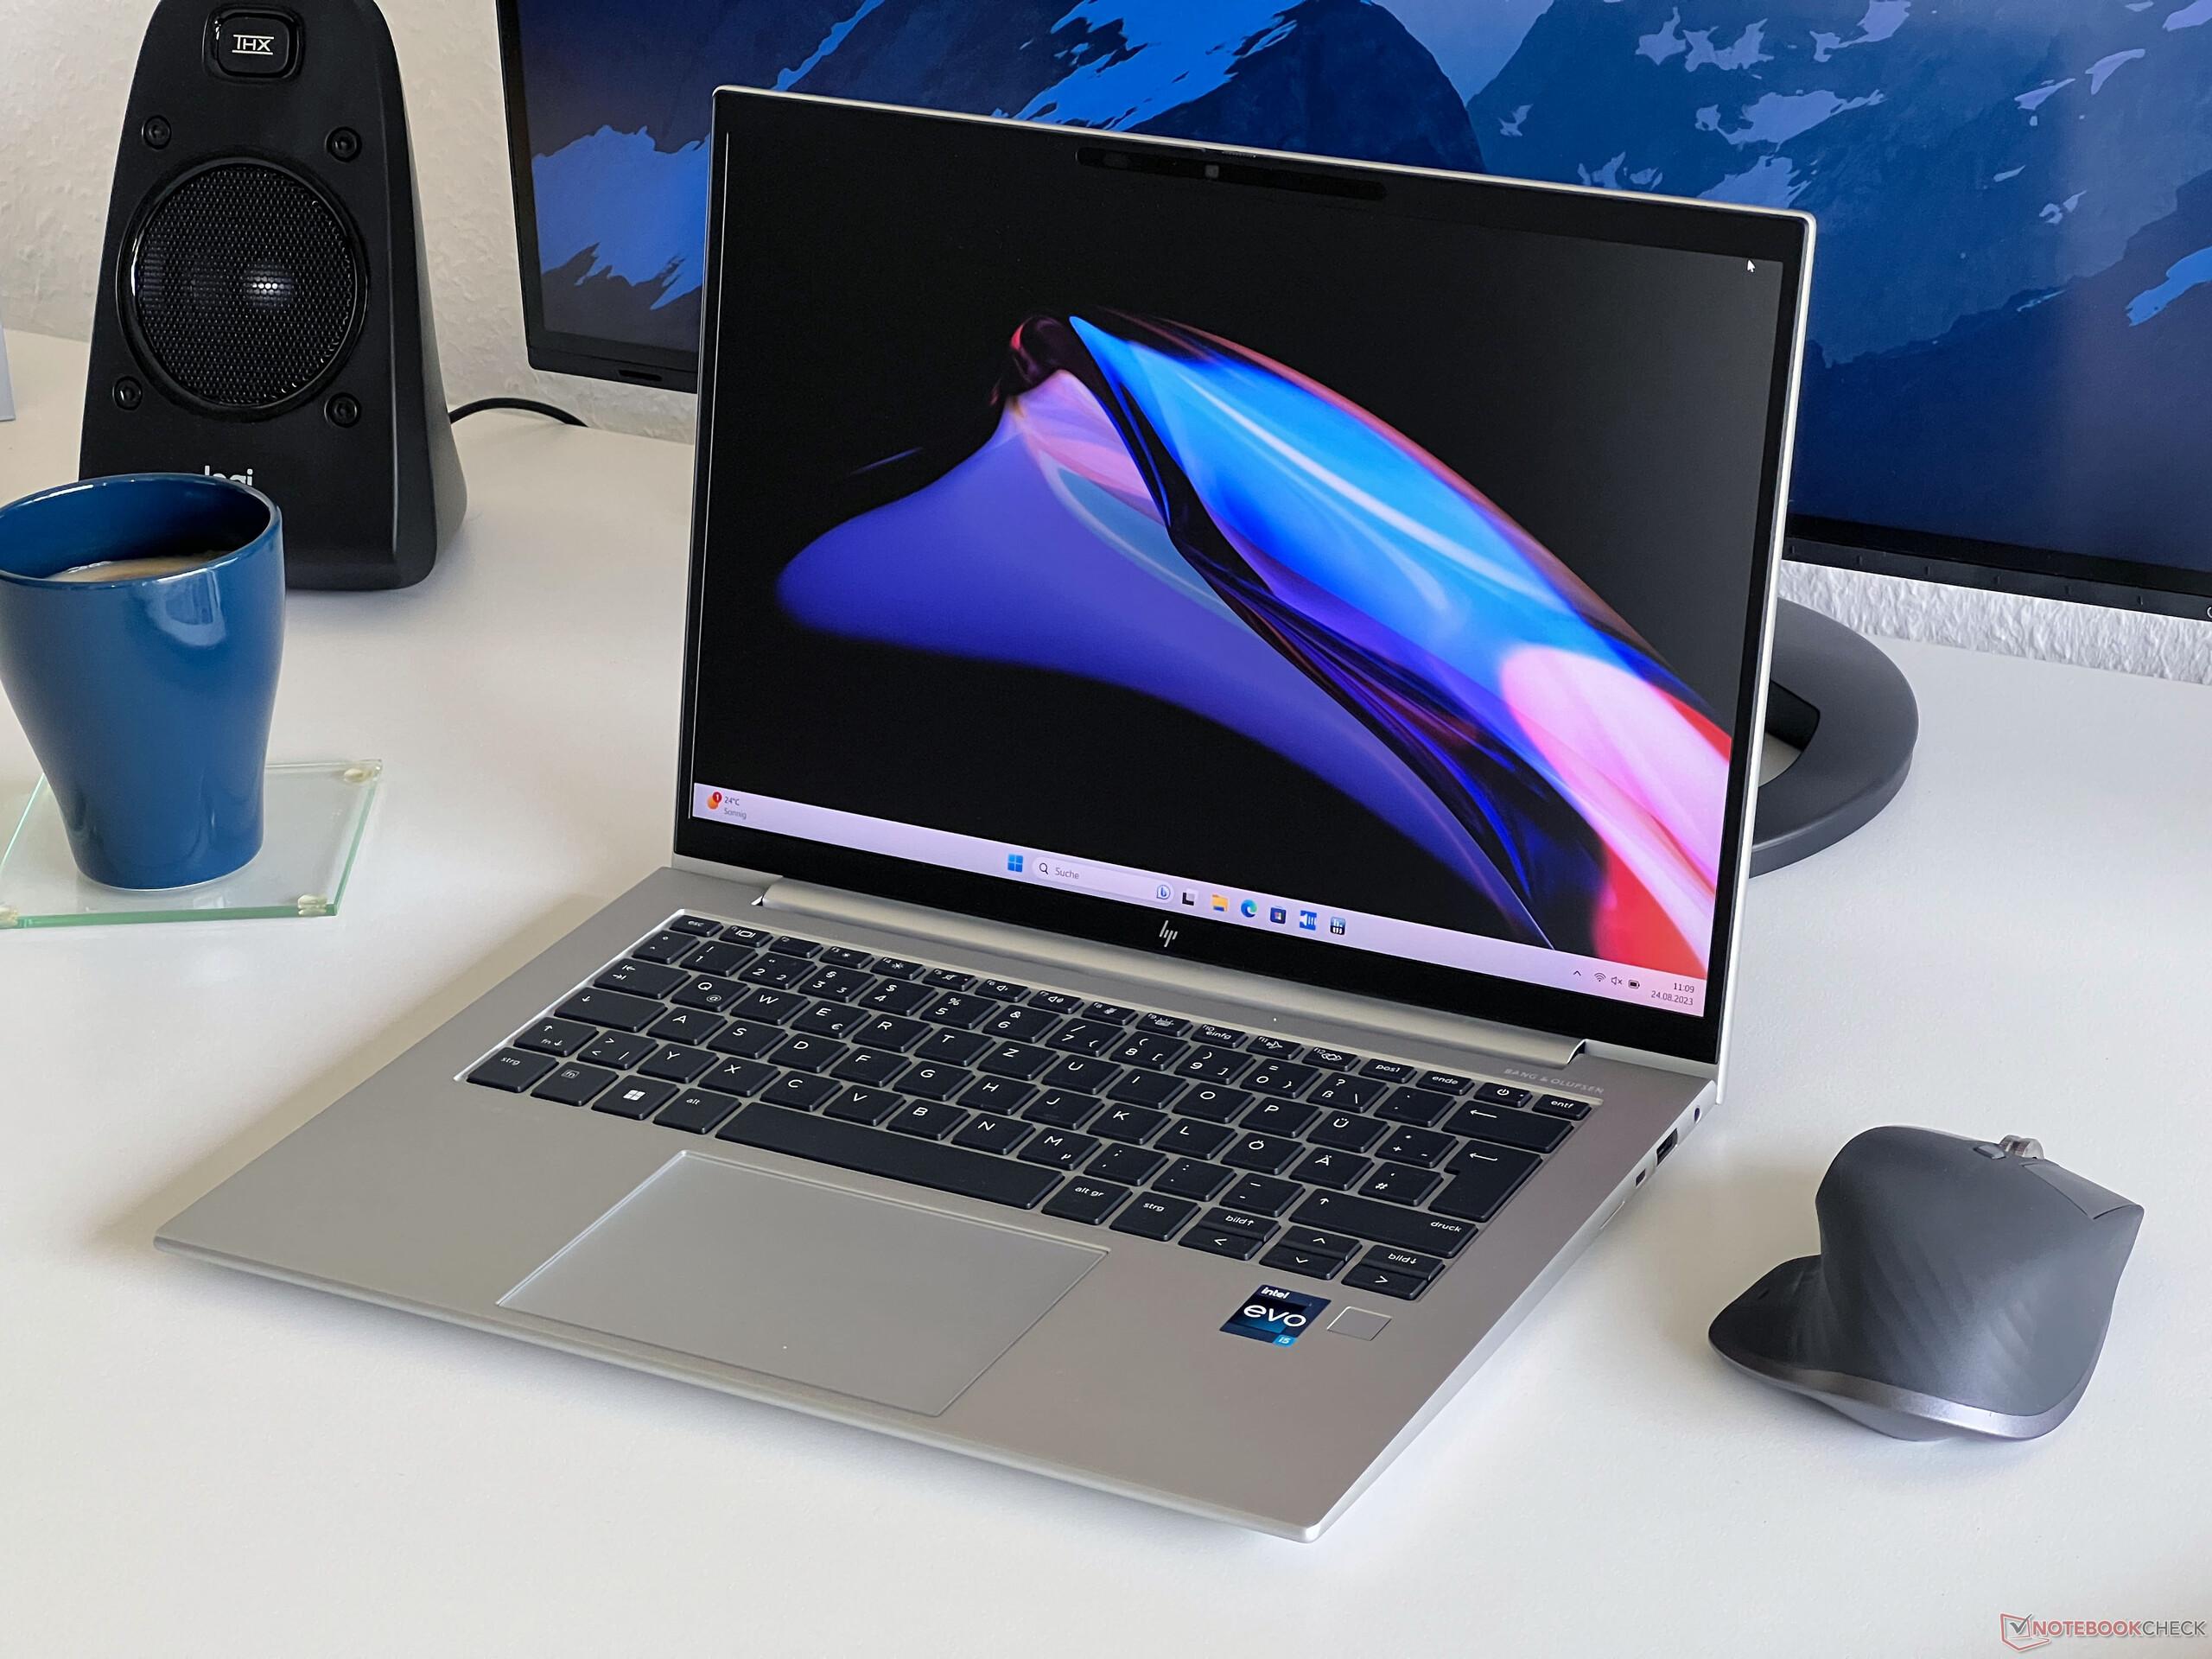
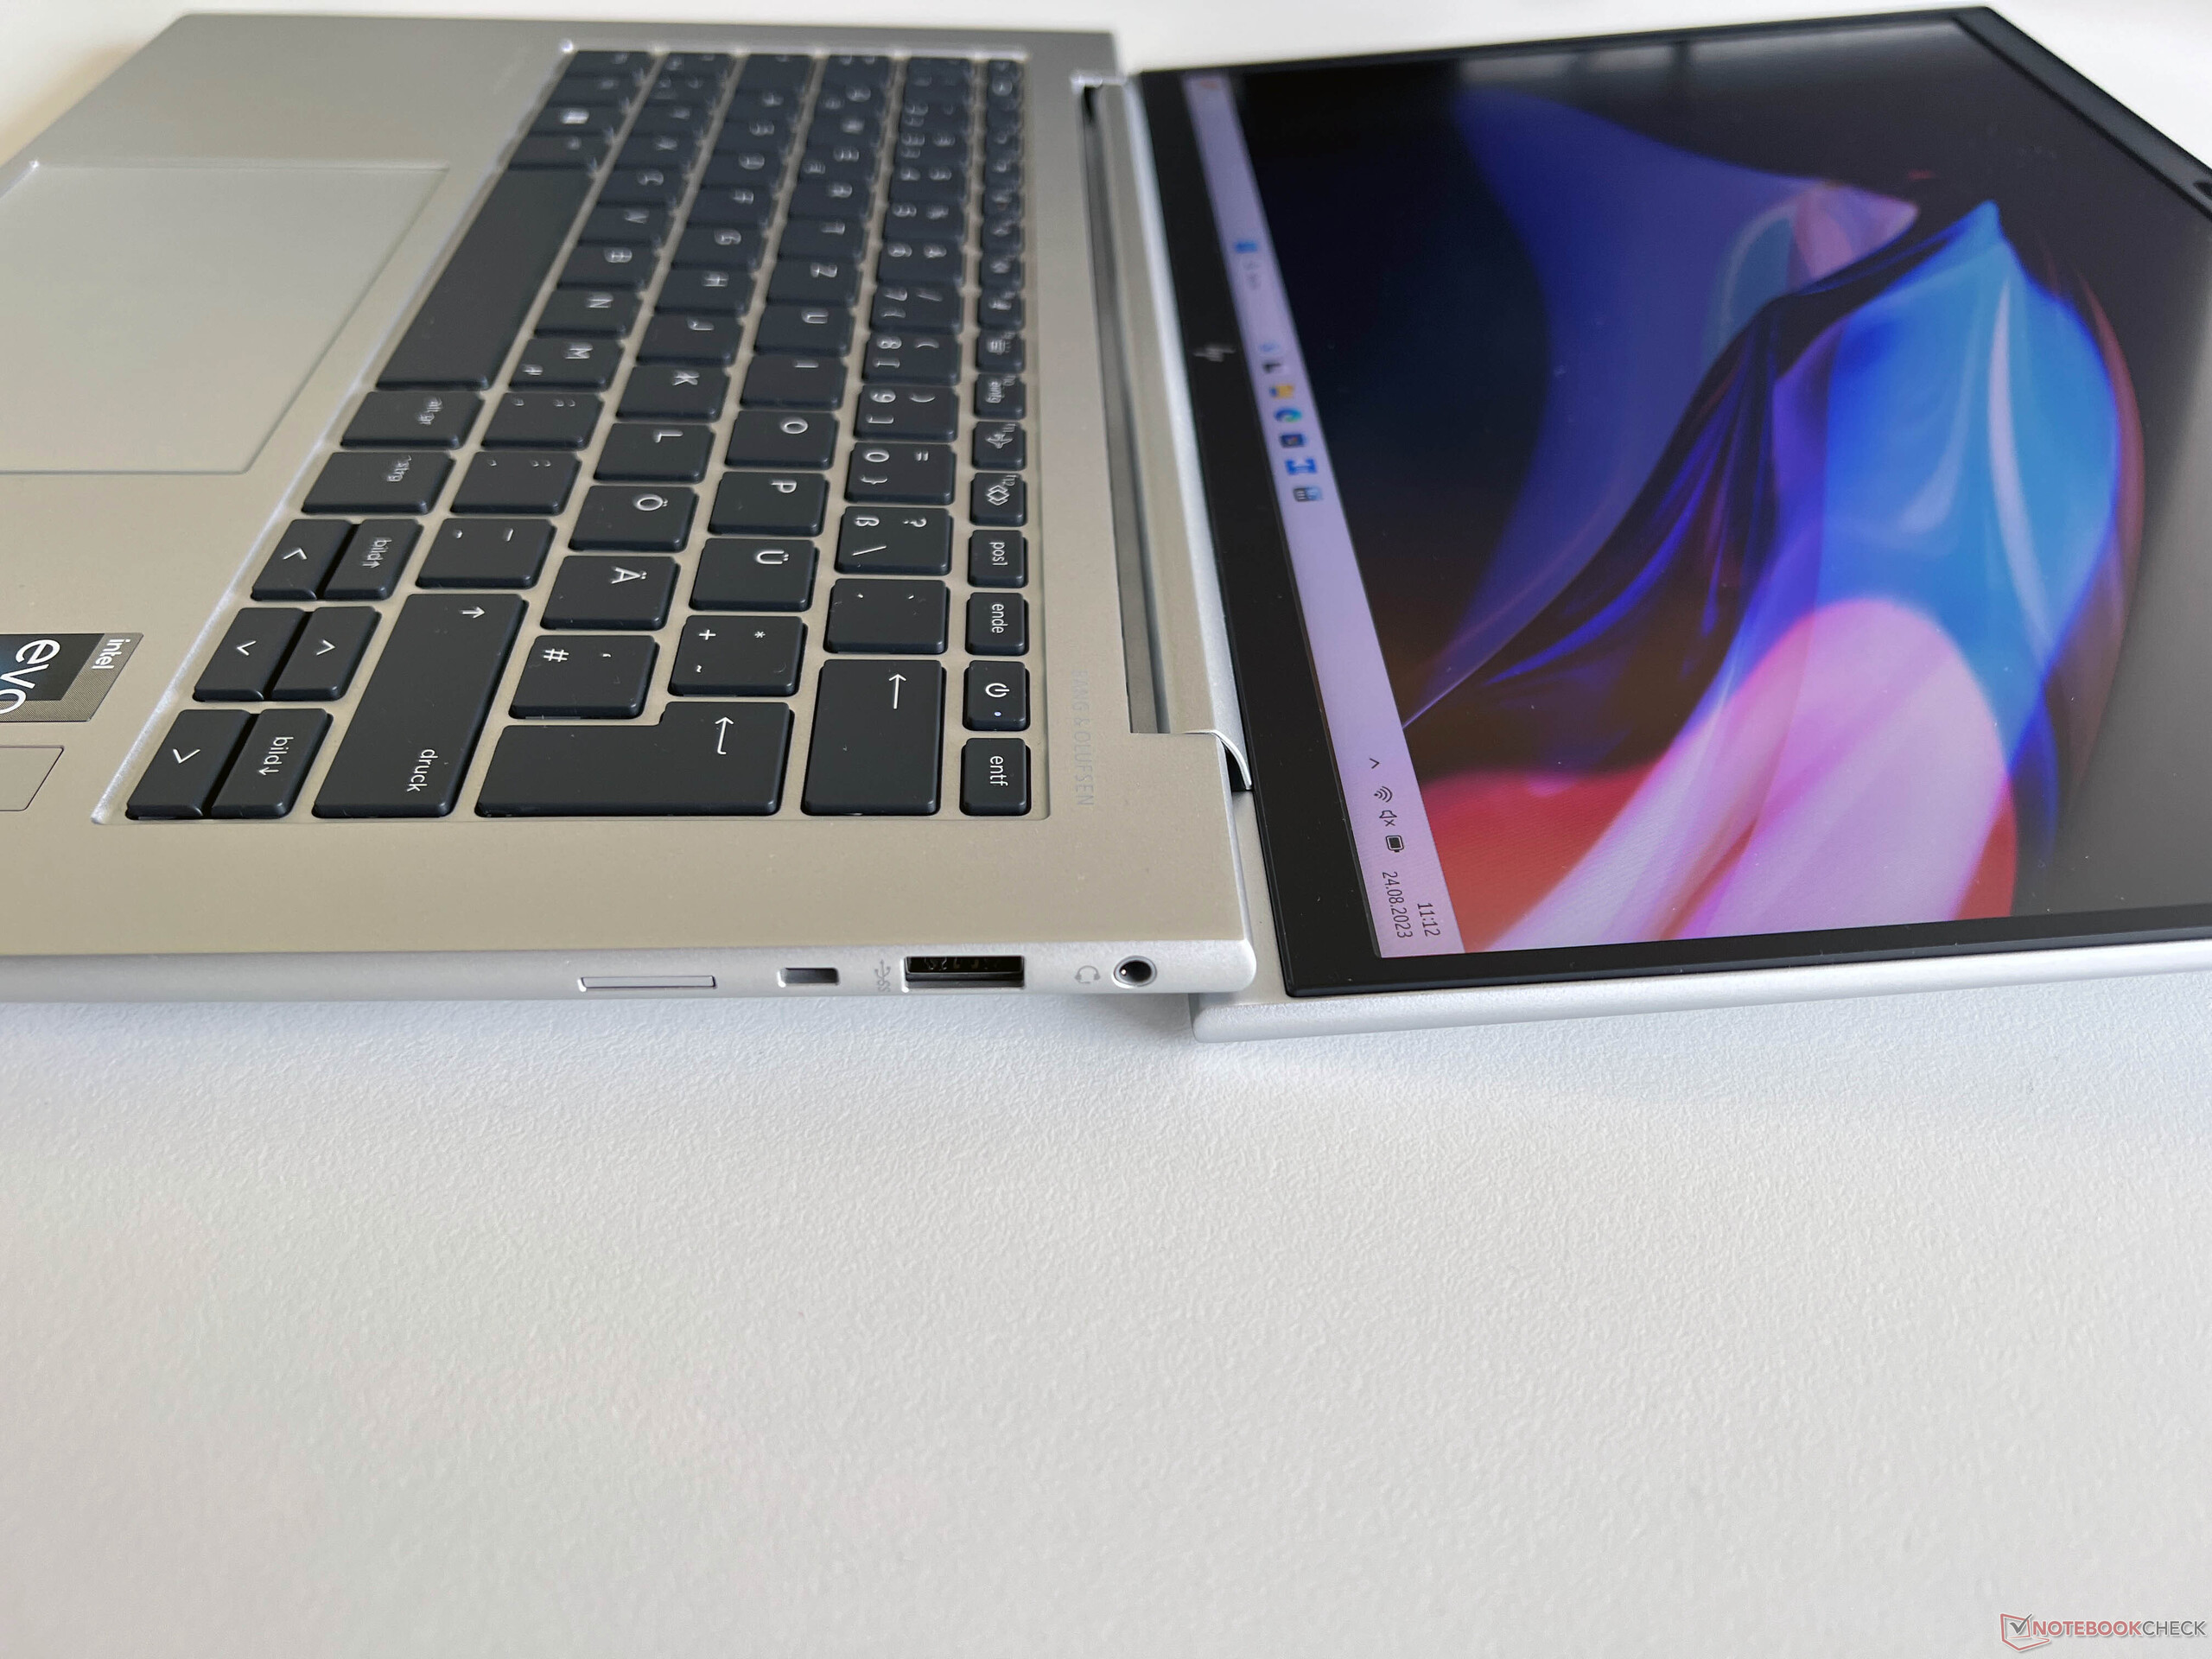
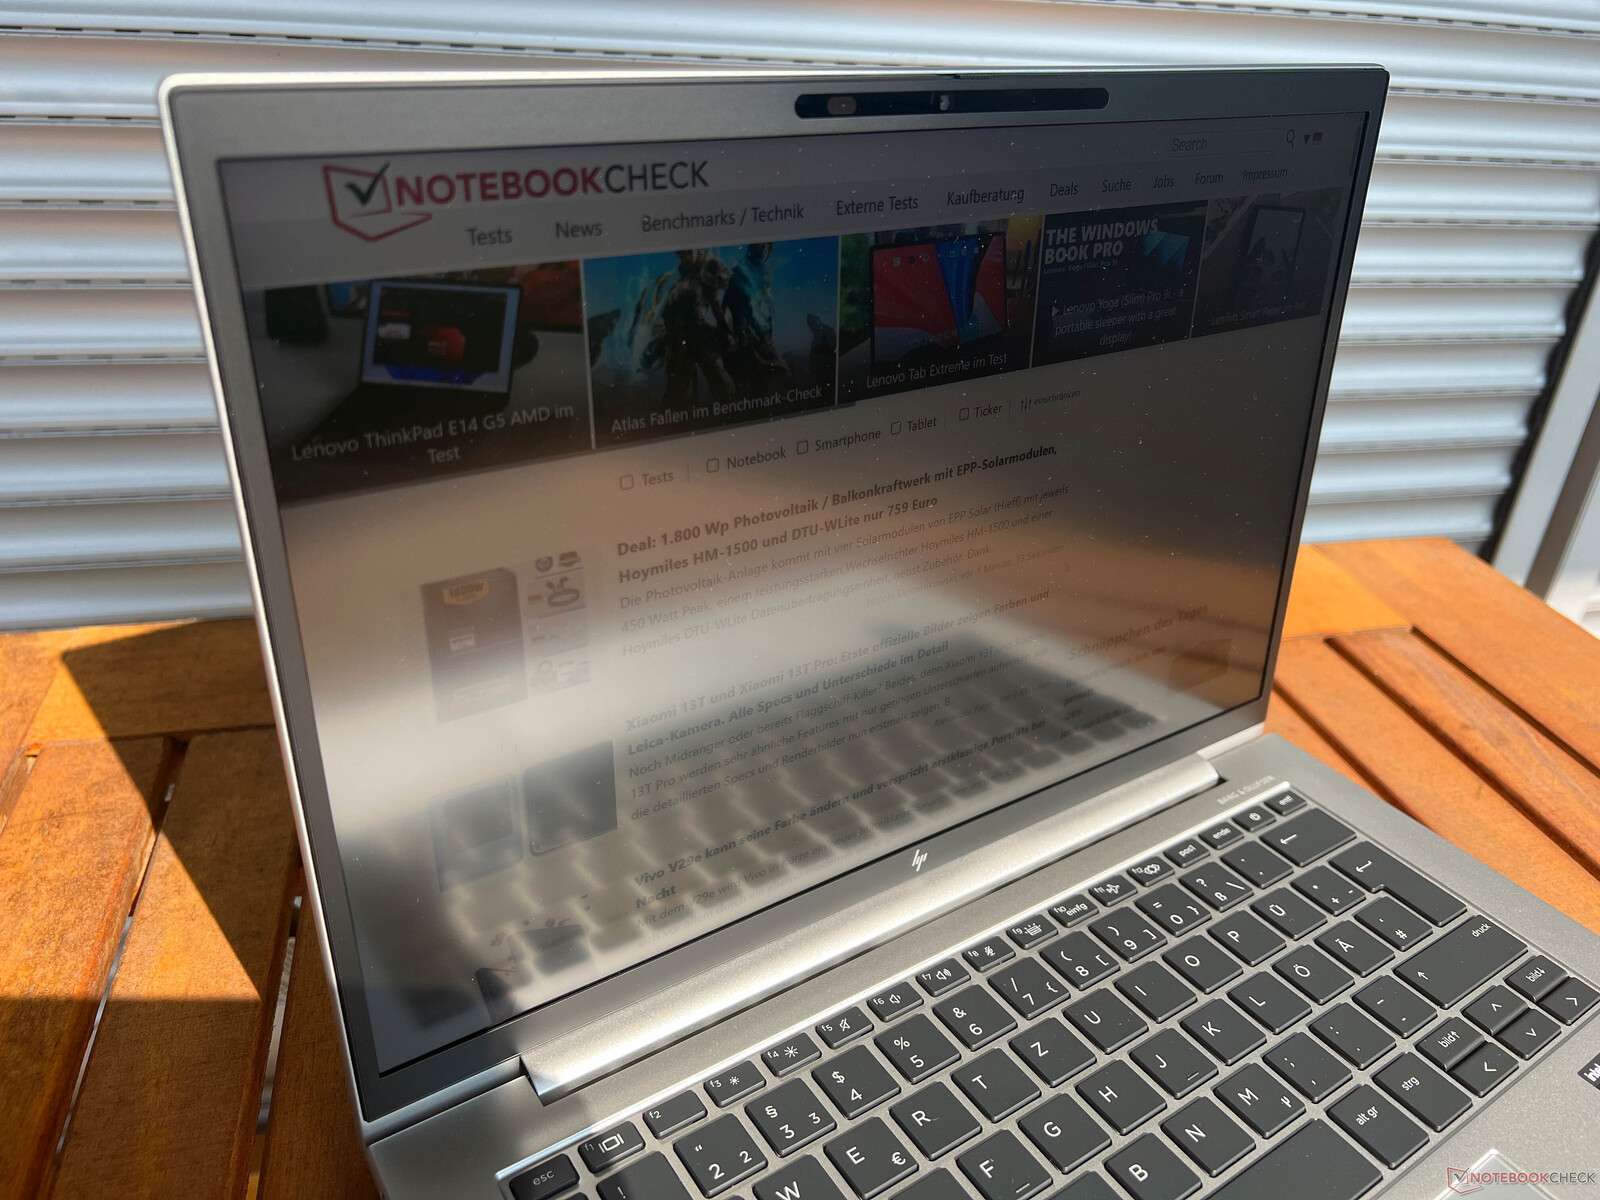
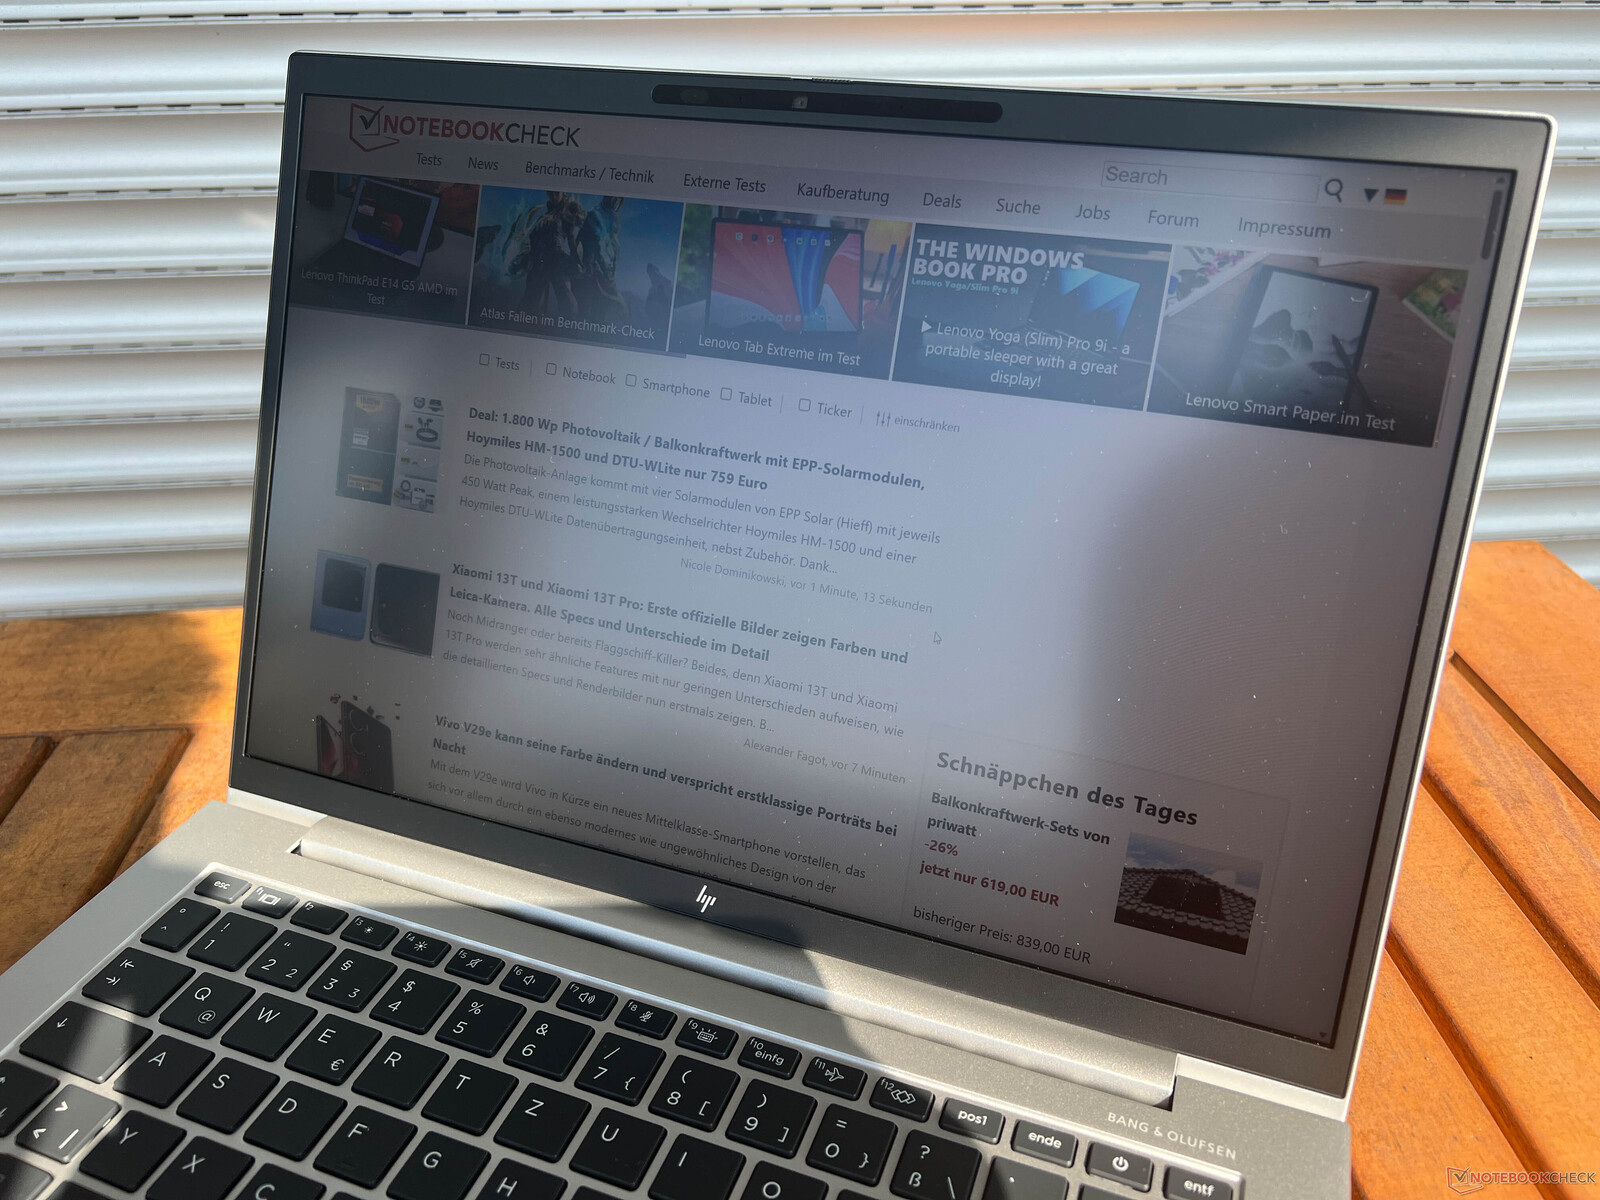
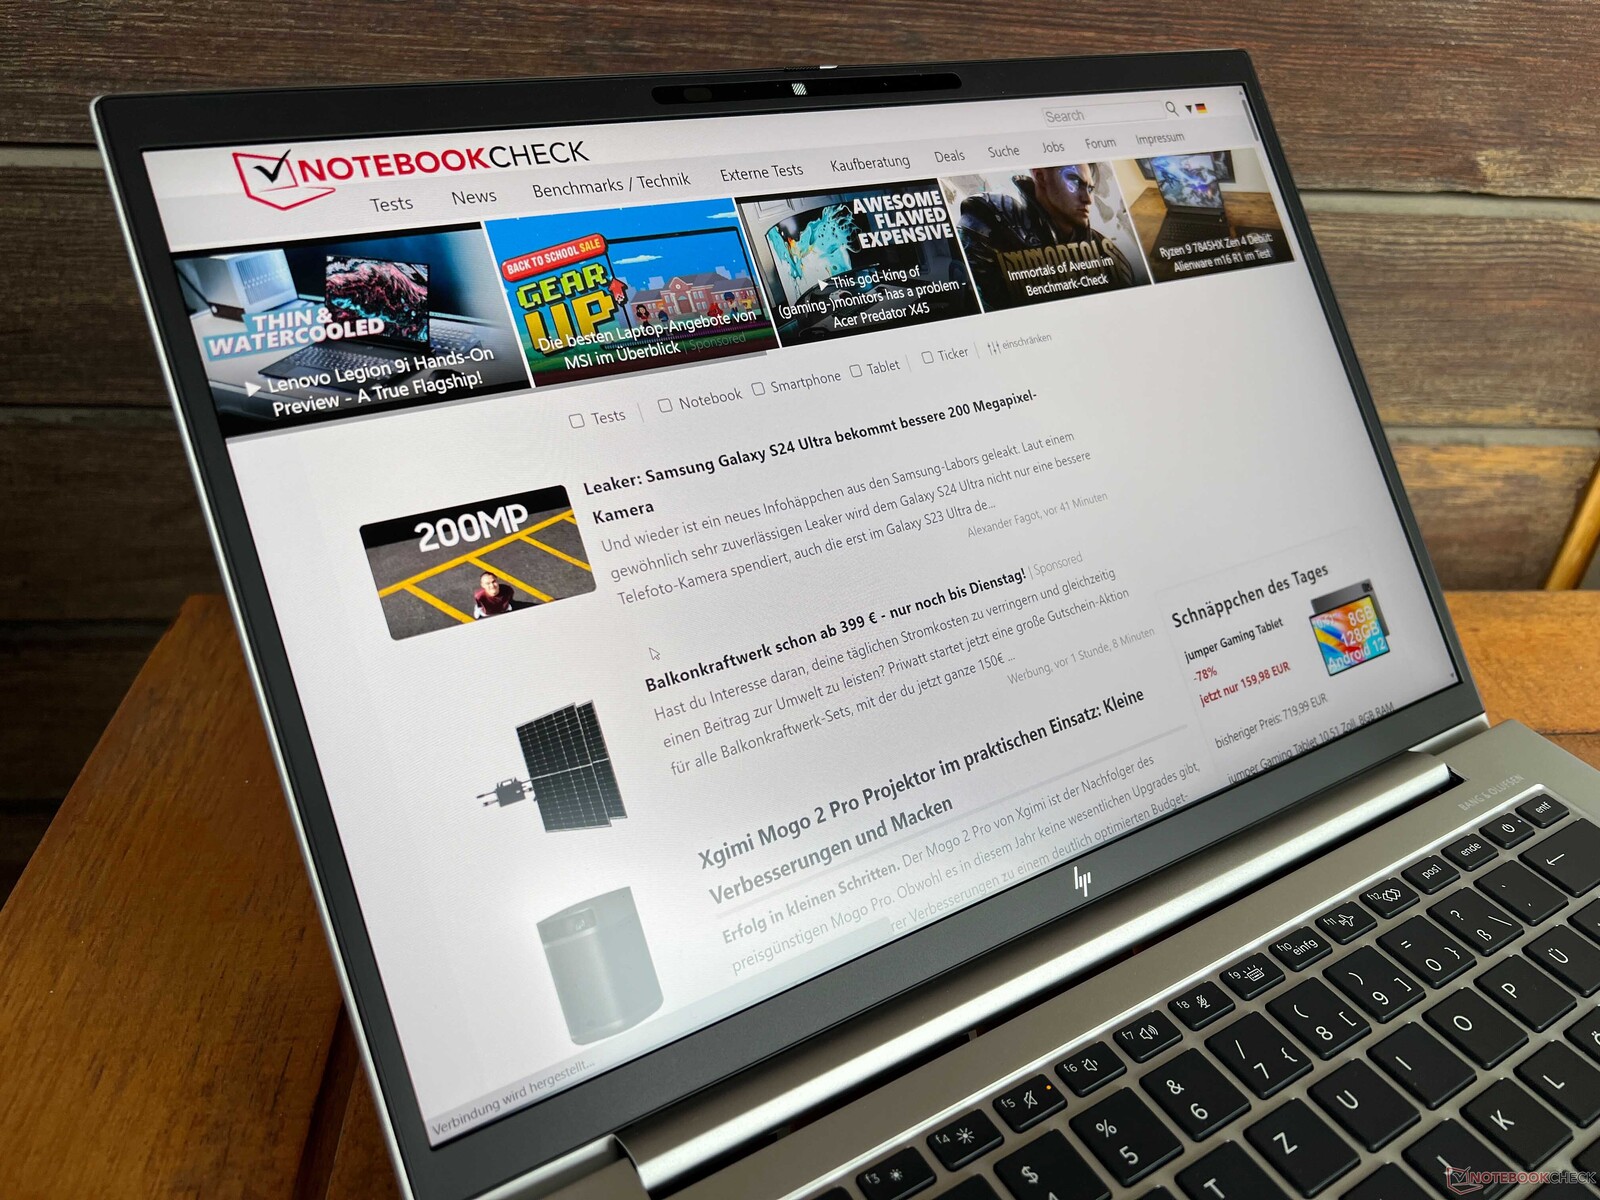
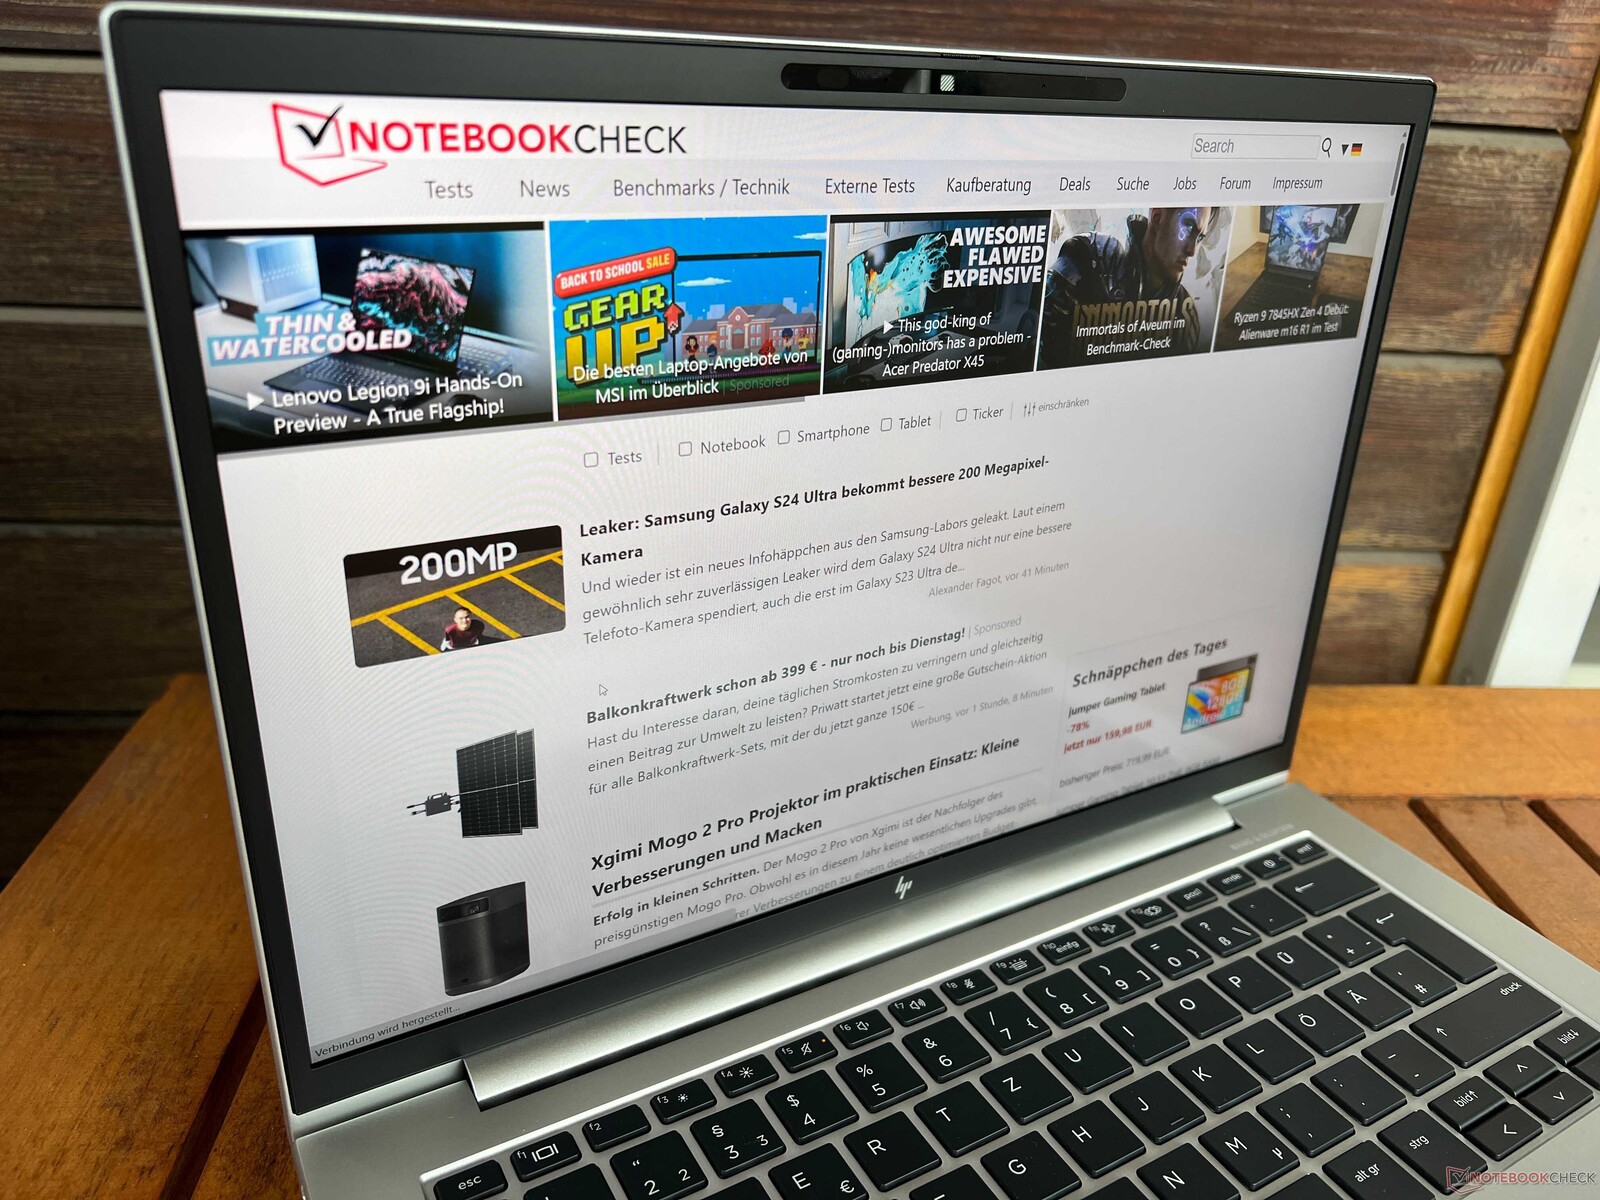
EliteBook 1040 G10 的基本设计与其他 EliteBook(如 845 G10等其他 EliteBook 并无不同。银色的笔记本看起来很优雅,黑色的键盘和深色的显示屏边框形成了很好的对比。尤其是侧面,显示屏边框小得令人舒适,尽管顶部和底部略宽,但没有像其他几款商务竞争产品那样出现摄像头凸起。与 EliteBook 845 G10 的铝制外壳相比,其表面粗糙度很小,温度也略高。但指纹和灰尘在这里也不是大问题。
稳定性非常好,底座和显示屏盖都非常坚硬,不易变形。在直接对比中,我们看不出与 EliteBook 845 G10 有什么不同,因此显示器盖子在合上时也可以按进去。不过,即使我们用很大的力气,仍然无法激起显示屏的任何反应。最大开启角度约为 170 度,中央铰链调节良好。
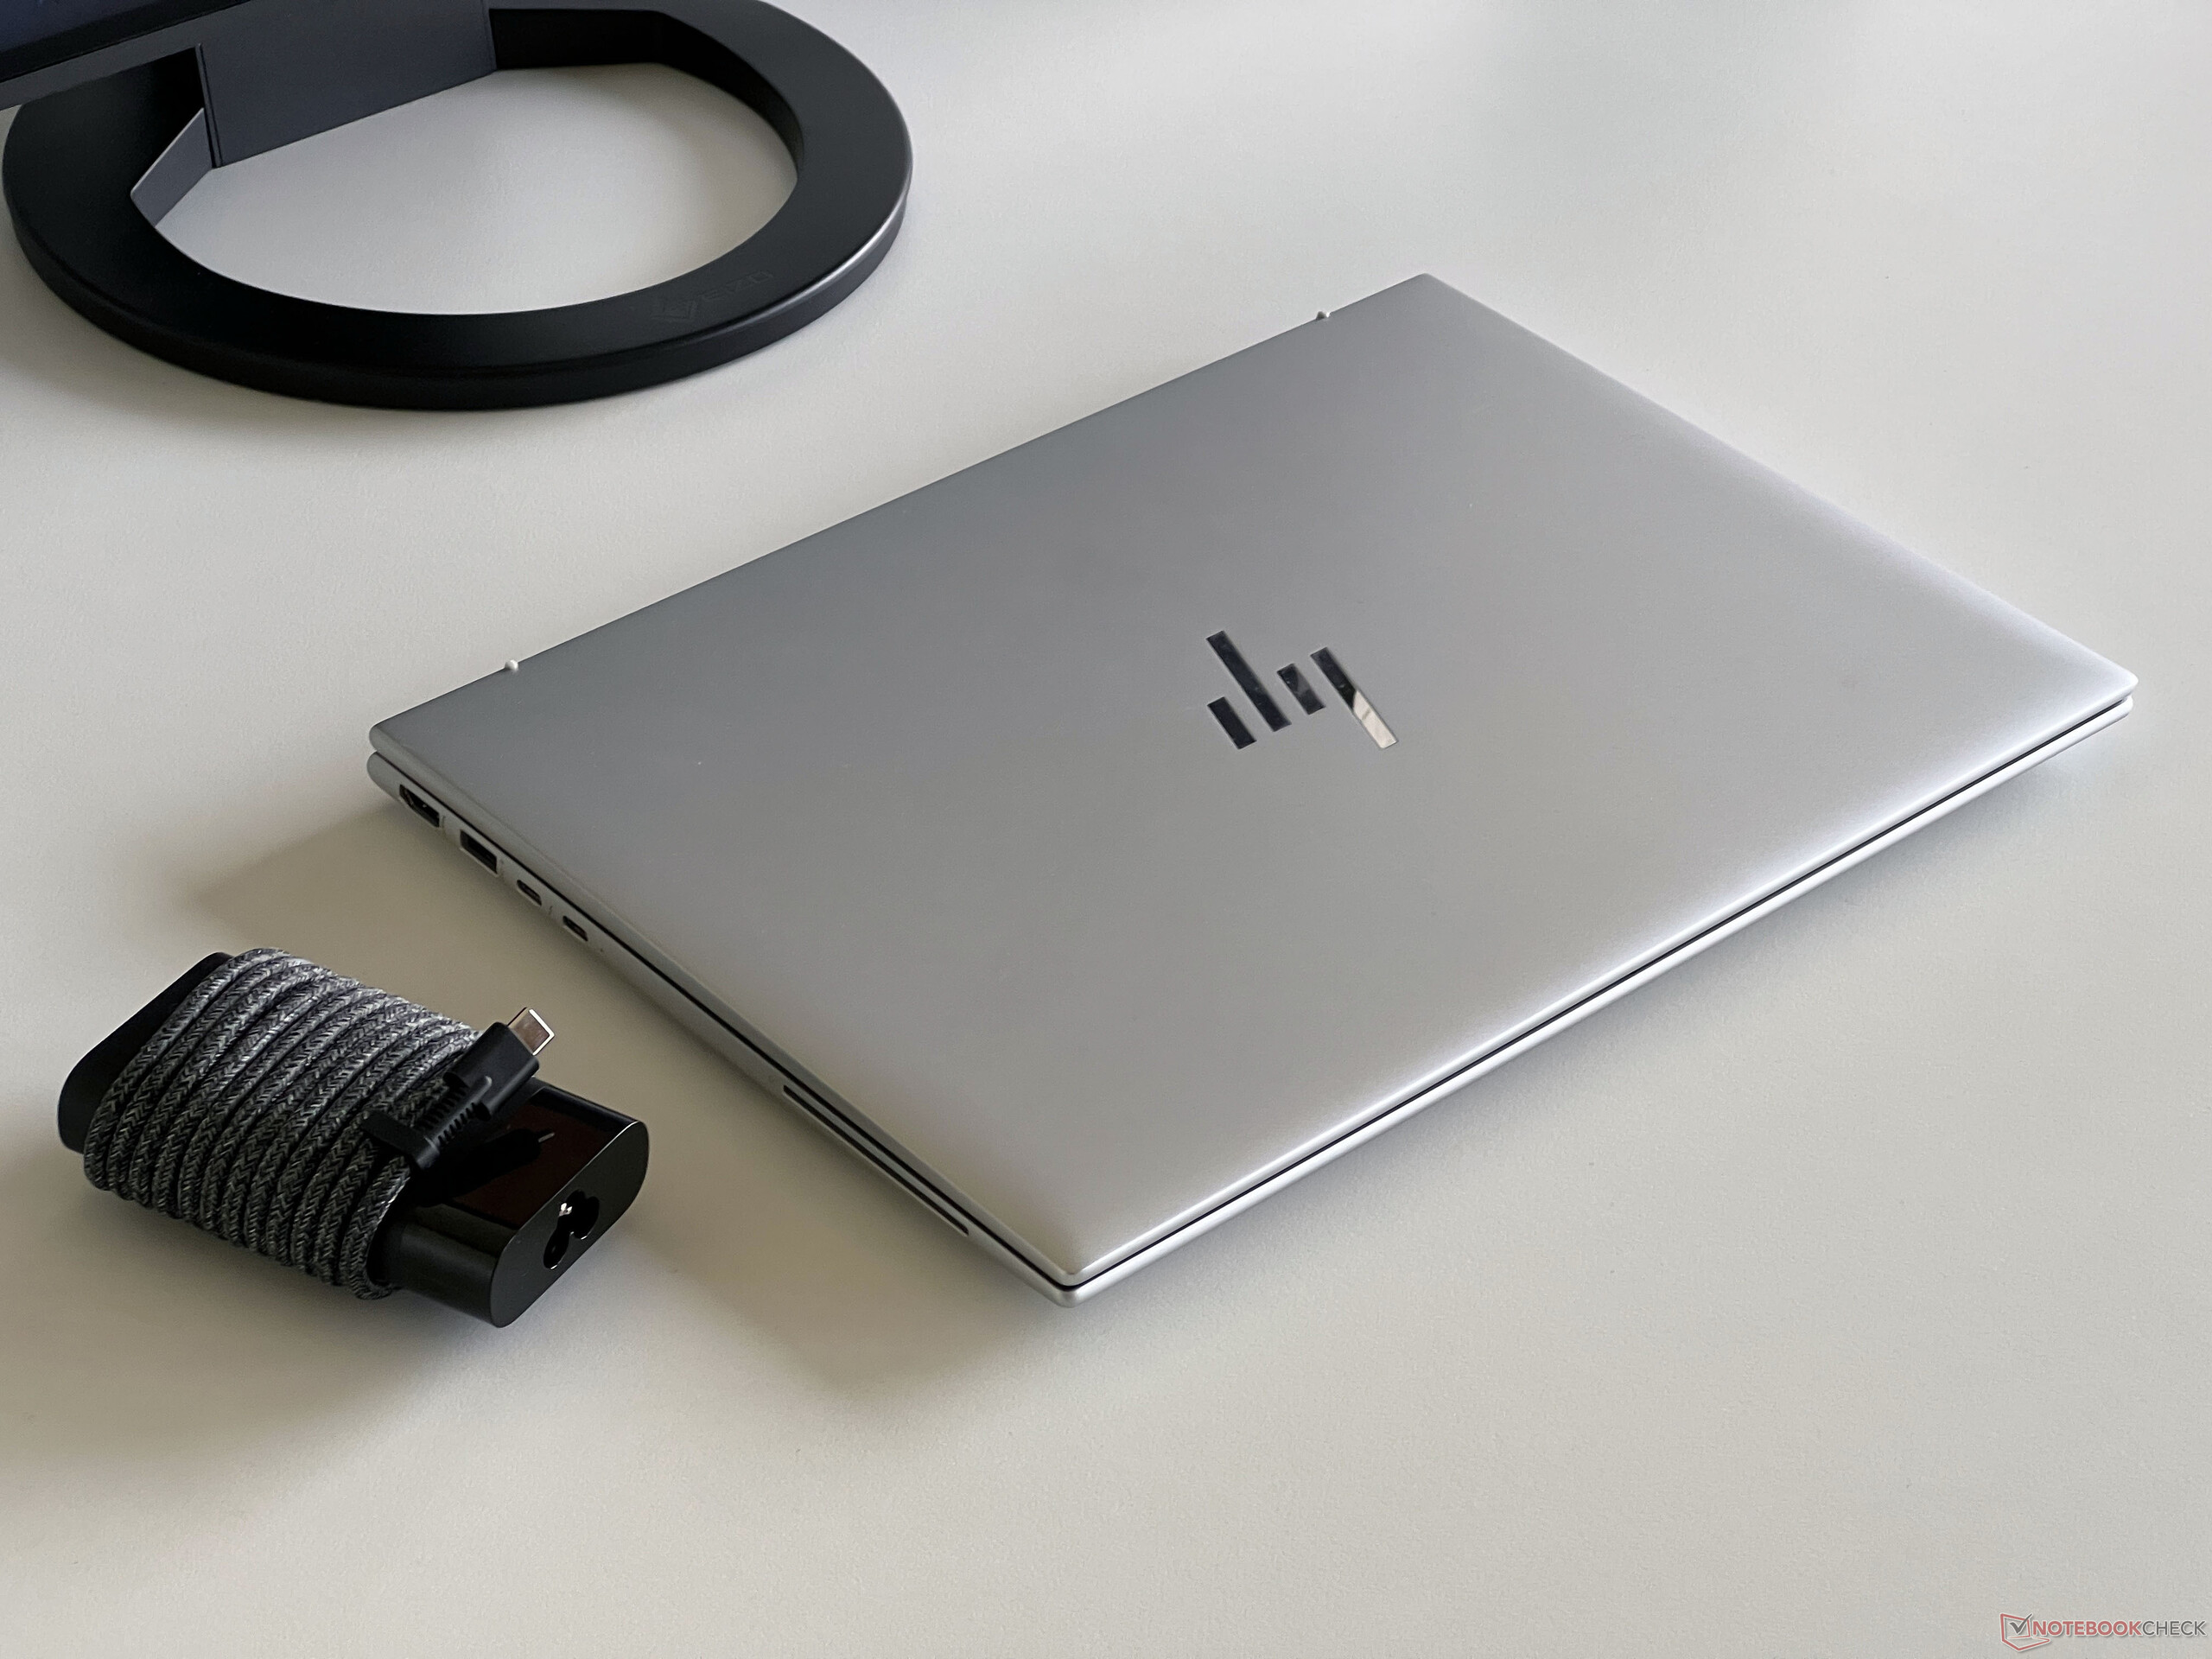
1040 G10 的表壳宽度略小于 845 G10,但深度略大于 845 G10。两个型号的高度相同。但镁合金外壳对重量有积极影响,重量正好是 1.3 千克(约 2.87 磅),比 845 G10 轻约 160 克(约 5.6 盎司)。重量ThinkPad X1 Carbon采用了相同的占地面积,但机身略微纤薄,重量也更轻。附带的充电器几乎又增加了 300 克(约 10.6 盎司)的重量。该笔记本电脑还可选配容量较小的 38 瓦时电池,这样可以减轻约 100 克(约 3.5 盎司)的重量。
设备 - 雷电 4 和 Wi-Fi 6E
EliteBook 1040 G10 的大部分接口都位于机身左侧。两个 USB-C 接口支持 Thunderbolt 4,因此也可用于连接扩展坞。作为一款商务笔记本电脑,该设备还提供一个智能卡读卡器,但没有 SD 卡读卡器。


交流
EliteBook 1040 G10 配备了英特尔(Intel)的现代无线局域网模块(AX211),还支持现代 6 GHz 网络(Wi-Fi 6E)和蓝牙 5.3。在使用华硕参考路由器进行的测试中,传输速率非常高,在测试期间的正常使用(包括一些大型下载)中也完全没有问题。
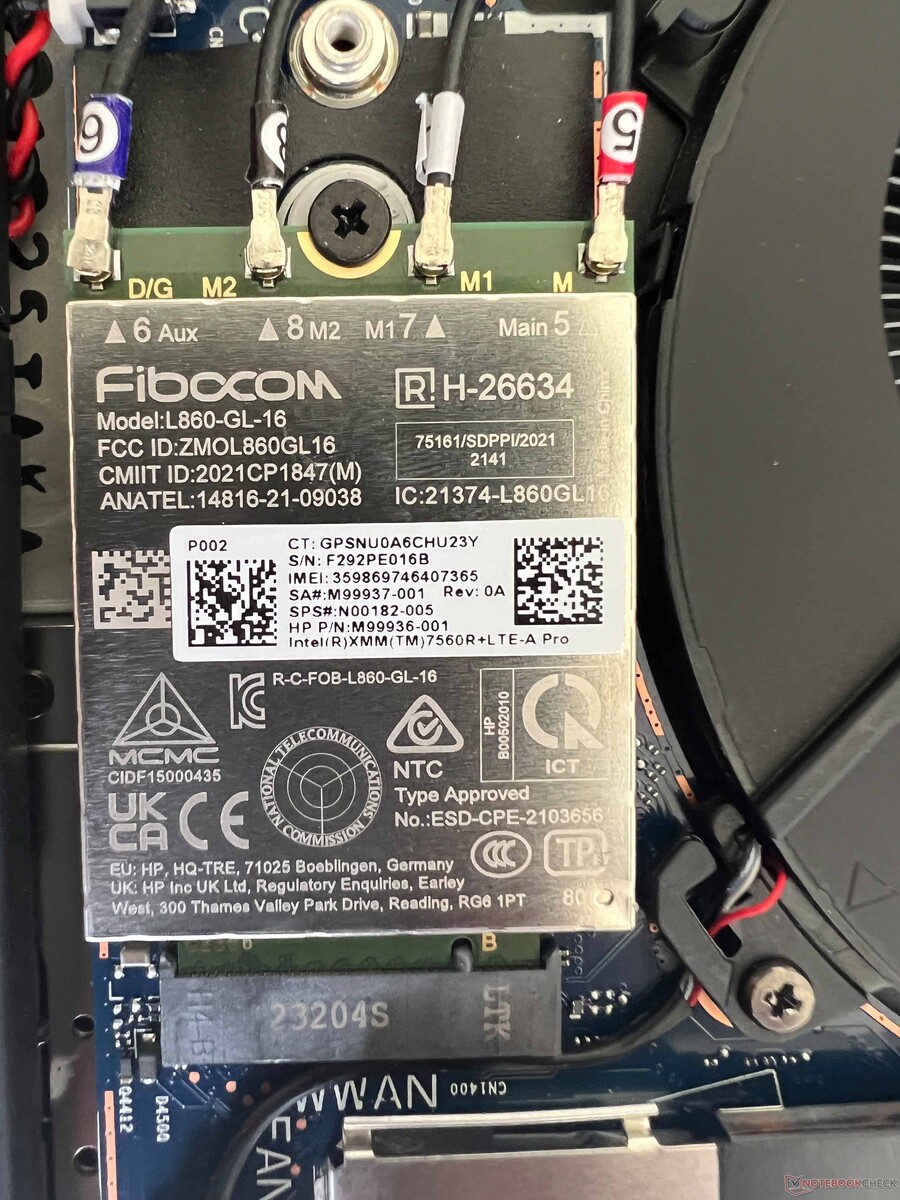
我们的测试机配备了 Fibocom 的 WWAN 模块(860-GL-16),用于 4G/LTE 连接。除了 Nano-SIM 卡,您还可以使用 eSIM 卡,此外,EliteBook 还可以选配英特尔的 5G 模块。
| Networking | |
| HP EliteBook 1040 G10 818N7EA | |
| iperf3 transmit AXE11000 | |
| iperf3 receive AXE11000 | |
| HP EliteBook 845 G10 818N0EA | |
| iperf3 transmit AXE11000 6GHz | |
| iperf3 receive AXE11000 6GHz | |
| Lenovo ThinkPad X1 Carbon G11-21HNS00000 | |
| iperf3 transmit AXE11000 | |
| iperf3 receive AXE11000 | |
| Huawei MateBook X Pro 2023 | |
| iperf3 transmit AXE11000 | |
| iperf3 receive AXE11000 | |
| iperf3 transmit AXE11000 6GHz | |
| iperf3 receive AXE11000 6GHz | |
| Schenker Vision 14 2022 RTX 3050 Ti | |
| iperf3 transmit AXE11000 | |
| iperf3 receive AXE11000 | |
网络摄像头
显示屏边框的顶部边缘装有一个 500 万像素摄像头,可记录清晰的图像,还包括一个机械快门。特别是在图像清晰度方面,与普通的 720p 或 1080p 机型相比有一些明显的优势,而且你也不需要外接网络摄像头就能获得良好的图像质量。此外,还配备了红外摄像头,可以通过 Windows Hello 进行人脸识别。


维护
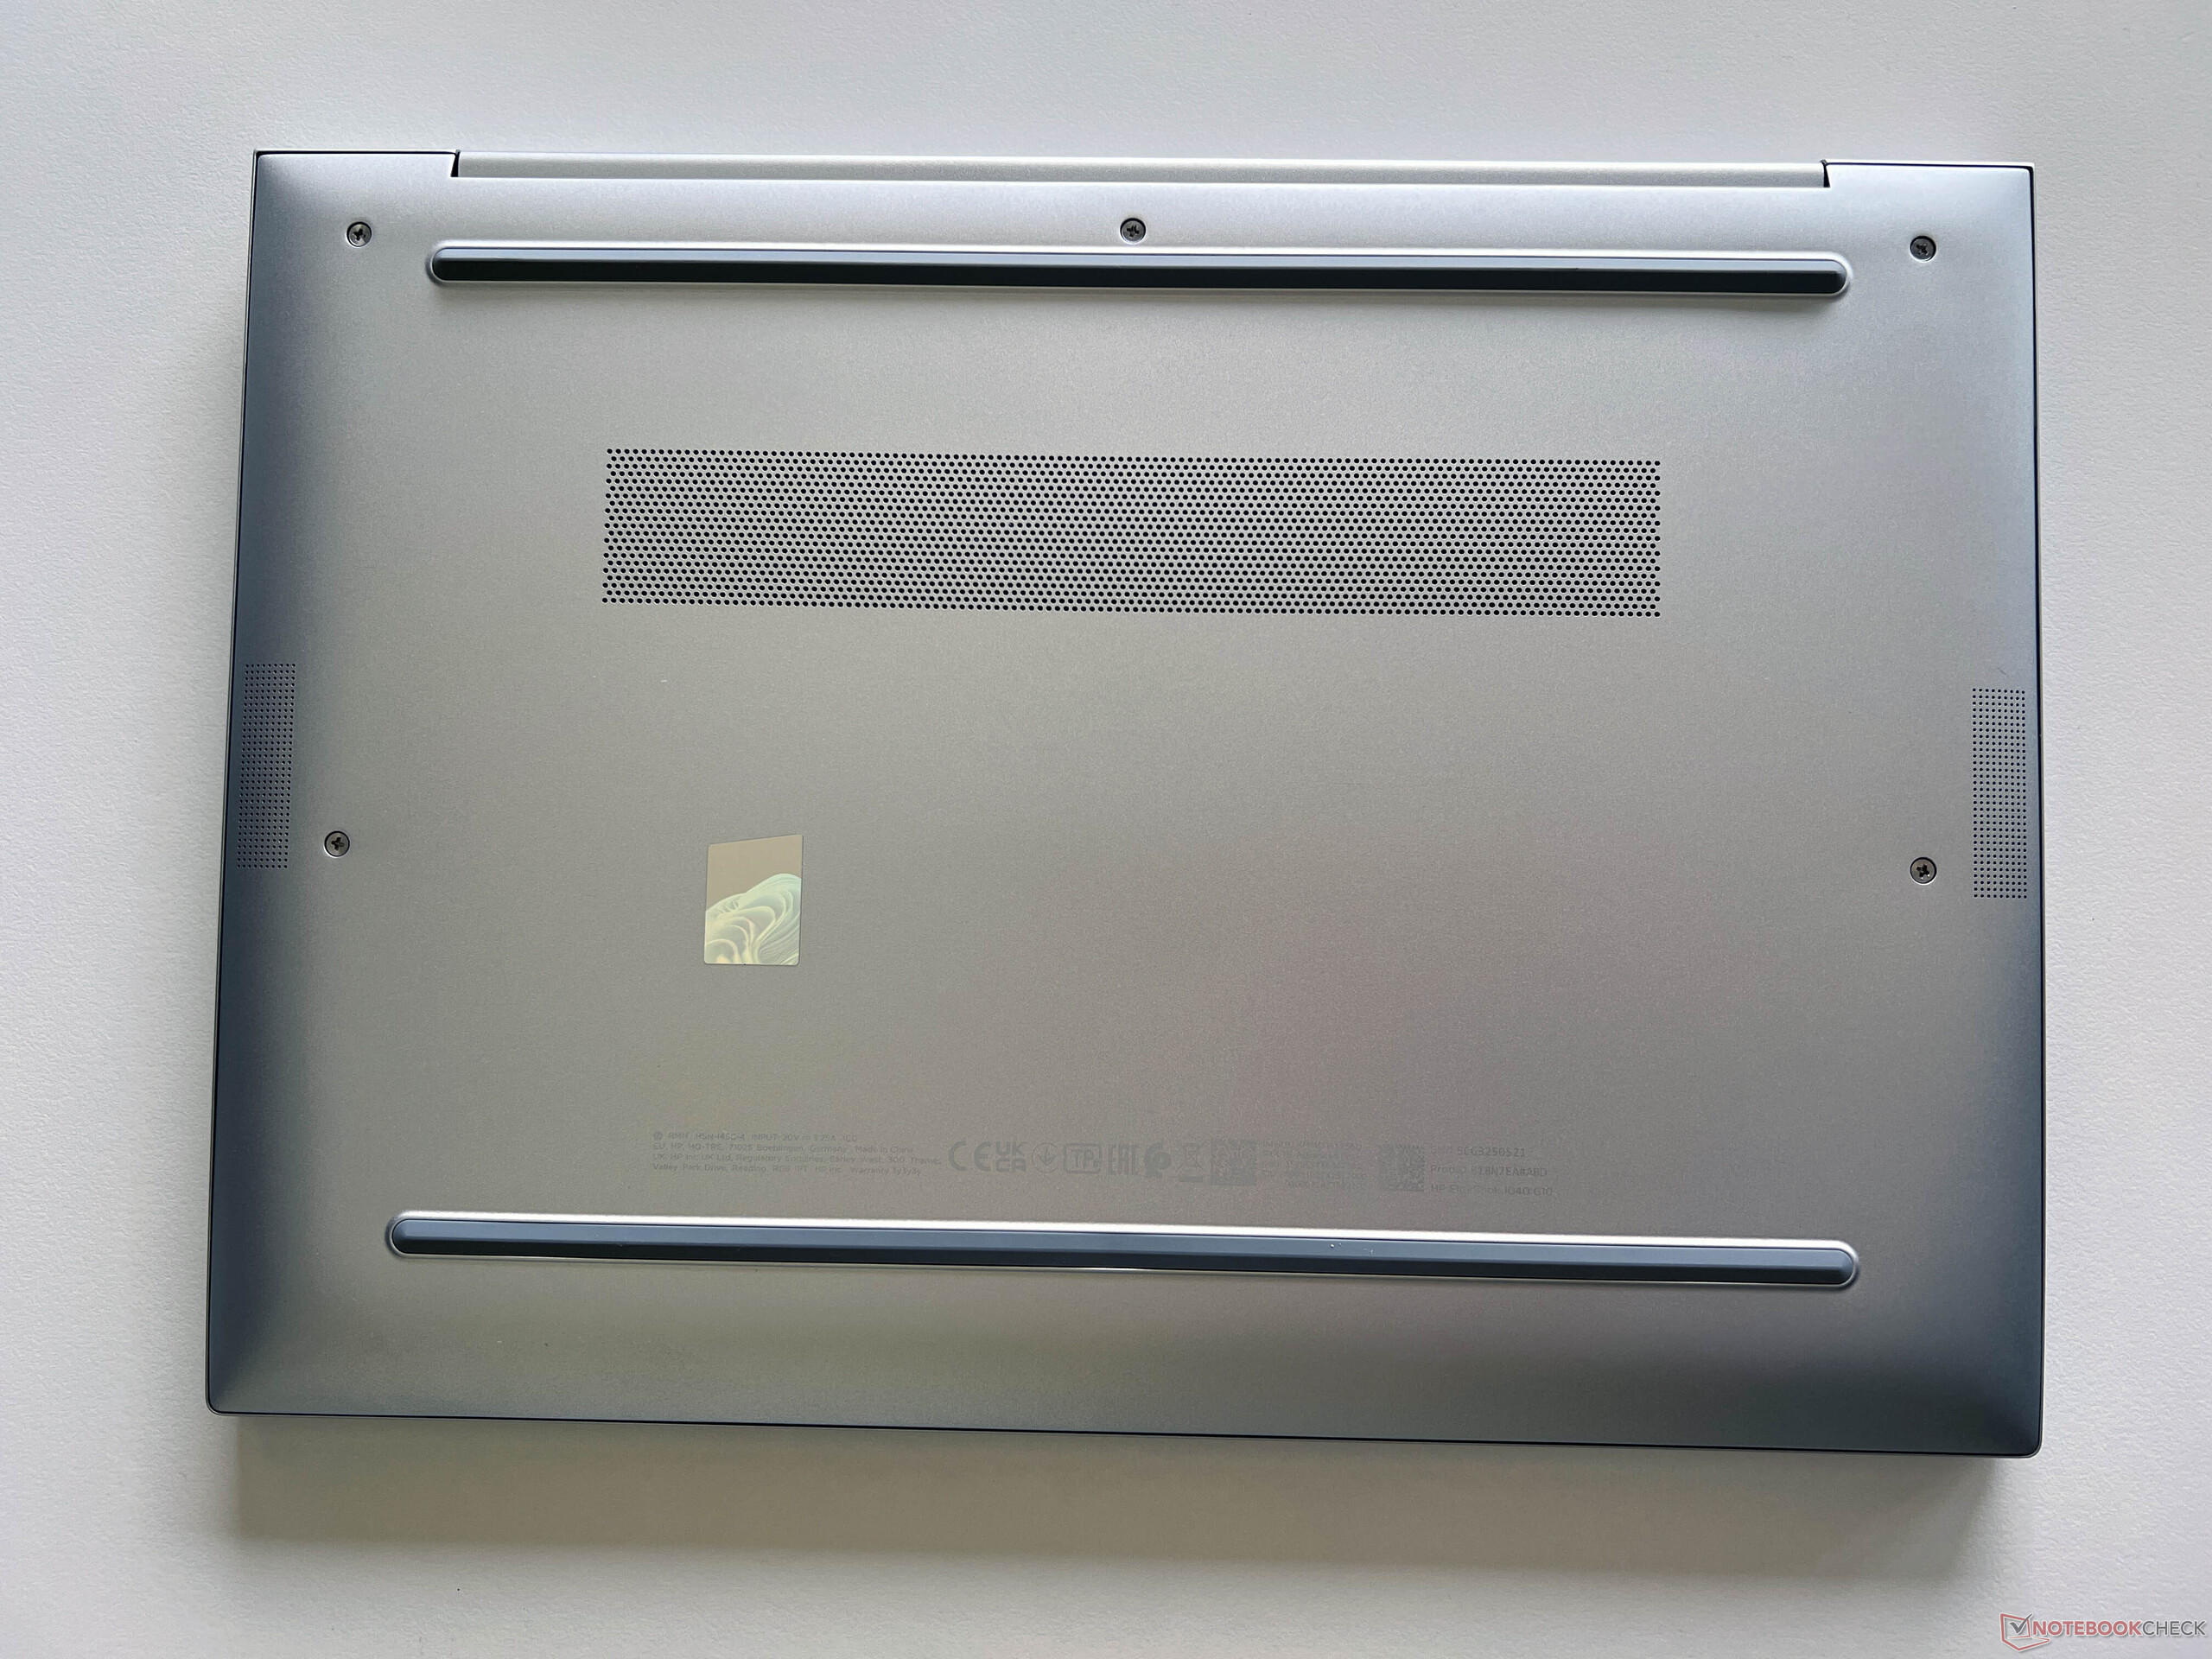
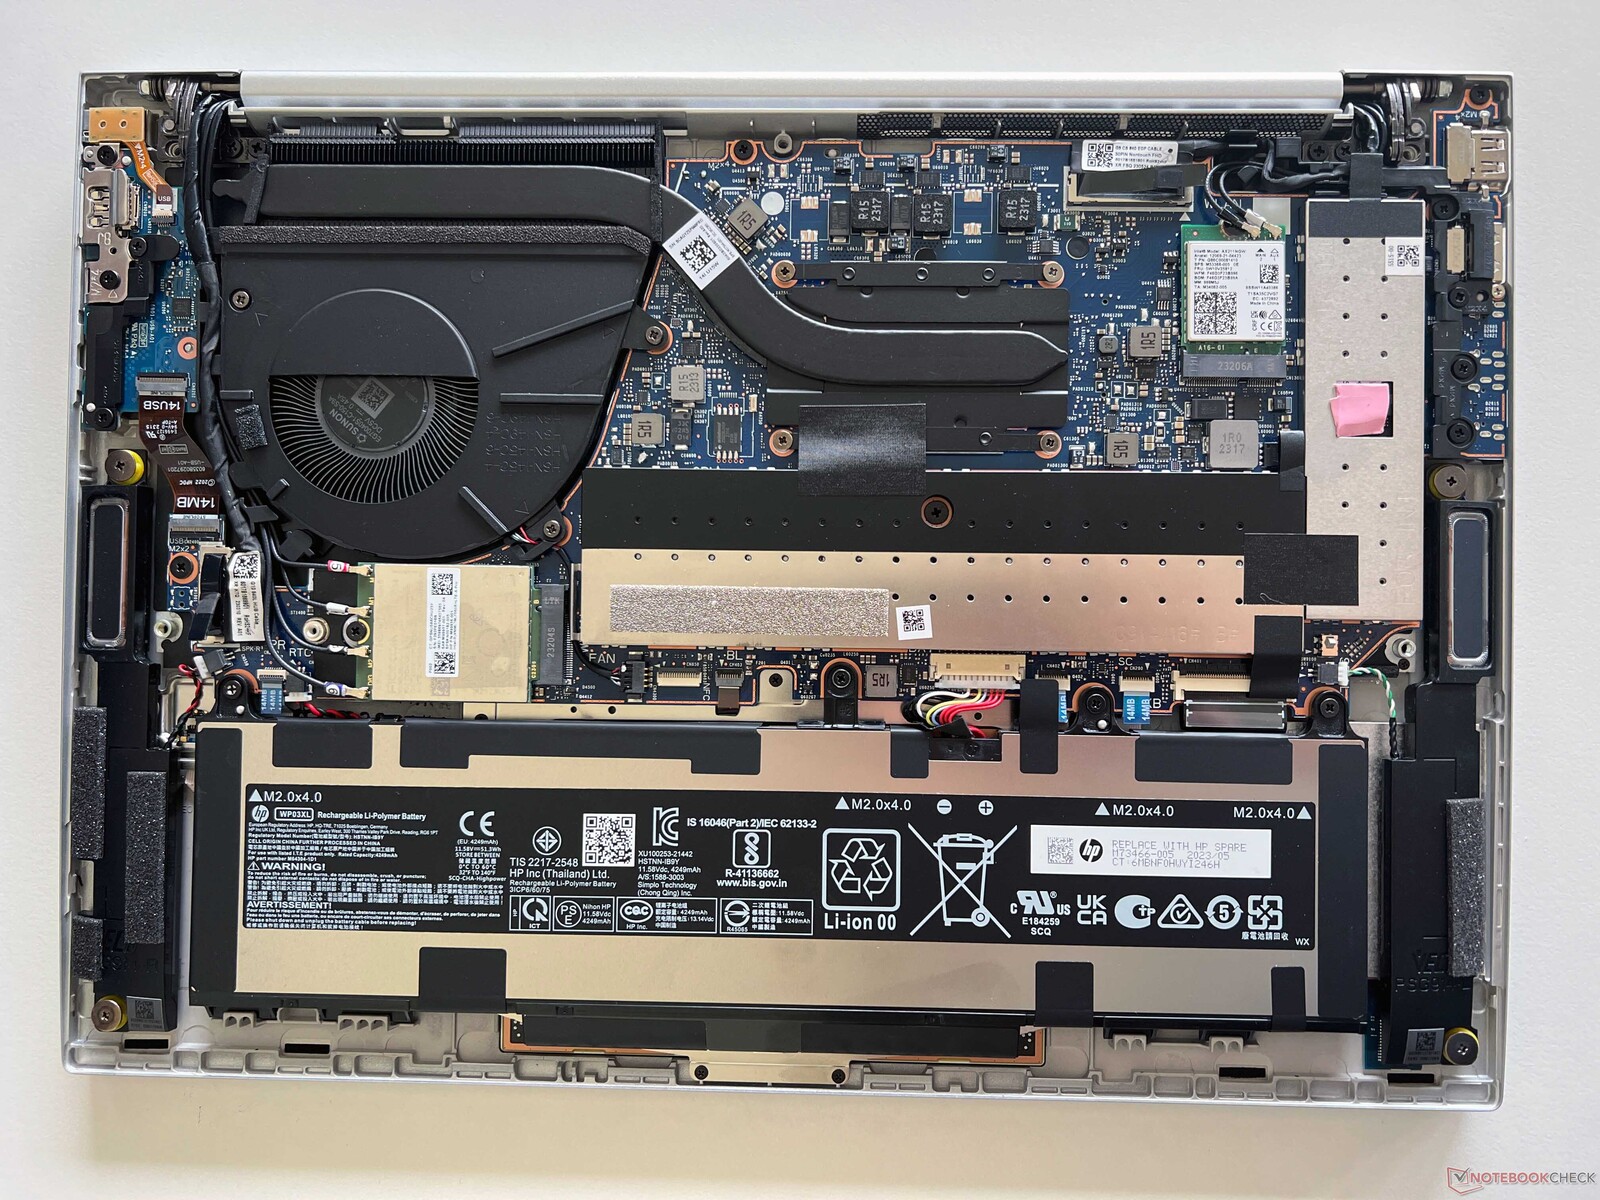
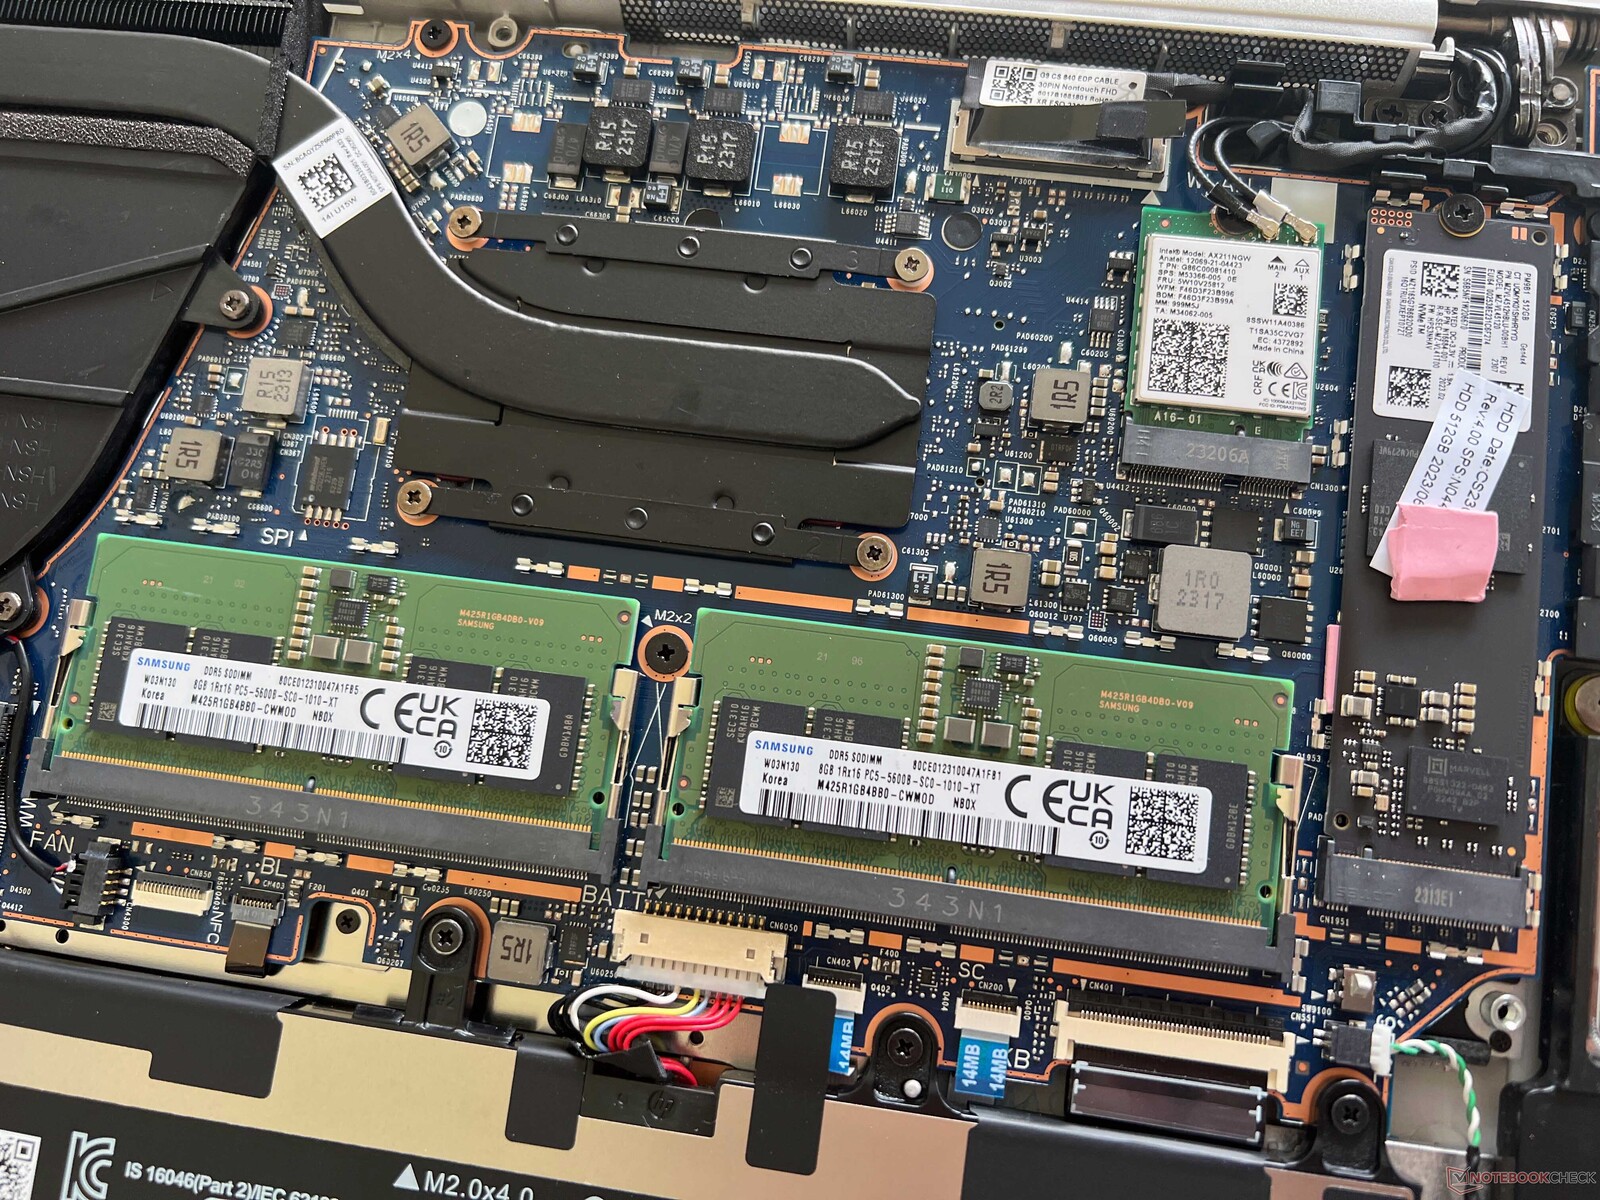
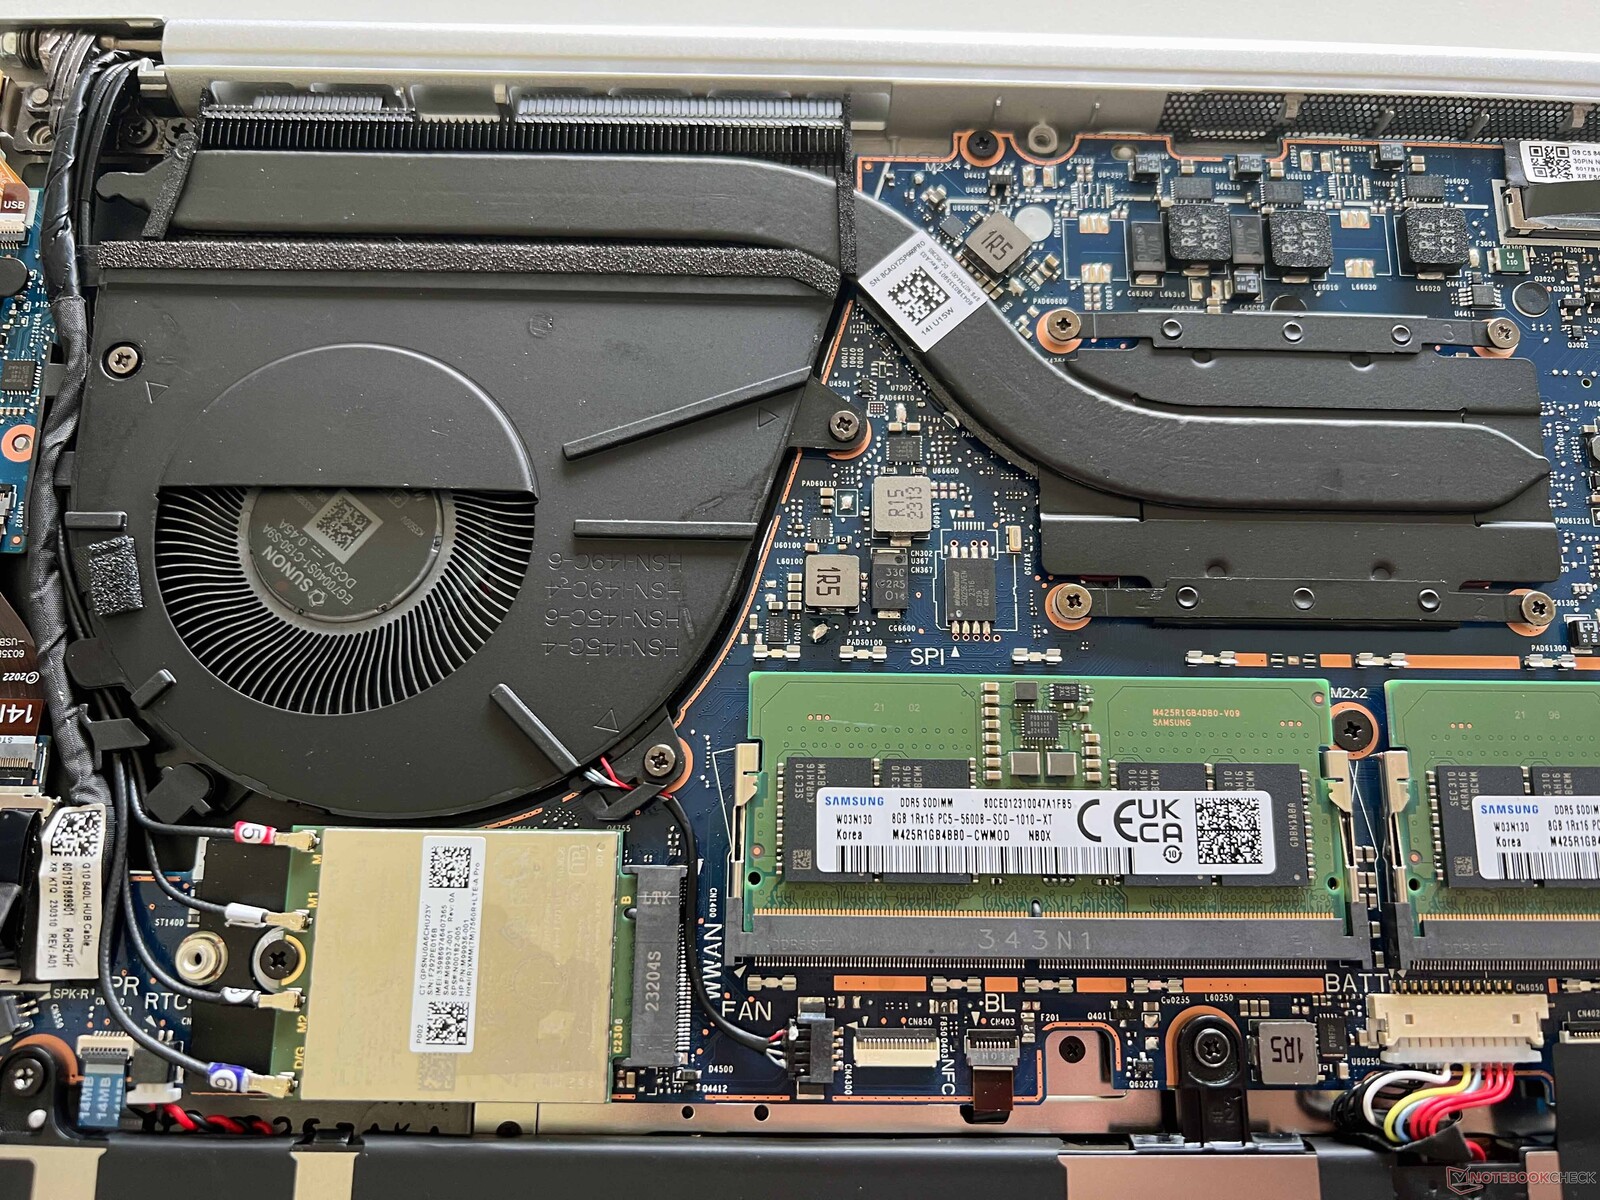
除了几颗飞利浦螺钉外,机箱底部还有几个塑料卡扣,其中一些卡扣固定得非常紧。在机箱内部,你可以看到电池、风扇、两个通信模块、M.2 固态硬盘以及两个工作内存插槽。固态硬盘和内存有一个额外的盖子,但这只是一个插槽,可以轻松取下。总的来说,维护选项还是不错的。
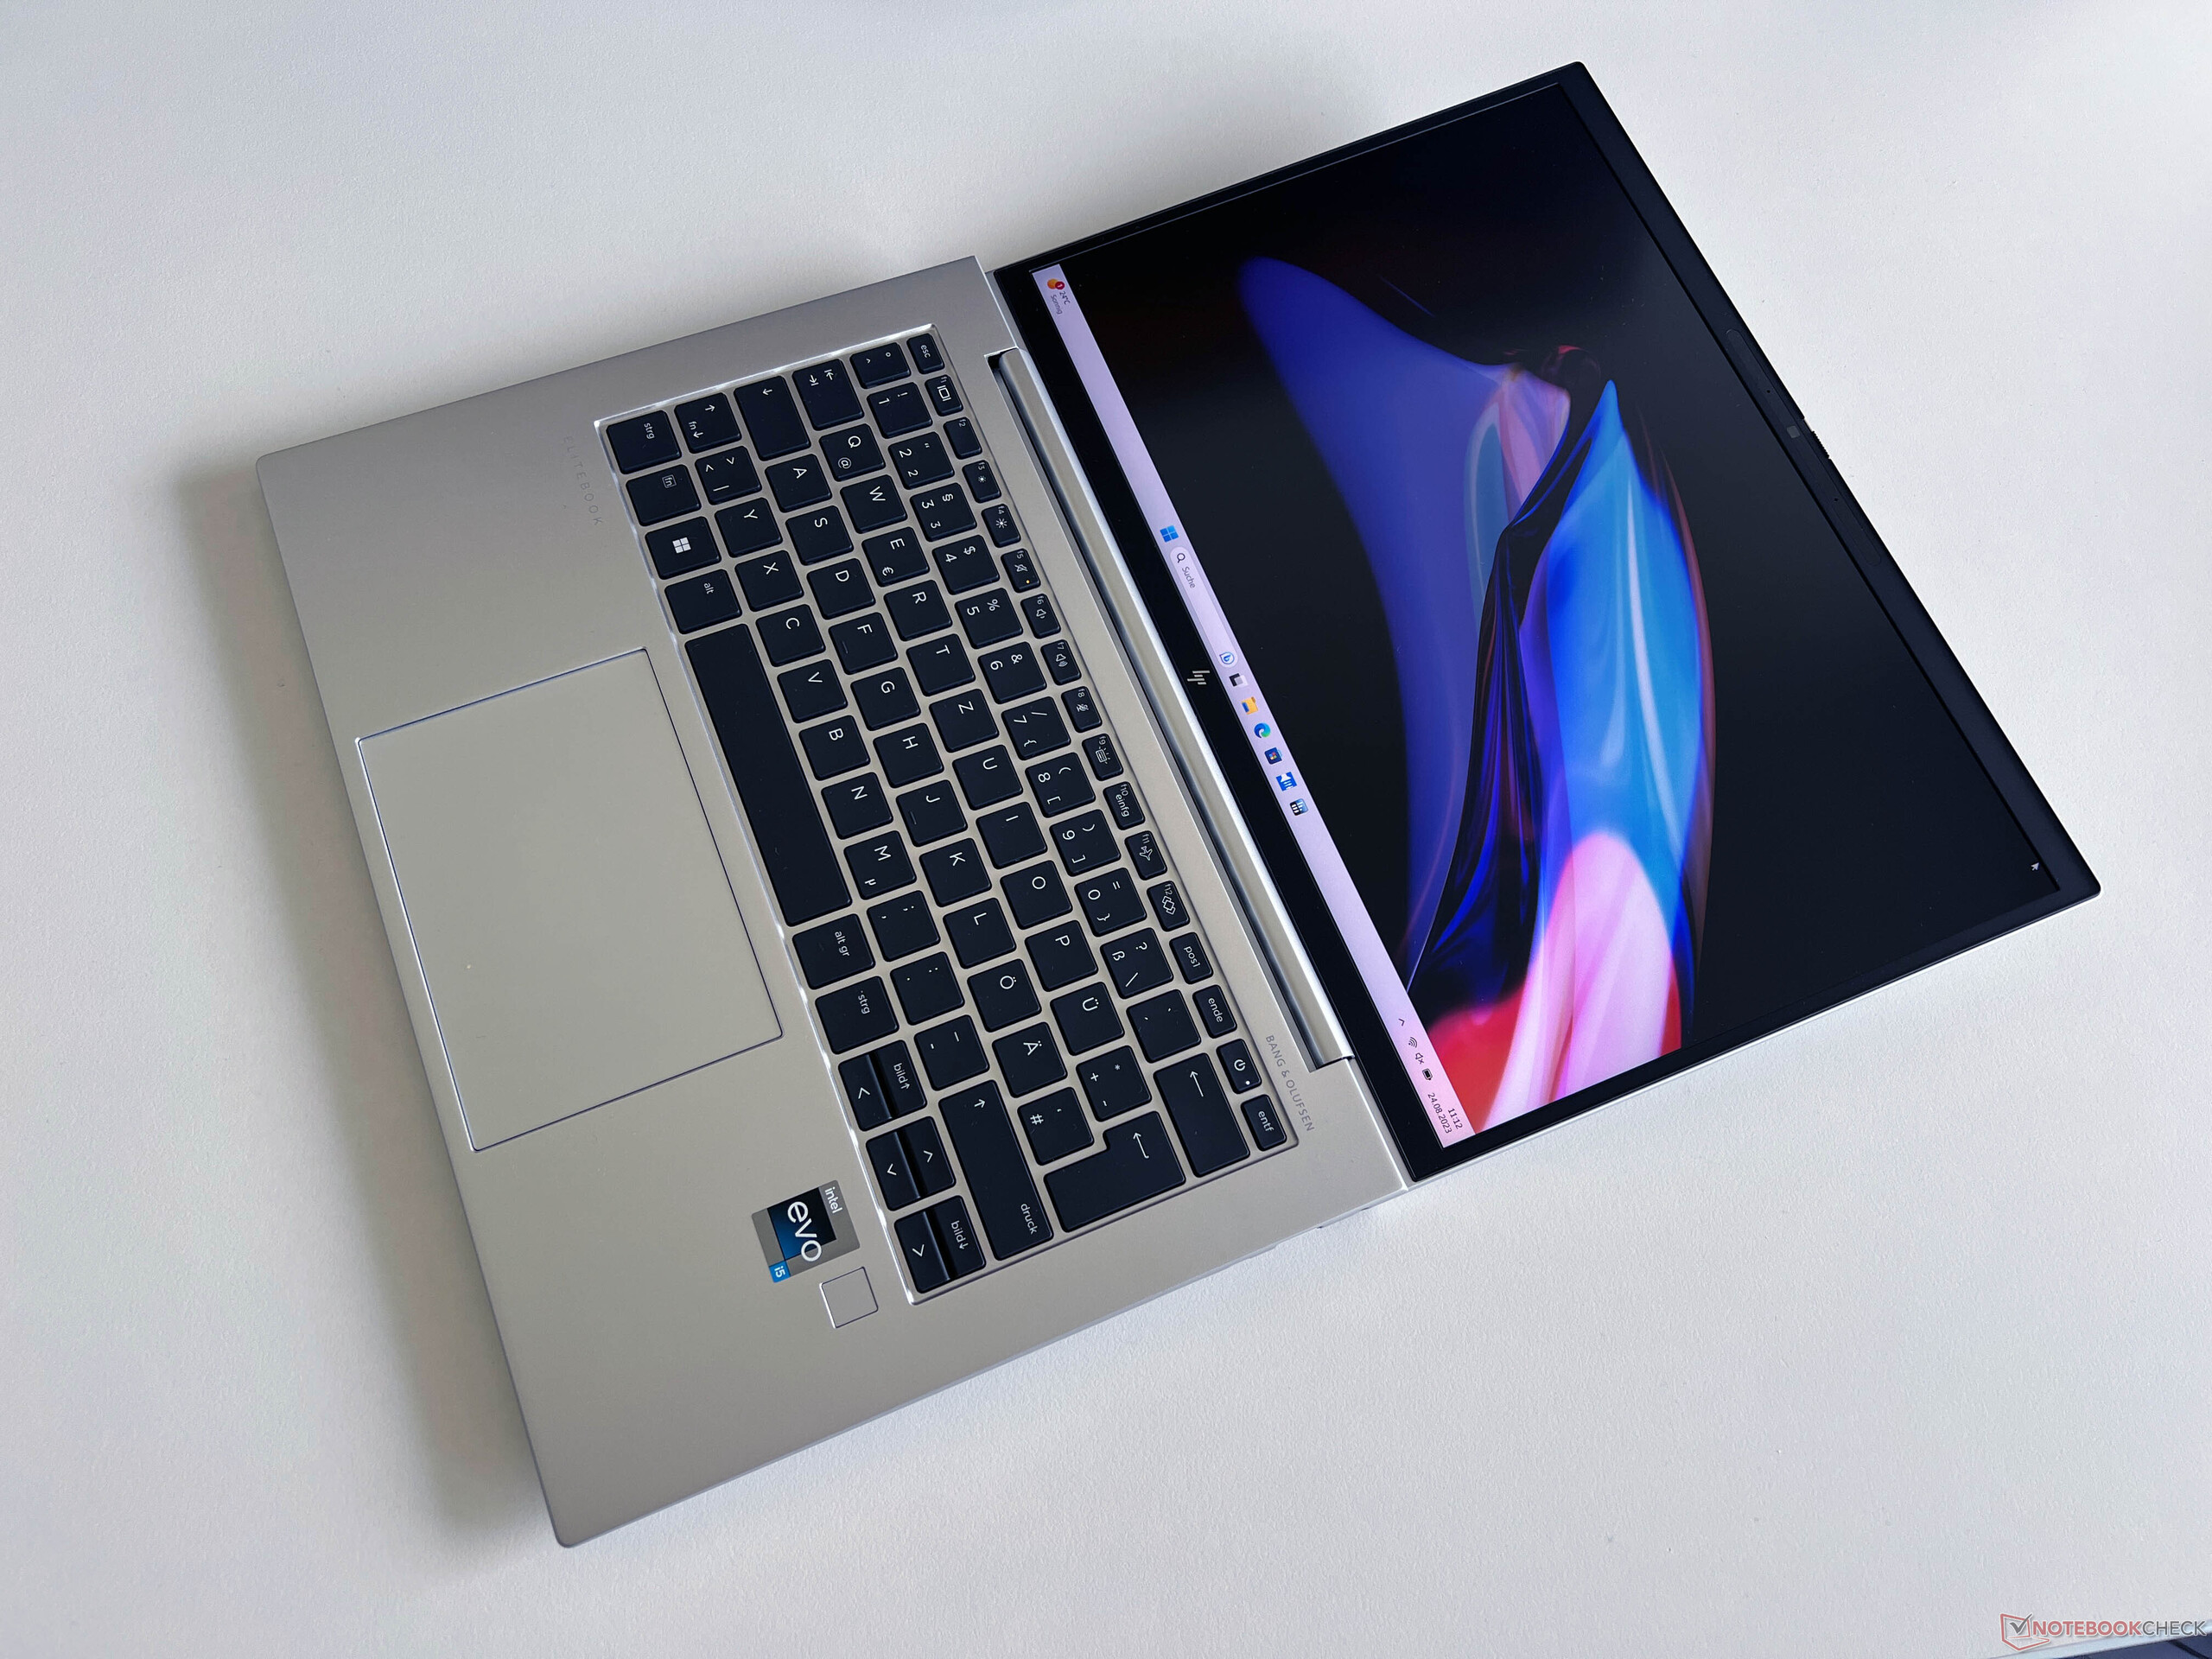
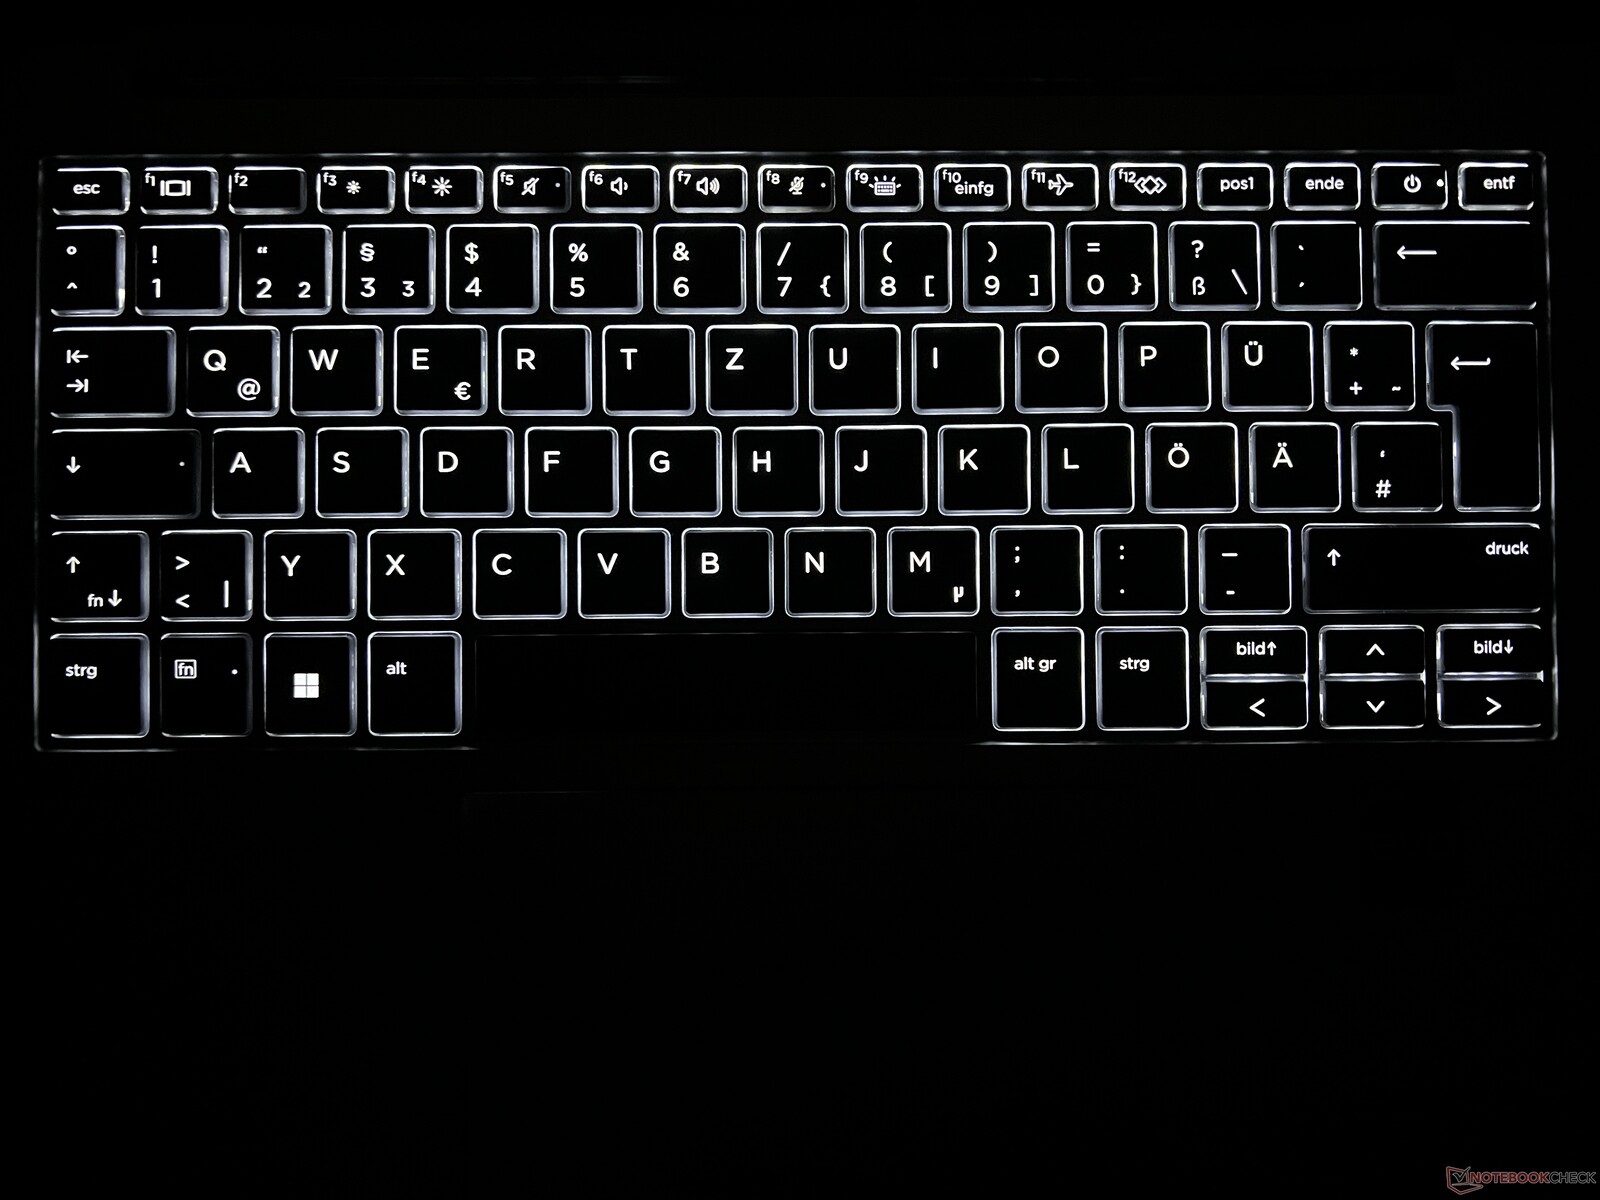
输入设备 - 惠普使用非常出色的键盘
惠普使用的发光 Chiclet 键盘可提供非常舒适的输入体验。在 EliteBook 845 G10的键盘一样,键程非常精确,也不会太短。与ThinkPad X1 Carbon G11 的键盘相比相比,EliteBook 845 G10 的键盘特性非常相似,但我们更喜欢 EliteBook 的键盘。键盘布局没有任何惊喜,只有右上角的方向键和集成电源按钮不太理想。指纹扫描仪位于键盘右下方。
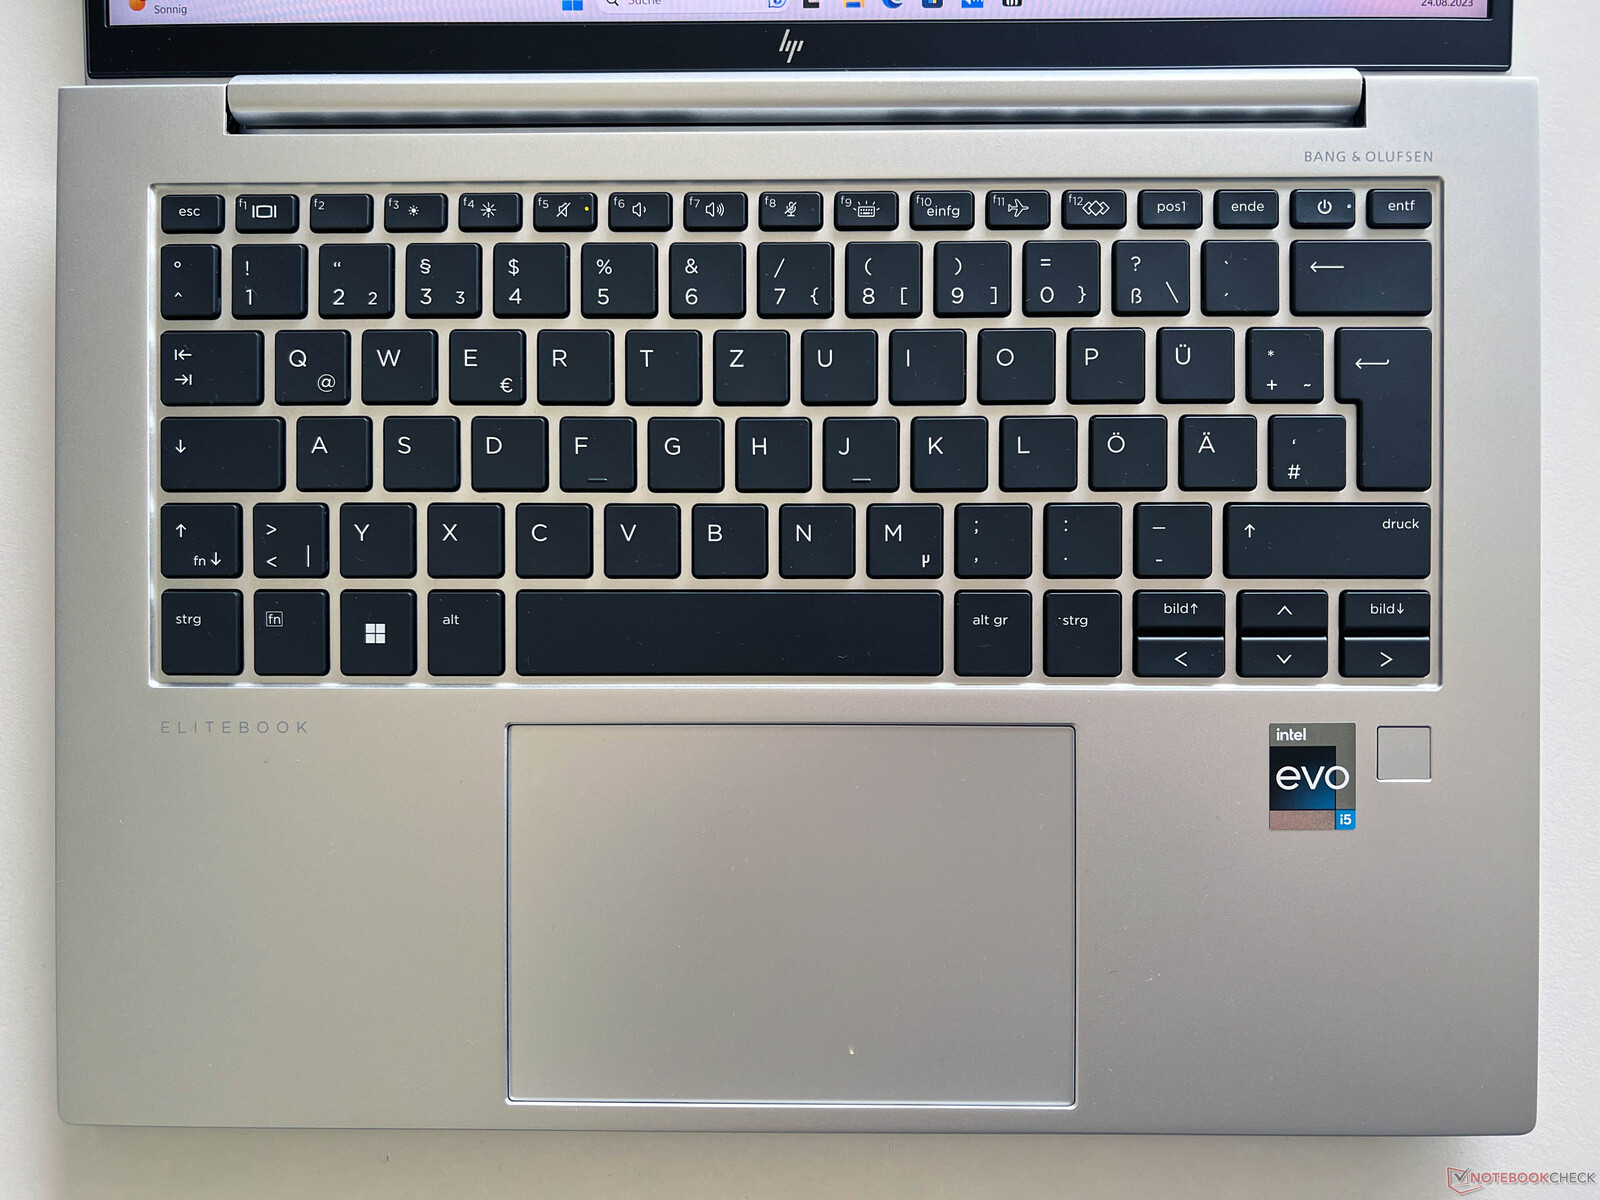
惠普已经有一段时间没有在其业务模式中加入点读棒了,但 ClickPad 的使用效果非常好。它的尺寸为 12 x 8 厘米(约 4.7 x 3.1 英寸),足够大,而且滑动特性非常好。在测试过程中,我们没有遇到任何指针移动或手势(最多使用四个手指)方面的问题。您还可以点击键盘的下半部分,产生的低沉咔嗒声给人一种高品质的印象。
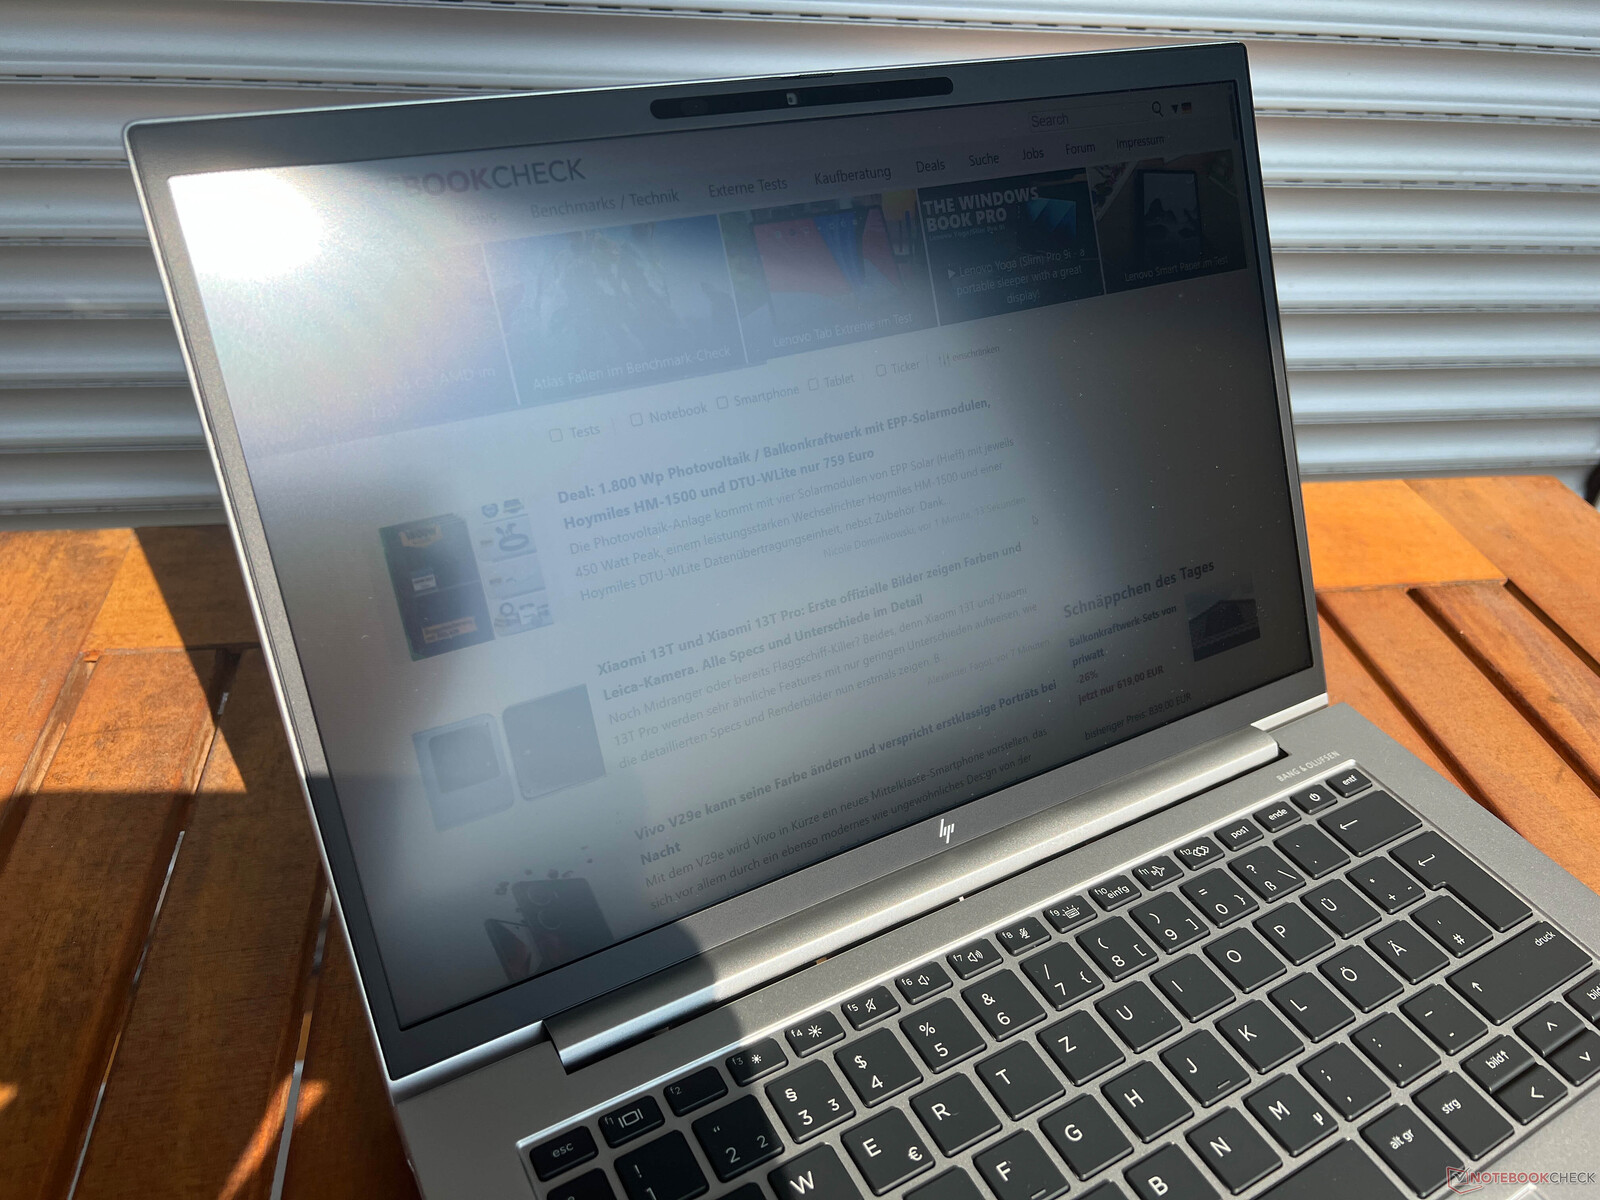
显示屏 - 低功耗显示屏不够亮
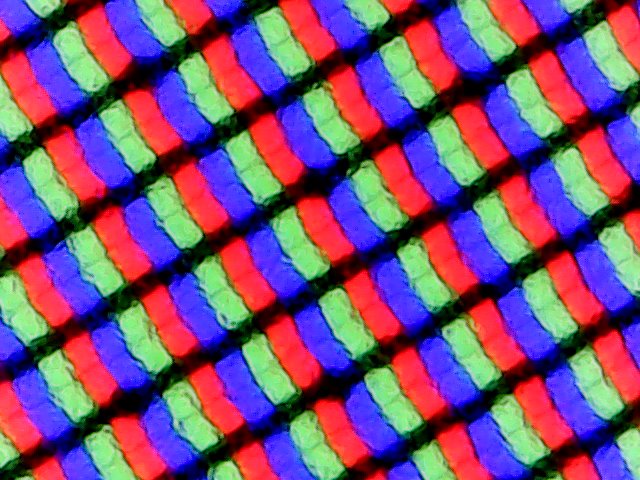
惠普为 EliteBook 提供了多种显示屏,从 250 尼特 IPS 显示屏到 1000 cd/m² 的 SureView 面板(包括集成的隐私滤镜),不过由于主观图像质量较差,我们并不推荐使用这种显示屏。我们的测试机使用的是哑光低功耗 FHD 面板(1,920 x 1,200 像素,16:10),标称亮度为 400 cd/m²。主观图像质量不错,因为显示的内容足够清晰,即使是明亮的内容也没有颗粒感,不过色彩还可以再鲜艳一些。亮度和色温均可通过传感器自动调节。
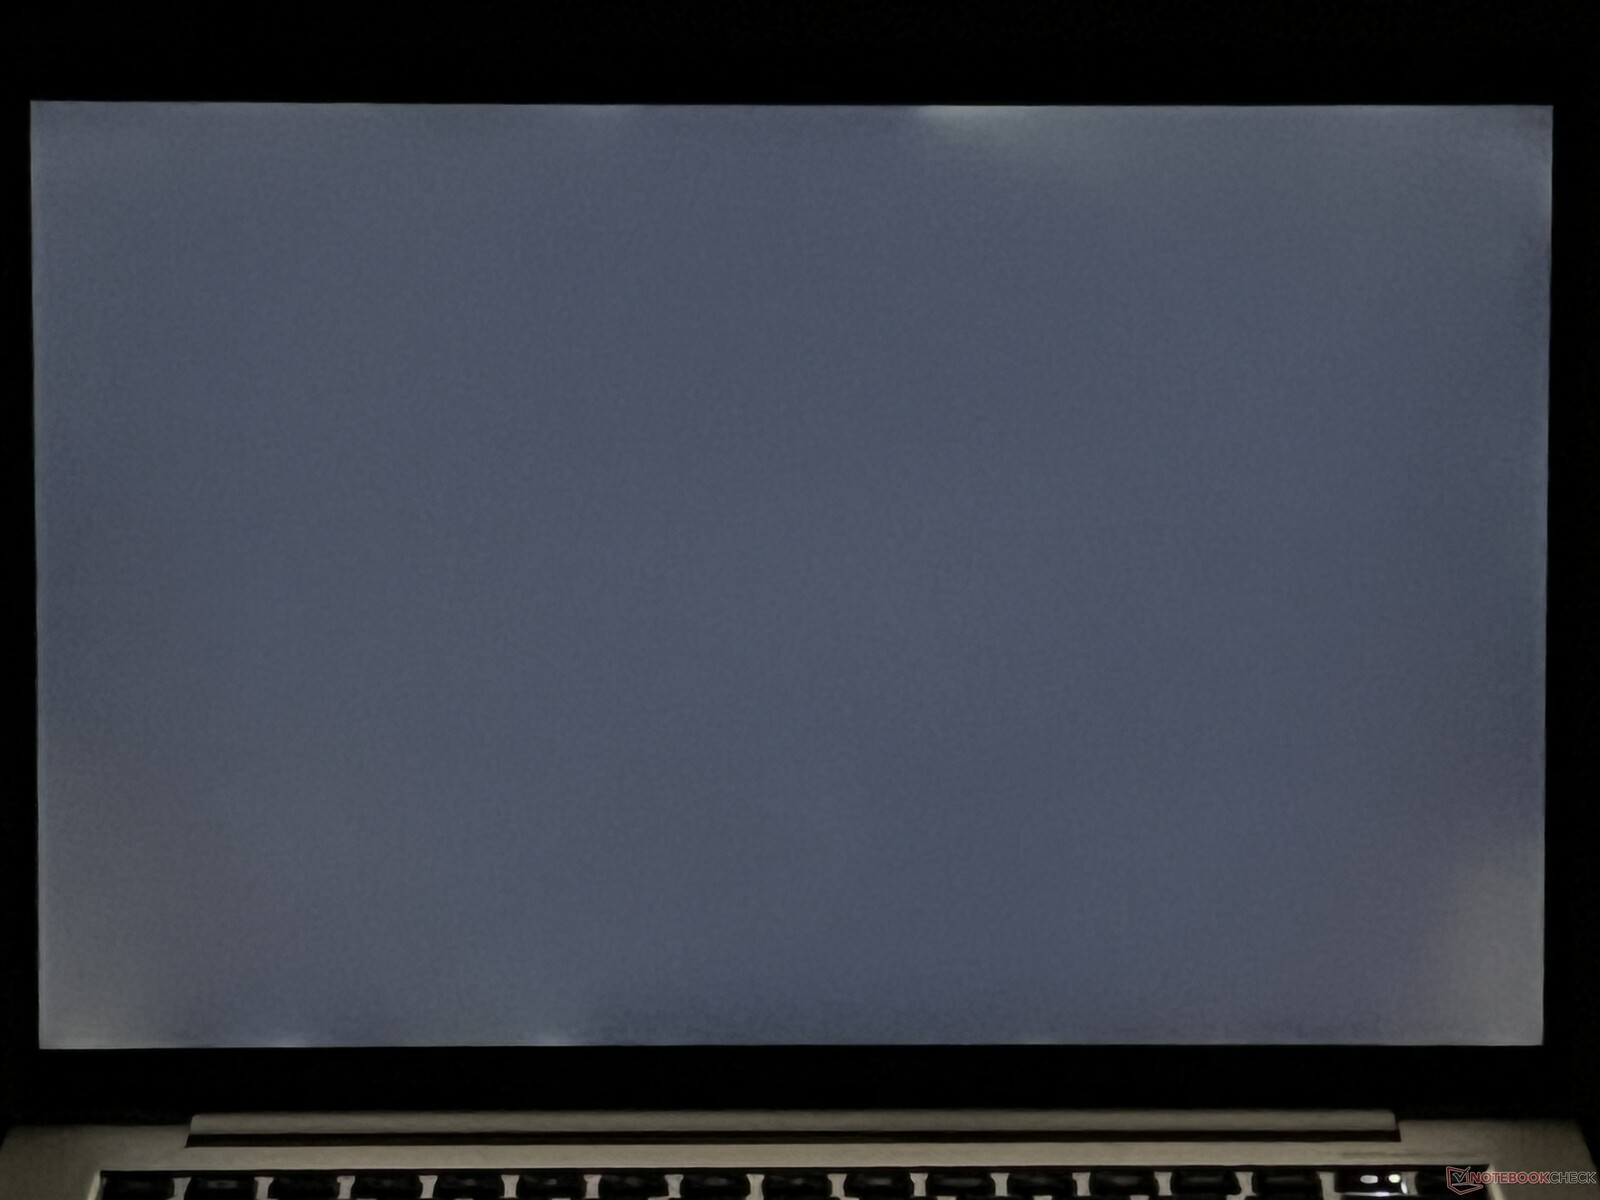
在我们的测量中,测试设备的亮度远远达不到宣传的 400 cd/m²,因为我们测量到的最高亮度为 343 cd/m²,平均亮度为 330 cd/m²。黑色值非常低,仅为 0.19 cd/m²,对比度为 1,800:1。光晕问题并不严重,我们也没有注意到任何 PWM 闪烁。不过,响应时间相当慢,我们还看到了一些移动时的重影效果。
| |||||||||||||||||||||||||
Brightness Distribution: 92 %
Center on Battery: 344 cd/m²
Contrast: 1805:1 (Black: 0.19 cd/m²)
ΔE ColorChecker Calman: 3 | ∀{0.5-29.43 Ø4.71}
calibrated: 0.7
ΔE Greyscale Calman: 5.4 | ∀{0.09-98 Ø4.96}
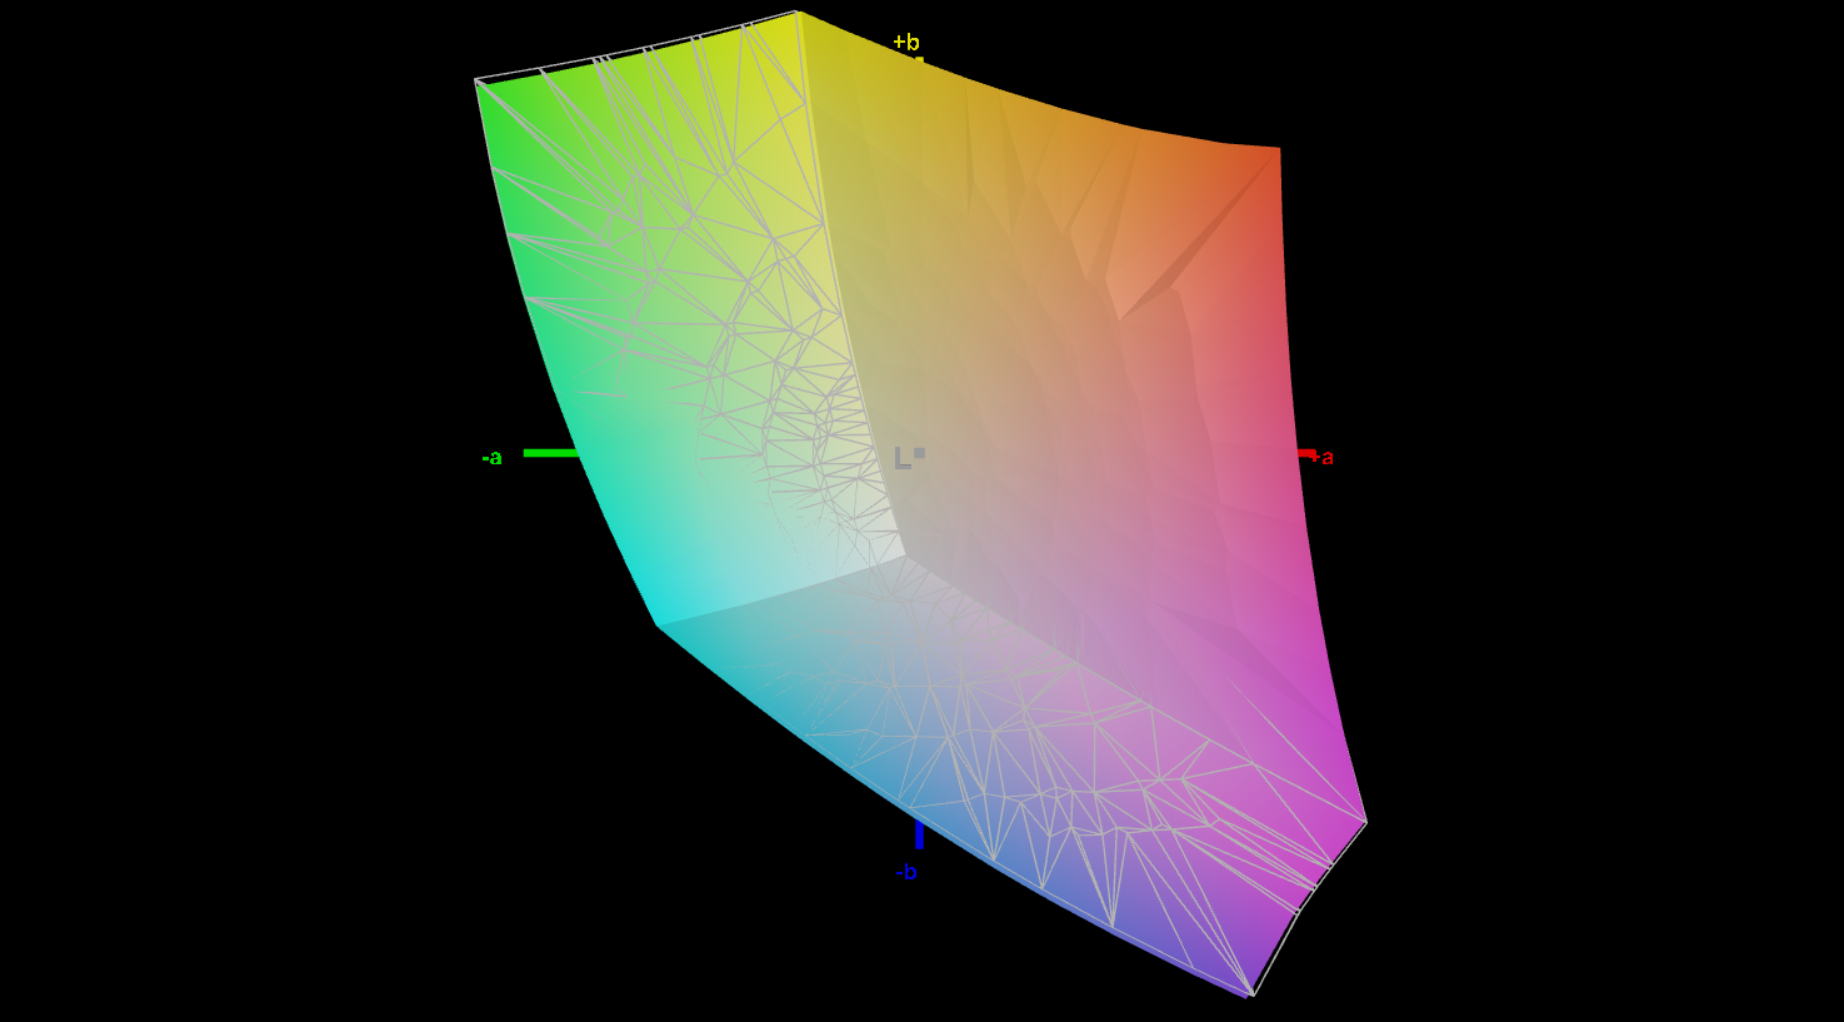
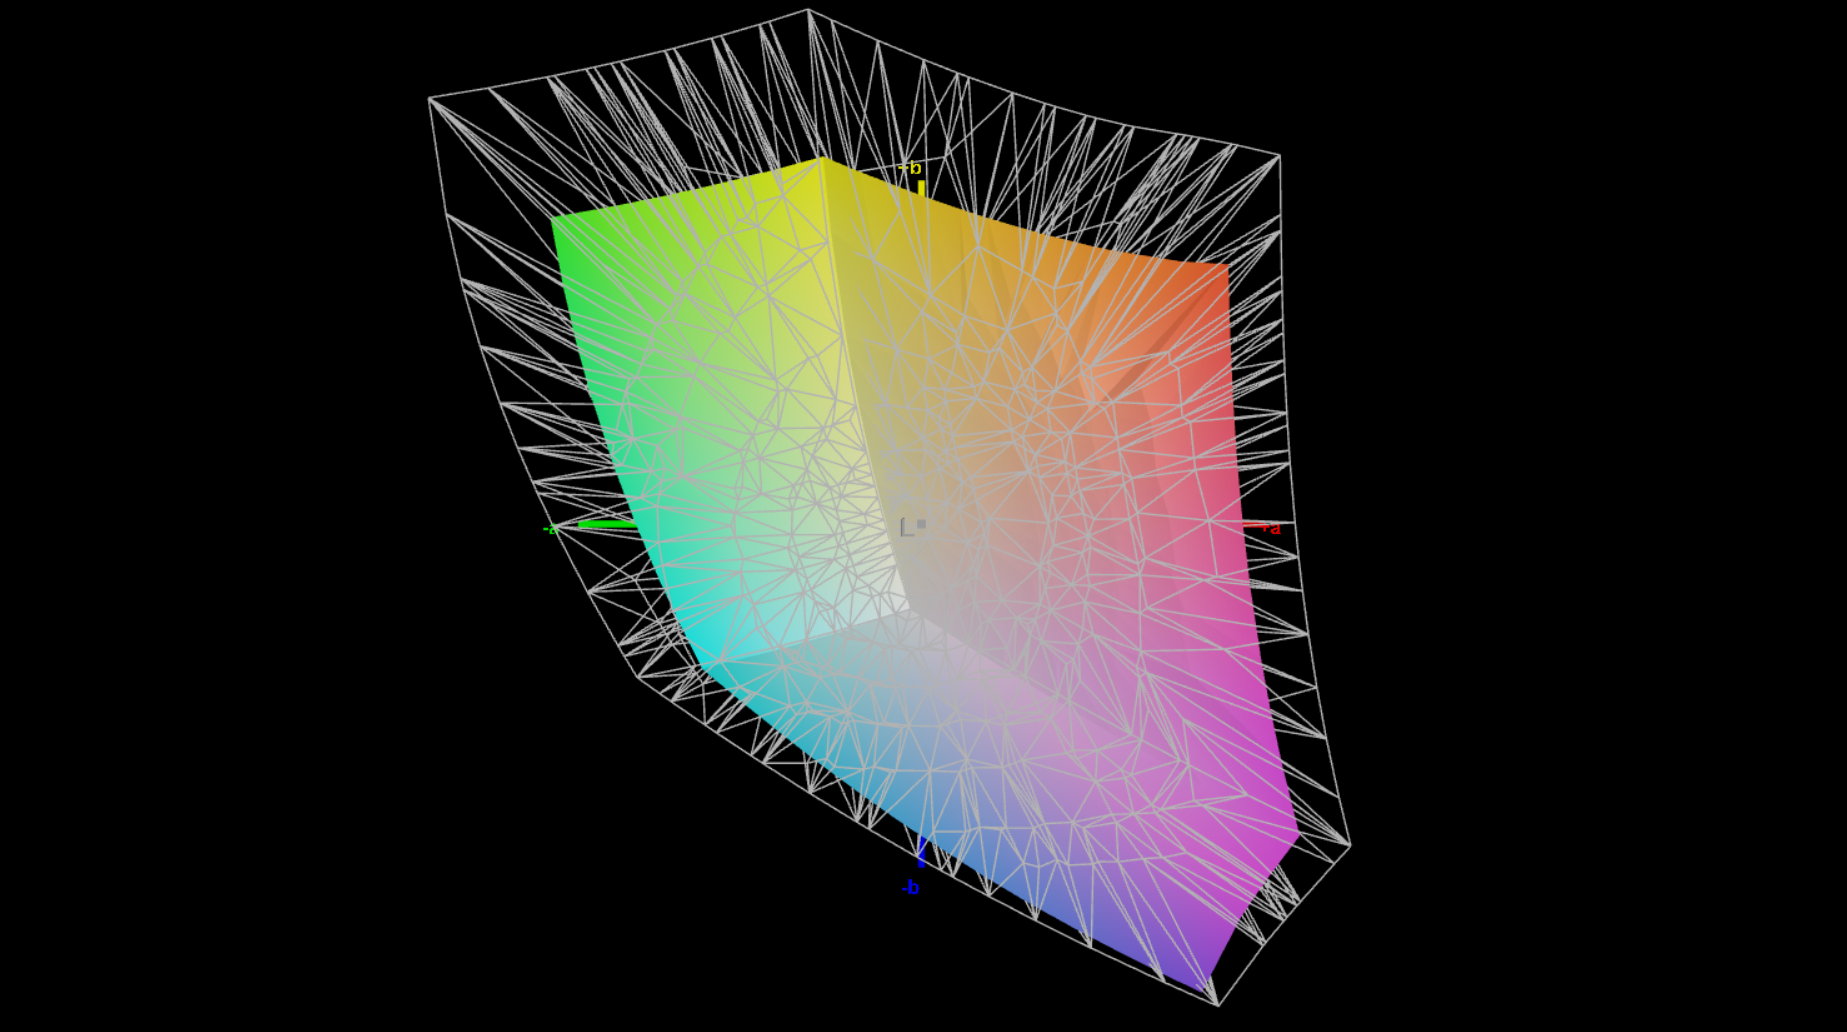
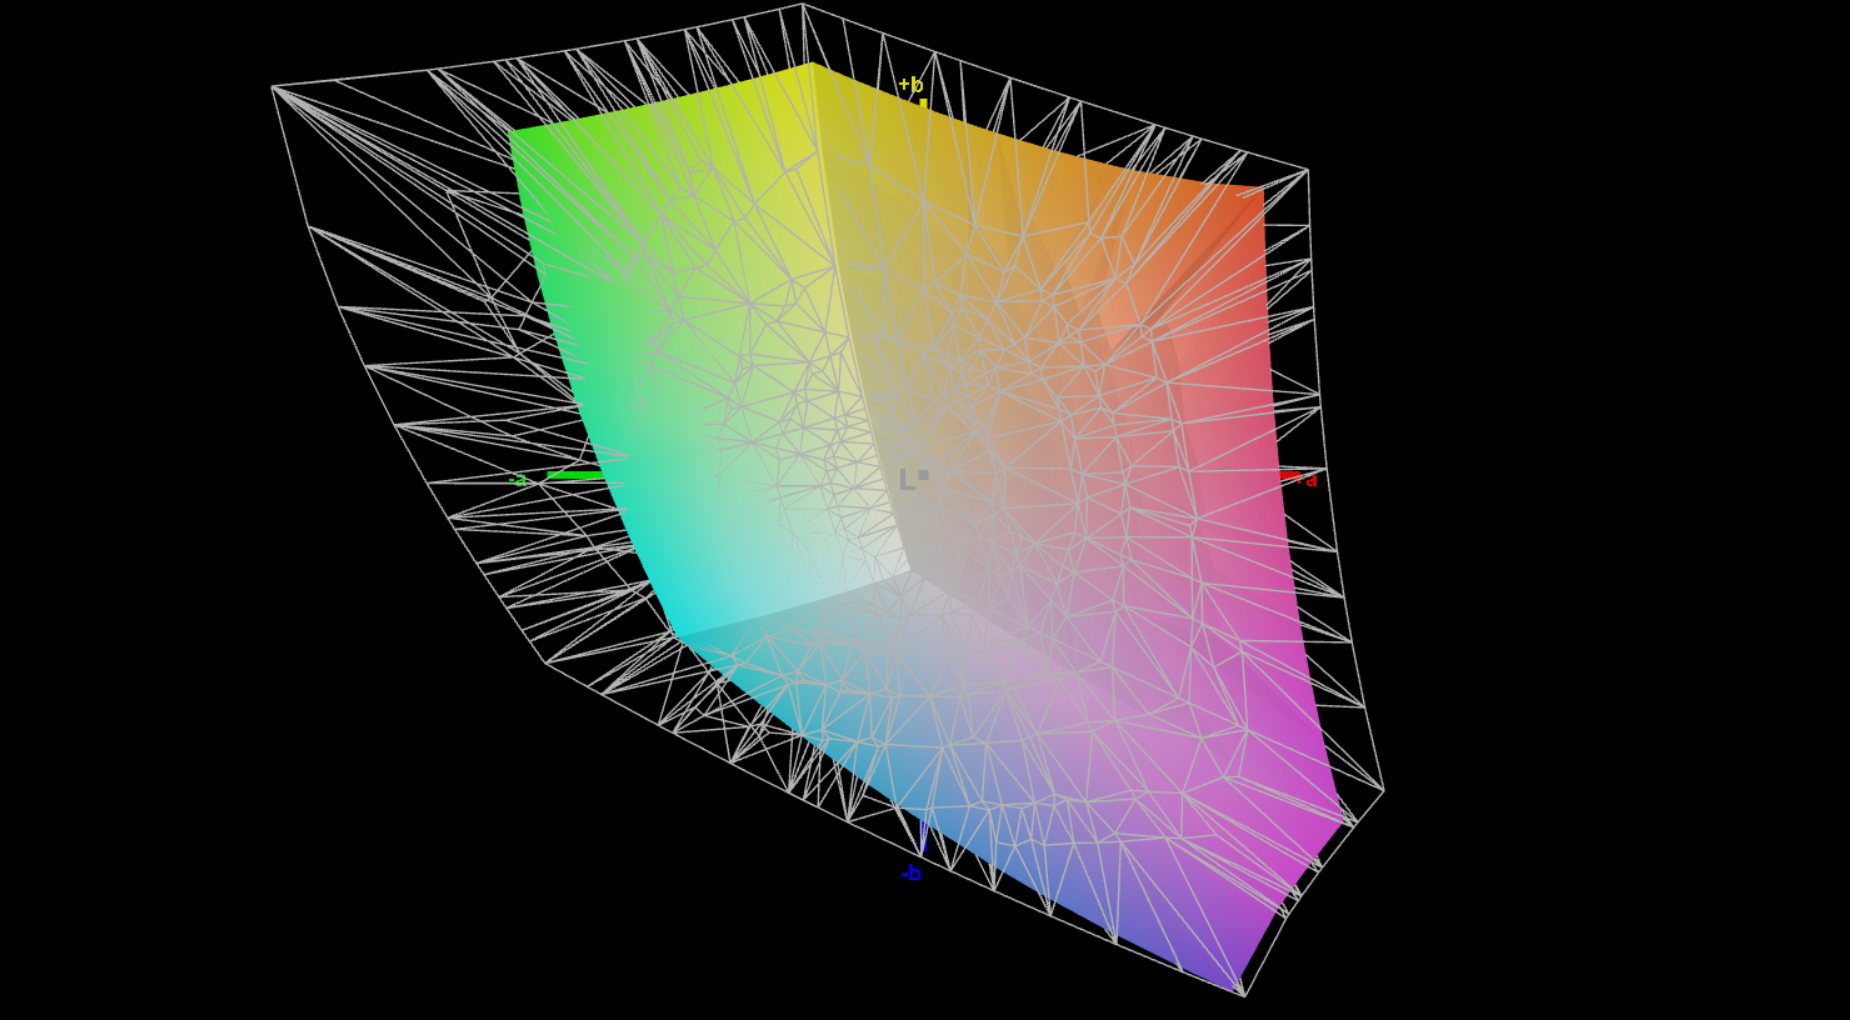
69.8% AdobeRGB 1998 (Argyll 3D)
88.1% sRGB (Argyll 3D)
67.7% Display P3 (Argyll 3D)
Gamma: 2.14
CCT: 7079 K
| HP EliteBook 1040 G10 818N7EA CMN1435, IPS, 1920x1200, 14" | HP EliteBook 845 G10 818N0EA AUO6DA8, IPS, 2560x1600, 14" | Lenovo ThinkPad X1 Carbon G11-21HNS00000 B140UAN02.1, IPS, 1920x1200, 14" | Huawei MateBook X Pro 2023 TMX1422, IPS, 3120x2080, 14.2" | Schenker Vision 14 2022 RTX 3050 Ti MNE007ZA1-1, IPS, 2880x1800, 14" | |
|---|---|---|---|---|---|
| Display | 27% | 12% | 22% | 9% | |
| Display P3 Coverage (%) | 67.7 | 98.3 45% | 75.4 11% | 89.8 33% | 74.1 9% |
| sRGB Coverage (%) | 88.1 | 99.8 13% | 99.6 13% | 99.4 13% | 97.4 11% |
| AdobeRGB 1998 Coverage (%) | 69.8 | 86.2 23% | 77.3 11% | 84.2 21% | 75.3 8% |
| Response Times | 75% | -34% | 70% | 46% | |
| Response Time Grey 50% / Grey 80% * (ms) | 54.8 ? | 12.7 ? 77% | 64.4 ? -18% | 20 ? 64% | 31.5 ? 43% |
| Response Time Black / White * (ms) | 28.3 ? | 7.9 ? 72% | 42.5 ? -50% | 7 ? 75% | 14.5 ? 49% |
| PWM Frequency (Hz) | 156000 ? | ||||
| Screen | 10% | -14% | 16% | -19% | |
| Brightness middle (cd/m²) | 343 | 546 59% | 379 10% | 595 73% | 421 23% |
| Brightness (cd/m²) | 330 | 564 71% | 383 16% | 550 67% | 416 26% |
| Brightness Distribution (%) | 92 | 86 -7% | 91 -1% | 85 -8% | 89 -3% |
| Black Level * (cd/m²) | 0.19 | 0.38 -100% | 0.21 -11% | 0.25 -32% | 0.28 -47% |
| Contrast (:1) | 1805 | 1437 -20% | 1805 0% | 2380 32% | 1504 -17% |
| Colorchecker dE 2000 * | 3 | 1.3 57% | 3.2 -7% | 2.01 33% | 3.2 -7% |
| Colorchecker dE 2000 max. * | 7 | 5.3 24% | 7.3 -4% | 6.9 1% | 5.5 21% |
| Colorchecker dE 2000 calibrated * | 0.7 | 1.2 -71% | 1.7 -143% | 1.22 -74% | 2 -186% |
| Greyscale dE 2000 * | 5.4 | 1.1 80% | 4.5 17% | 2.74 49% | 4.4 19% |
| Gamma | 2.14 103% | 2.27 97% | 2.19 100% | 2.4 92% | 2.22 99% |
| CCT | 7079 92% | 6463 101% | 6249 104% | 6319 103% | 6384 102% |
| Total Average (Program / Settings) | 37% /
23% | -12% /
-11% | 36% /
25% | 12% /
-4% |
* ... smaller is better
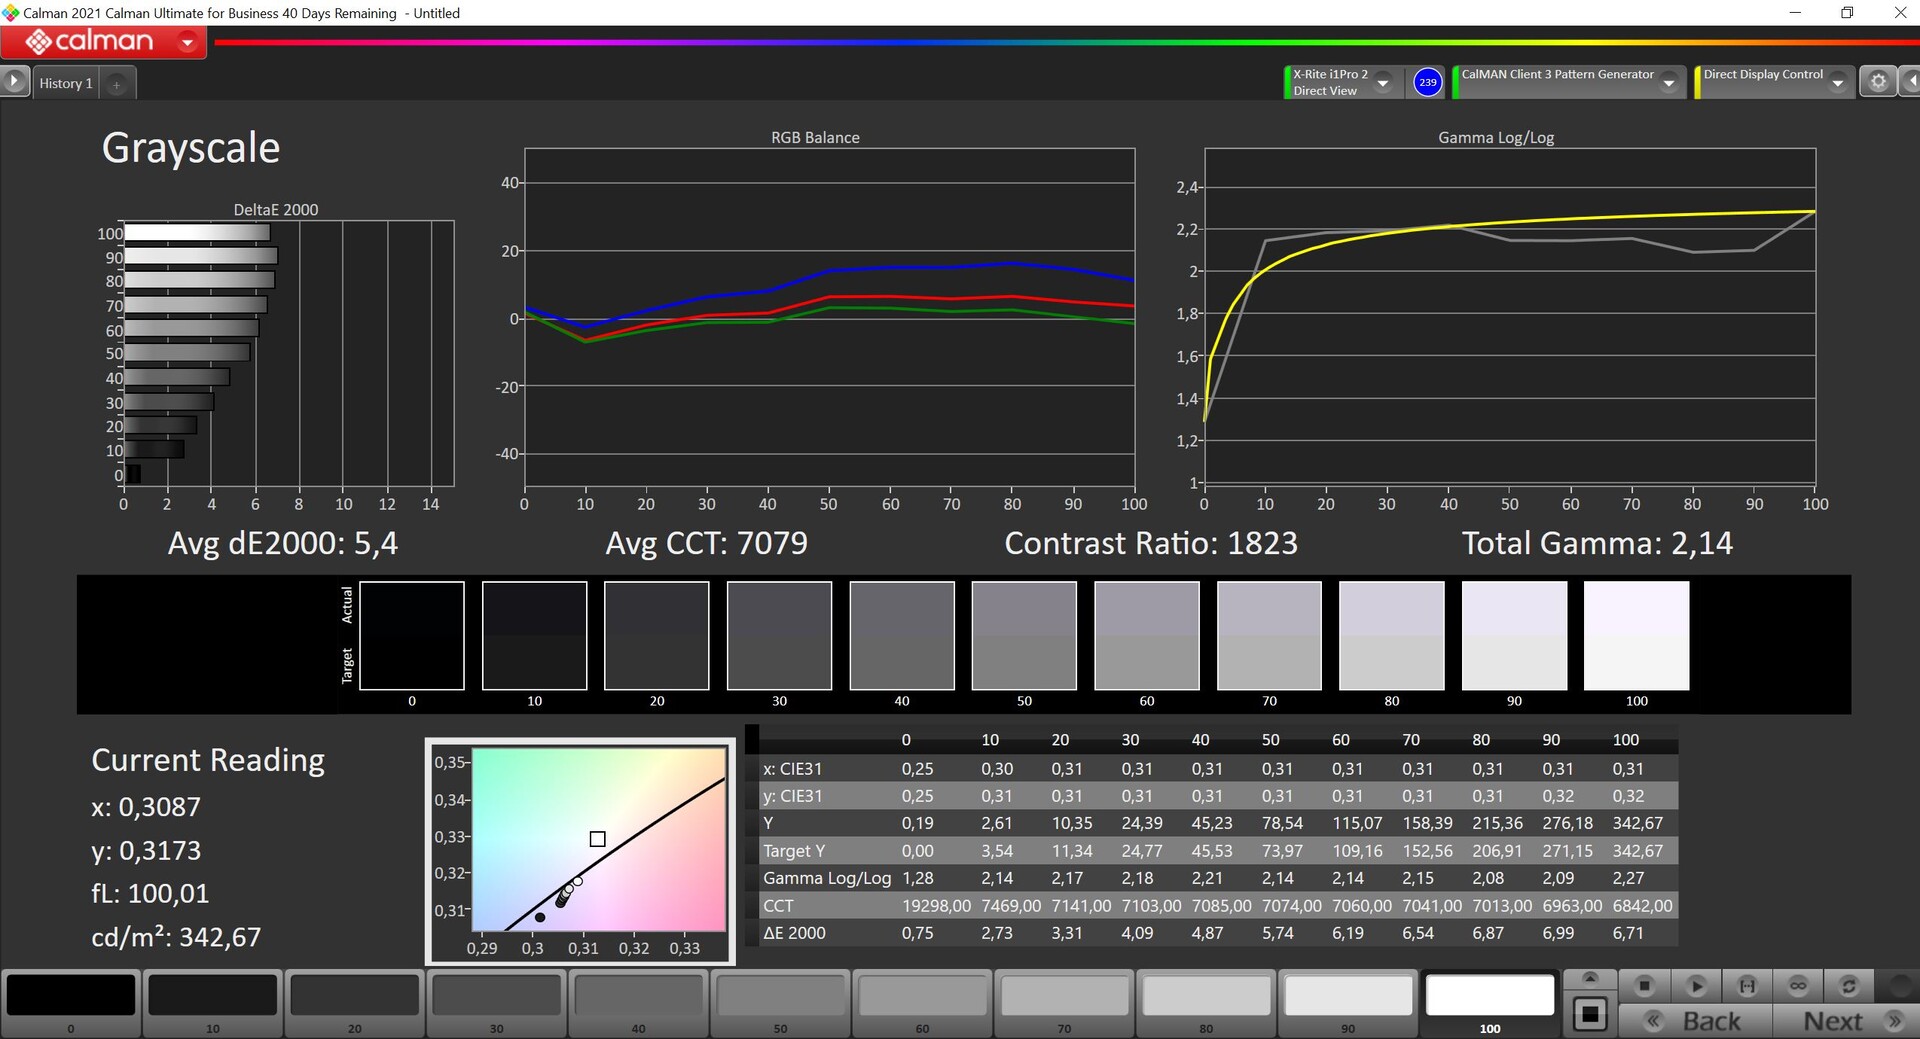
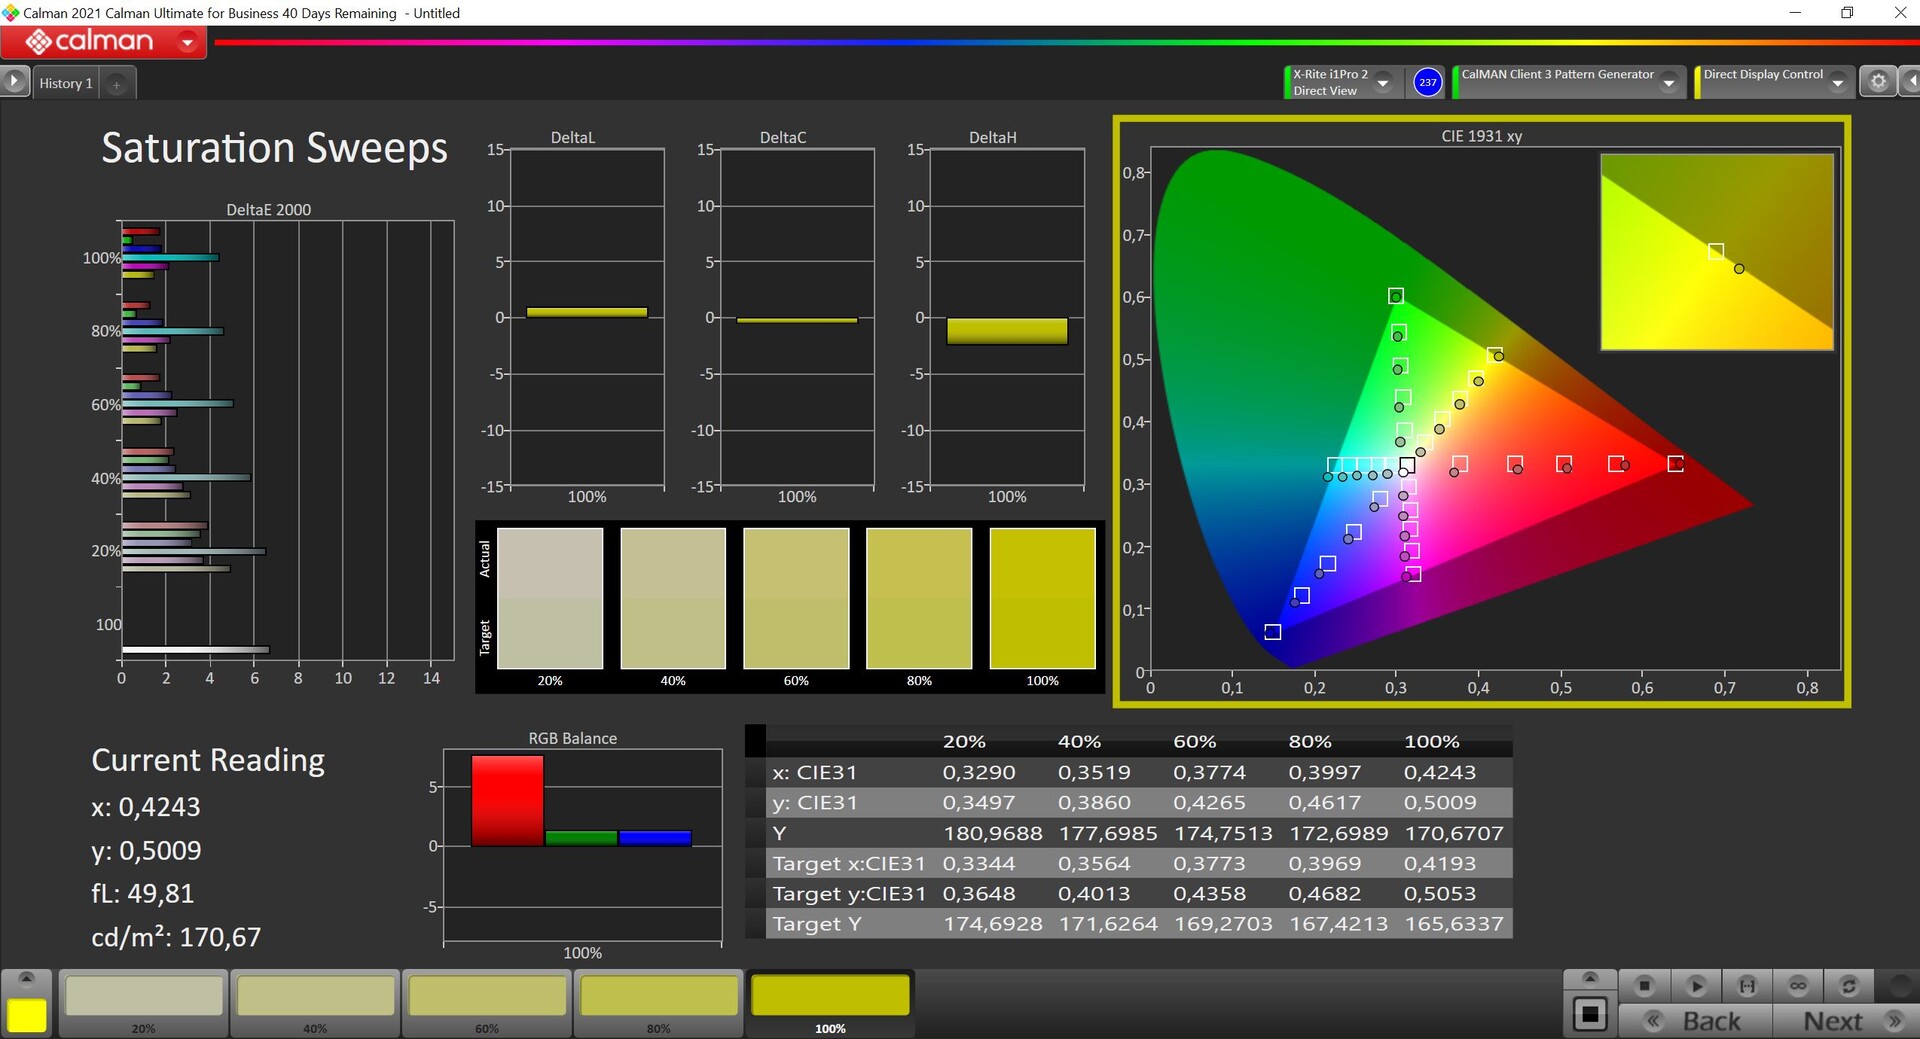

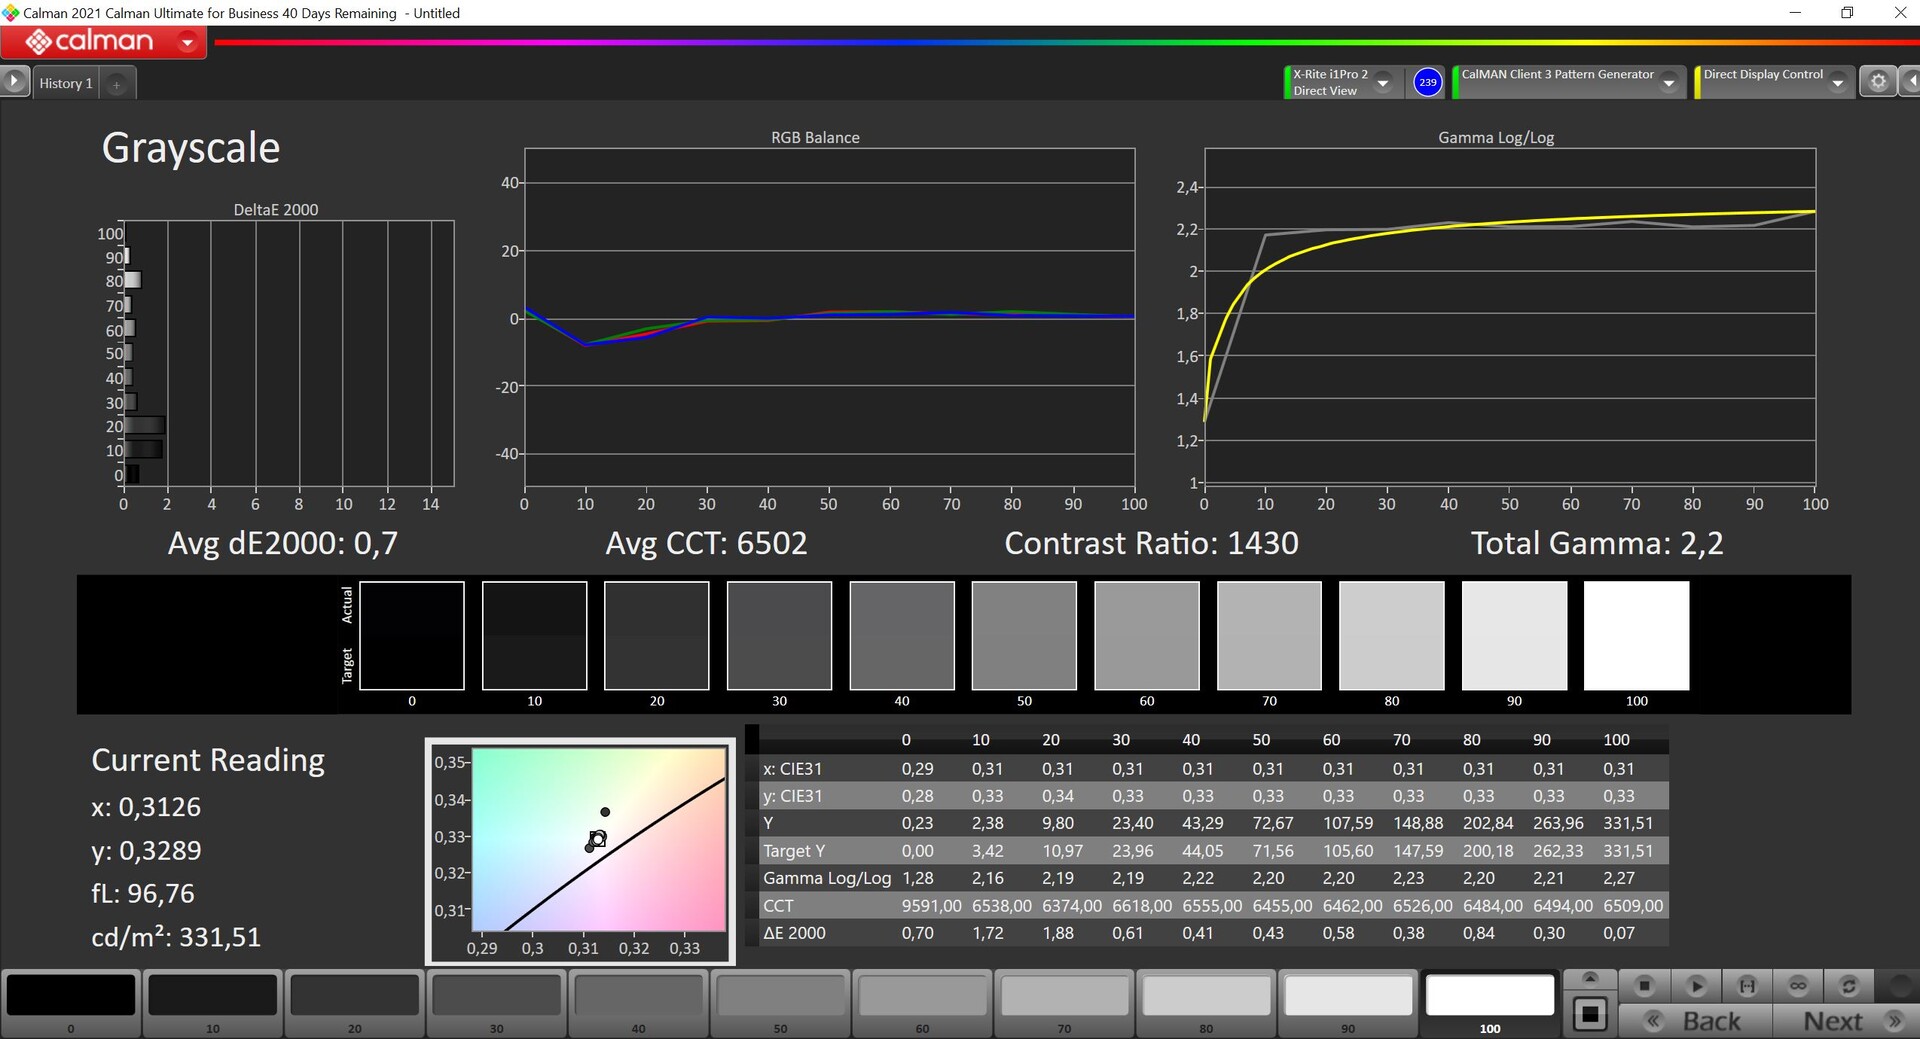


使用专业的 CalMAN 软件进行分析后发现,色温略微偏冷,有轻微的蓝色色调。色彩方面也有一些偏差,但我们可以通过自己的校准(您可以从上面的链接免费下载配置文件)将色彩还原到参考水平,偏差极小。不过,sRGB 色彩空间的覆盖率仅勉强达到 90%,因此竞争对手在这方面做得更好。虽然这款面板总体上还算适合办公室使用,但考虑到其高昂的价格,还是让人略感失望。
Display Response Times
| ↔ Response Time Black to White | ||
|---|---|---|
| 28.3 ms ... rise ↗ and fall ↘ combined | ↗ 13.2 ms rise | 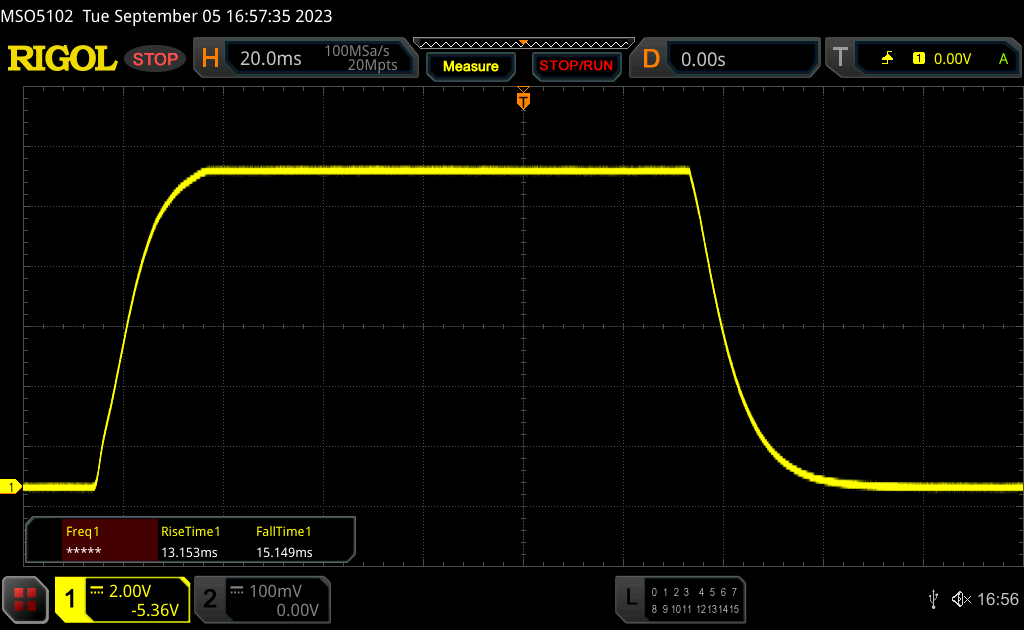 |
| ↘ 15.1 ms fall | ||
| The screen shows relatively slow response rates in our tests and may be too slow for gamers. In comparison, all tested devices range from 0.1 (minimum) to 240 (maximum) ms. » 75 % of all devices are better. This means that the measured response time is worse than the average of all tested devices (19.8 ms). | ||
| ↔ Response Time 50% Grey to 80% Grey | ||
| 54.8 ms ... rise ↗ and fall ↘ combined | ↗ 25.4 ms rise | 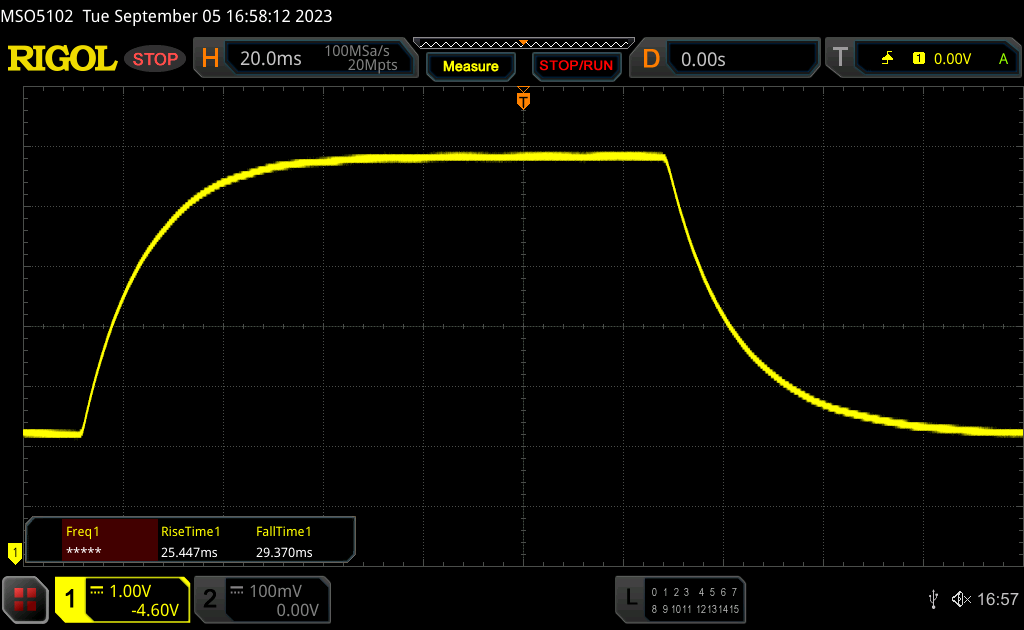 |
| ↘ 29.4 ms fall | ||
| The screen shows slow response rates in our tests and will be unsatisfactory for gamers. In comparison, all tested devices range from 0.165 (minimum) to 636 (maximum) ms. » 91 % of all devices are better. This means that the measured response time is worse than the average of all tested devices (31 ms). | ||
Screen Flickering / PWM (Pulse-Width Modulation)
| Screen flickering / PWM not detected | 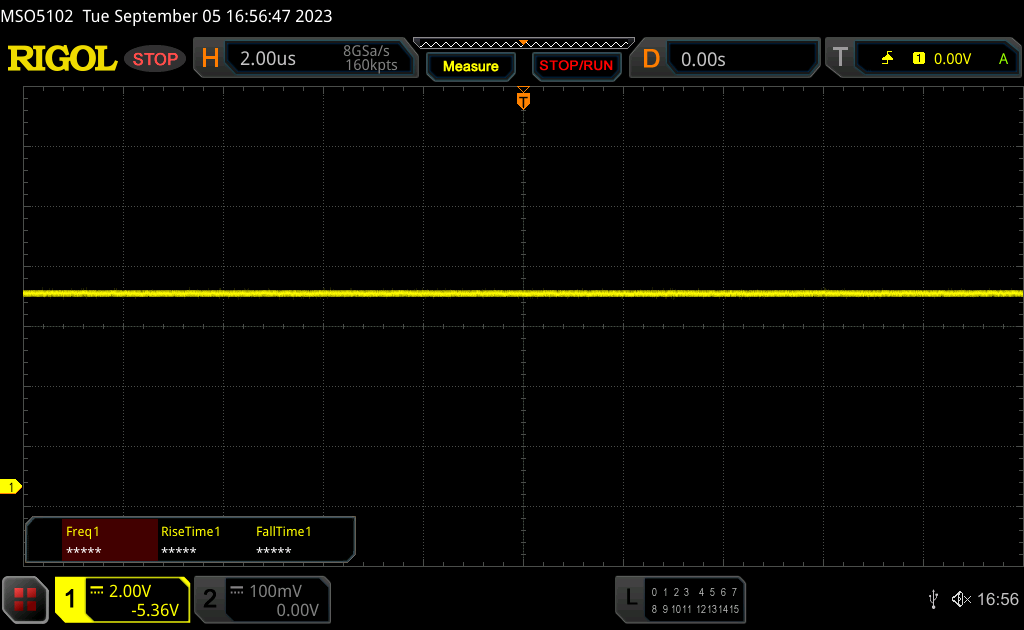 | ||
In comparison: 52 % of all tested devices do not use PWM to dim the display. If PWM was detected, an average of 7757 (minimum: 5 - maximum: 343500) Hz was measured. | |||
当然,哑光显示屏对室外也有好处,阴天也能舒适地在室外工作。不过,在晴天亮度不够。IPS 面板的可视角度稳定性很好,只是从上方侧面看亮度会有所提高。

性能 - Raptor Lake Core i5
测试条件
惠普没有提供任何单独的电源配置文件,而是使用常规的 Windows 电源配置文件。我们使用最佳性能配置文件运行了以下基准测试和测量。
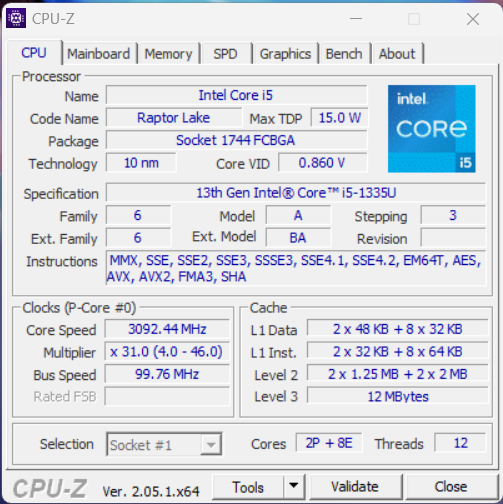
处理器
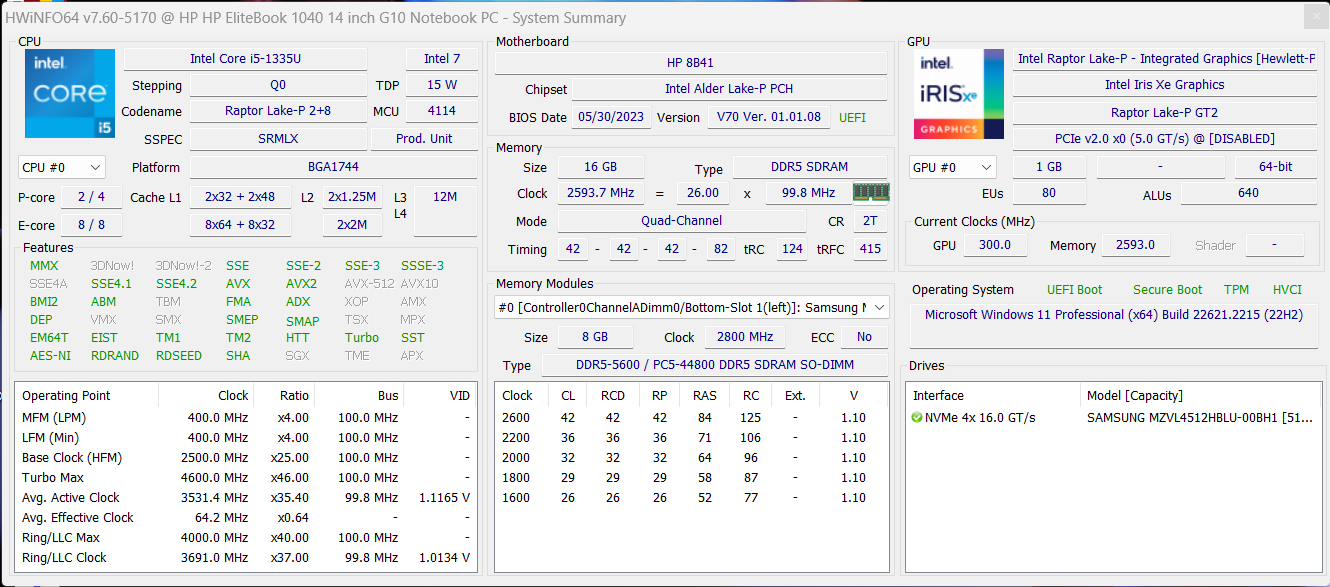
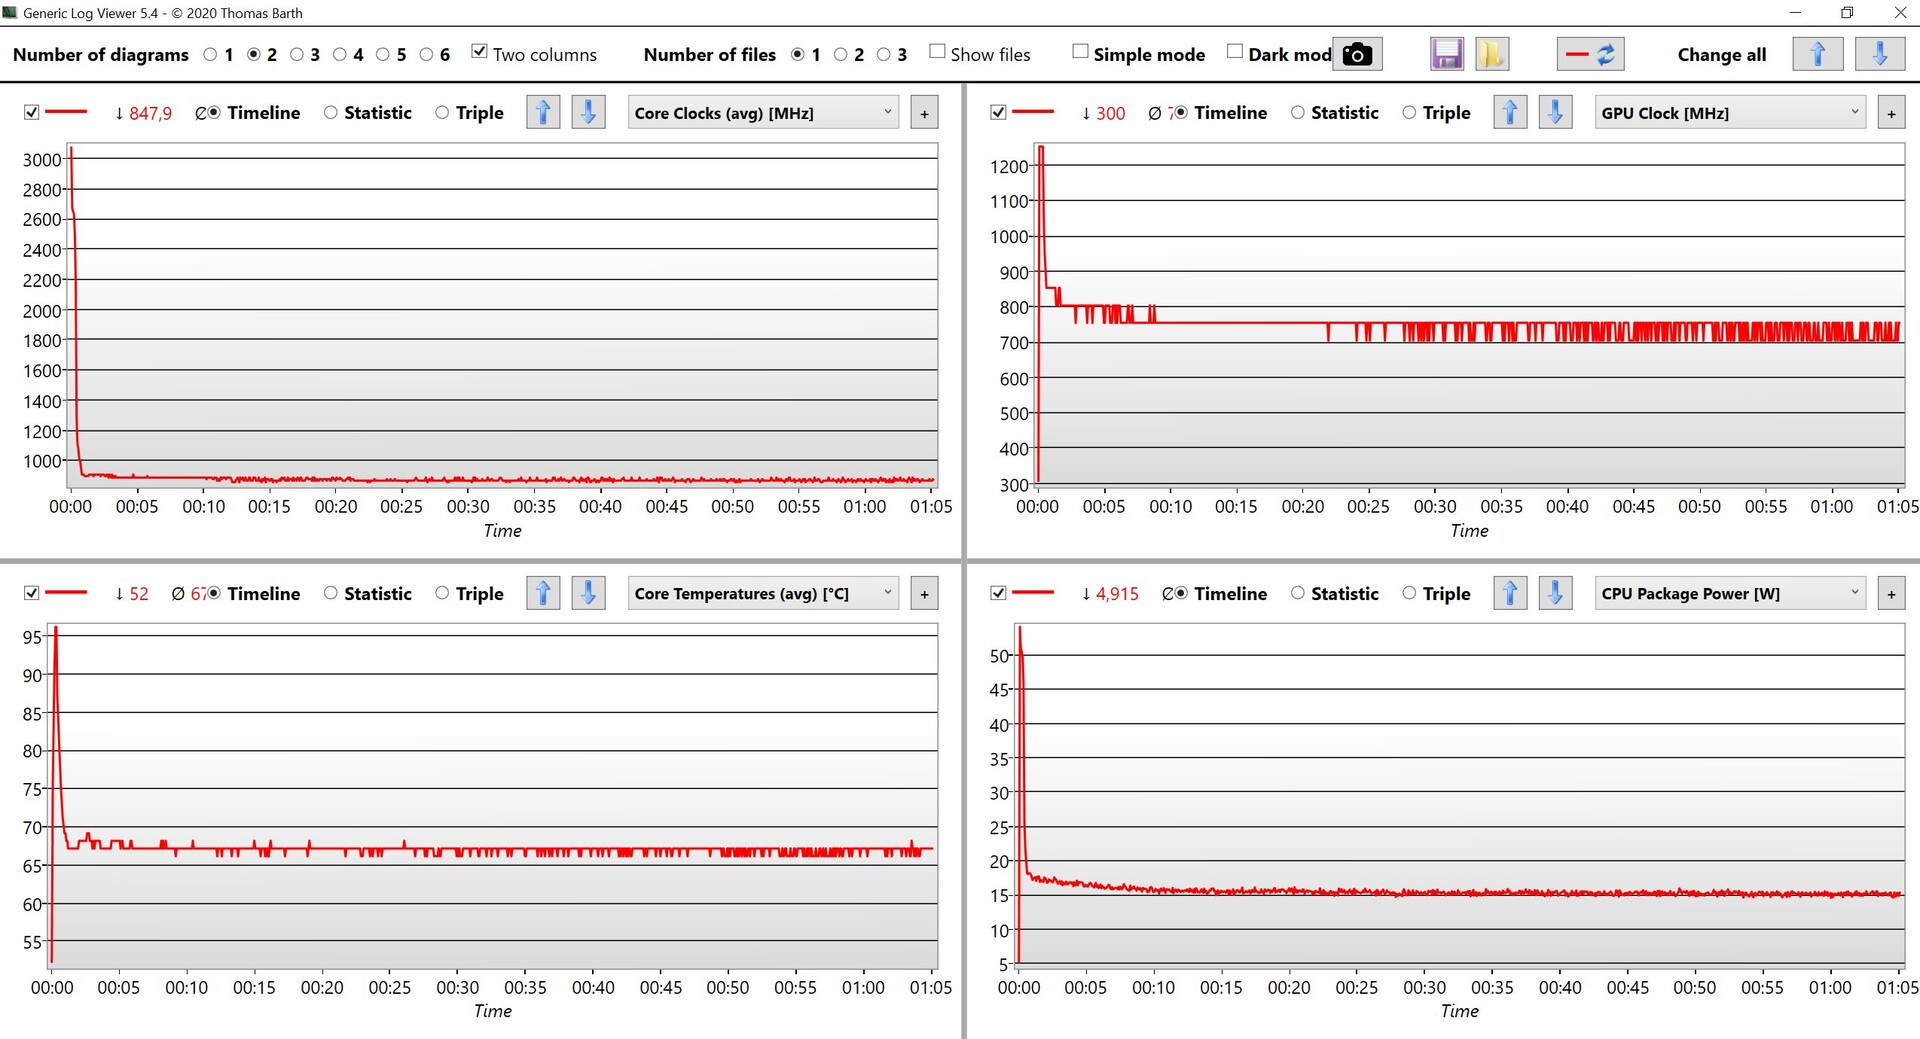
我们测试的 EliteBook 1040 G10 配置配备了 酷睿 i5-1335U这是该机型最弱的处理器。它是当前 U 系列的 Raptor Lake 处理器,拥有两个性能核心和八个效率核心。尽管 U 系列的标称 TDP 为 15 瓦,但允许处理器的最大功耗高达 52 瓦。然而,这个值无法维持,并立即下降,过了很短的时间才降到 15 瓦。
与此相对应的是,只有在短时间负载的情况下才会有好的结果,而在持续负载的情况下性能会大幅下降。不过,单核性能还是不错的,对于日常办公任务来说,整体性能也不错--尽管竞争对手的整体速度更快。在电池工作状态下,最大功耗为 45 瓦,但几秒钟后功耗仅为 15 瓦。这导致多核性能下降约 26%,单核性能也受到影响(-10%)。您可以在 技术部分.
Cinebench R15 Multi Constant Load Test
Cinebench R23: Multi Core | Single Core
Cinebench R20: CPU (Multi Core) | CPU (Single Core)
Cinebench R15: CPU Multi 64Bit | CPU Single 64Bit
Blender: v2.79 BMW27 CPU
7-Zip 18.03: 7z b 4 | 7z b 4 -mmt1
Geekbench 5.5: Multi-Core | Single-Core
HWBOT x265 Benchmark v2.2: 4k Preset
LibreOffice : 20 Documents To PDF
R Benchmark 2.5: Overall mean
| CPU Performance rating | |
| HP EliteBook 845 G10 818N0EA | |
| Schenker Vision 14 2022 RTX 3050 Ti | |
| Huawei MateBook X Pro 2023 | |
| Average of class Office | |
| Lenovo ThinkPad X1 Carbon G11-21HNS00000 | |
| Average Intel Core i5-1335U | |
| HP EliteBook 1040 G10 818N7EA | |
| Cinebench R23 / Multi Core | |
| HP EliteBook 845 G10 818N0EA | |
| Schenker Vision 14 2022 RTX 3050 Ti | |
| Huawei MateBook X Pro 2023 | |
| Average of class Office (1673 - 22808, n=76, last 2 years) | |
| Lenovo ThinkPad X1 Carbon G11-21HNS00000 | |
| Average Intel Core i5-1335U (6957 - 9438, n=12) | |
| HP EliteBook 1040 G10 818N7EA | |
| Cinebench R23 / Single Core | |
| Lenovo ThinkPad X1 Carbon G11-21HNS00000 | |
| Huawei MateBook X Pro 2023 | |
| Average of class Office (708 - 2130, n=76, last 2 years) | |
| HP EliteBook 1040 G10 818N7EA | |
| Schenker Vision 14 2022 RTX 3050 Ti | |
| Average Intel Core i5-1335U (1532 - 1733, n=12) | |
| HP EliteBook 845 G10 818N0EA | |
| Cinebench R20 / CPU (Multi Core) | |
| HP EliteBook 845 G10 818N0EA | |
| Schenker Vision 14 2022 RTX 3050 Ti | |
| Average of class Office (648 - 8840, n=75, last 2 years) | |
| Huawei MateBook X Pro 2023 | |
| Lenovo ThinkPad X1 Carbon G11-21HNS00000 | |
| Average Intel Core i5-1335U (2602 - 3849, n=11) | |
| HP EliteBook 1040 G10 818N7EA | |
| Cinebench R20 / CPU (Single Core) | |
| Lenovo ThinkPad X1 Carbon G11-21HNS00000 | |
| Huawei MateBook X Pro 2023 | |
| Schenker Vision 14 2022 RTX 3050 Ti | |
| Average of class Office (345 - 816, n=75, last 2 years) | |
| HP EliteBook 1040 G10 818N7EA | |
| Average Intel Core i5-1335U (593 - 663, n=11) | |
| HP EliteBook 845 G10 818N0EA | |
| Cinebench R15 / CPU Multi 64Bit | |
| HP EliteBook 845 G10 818N0EA | |
| Schenker Vision 14 2022 RTX 3050 Ti | |
| Huawei MateBook X Pro 2023 | |
| Average of class Office (250 - 3380, n=77, last 2 years) | |
| Lenovo ThinkPad X1 Carbon G11-21HNS00000 | |
| HP EliteBook 1040 G10 818N7EA | |
| Average Intel Core i5-1335U (1109 - 1547, n=11) | |
| Cinebench R15 / CPU Single 64Bit | |
| Lenovo ThinkPad X1 Carbon G11-21HNS00000 | |
| Huawei MateBook X Pro 2023 | |
| Schenker Vision 14 2022 RTX 3050 Ti | |
| Average of class Office (99.5 - 316, n=77, last 2 years) | |
| HP EliteBook 1040 G10 818N7EA | |
| HP EliteBook 845 G10 818N0EA | |
| Average Intel Core i5-1335U (222 - 248, n=11) | |
| Blender / v2.79 BMW27 CPU | |
| HP EliteBook 1040 G10 818N7EA | |
| Average Intel Core i5-1335U (340 - 786, n=12) | |
| Lenovo ThinkPad X1 Carbon G11-21HNS00000 | |
| Average of class Office (158 - 1940, n=76, last 2 years) | |
| Huawei MateBook X Pro 2023 | |
| Schenker Vision 14 2022 RTX 3050 Ti | |
| HP EliteBook 845 G10 818N0EA | |
| 7-Zip 18.03 / 7z b 4 | |
| HP EliteBook 845 G10 818N0EA | |
| Schenker Vision 14 2022 RTX 3050 Ti | |
| Huawei MateBook X Pro 2023 | |
| Average of class Office (7098 - 76886, n=77, last 2 years) | |
| Lenovo ThinkPad X1 Carbon G11-21HNS00000 | |
| Average Intel Core i5-1335U (25012 - 38513, n=11) | |
| HP EliteBook 1040 G10 818N7EA | |
| 7-Zip 18.03 / 7z b 4 -mmt1 | |
| Lenovo ThinkPad X1 Carbon G11-21HNS00000 | |
| HP EliteBook 845 G10 818N0EA | |
| Schenker Vision 14 2022 RTX 3050 Ti | |
| Huawei MateBook X Pro 2023 | |
| Average of class Office (3387 - 6469, n=77, last 2 years) | |
| HP EliteBook 1040 G10 818N7EA | |
| Average Intel Core i5-1335U (4872 - 5545, n=11) | |
| Geekbench 5.5 / Multi-Core | |
| Schenker Vision 14 2022 RTX 3050 Ti | |
| HP EliteBook 845 G10 818N0EA | |
| Average of class Office (1483 - 16999, n=73, last 2 years) | |
| Huawei MateBook X Pro 2023 | |
| Lenovo ThinkPad X1 Carbon G11-21HNS00000 | |
| HP EliteBook 1040 G10 818N7EA | |
| Average Intel Core i5-1335U (5459 - 8618, n=11) | |
| Geekbench 5.5 / Single-Core | |
| Lenovo ThinkPad X1 Carbon G11-21HNS00000 | |
| Average of class Office (811 - 2175, n=73, last 2 years) | |
| Huawei MateBook X Pro 2023 | |
| Schenker Vision 14 2022 RTX 3050 Ti | |
| HP EliteBook 845 G10 818N0EA | |
| HP EliteBook 1040 G10 818N7EA | |
| Average Intel Core i5-1335U (1506 - 1700, n=11) | |
| HWBOT x265 Benchmark v2.2 / 4k Preset | |
| HP EliteBook 845 G10 818N0EA | |
| Schenker Vision 14 2022 RTX 3050 Ti | |
| Average of class Office (2.21 - 26, n=76, last 2 years) | |
| Huawei MateBook X Pro 2023 | |
| Lenovo ThinkPad X1 Carbon G11-21HNS00000 | |
| Average Intel Core i5-1335U (6.55 - 10.7, n=11) | |
| HP EliteBook 1040 G10 818N7EA | |
| LibreOffice / 20 Documents To PDF | |
| Average of class Office (39.9 - 102.3, n=76, last 2 years) | |
| HP EliteBook 1040 G10 818N7EA | |
| Average Intel Core i5-1335U (45 - 58.7, n=11) | |
| HP EliteBook 845 G10 818N0EA | |
| Lenovo ThinkPad X1 Carbon G11-21HNS00000 | |
| Schenker Vision 14 2022 RTX 3050 Ti | |
| Huawei MateBook X Pro 2023 | |
| R Benchmark 2.5 / Overall mean | |
| Average of class Office (0.393 - 0.888, n=76, last 2 years) | |
| Average Intel Core i5-1335U (0.4892 - 0.524, n=10) | |
| HP EliteBook 1040 G10 818N7EA | |
| HP EliteBook 845 G10 818N0EA | |
| Schenker Vision 14 2022 RTX 3050 Ti | |
| Huawei MateBook X Pro 2023 | |
| Lenovo ThinkPad X1 Carbon G11-21HNS00000 | |
* ... smaller is better
AIDA64: FP32 Ray-Trace | FPU Julia | CPU SHA3 | CPU Queen | FPU SinJulia | FPU Mandel | CPU AES | CPU ZLib | FP64 Ray-Trace | CPU PhotoWorxx
| Performance rating | |
| HP EliteBook 845 G10 818N0EA | |
| Schenker Vision 14 2022 RTX 3050 Ti | |
| Average of class Office | |
| Huawei MateBook X Pro 2023 | |
| Lenovo ThinkPad X1 Carbon G11-21HNS00000 | |
| Average Intel Core i5-1335U | |
| HP EliteBook 1040 G10 818N7EA | |
| AIDA64 / FP32 Ray-Trace | |
| HP EliteBook 845 G10 818N0EA | |
| Average of class Office (2083 - 31245, n=83, last 2 years) | |
| Schenker Vision 14 2022 RTX 3050 Ti | |
| Huawei MateBook X Pro 2023 | |
| Lenovo ThinkPad X1 Carbon G11-21HNS00000 | |
| Average Intel Core i5-1335U (5661 - 7809, n=11) | |
| HP EliteBook 1040 G10 818N7EA | |
| AIDA64 / FPU Julia | |
| HP EliteBook 845 G10 818N0EA | |
| Average of class Office (8191 - 125394, n=83, last 2 years) | |
| Schenker Vision 14 2022 RTX 3050 Ti | |
| Huawei MateBook X Pro 2023 | |
| Lenovo ThinkPad X1 Carbon G11-21HNS00000 | |
| Average Intel Core i5-1335U (29483 - 43636, n=11) | |
| HP EliteBook 1040 G10 818N7EA | |
| AIDA64 / CPU SHA3 | |
| HP EliteBook 845 G10 818N0EA | |
| Average of class Office (433 - 5755, n=83, last 2 years) | |
| Schenker Vision 14 2022 RTX 3050 Ti | |
| Huawei MateBook X Pro 2023 | |
| Lenovo ThinkPad X1 Carbon G11-21HNS00000 | |
| Average Intel Core i5-1335U (1515 - 2278, n=11) | |
| HP EliteBook 1040 G10 818N7EA | |
| AIDA64 / CPU Queen | |
| HP EliteBook 845 G10 818N0EA | |
| Schenker Vision 14 2022 RTX 3050 Ti | |
| Huawei MateBook X Pro 2023 | |
| Lenovo ThinkPad X1 Carbon G11-21HNS00000 | |
| Average of class Office (22784 - 115197, n=67, last 2 years) | |
| HP EliteBook 1040 G10 818N7EA | |
| Average Intel Core i5-1335U (53839 - 60992, n=11) | |
| AIDA64 / FPU SinJulia | |
| HP EliteBook 845 G10 818N0EA | |
| Schenker Vision 14 2022 RTX 3050 Ti | |
| Average of class Office (1378 - 18321, n=83, last 2 years) | |
| Huawei MateBook X Pro 2023 | |
| Lenovo ThinkPad X1 Carbon G11-21HNS00000 | |
| Average Intel Core i5-1335U (3873 - 5008, n=11) | |
| HP EliteBook 1040 G10 818N7EA | |
| AIDA64 / FPU Mandel | |
| HP EliteBook 845 G10 818N0EA | |
| Average of class Office (4601 - 66922, n=83, last 2 years) | |
| Schenker Vision 14 2022 RTX 3050 Ti | |
| Huawei MateBook X Pro 2023 | |
| Lenovo ThinkPad X1 Carbon G11-21HNS00000 | |
| Average Intel Core i5-1335U (14376 - 20553, n=11) | |
| HP EliteBook 1040 G10 818N7EA | |
| AIDA64 / CPU AES | |
| Huawei MateBook X Pro 2023 | |
| HP EliteBook 845 G10 818N0EA | |
| Schenker Vision 14 2022 RTX 3050 Ti | |
| Average of class Office (4854 - 155900, n=83, last 2 years) | |
| Lenovo ThinkPad X1 Carbon G11-21HNS00000 | |
| Average Intel Core i5-1335U (31154 - 65997, n=11) | |
| HP EliteBook 1040 G10 818N7EA | |
| AIDA64 / CPU ZLib | |
| HP EliteBook 845 G10 818N0EA | |
| Schenker Vision 14 2022 RTX 3050 Ti | |
| Average of class Office (114.6 - 1366, n=83, last 2 years) | |
| Huawei MateBook X Pro 2023 | |
| Lenovo ThinkPad X1 Carbon G11-21HNS00000 | |
| Average Intel Core i5-1335U (378 - 676, n=11) | |
| HP EliteBook 1040 G10 818N7EA | |
| AIDA64 / FP64 Ray-Trace | |
| HP EliteBook 845 G10 818N0EA | |
| Average of class Office (1109 - 17834, n=83, last 2 years) | |
| Schenker Vision 14 2022 RTX 3050 Ti | |
| Huawei MateBook X Pro 2023 | |
| Lenovo ThinkPad X1 Carbon G11-21HNS00000 | |
| Average Intel Core i5-1335U (2878 - 4214, n=11) | |
| HP EliteBook 1040 G10 818N7EA | |
| AIDA64 / CPU PhotoWorxx | |
| Huawei MateBook X Pro 2023 | |
| Lenovo ThinkPad X1 Carbon G11-21HNS00000 | |
| Average of class Office (11090 - 65229, n=83, last 2 years) | |
| HP EliteBook 1040 G10 818N7EA | |
| Average Intel Core i5-1335U (13584 - 41123, n=11) | |
| Schenker Vision 14 2022 RTX 3050 Ti | |
| HP EliteBook 845 G10 818N0EA | |
系统性能
由于采用了现代处理器和 NVMe 固态硬盘,EliteBook 1040 G10 给人的主观性能印象非常好,在执行所有输入时都不会出现任何明显的延迟。在合成基准测试中,我们会发现它只使用了酷睿 i5 处理器,而大多数竞争对手都能取得稍好的成绩。不过,这在日常办公中完全没有问题。
CrossMark: Overall | Productivity | Creativity | Responsiveness
| PCMark 10 / Score | |
| Schenker Vision 14 2022 RTX 3050 Ti | |
| Average of class Office (2601 - 9298, n=67, last 2 years) | |
| HP EliteBook 845 G10 818N0EA | |
| Lenovo ThinkPad X1 Carbon G11-21HNS00000 | |
| Huawei MateBook X Pro 2023 | |
| Average Intel Core i5-1335U, Intel Iris Xe Graphics G7 80EUs (5068 - 5600, n=11) | |
| HP EliteBook 1040 G10 818N7EA | |
| PCMark 10 / Essentials | |
| Lenovo ThinkPad X1 Carbon G11-21HNS00000 | |
| Schenker Vision 14 2022 RTX 3050 Ti | |
| Average Intel Core i5-1335U, Intel Iris Xe Graphics G7 80EUs (9828 - 11912, n=11) | |
| Average of class Office (3245 - 11594, n=67, last 2 years) | |
| Huawei MateBook X Pro 2023 | |
| HP EliteBook 845 G10 818N0EA | |
| HP EliteBook 1040 G10 818N7EA | |
| PCMark 10 / Productivity | |
| Average of class Office (5336 - 17243, n=67, last 2 years) | |
| HP EliteBook 845 G10 818N0EA | |
| Schenker Vision 14 2022 RTX 3050 Ti | |
| Lenovo ThinkPad X1 Carbon G11-21HNS00000 | |
| Huawei MateBook X Pro 2023 | |
| Average Intel Core i5-1335U, Intel Iris Xe Graphics G7 80EUs (6196 - 7261, n=11) | |
| HP EliteBook 1040 G10 818N7EA | |
| PCMark 10 / Digital Content Creation | |
| Schenker Vision 14 2022 RTX 3050 Ti | |
| HP EliteBook 845 G10 818N0EA | |
| Average of class Office (2049 - 13541, n=67, last 2 years) | |
| Huawei MateBook X Pro 2023 | |
| Lenovo ThinkPad X1 Carbon G11-21HNS00000 | |
| Average Intel Core i5-1335U, Intel Iris Xe Graphics G7 80EUs (5361 - 6164, n=11) | |
| HP EliteBook 1040 G10 818N7EA | |
| CrossMark / Overall | |
| Huawei MateBook X Pro 2023 | |
| Lenovo ThinkPad X1 Carbon G11-21HNS00000 | |
| Schenker Vision 14 2022 RTX 3050 Ti | |
| Average of class Office (381 - 2010, n=75, last 2 years) | |
| HP EliteBook 1040 G10 818N7EA | |
| Average Intel Core i5-1335U, Intel Iris Xe Graphics G7 80EUs (1339 - 1599, n=11) | |
| HP EliteBook 845 G10 818N0EA | |
| CrossMark / Productivity | |
| Huawei MateBook X Pro 2023 | |
| Lenovo ThinkPad X1 Carbon G11-21HNS00000 | |
| Schenker Vision 14 2022 RTX 3050 Ti | |
| HP EliteBook 1040 G10 818N7EA | |
| Average of class Office (464 - 1880, n=75, last 2 years) | |
| Average Intel Core i5-1335U, Intel Iris Xe Graphics G7 80EUs (1337 - 1638, n=11) | |
| HP EliteBook 845 G10 818N0EA | |
| CrossMark / Creativity | |
| Huawei MateBook X Pro 2023 | |
| Lenovo ThinkPad X1 Carbon G11-21HNS00000 | |
| Schenker Vision 14 2022 RTX 3050 Ti | |
| Average of class Office (319 - 2361, n=75, last 2 years) | |
| HP EliteBook 1040 G10 818N7EA | |
| HP EliteBook 845 G10 818N0EA | |
| Average Intel Core i5-1335U, Intel Iris Xe Graphics G7 80EUs (1315 - 1620, n=11) | |
| CrossMark / Responsiveness | |
| Huawei MateBook X Pro 2023 | |
| Schenker Vision 14 2022 RTX 3050 Ti | |
| Lenovo ThinkPad X1 Carbon G11-21HNS00000 | |
| Average Intel Core i5-1335U, Intel Iris Xe Graphics G7 80EUs (1023 - 1868, n=11) | |
| Average of class Office (360 - 1820, n=75, last 2 years) | |
| HP EliteBook 1040 G10 818N7EA | |
| HP EliteBook 845 G10 818N0EA | |
| PCMark 10 Score | 5103 points | |
Help | ||
| AIDA64 / Memory Copy | |
| Lenovo ThinkPad X1 Carbon G11-21HNS00000 | |
| Average of class Office (20075 - 110930, n=80, last 2 years) | |
| Huawei MateBook X Pro 2023 | |
| HP EliteBook 1040 G10 818N7EA | |
| Schenker Vision 14 2022 RTX 3050 Ti | |
| Average Intel Core i5-1335U (22417 - 60884, n=11) | |
| HP EliteBook 845 G10 818N0EA | |
| AIDA64 / Memory Read | |
| Average of class Office (10084 - 128030, n=81, last 2 years) | |
| Huawei MateBook X Pro 2023 | |
| HP EliteBook 1040 G10 818N7EA | |
| Lenovo ThinkPad X1 Carbon G11-21HNS00000 | |
| Average Intel Core i5-1335U (23104 - 61555, n=11) | |
| Schenker Vision 14 2022 RTX 3050 Ti | |
| HP EliteBook 845 G10 818N0EA | |
| AIDA64 / Memory Write | |
| Lenovo ThinkPad X1 Carbon G11-21HNS00000 | |
| Huawei MateBook X Pro 2023 | |
| Average of class Office (20073 - 119858, n=81, last 2 years) | |
| HP EliteBook 1040 G10 818N7EA | |
| Average Intel Core i5-1335U (22936 - 72584, n=11) | |
| Schenker Vision 14 2022 RTX 3050 Ti | |
| HP EliteBook 845 G10 818N0EA | |
| AIDA64 / Memory Latency | |
| Huawei MateBook X Pro 2023 | |
| Average of class Office (7.6 - 162.9, n=76, last 2 years) | |
| HP EliteBook 845 G10 818N0EA | |
| Average Intel Core i5-1335U (78.6 - 112.8, n=11) | |
| Lenovo ThinkPad X1 Carbon G11-21HNS00000 | |
| Schenker Vision 14 2022 RTX 3050 Ti | |
| HP EliteBook 1040 G10 818N7EA | |
* ... smaller is better
DPC 延迟
在我们的标准化延迟测试(上网冲浪、播放 4K YouTube 视频和 CPU 负载)中,我们的测试装置显示出在使用实时音频应用时存在一些小限制。
| DPC Latencies / LatencyMon - interrupt to process latency (max), Web, Youtube, Prime95 | |
| Huawei MateBook X Pro 2023 | |
| Lenovo ThinkPad X1 Carbon G11-21HNS00000 | |
| HP EliteBook 1040 G10 818N7EA | |
| Schenker Vision 14 2022 RTX 3050 Ti | |
| HP EliteBook 845 G10 818N0EA | |
* ... smaller is better
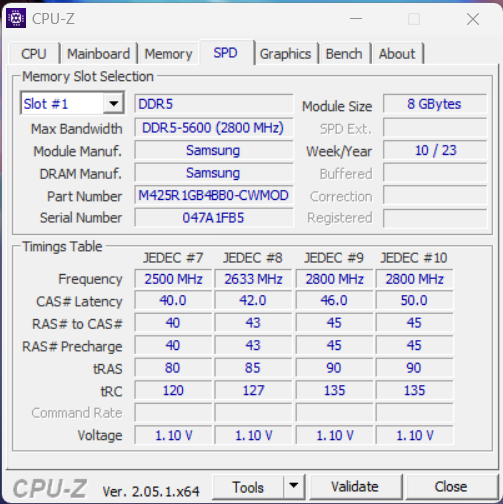
存储解决方案
我们的测试设备配备了 512GB 版本的三星 PM9B1 固态硬盘。虽然这是一款同样通过 PCIe 4.0 连接的 PCIe 4.0 硬盘,但整体性能更接近 PCIe 3.0 水平,最大传输速率约为 3.5 GB/s。虽然理论上应该可以达到更高的传输速率,但实际上硬盘的速度还是足够快的。首次启动笔记本电脑后,用户仍可使用 415 GB 的存储空间。你可以在 我们的技术部分.

* ... smaller is better
Disk Throttling: DiskSpd Read Loop, Queue Depth 8
图形卡
图形由著名的 Iris Xe Graphics G7但与酷睿 i5 处理器配合使用时,这只是较慢的版本,只有 80 EUs。酷睿 i7 处理器配备的是速度更快的 iGPU 版本,有 96 个 EU。此时,Xe Graphics G7 已在市场上销售了一段时间,虽然其性能足以满足日常办公任务和播放高分辨率视频的需要,但整体性能很低。如果你想在下班后玩一些游戏,这一点也会很明显,因为这时你通常只能玩低度或中度细节的游戏。另一方面,当前要求较高的游戏则根本无法流畅运行。
在持续负载的情况下,图形性能并不稳定,大约会下降 10%。另一方面,在电池工作状态下性能保持稳定。您可以在这里找到其他 GPU 基准测试 这里.
| 3DMark 11 Performance | 5864 points | |
| 3DMark Fire Strike Score | 3695 points | |
| 3DMark Time Spy Score | 1407 points | |
Help | ||
| Blender / v3.3 Classroom OPTIX/RTX | |
| Average of class Office (29 - 242, n=2, last 2 years) | |
| Schenker Vision 14 2022 RTX 3050 Ti | |
| Blender / v3.3 Classroom CUDA | |
| Average of class Office (53 - 214, n=3, last 2 years) | |
| Schenker Vision 14 2022 RTX 3050 Ti | |
| Blender / v3.3 Classroom CPU | |
| HP EliteBook 1040 G10 818N7EA | |
| Average Intel Iris Xe Graphics G7 80EUs (463 - 3047, n=53) | |
| Lenovo ThinkPad X1 Carbon G11-21HNS00000 | |
| Average of class Office (245 - 3219, n=75, last 2 years) | |
| Huawei MateBook X Pro 2023 | |
| Schenker Vision 14 2022 RTX 3050 Ti | |
| HP EliteBook 845 G10 818N0EA | |
* ... smaller is better
| The Witcher 3 - 1920x1080 Ultra Graphics & Postprocessing (HBAO+) | |
| Schenker Vision 14 2022 RTX 3050 Ti | |
| Average of class Office (14.8 - 28.1, n=3, last 2 years) | |
| Huawei MateBook X Pro 2023 | |
| HP EliteBook 845 G10 818N0EA | |
| Lenovo ThinkPad X1 Carbon G11-21HNS00000 | |
| HP EliteBook 1040 G10 818N7EA | |
| Final Fantasy XV Benchmark - 1920x1080 High Quality | |
| Schenker Vision 14 2022 RTX 3050 Ti | |
| Average of class Office (8.09 - 79.5, n=71, last 2 years) | |
| Lenovo ThinkPad X1 Carbon G11-21HNS00000 | |
| Huawei MateBook X Pro 2023 | |
| HP EliteBook 845 G10 818N0EA | |
| HP EliteBook 1040 G10 818N7EA | |
| Dota 2 Reborn - 1920x1080 ultra (3/3) best looking | |
| Schenker Vision 14 2022 RTX 3050 Ti | |
| Huawei MateBook X Pro 2023 | |
| Average of class Office (14.6 - 135, n=77, last 2 years) | |
| HP EliteBook 845 G10 818N0EA | |
| HP EliteBook 1040 G10 818N7EA | |
| Lenovo ThinkPad X1 Carbon G11-21HNS00000 | |
The Witcher 3 FPS Chart
| low | med. | high | ultra | |
|---|---|---|---|---|
| GTA V (2015) | 88.7 | 74.7 | 20 | 8.73 |
| The Witcher 3 (2015) | 73 | 47 | 25 | 11 |
| Dota 2 Reborn (2015) | 110.3 | 71.5 | 49.1 | 45.1 |
| Final Fantasy XV Benchmark (2018) | 32.4 | 18.4 | 13.8 | |
| X-Plane 11.11 (2018) | 36.8 | 28.4 | 20.6 | |
| Far Cry 5 (2018) | 36 | 20 | 19 | 18 |
| Strange Brigade (2018) | 83.4 | 34.6 | 26.1 | 20.7 |
| F1 2021 (2021) | 73.1 | 42.9 | 32.5 | 23.2 |
| F1 22 (2022) | 35.3 | 33.4 | 25 | |
| F1 23 (2023) | 29.4 | 28.2 | 19.9 |
排放 - 功率限制过高导致风扇噪音过大
噪音水平
EliteBook 使用单风扇,这对于 U 系列处理器来说确实完全够用。然而,短时间内超过 50 瓦的超高功率限制在这里也变得非常明显。两个高性能内核的时钟速度非常高,这也导致温度非常高。这也导致风扇即使在短时间的负载峰值时也会迅速打开,甚至在所有性能模式下都是如此。在极端情况下,这导致风扇噪音最大超过 40 dB(A),考虑到性能,这实在是太高了。但由于性能下降很快,风扇噪音在压力测试期间也会降低,变化范围在 31 到 35 dB(A)之间。在日常操作过程中,风扇偶尔也会打开,例如当多个浏览器标签处于活动状态时。我们希望惠普能对性能模式进行更多优化,限制更高效模式下的功耗。 现在你能做的最多就是进行一些手动调整。我们的测试设备不会产生任何其他电子噪音。
Noise level
| Idle |
| 23.1 / 23.1 / 23.1 dB(A) |
| Load |
| 35.3 / 41.1 dB(A) |
 | ||
30 dB silent 40 dB(A) audible 50 dB(A) loud |
||
min: | ||
| HP EliteBook 1040 G10 818N7EA Iris Xe G7 80EUs, i5-1335U, Samsung MZ9L4512HBLU-00BMV | HP EliteBook 845 G10 818N0EA Radeon 780M, R9 PRO 7940HS, SK hynix PC801 HFS001TEJ9X101N | Lenovo ThinkPad X1 Carbon G11-21HNS00000 Iris Xe G7 96EUs, i7-1365U, WDC PC SN810 1TB | Huawei MateBook X Pro 2023 Iris Xe G7 96EUs, i7-1360P | Schenker Vision 14 2022 RTX 3050 Ti GeForce RTX 3050 Ti Laptop GPU, i7-12700H, Samsung SSD 980 Pro 1TB MZ-V8P1T0BW | |
|---|---|---|---|---|---|
| Noise | -8% | -11% | -13% | -16% | |
| off / environment * (dB) | 23.1 | 25.3 -10% | 24.8 -7% | 25.4 -10% | 24.4 -6% |
| Idle Minimum * (dB) | 23.1 | 25.3 -10% | 24.8 -7% | 25.4 -10% | 24.4 -6% |
| Idle Average * (dB) | 23.1 | 25.3 -10% | 24.8 -7% | 25.4 -10% | 24.4 -6% |
| Idle Maximum * (dB) | 23.1 | 25.3 -10% | 28.5 -23% | 29.6 -28% | 27.8 -20% |
| Load Average * (dB) | 35.3 | 34.4 3% | 39.6 -12% | 42 -19% | 43.3 -23% |
| Witcher 3 ultra * (dB) | 37.3 | 43.4 -16% | 42.7 -14% | 48.2 -29% | |
| Load Maximum * (dB) | 41.1 | 43.4 -6% | 42.7 -4% | 40.9 -0% | 48.8 -19% |
* ... smaller is better
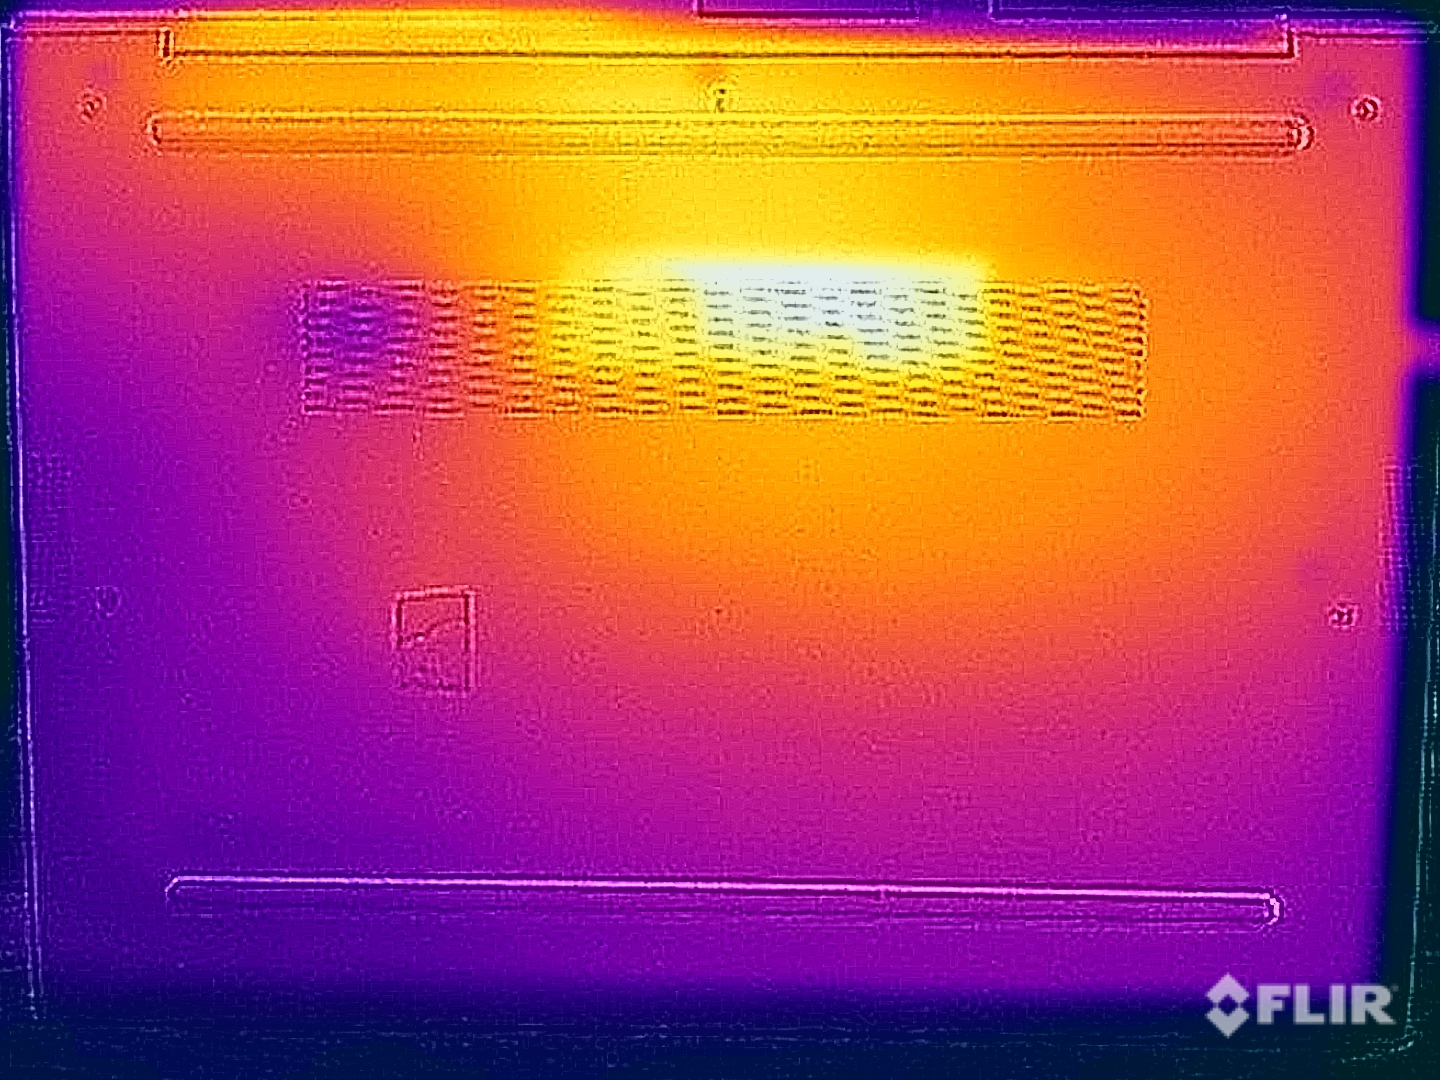
温度
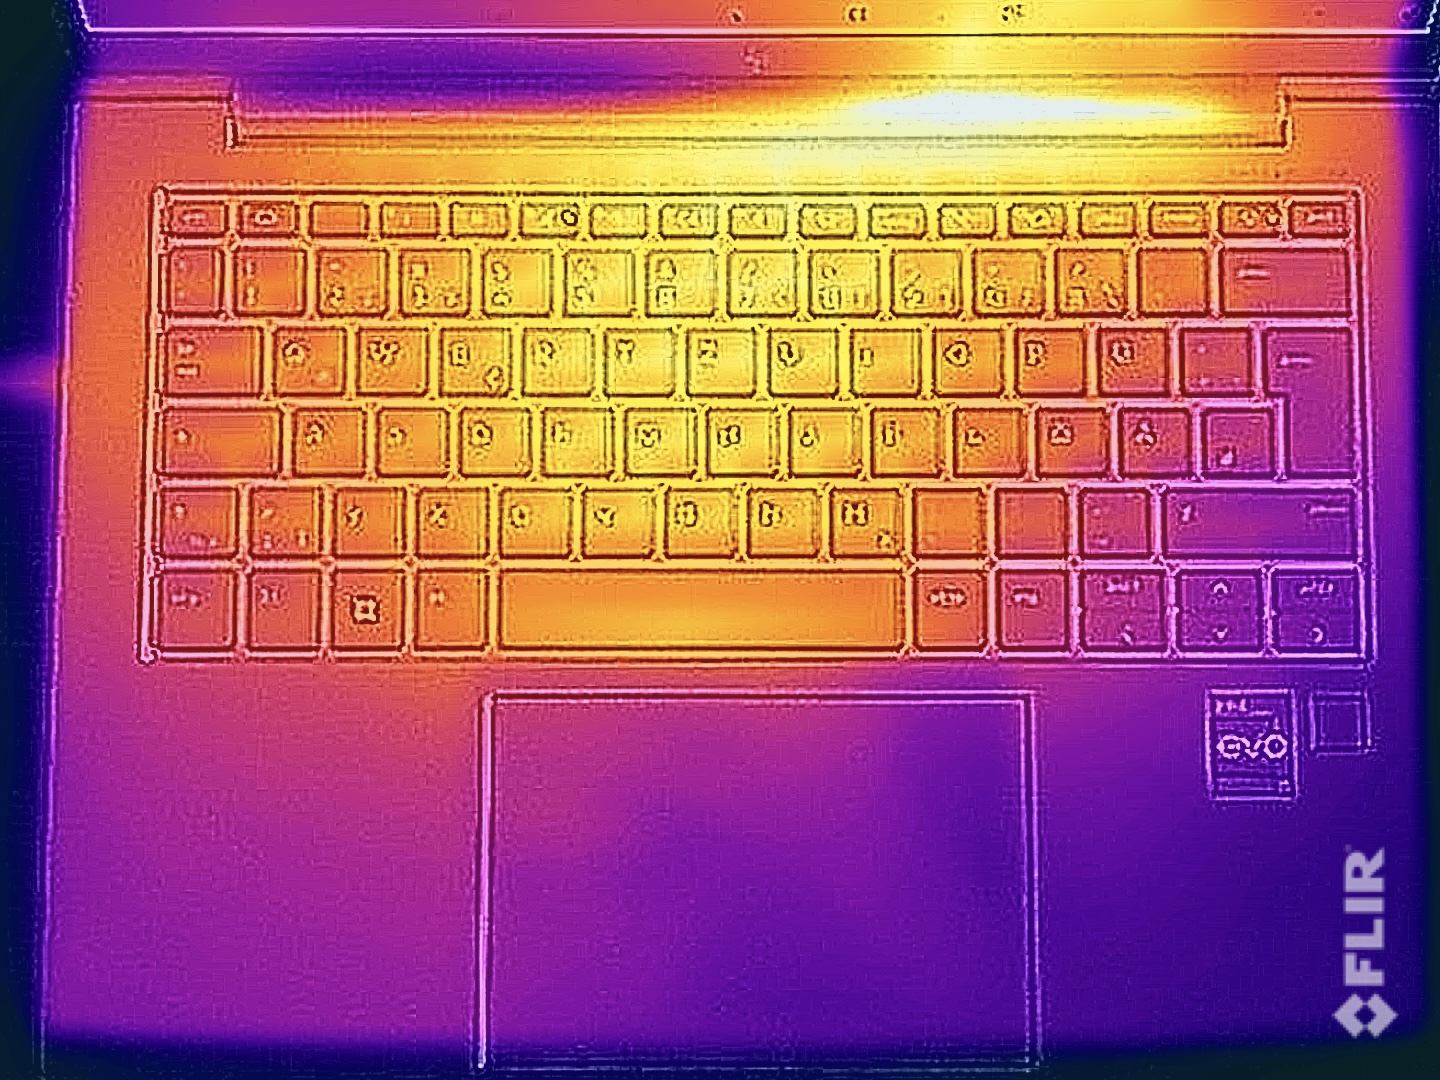
表面温度始终没有问题。在空闲运行和低负载情况下,这款商务笔记本电脑几乎不会发热,即使在最大负载情况下,我们在底部后部中央区域测得的最高温度也只有 45 °C(113 °F)。因此,您可以始终将 EliteBook 放在膝上运行。
在 CPU/GPU 综合负载的压力测试中,处理器的表现与纯 CPU 负载时相同。起初,功耗在短时间内迅速跃升至 50 瓦以上,但随后又迅速下降。几分钟后,功耗降至勉强超过 15 瓦的水平,之后一直保持在这一较低水平。
(±) The maximum temperature on the upper side is 40.5 °C / 105 F, compared to the average of 34.3 °C / 94 F, ranging from 21.2 to 62.5 °C for the class Office.
(-) The bottom heats up to a maximum of 45.8 °C / 114 F, compared to the average of 36.8 °C / 98 F
(+) In idle usage, the average temperature for the upper side is 25.1 °C / 77 F, compared to the device average of 29.5 °C / 85 F.
(±) Playing The Witcher 3, the average temperature for the upper side is 35.2 °C / 95 F, compared to the device average of 29.5 °C / 85 F.
(+) The palmrests and touchpad are cooler than skin temperature with a maximum of 30.9 °C / 87.6 F and are therefore cool to the touch.
(-) The average temperature of the palmrest area of similar devices was 27.5 °C / 81.5 F (-3.4 °C / -6.1 F).
| HP EliteBook 1040 G10 818N7EA Intel Core i5-1335U, Intel Iris Xe Graphics G7 80EUs | HP EliteBook 845 G10 818N0EA AMD Ryzen 9 PRO 7940HS, AMD Radeon 780M | Lenovo ThinkPad X1 Carbon G11-21HNS00000 Intel Core i7-1365U, Intel Iris Xe Graphics G7 96EUs | Huawei MateBook X Pro 2023 Intel Core i7-1360P, Intel Iris Xe Graphics G7 96EUs | Schenker Vision 14 2022 RTX 3050 Ti Intel Core i7-12700H, NVIDIA GeForce RTX 3050 Ti Laptop GPU | |
|---|---|---|---|---|---|
| Heat | -8% | -1% | -19% | -17% | |
| Maximum Upper Side * (°C) | 40.5 | 45.6 -13% | 44.4 -10% | 46.5 -15% | 48.4 -20% |
| Maximum Bottom * (°C) | 45.8 | 51.9 -13% | 45.3 1% | 44.7 2% | 57.1 -25% |
| Idle Upper Side * (°C) | 25.5 | 26.5 -4% | 24.9 2% | 34.9 -37% | 28.1 -10% |
| Idle Bottom * (°C) | 26.1 | 27 -3% | 25.7 2% | 32.9 -26% | 29 -11% |
* ... smaller is better
发言人
音响系统由四个扬声器组成,也能产生不错的音效,尤其是对于办公笔记本电脑而言。然而,竞争对手如 ThinkPad X1 Carbon G11等竞争对手,尤其是高品质的子笔记本电脑,如MateBook X Pro在这方面做得更好。
HP EliteBook 1040 G10 818N7EA audio analysis
(±) | speaker loudness is average but good (76.9 dB)
Bass 100 - 315 Hz
(-) | nearly no bass - on average 19.2% lower than median
(±) | linearity of bass is average (12.6% delta to prev. frequency)
Mids 400 - 2000 Hz
(+) | balanced mids - only 2.8% away from median
(+) | mids are linear (2.1% delta to prev. frequency)
Highs 2 - 16 kHz
(+) | balanced highs - only 3% away from median
(+) | highs are linear (5.9% delta to prev. frequency)
Overall 100 - 16.000 Hz
(±) | linearity of overall sound is average (16.7% difference to median)
Compared to same class
» 22% of all tested devices in this class were better, 7% similar, 71% worse
» The best had a delta of 7%, average was 21%, worst was 53%
Compared to all devices tested
» 29% of all tested devices were better, 7% similar, 64% worse
» The best had a delta of 4%, average was 23%, worst was 134%
Lenovo ThinkPad X1 Carbon G11-21HNS00000 audio analysis
(+) | speakers can play relatively loud (84.6 dB)
Bass 100 - 315 Hz
(-) | nearly no bass - on average 16% lower than median
(±) | linearity of bass is average (12.7% delta to prev. frequency)
Mids 400 - 2000 Hz
(+) | balanced mids - only 2% away from median
(+) | mids are linear (4.4% delta to prev. frequency)
Highs 2 - 16 kHz
(+) | balanced highs - only 2.7% away from median
(+) | highs are linear (6.3% delta to prev. frequency)
Overall 100 - 16.000 Hz
(+) | overall sound is linear (10.9% difference to median)
Compared to same class
» 2% of all tested devices in this class were better, 1% similar, 97% worse
» The best had a delta of 7%, average was 21%, worst was 53%
Compared to all devices tested
» 6% of all tested devices were better, 2% similar, 92% worse
» The best had a delta of 4%, average was 23%, worst was 134%
电源管理 - 高效的日常运行
耗电量
在空闲运行时,功耗值非常低,在显示屏亮度达到最大值时为 6.3 瓦。然而,在负载情况下,高功率限制开始变得明显。在压力测试中,65 瓦充电器甚至很快就达到了极限,但随后功耗很快就趋于平稳,约为 30 瓦。
| Off / Standby | |
| Idle | |
| Load |
|
Key:
min: | |
| HP EliteBook 1040 G10 818N7EA i5-1335U, Iris Xe G7 80EUs, Samsung MZ9L4512HBLU-00BMV, IPS, 1920x1200, 14" | HP EliteBook 845 G10 818N0EA R9 PRO 7940HS, Radeon 780M, SK hynix PC801 HFS001TEJ9X101N, IPS, 2560x1600, 14" | Lenovo ThinkPad X1 Carbon G11-21HNS00000 i7-1365U, Iris Xe G7 96EUs, WDC PC SN810 1TB, IPS, 1920x1200, 14" | Huawei MateBook X Pro 2023 i7-1360P, Iris Xe G7 96EUs, , IPS, 3120x2080, 14.2" | Schenker Vision 14 2022 RTX 3050 Ti i7-12700H, GeForce RTX 3050 Ti Laptop GPU, Samsung SSD 980 Pro 1TB MZ-V8P1T0BW, IPS, 2880x1800, 14" | Average Intel Iris Xe Graphics G7 80EUs | Average of class Office | |
|---|---|---|---|---|---|---|---|
| Power Consumption | -48% | -3% | -32% | -100% | -19% | -19% | |
| Idle Minimum * (Watt) | 2.8 | 4.3 -54% | 3.9 -39% | 4.1 -46% | 7.5 -168% | 4.49 ? -60% | 4.26 ? -52% |
| Idle Average * (Watt) | 6.1 | 10.1 -66% | 6.3 -3% | 6.6 -8% | 10.4 -70% | 7.4 ? -21% | 7.31 ? -20% |
| Idle Maximum * (Watt) | 6.3 | 11.2 -78% | 6.9 -10% | 8 -27% | 11.4 -81% | 9.26 ? -47% | 8.55 ? -36% |
| Load Average * (Watt) | 48.9 | 64.4 -32% | 41.8 15% | 61 -25% | 83.3 -70% | 36.6 ? 25% | 43.8 ? 10% |
| Witcher 3 ultra * (Watt) | 38.2 | 59.4 -55% | 33.2 13% | 56 -47% | 92.7 -143% | ||
| Load Maximum * (Watt) | 65.9 | 66.7 -1% | 63.4 4% | 90 -37% | 110.3 -67% | 61.7 ? 6% | 64.5 ? 2% |
* ... smaller is better
Power Consumption The Witcher 3 / Stress Test
Power Consumption With External Monitor
电池寿命
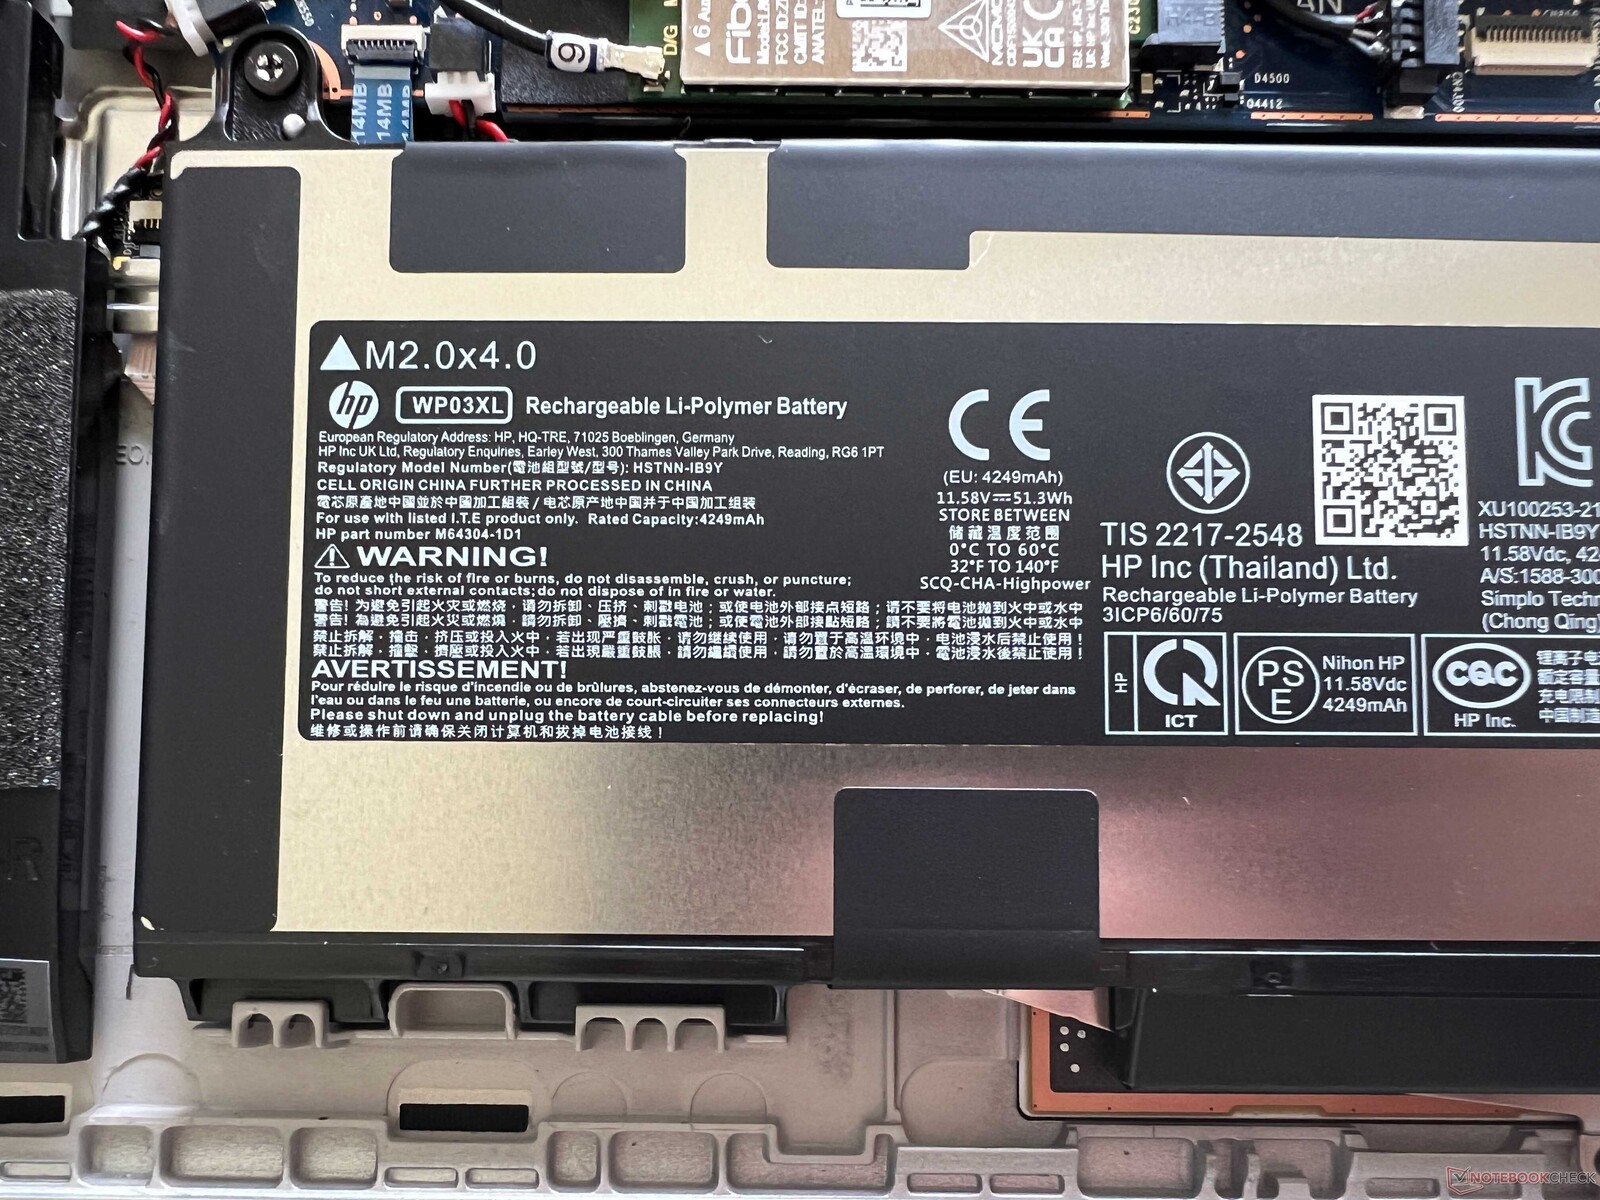
51 瓦时的电池可提供良好的电池续航时间,尽管一些竞争对手如 ThinkPad X1 Carbon G11甚至超过了这一水平。在调整亮度为 150 cd/m²(相当于我们测试设备最大亮度的 70%)的情况下,我们的 WLAN 测试可持续近 10 个小时,在全亮度情况下可持续近 8 个小时。在视频测试中(亮度同样为 150 cd/m²),它甚至能持续近 13 个小时。在打开笔记本电脑的情况下,完全充电大约需要 2 小时,34 分钟后可达到 50% 的电量。如果选择选配的 WQHD 面板,电池续航时间会缩短,这一点在 EliteBook 845 G10.
| HP EliteBook 1040 G10 818N7EA i5-1335U, Iris Xe G7 80EUs, 51 Wh | HP EliteBook 845 G10 818N0EA R9 PRO 7940HS, Radeon 780M, 51 Wh | Lenovo ThinkPad X1 Carbon G11-21HNS00000 i7-1365U, Iris Xe G7 96EUs, 57 Wh | Huawei MateBook X Pro 2023 i7-1360P, Iris Xe G7 96EUs, 60 Wh | Schenker Vision 14 2022 RTX 3050 Ti i7-12700H, GeForce RTX 3050 Ti Laptop GPU, 99.8 Wh | Average of class Office | |
|---|---|---|---|---|---|---|
| Battery runtime | -35% | 6% | -12% | -5% | 13% | |
| H.264 (h) | 12.7 | 9.3 -27% | 14.1 11% | 8.8 -31% | 11.1 -13% | 15.5 ? 22% |
| WiFi v1.3 (h) | 9.8 | 7.9 -19% | 14 43% | 9.7 -1% | 10.1 3% | 13.2 ? 35% |
| Load (h) | 2.2 | 0.9 -59% | 1.4 -36% | 2.1 -5% | 2.1 -5% | 1.808 ? -18% |
Pros
Cons
评语 - 具有一些弱点的商务旗舰产品

EliteBook 1040 G10 是惠普商务系列中的佼佼者,但我们的测试机在实际使用中却无法胜任这一角色。首先,当前的酷睿 i5 处理器速度并不是特别快,但如果你决定购买这款机型,就已经知道了这一点。但令人费解的是,惠普为什么允许处理器在所有性能配置文件中消耗高达 52 瓦的功率。不过,在日常办公操作中,系统性能还是不错的。
机箱质量很高,输入设备也非常好。此外,还有很好的维护选项,还可选配用于移动互联网(4G 或 5G)的 WWAN 模块。不过,低功耗显示屏仍然与预期稍有差距,因为明显达不到宣传的亮度,而且在日常操作中明显感觉响应时间较慢。虽然可以为 EliteBook 845 G10 选配 500 尼特和 120 赫兹的 WQHD 面板 EliteBook 845 G10但根据数据表,1040 G10 并非如此。
惠普EliteBook 1040 G10拥有高品质的镁合金外壳、丰富的安全功能和现代化的连接。尽管价格不菲,但其他特性并不令人信服,总体而言,EliteBook 845 G10 是更好的选择。
在我们看来,EliteBook 1040 G10 最强劲的竞争对手是 EliteBook 845 G10。虽然它比 EliteBook 1040 G10 重 160 克(约 5.6 盎司),但它采用了速度更快的 AMD 处理器,还可选配更出色的显示屏。我们目前有一个较弱的版本,配备了 Ryzen 7 7840U和 400 尼特显示屏的较弱版本进行了测试,结果表明其功耗限制调整得更好,在 WLAN 测试中的运行时间延长了 2-3 个小时。在我们的测试中 ThinkPad X1 Carbon G11在性能和电池续航时间方面也具有一定优势。
价格和供应情况
可定制的 EliteBook 1040 G10 可直接从惠普在线商店购买,起价 1250 美元。亚马逊上也有一些配置,如 WUXGA 版本的售价约为 1,740 美元。
HP EliteBook 1040 G10 818N7EA
- 09/07/2023 v7 (old)
Andreas Osthoff
Transparency
The selection of devices to be reviewed is made by our editorial team. The test sample was provided to the author as a loan by the manufacturer or retailer for the purpose of this review. The lender had no influence on this review, nor did the manufacturer receive a copy of this review before publication. There was no obligation to publish this review. As an independent media company, Notebookcheck is not subjected to the authority of manufacturers, retailers or publishers.
This is how Notebookcheck is testing
Every year, Notebookcheck independently reviews hundreds of laptops and smartphones using standardized procedures to ensure that all results are comparable. We have continuously developed our test methods for around 20 years and set industry standards in the process. In our test labs, high-quality measuring equipment is utilized by experienced technicians and editors. These tests involve a multi-stage validation process. Our complex rating system is based on hundreds of well-founded measurements and benchmarks, which maintains objectivity. Further information on our test methods can be found here.
Price comparison

