宏碁威武骑士A715-72G (i7-8750H, GTX 1050 Ti, SSD, FHD) 笔记本电脑评测

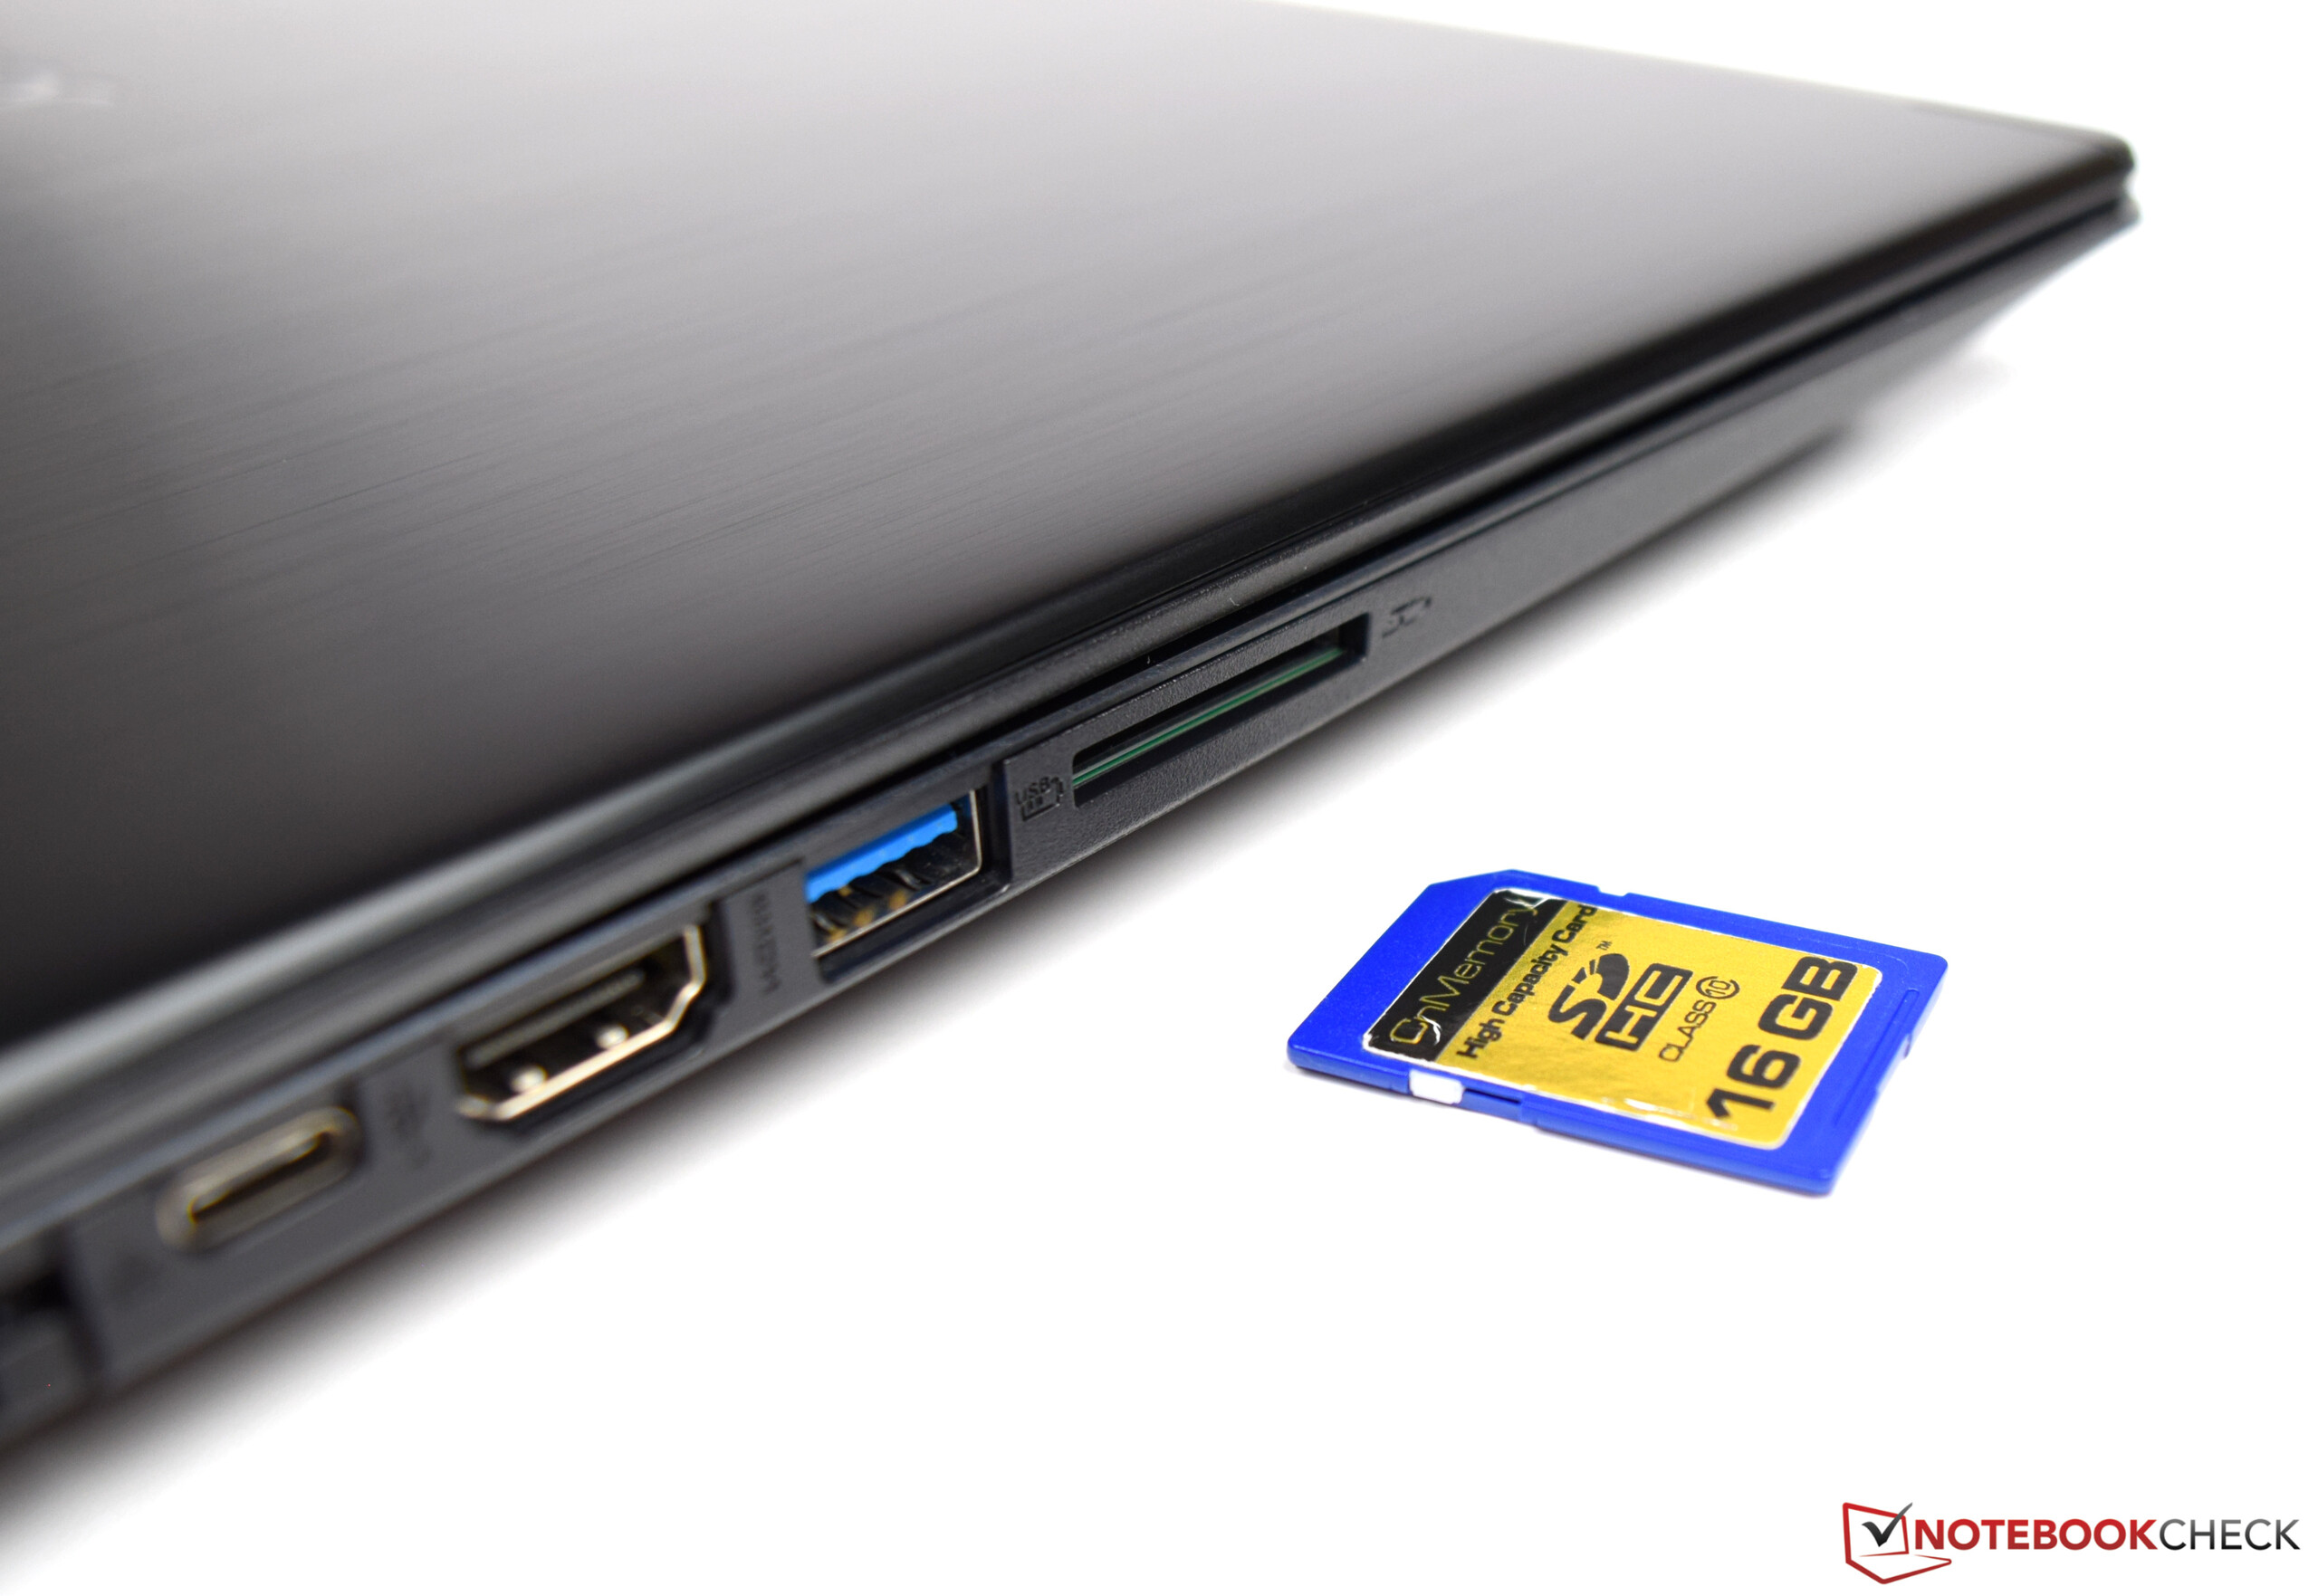
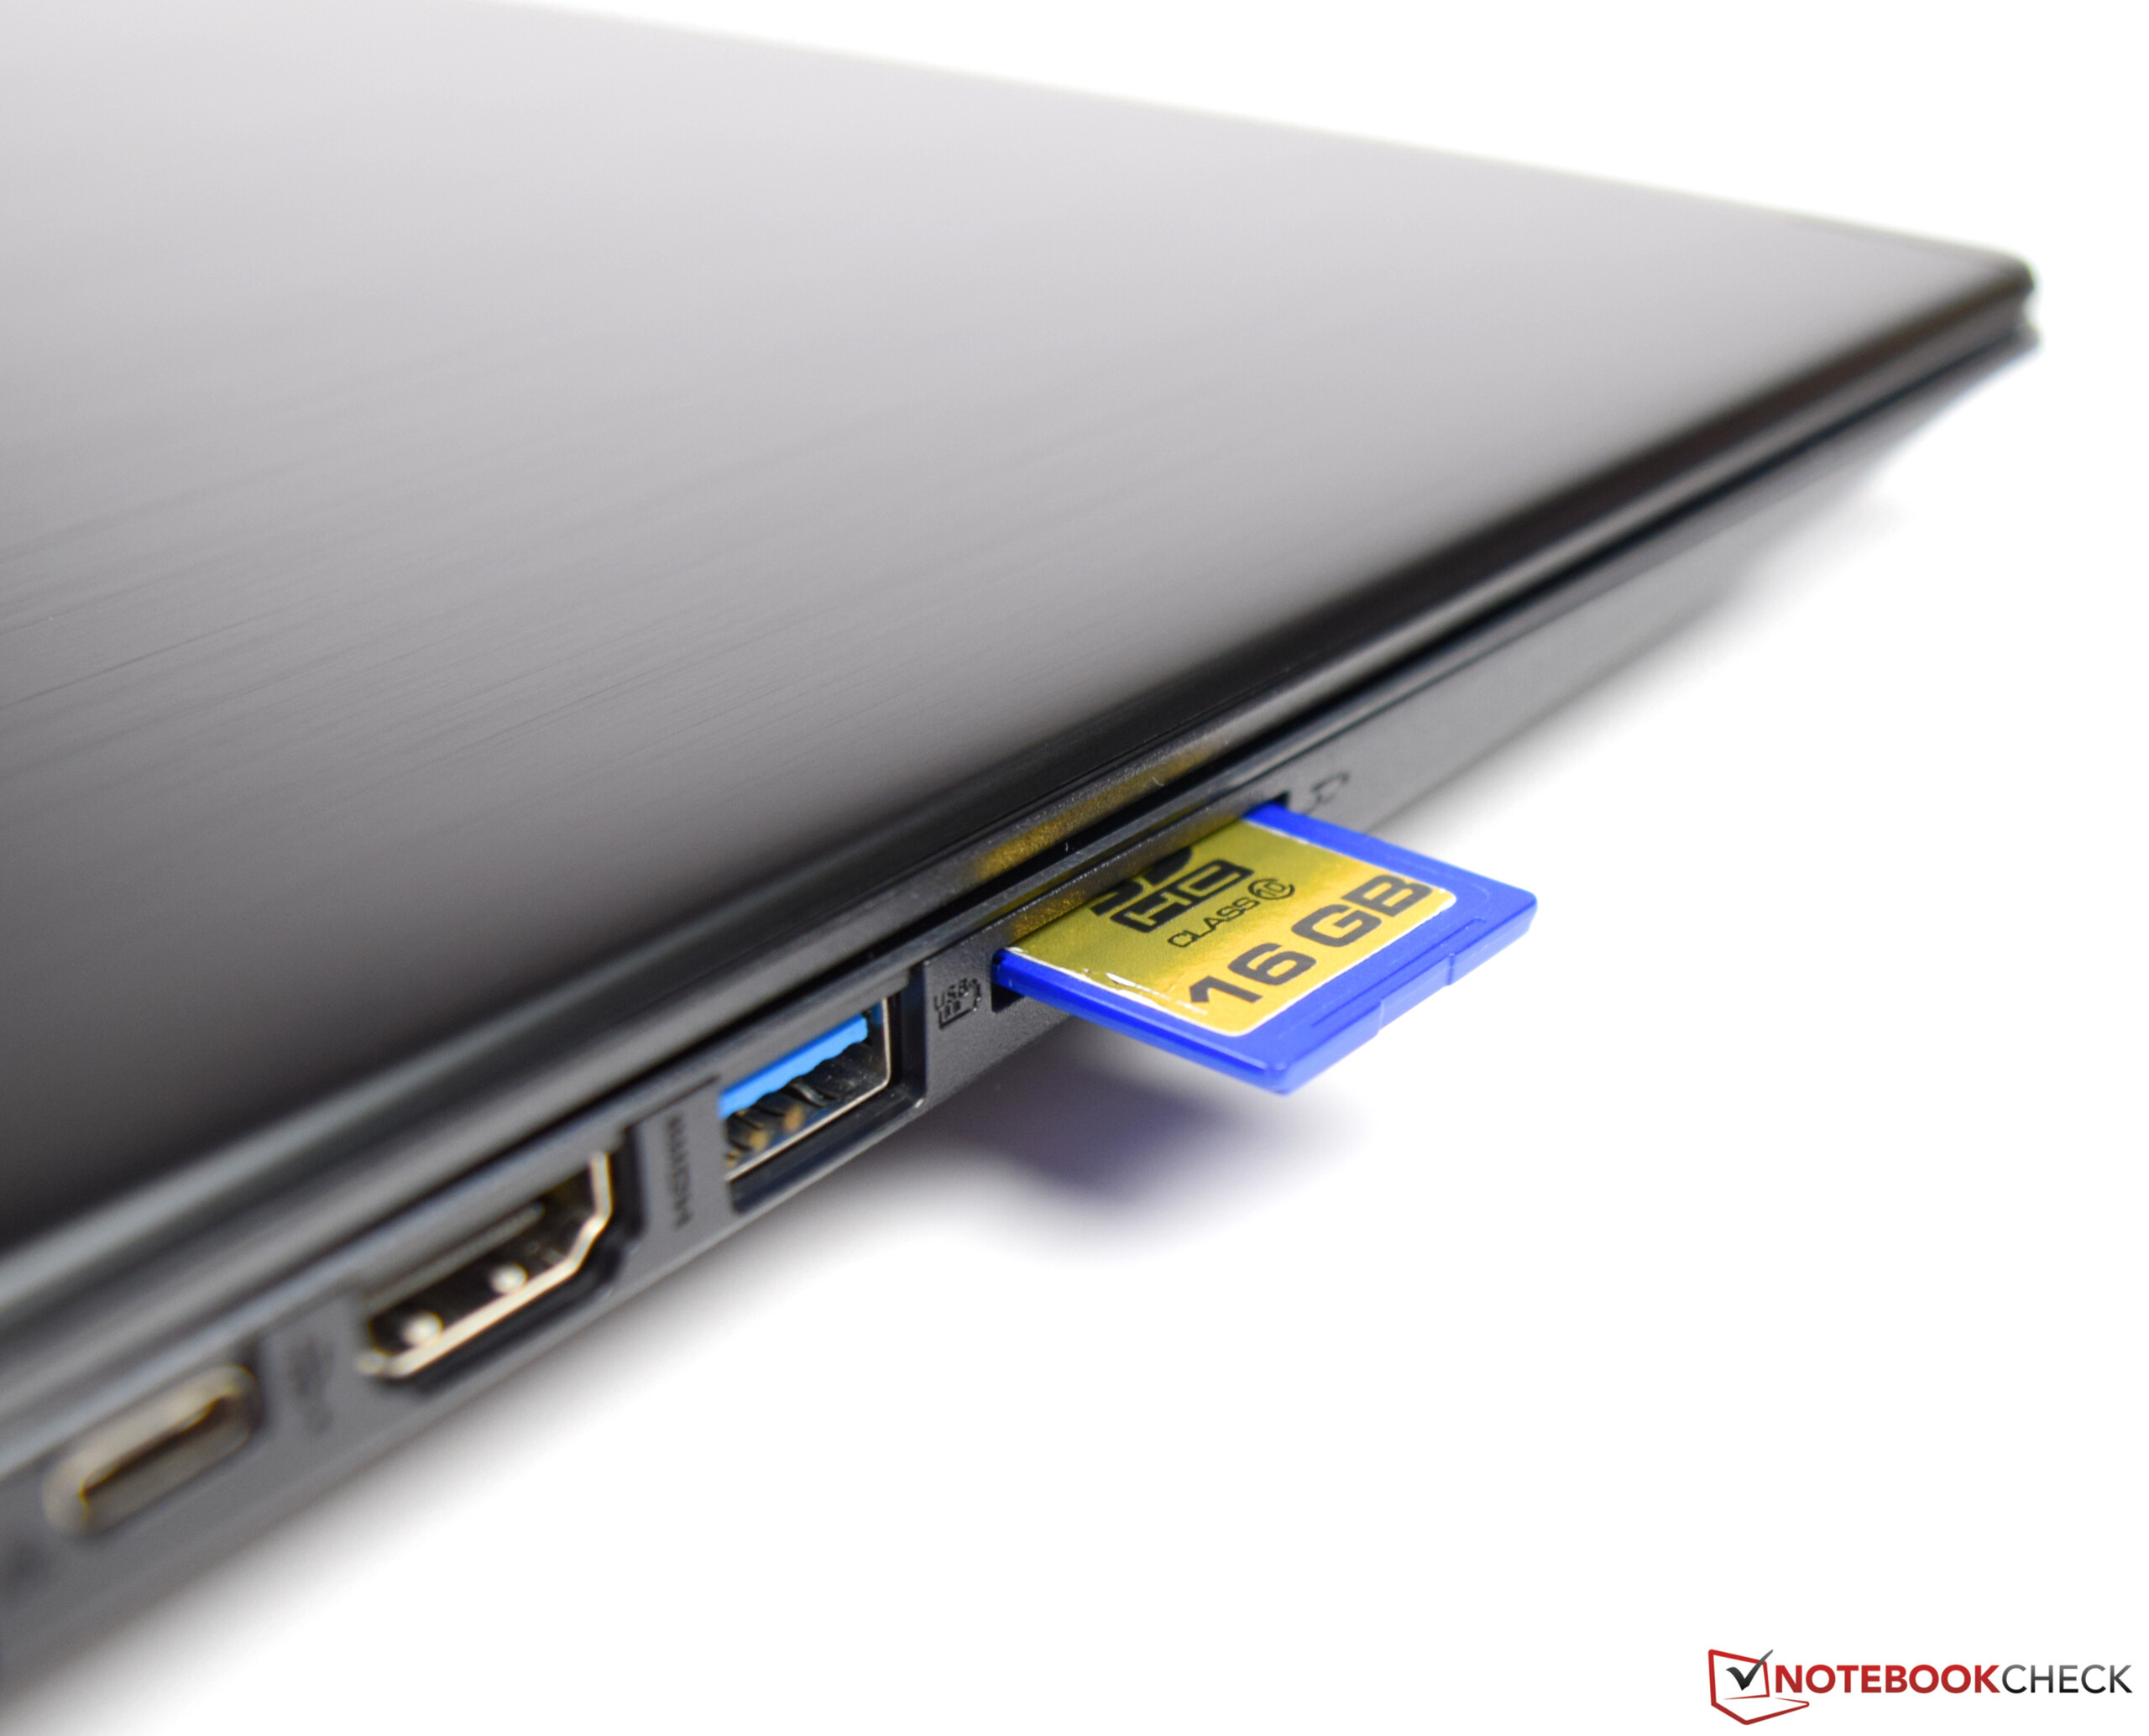
| SD Card Reader | |
| average JPG Copy Test (av. of 3 runs) | |
| Average of class Multimedia (23 - 531, n=43, last 2 years) | |
| Acer Aspire 7 A715-71G-53TU (Toshiba Exceria Pro SDXC 64 GB UHS-II) | |
| HP Pavilion Gaming 15-cx0003ng (Toshiba Exceria Pro SDXC 64 GB UHS-II) | |
| Acer Aspire 7 A715-72G-704Q (Toshiba Exceria Pro SDXC 64 GB UHS-II) | |
| Dell G3 15 3579 (Toshiba Exceria Pro SDXC 64 GB UHS-II) | |
| maximum AS SSD Seq Read Test (1GB) | |
| Average of class Multimedia (27.9 - 1455, n=42, last 2 years) | |
| Acer Aspire 7 A715-71G-53TU (Toshiba Exceria Pro SDXC 64 GB UHS-II) | |
| HP Pavilion Gaming 15-cx0003ng (Toshiba Exceria Pro SDXC 64 GB UHS-II) | |
| Acer Aspire 7 A715-72G-704Q (Toshiba Exceria Pro SDXC 64 GB UHS-II) | |
| Dell G3 15 3579 (Toshiba Exceria Pro SDXC 64 GB UHS-II) | |
| |||||||||||||||||||||||||
Brightness Distribution: 81 %
Center on Battery: 276 cd/m²
Contrast: 500:1 (Black: 0.56 cd/m²)
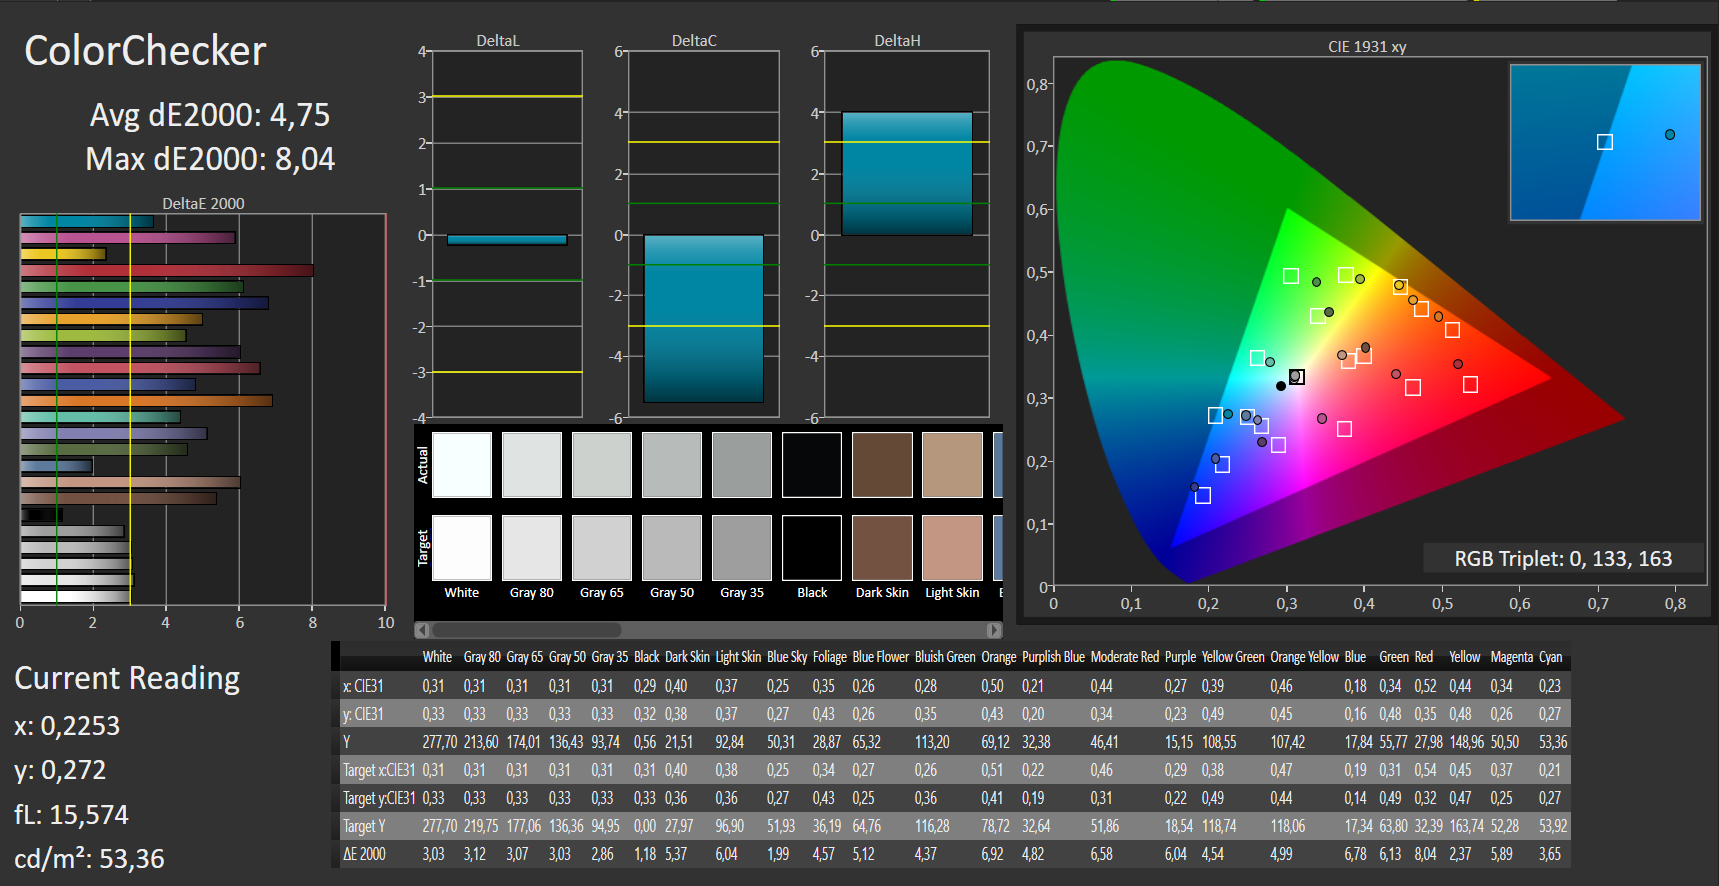
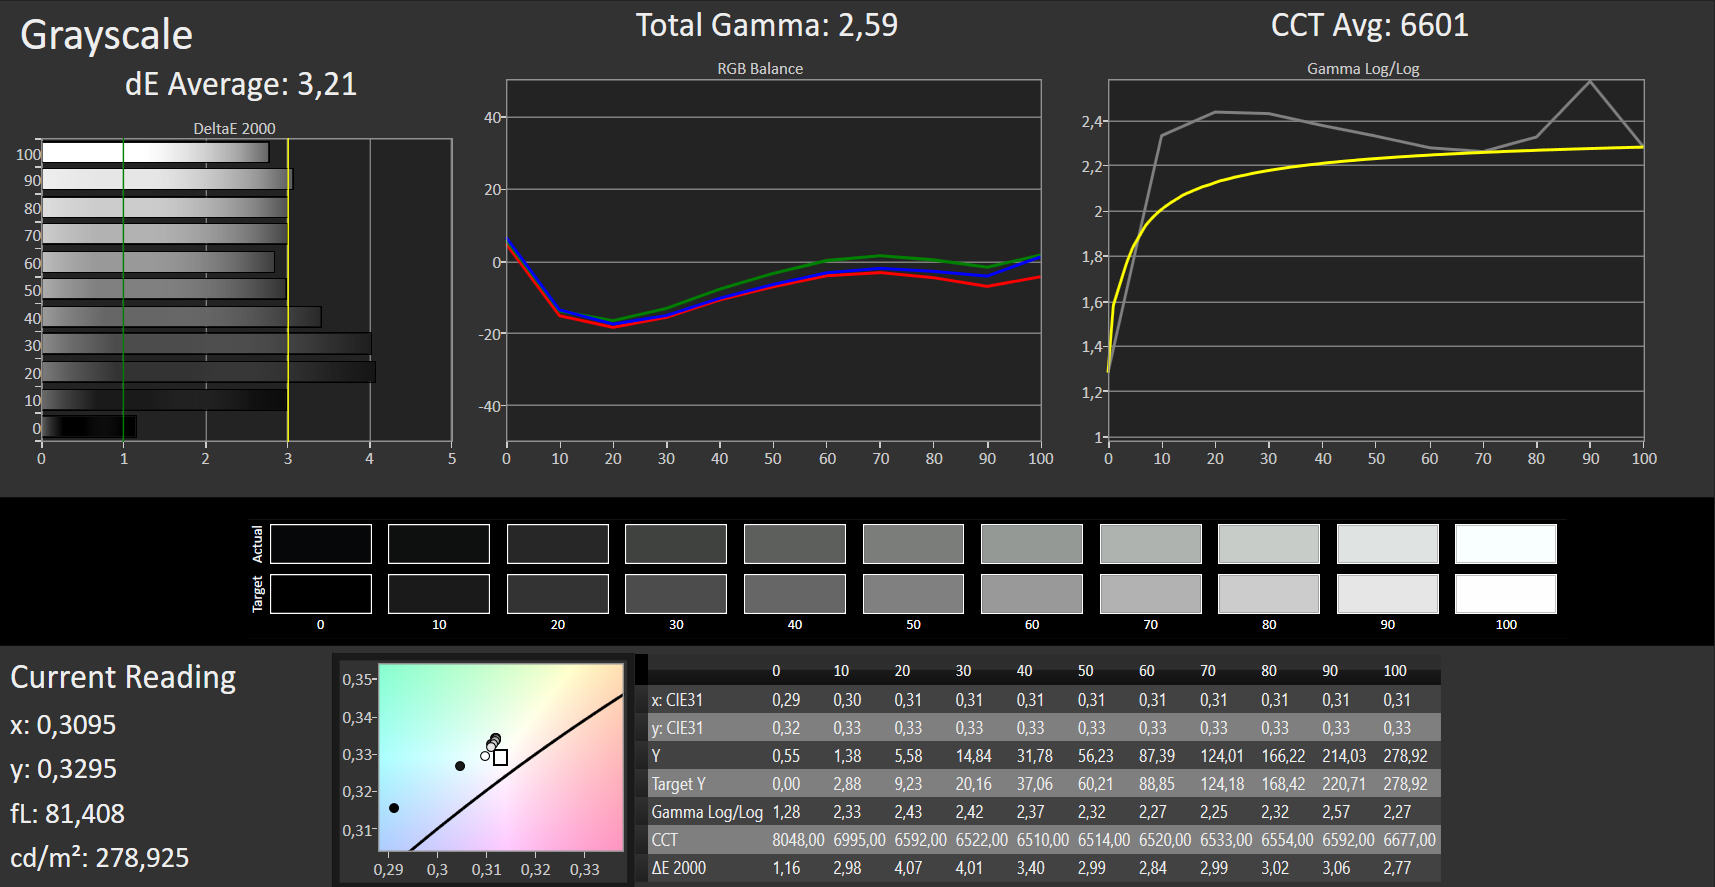
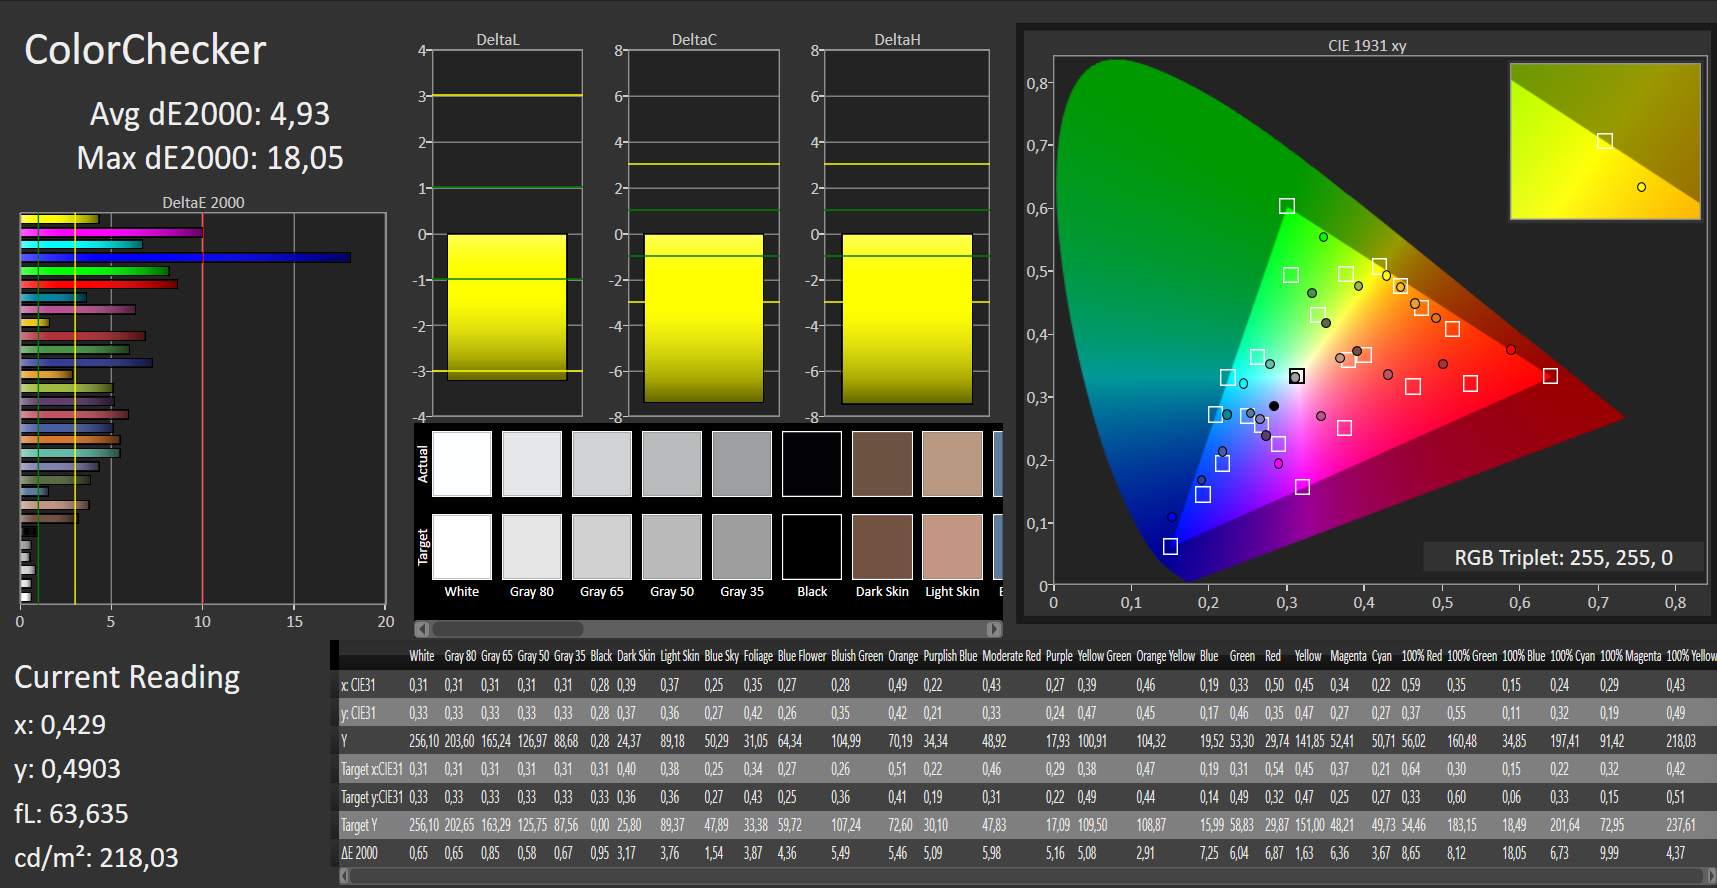
ΔE ColorChecker Calman: 4.75 | ∀{0.5-29.43 Ø4.72}
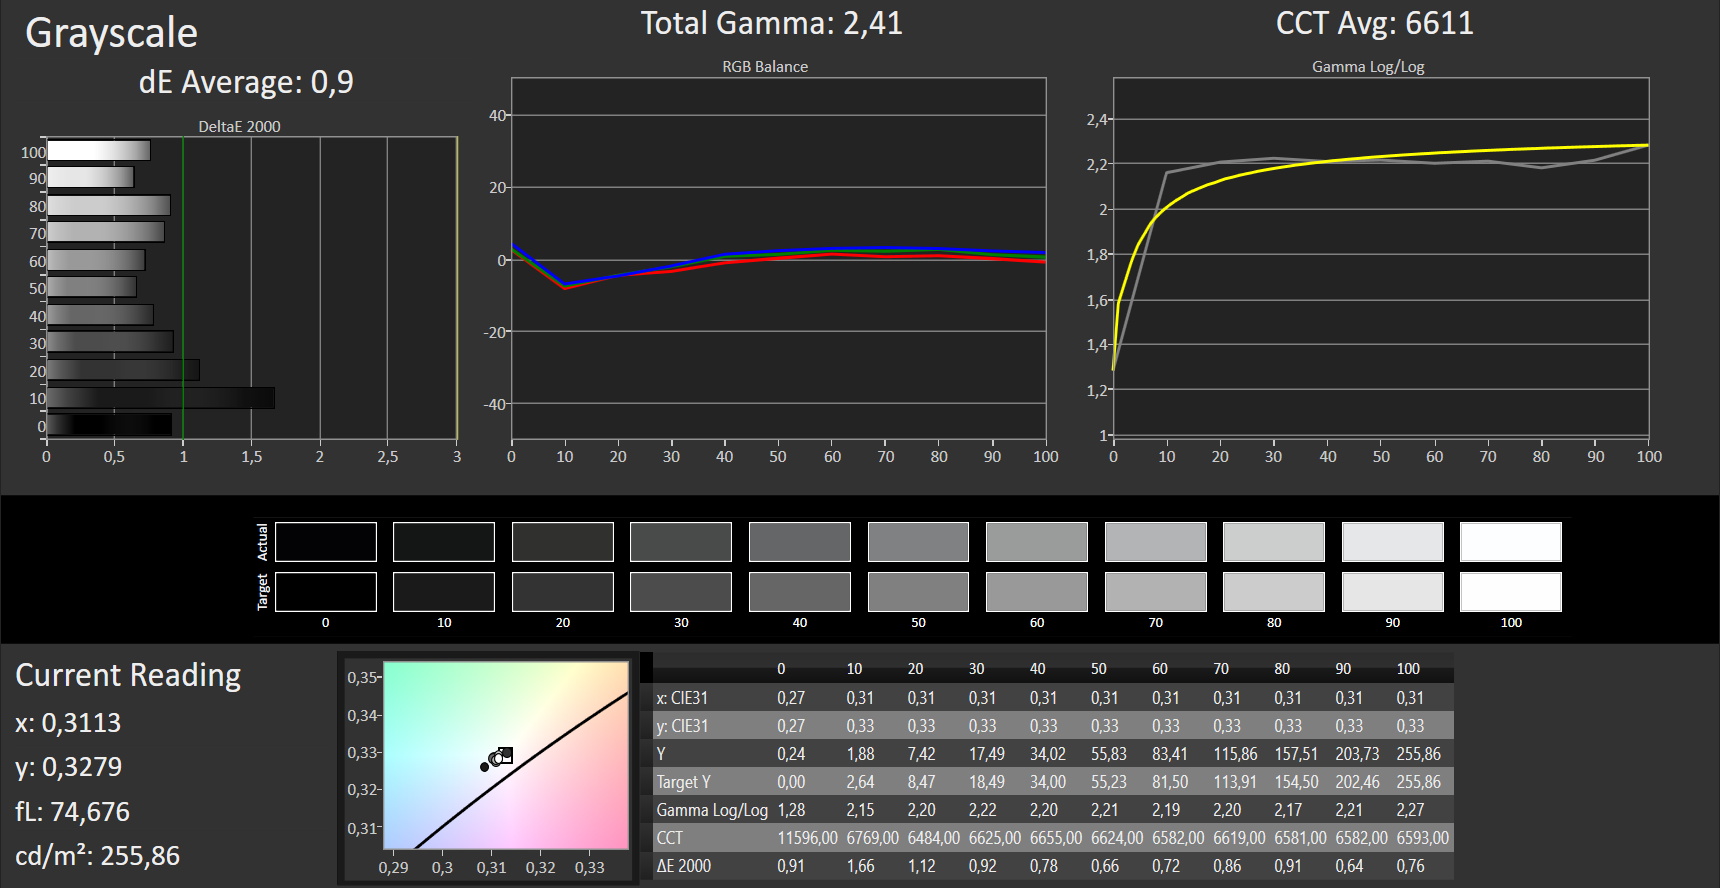
calibrated: 4.93
ΔE Greyscale Calman: 3.21 | ∀{0.09-98 Ø4.97}
57% sRGB (Argyll 1.6.3 3D)
36% AdobeRGB 1998 (Argyll 1.6.3 3D)
39.65% AdobeRGB 1998 (Argyll 3D)
57.5% sRGB (Argyll 3D)
38.34% Display P3 (Argyll 3D)
Gamma: 2.59
CCT: 6601 K
| Acer Aspire 7 A715-72G-704Q IPS, 1920x1080, 15.6" | Acer Aspire 7 A715-71G-53TU a-Si TFT-LCD, IPS, 1920x1080, 15.6" | HP Pavilion Gaming 15-cx0003ng IPS, 1920x1080, 15.6" | Dell G3 15 3579 IPS, 1920x1080, 15.6" | Lenovo Legion Y730-15ICH i5-8300H IPS, 1920x1080, 15.6" | |
|---|---|---|---|---|---|
| Display | 5% | 4% | 0% | 60% | |
| Display P3 Coverage (%) | 38.34 | 40.53 6% | 39.72 4% | 38.48 0% | 65.9 72% |
| sRGB Coverage (%) | 57.5 | 59.9 4% | 59.3 3% | 57.9 1% | 85.5 49% |
| AdobeRGB 1998 Coverage (%) | 39.65 | 41.87 6% | 41.04 4% | 39.75 0% | 62.5 58% |
| Response Times | -45% | -32% | 5% | -45% | |
| Response Time Grey 50% / Grey 80% * (ms) | 35 ? | 49 ? -40% | 47 ? -34% | 32.4 ? 7% | 43.2 ? -23% |
| Response Time Black / White * (ms) | 24 ? | 36 ? -50% | 31 ? -29% | 23.2 ? 3% | 40 ? -67% |
| PWM Frequency (Hz) | 20000 ? | 208 ? | 21740 ? | ||
| Screen | 14% | 21% | -7% | 11% | |
| Brightness middle (cd/m²) | 280 | 267 -5% | 241 -14% | 208.2 -26% | 286.5 2% |
| Brightness (cd/m²) | 248 | 250 1% | 236 -5% | 203 -18% | 269 8% |
| Brightness Distribution (%) | 81 | 82 1% | 75 -7% | 81 0% | 84 4% |
| Black Level * (cd/m²) | 0.56 | 0.31 45% | 0.15 73% | 0.34 39% | 0.33 41% |
| Contrast (:1) | 500 | 861 72% | 1607 221% | 612 22% | 868 74% |
| Colorchecker dE 2000 * | 4.75 | 4.65 2% | 4.85 -2% | 4.65 2% | 6.3 -33% |
| Colorchecker dE 2000 max. * | 8.04 | 8.2 -2% | 8.82 -10% | 15.99 -99% | 10.01 -25% |
| Colorchecker dE 2000 calibrated * | 4.93 | 3.84 22% | 4.17 15% | ||
| Greyscale dE 2000 * | 3.21 | 2.65 17% | 5.15 -60% | 4.1 -28% | 5.6 -74% |
| Gamma | 2.59 85% | 2.44 90% | 2.49 88% | 2.3 96% | 2.23 99% |
| CCT | 6601 98% | 6820 95% | 7042 92% | 7352 88% | 6822 95% |
| Color Space (Percent of AdobeRGB 1998) (%) | 36 | 38 6% | 38 6% | 36.7 2% | 55.7 55% |
| Color Space (Percent of sRGB) (%) | 57 | 59 4% | 59 4% | 57.9 2% | 85.1 49% |
| Total Average (Program / Settings) | -9% /
4% | -2% /
10% | -1% /
-4% | 9% /
13% |
* ... smaller is better
Screen Flickering / PWM (Pulse-Width Modulation)
| Screen flickering / PWM not detected | 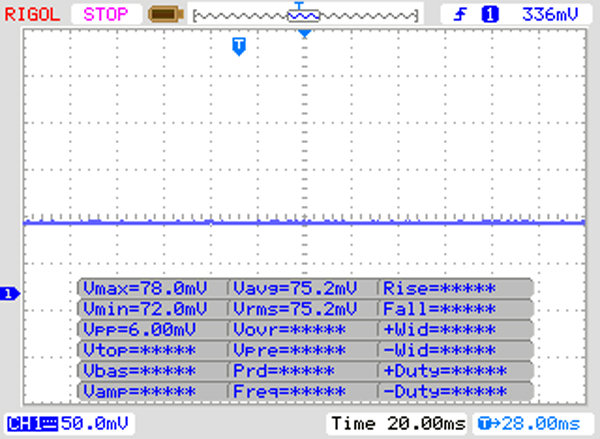 | ||
In comparison: 52 % of all tested devices do not use PWM to dim the display. If PWM was detected, an average of 7763 (minimum: 5 - maximum: 343500) Hz was measured. | |||

Display Response Times
| ↔ Response Time Black to White | ||
|---|---|---|
| 24 ms ... rise ↗ and fall ↘ combined | ↗ 14 ms rise | 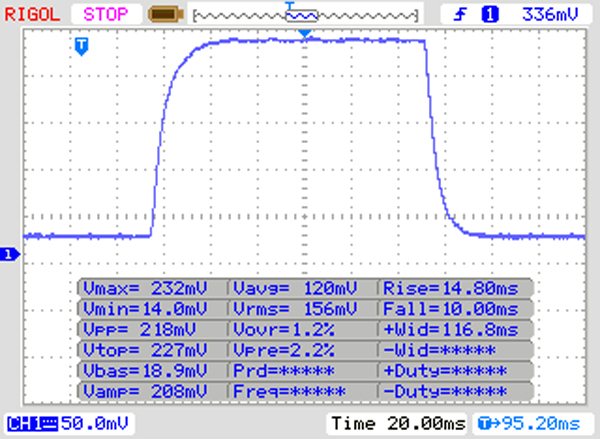 |
| ↘ 10 ms fall | ||
| The screen shows good response rates in our tests, but may be too slow for competitive gamers. In comparison, all tested devices range from 0.1 (minimum) to 240 (maximum) ms. » 54 % of all devices are better. This means that the measured response time is worse than the average of all tested devices (19.8 ms). | ||
| ↔ Response Time 50% Grey to 80% Grey | ||
| 35 ms ... rise ↗ and fall ↘ combined | ↗ 17 ms rise | 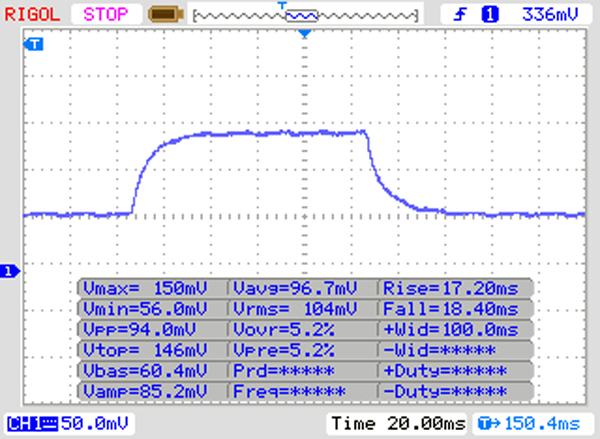 |
| ↘ 18 ms fall | ||
| The screen shows slow response rates in our tests and will be unsatisfactory for gamers. In comparison, all tested devices range from 0.165 (minimum) to 636 (maximum) ms. » 49 % of all devices are better. This means that the measured response time is worse than the average of all tested devices (31 ms). | ||
| Geekbench 3 | |
| 32 Bit Multi-Core Score | |
| Average Intel Core i7-8750H (20725 - 22665, n=13) | |
| HP Pavilion Gaming 15-cx0003ng | |
| Acer Aspire 7 A715-72G-704Q | |
| 32 Bit Single-Core Score | |
| Average Intel Core i7-8750H (3734 - 4163, n=13) | |
| HP Pavilion Gaming 15-cx0003ng | |
| Acer Aspire 7 A715-72G-704Q | |
| Geekbench 4.0 | |
| 64 Bit Multi-Core Score | |
| Average of class Multimedia (n=1last 2 years) | |
| Average Intel Core i7-8750H (17048 - 22006, n=8) | |
| HP Pavilion Gaming 15-cx0003ng | |
| Acer Aspire 7 A715-72G-704Q | |
| 64 Bit Single-Core Score | |
| Average of class Multimedia (n=1last 2 years) | |
| HP Pavilion Gaming 15-cx0003ng | |
| Average Intel Core i7-8750H (4548 - 4997, n=8) | |
| Acer Aspire 7 A715-72G-704Q | |
| Geekbench 4.4 | |
| 64 Bit Multi-Core Score | |
| Average of class Multimedia (n=1last 2 years) | |
| Average Intel Core i7-8750H (17709 - 23313, n=17) | |
| HP Pavilion Gaming 15-cx0003ng | |
| Acer Aspire 7 A715-72G-704Q | |
| 64 Bit Single-Core Score | |
| Average of class Multimedia (n=1last 2 years) | |
| HP Pavilion Gaming 15-cx0003ng | |
| Average Intel Core i7-8750H (4669 - 5146, n=17) | |
| Acer Aspire 7 A715-72G-704Q | |
| Mozilla Kraken 1.1 - Total | |
| Dell G3 15 3579 (Edge 42.17134.1.0) | |
| Acer Aspire 7 A715-72G-704Q (Edge 44) | |
| Lenovo Legion Y730-15ICH i5-8300H (Edge 42.17134.1.0) | |
| Average Intel Core i7-8750H (695 - 1272, n=50) | |
| HP Pavilion Gaming 15-cx0003ng | |
| Acer Aspire 7 A715-71G-53TU (EDGE: 41.16299.15.0) | |
| Average of class Multimedia (228 - 835, n=72, last 2 years) | |
| Octane V2 - Total Score | |
| Average of class Multimedia (64079 - 153175, n=33, last 2 years) | |
| Acer Aspire 7 A715-71G-53TU (EDGE: 41.16299.15.0) | |
| Acer Aspire 7 A715-72G-704Q (Edge 44) | |
| HP Pavilion Gaming 15-cx0003ng | |
| Average Intel Core i7-8750H (27460 - 44549, n=47) | |
| Lenovo Legion Y730-15ICH i5-8300H (Edge 42.17134.1.0) | |
| Dell G3 15 3579 (Edge 42.17134.1.0) | |
| JetStream 1.1 - 1.1 Total | |
| Average of class Multimedia (n=1last 2 years) | |
| Acer Aspire 7 A715-71G-53TU (EDGE: 41.16299.15.0) | |
| Acer Aspire 7 A715-72G-704Q (Edge 44) | |
| HP Pavilion Gaming 15-cx0003ng (Edge 44) | |
| Average Intel Core i7-8750H (205 - 299, n=49) | |
| Dell G3 15 3579 (Edge 42.17134.1.0) | |
| Lenovo Legion Y730-15ICH i5-8300H (Edge 42.17134.1.0) | |
* ... smaller is better
| PCMark 7 Score | 6380 points | |
| PCMark 8 Home Score Accelerated v2 | 4125 points | |
| PCMark 8 Creative Score Accelerated v2 | 5255 points | |
| PCMark 8 Work Score Accelerated v2 | 5310 points | |
| PCMark 10 Score | 5162 points | |
Help | ||

| Acer Aspire 7 A715-72G-704Q Intel SSD 760p SSDPEKKW256G8 | Acer Aspire 7 A715-71G-53TU Kingston RBUSNS8180DS3128GH | HP Pavilion Gaming 15-cx0003ng Intel Optane 16 GB MEMPEK1J016GAH + HGST HTS721010A9E630 1 TB HDD | Dell G3 15 3579 Seagate Mobile HDD 1TB ST1000LX015-1U7172 | Lenovo Legion Y730-15ICH i5-8300H Intel Optane 16 GB MEMPEK1J016GAL + HGST ST1000LM049 1 TB HDD | Average Intel SSD 760p SSDPEKKW256G8 | |
|---|---|---|---|---|---|---|
| CrystalDiskMark 5.2 / 6 | -41% | -38% | -96% | -28% | 35% | |
| Write 4K (MB/s) | 103.4 | 74.3 -28% | 59.2 -43% | 0.202 -100% | 66.9 -35% | 148.8 ? 44% |
| Read 4K (MB/s) | 56 | 18.65 -67% | 91.3 63% | 0.461 -99% | 118.5 112% | 64.8 ? 16% |
| Write Seq (MB/s) | 808 | 405.8 -50% | 158.3 -80% | 53.5 -93% | 157.7 -80% | 956 ? 18% |
| Read Seq (MB/s) | 1939 | 480.7 -75% | 880 -55% | 107.2 -94% | 886 -54% | 2325 ? 20% |
| Write 4K Q32T1 (MB/s) | 281.3 | 235.7 -16% | 161.8 -42% | 0.882 -100% | 162.4 -42% | 381 ? 35% |
| Read 4K Q32T1 (MB/s) | 326.5 | 307.2 -6% | 286.5 -12% | 1.057 -100% | 353 8% | 462 ? 42% |
| Write Seq Q32T1 (MB/s) | 474.1 | 451.6 -5% | 159.8 -66% | 63.7 -87% | 159.8 -66% | 954 ? 101% |
| Read Seq Q32T1 (MB/s) | 2735 | 520 -81% | 929 -66% | 77.1 -97% | 926 -66% | 2848 ? 4% |
| 3DMark 06 Standard Score | 34938 points | |
| 3DMark 11 Performance | 9518 points | |
| 3DMark Ice Storm Standard Score | 108541 points | |
| 3DMark Cloud Gate Standard Score | 27353 points | |
| 3DMark Fire Strike Score | 6997 points | |
| 3DMark Fire Strike Extreme Score | 3647 points | |
| 3DMark Time Spy Score | 2595 points | |
Help | ||
| low | med. | high | ultra | |
|---|---|---|---|---|
| Tomb Raider (2013) | 433 | 306.7 | 201.5 | 94.5 |
| BioShock Infinite (2013) | 270.6 | 216.5 | 195.4 | 76.7 |
| GTA V (2015) | 150.1 | 141 | 84.3 | 37.4 |
| The Witcher 3 (2015) | 145.5 | 86.5 | 50 | 29.7 |
| Dota 2 Reborn (2015) | 113 | 104 | 94 | 88 |
| World of Warships (2015) | 179.8 | 152.8 | 127.5 | 111.4 |
| The Division (2016) | 147 | 60.3 | 47.3 | 36.4 |
| Civilization 6 (2016) | 127.2 | 102.2 | 58.6 | 48 |
| X-Plane 11.11 (2018) | 87.8 | 78.2 | 65.9 | |
| F1 2018 (2018) | 146 | 86 | 63 | 39 |
| Shadow of the Tomb Raider (2018) | 95 | 42 | 37 | 31 |
| Assassin´s Creed Odyssey (2018) | 75 | 51 | 45 | 34 |
| Call of Duty Black Ops 4 (2018) | 114.7 | 52.9 | 52.3 | 47.7 |
| Hitman 2 (2018) | 71.6 | 49.4 | 44.9 | 42.3 |
| Battlefield V (2018) | 118.6 | 64.4 | 53.3 | 52 |
| Darksiders III (2018) | 167.3 | 70.4 | 55.3 | 46.3 |
| Just Cause 4 (2018) | 83.1 | 54 | 42.5 | 39.9 |
| BioShock Infinite - 1920x1080 Ultra Preset, DX11 (DDOF) | |
| Acer Aspire 7 A715-72G-704Q | |
| Lenovo Legion Y730-15ICH i5-8300H | |
| Average NVIDIA GeForce GTX 1050 Ti Mobile (61 - 97, n=23) | |
| HP Pavilion Gaming 15-cx0003ng | |
| Dell G3 15 3579 | |
| Acer Aspire 7 A715-71G-53TU | |
| Shadow of the Tomb Raider - 1920x1080 Medium Preset | |
| Average of class Multimedia (28 - 167, n=8, last 2 years) | |
| Acer Aspire 7 A715-72G-704Q | |
| Average NVIDIA GeForce GTX 1050 Ti Mobile (38 - 42, n=4) | |
| Battlefield V - 1920x1080 Medium Preset | |
| Acer Aspire 7 A715-72G-704Q | |
| Average NVIDIA GeForce GTX 1050 Ti Mobile (53.2 - 64.4, n=2) | |
| HP Pavilion Gaming 15-cx0003ng | |
Noise level
| Idle |
| 30.4 / 30.4 / 30.4 dB(A) |
| HDD |
| 32.2 dB(A) |
| Load |
| 36.2 / 43.8 dB(A) |
 | ||
30 dB silent 40 dB(A) audible 50 dB(A) loud |
||
min: | ||
| Acer Aspire 7 A715-72G-704Q i7-8750H, GeForce GTX 1050 Ti Mobile | Acer Aspire 7 A715-71G-53TU i5-7300HQ, GeForce GTX 1050 Mobile | HP Pavilion Gaming 15-cx0003ng i7-8750H, GeForce GTX 1050 Ti Mobile | Dell G3 15 3579 i5-8300H, GeForce GTX 1050 Mobile | Lenovo Legion Y730-15ICH i5-8300H i5-8300H, GeForce GTX 1050 Ti Mobile | Average NVIDIA GeForce GTX 1050 Ti Mobile | Average of class Multimedia | |
|---|---|---|---|---|---|---|---|
| Noise | 1% | -5% | -1% | -2% | -6% | 11% | |
| off / environment * (dB) | 30.4 | 30.4 -0% | 30.6 -1% | 28 8% | 28.9 5% | 29.4 ? 3% | 24.2 ? 20% |
| Idle Minimum * (dB) | 30.4 | 30.4 -0% | 30.6 -1% | 29.8 2% | 32.2 -6% | 30.7 ? -1% | 24.3 ? 20% |
| Idle Average * (dB) | 30.4 | 30.8 -1% | 30.6 -1% | 29.8 2% | 32.5 -7% | 31.7 ? -4% | 24.7 ? 19% |
| Idle Maximum * (dB) | 30.4 | 30.8 -1% | 33.2 -9% | 30 1% | 32.7 -8% | 33.8 ? -11% | 26.4 ? 13% |
| Load Average * (dB) | 36.2 | 33.6 7% | 42.8 -18% | 38.6 -7% | 33.2 8% | 41.3 ? -14% | 37.4 ? -3% |
| Load Maximum * (dB) | 43.8 | 43.4 1% | 43 2% | 49.4 -13% | 45 -3% | 47.2 ? -8% | 45.9 ? -5% |
| Witcher 3 ultra * (dB) | 42.1 | 46.9 | 43.1 |
* ... smaller is better
(-) The maximum temperature on the upper side is 45.2 °C / 113 F, compared to the average of 36.8 °C / 98 F, ranging from 21 to 71 °C for the class Multimedia.
(±) The bottom heats up to a maximum of 43.8 °C / 111 F, compared to the average of 39.1 °C / 102 F
(+) In idle usage, the average temperature for the upper side is 23.2 °C / 74 F, compared to the device average of 31.3 °C / 88 F.
(+) The palmrests and touchpad are cooler than skin temperature with a maximum of 25.1 °C / 77.2 F and are therefore cool to the touch.
(+) The average temperature of the palmrest area of similar devices was 28.7 °C / 83.7 F (+3.6 °C / 6.5 F).
| Acer Aspire 7 A715-72G-704Q i7-8750H, GeForce GTX 1050 Ti Mobile | Acer Aspire 7 A715-71G-53TU i5-7300HQ, GeForce GTX 1050 Mobile | HP Pavilion Gaming 15-cx0003ng i7-8750H, GeForce GTX 1050 Ti Mobile | Dell G3 15 3579 i5-8300H, GeForce GTX 1050 Mobile | Lenovo Legion Y730-15ICH i5-8300H i5-8300H, GeForce GTX 1050 Ti Mobile | Average NVIDIA GeForce GTX 1050 Ti Mobile | Average of class Multimedia | |
|---|---|---|---|---|---|---|---|
| Heat | -5% | -5% | -29% | 11% | -10% | -2% | |
| Maximum Upper Side * (°C) | 45.2 | 41.6 8% | 44.1 2% | 47 -4% | 30 34% | 46.5 ? -3% | 41.1 ? 9% |
| Maximum Bottom * (°C) | 43.8 | 42.5 3% | 53.8 -23% | 61.2 -40% | 40.8 7% | 48.4 ? -11% | 43.7 ? -0% |
| Idle Upper Side * (°C) | 24.8 | 29.7 -20% | 24.6 1% | 34 -37% | 23.4 6% | 28.6 ? -15% | 27 ? -9% |
| Idle Bottom * (°C) | 26.4 | 29.4 -11% | 26.7 -1% | 35.8 -36% | 27.8 -5% | 28.9 ? -9% | 28 ? -6% |
* ... smaller is better
Acer Aspire 7 A715-72G-704Q audio analysis
(-) | not very loud speakers (65.1 dB)
Bass 100 - 315 Hz
(±) | reduced bass - on average 12% lower than median
(±) | linearity of bass is average (14.5% delta to prev. frequency)
Mids 400 - 2000 Hz
(+) | balanced mids - only 4.6% away from median
(±) | linearity of mids is average (7.6% delta to prev. frequency)
Highs 2 - 16 kHz
(+) | balanced highs - only 2.6% away from median
(+) | highs are linear (4.6% delta to prev. frequency)
Overall 100 - 16.000 Hz
(±) | linearity of overall sound is average (19.1% difference to median)
Compared to same class
» 61% of all tested devices in this class were better, 7% similar, 32% worse
» The best had a delta of 5%, average was 17%, worst was 45%
Compared to all devices tested
» 46% of all tested devices were better, 7% similar, 47% worse
» The best had a delta of 4%, average was 23%, worst was 134%
HP Pavilion Gaming 15-cx0003ng audio analysis
(-) | not very loud speakers (70.4 dB)
Bass 100 - 315 Hz
(-) | nearly no bass - on average 25.4% lower than median
(±) | linearity of bass is average (10.3% delta to prev. frequency)
Mids 400 - 2000 Hz
(+) | balanced mids - only 2.3% away from median
(+) | mids are linear (6.9% delta to prev. frequency)
Highs 2 - 16 kHz
(+) | balanced highs - only 1.8% away from median
(+) | highs are linear (4.7% delta to prev. frequency)
Overall 100 - 16.000 Hz
(±) | linearity of overall sound is average (21.1% difference to median)
Compared to same class
» 76% of all tested devices in this class were better, 4% similar, 20% worse
» The best had a delta of 6%, average was 18%, worst was 132%
Compared to all devices tested
» 58% of all tested devices were better, 7% similar, 35% worse
» The best had a delta of 4%, average was 23%, worst was 134%
| Off / Standby | |
| Idle | |
| Load |
|
Key:
min: | |
| Acer Aspire 7 A715-72G-704Q i7-8750H, GeForce GTX 1050 Ti Mobile | Acer Aspire 7 A715-71G-53TU i5-7300HQ, GeForce GTX 1050 Mobile | HP Pavilion Gaming 15-cx0003ng i7-8750H, GeForce GTX 1050 Ti Mobile | Dell G3 15 3579 i5-8300H, GeForce GTX 1050 Mobile | Lenovo Legion Y730-15ICH i5-8300H i5-8300H, GeForce GTX 1050 Ti Mobile | Average NVIDIA GeForce GTX 1050 Ti Mobile | Average of class Multimedia | |
|---|---|---|---|---|---|---|---|
| Power Consumption | 2% | -25% | -41% | -48% | -51% | -20% | |
| Idle Minimum * (Watt) | 3.9 | 4 -3% | 5.5 -41% | 7.9 -103% | 8 -105% | 7.92 ? -103% | 5.65 ? -45% |
| Idle Average * (Watt) | 6.6 | 6.9 -5% | 8.5 -29% | 9.6 -45% | 11.8 -79% | 11.9 ? -80% | 10 ? -52% |
| Idle Maximum * (Watt) | 8.5 | 9.4 -11% | 11.9 -40% | 13 -53% | 13.1 -54% | 15.4 ? -81% | 12.3 ? -45% |
| Load Average * (Watt) | 89 | 72.6 18% | 94 -6% | 93 -4% | 90.2 -1% | 85.1 ? 4% | 65.1 ? 27% |
| Load Maximum * (Watt) | 134 | 122 9% | 144 -7% | 132.7 1% | 136.2 -2% | 130.5 ? 3% | 112.5 ? 16% |
| Witcher 3 ultra * (Watt) | 86 | 100.6 | 107.8 |
* ... smaller is better
| Acer Aspire 7 A715-72G-704Q i7-8750H, GeForce GTX 1050 Ti Mobile, 48.9 Wh | Acer Aspire 7 A715-71G-53TU i5-7300HQ, GeForce GTX 1050 Mobile, 48 Wh | HP Pavilion Gaming 15-cx0003ng i7-8750H, GeForce GTX 1050 Ti Mobile, 52.5 Wh | Dell G3 15 3579 i5-8300H, GeForce GTX 1050 Mobile, 56 Wh | Lenovo Legion Y730-15ICH i5-8300H i5-8300H, GeForce GTX 1050 Ti Mobile, 57 Wh | Average of class Multimedia | |
|---|---|---|---|---|---|---|
| Battery runtime | -4% | -9% | 43% | -19% | 101% | |
| Reader / Idle (h) | 12.3 | 9.9 -20% | 10.8 -12% | 9.6 -22% | 25.2 ? 105% | |
| H.264 (h) | 6 | 5.1 -15% | 4.6 -23% | 16.2 ? 170% | ||
| WiFi v1.3 (h) | 6.4 | 5.6 -13% | 5.3 -17% | 6.5 2% | 5.3 -17% | 12 ? 88% |
| Load (h) | 1.2 | 1.6 33% | 1.4 17% | 2.2 83% | 1 -17% | 1.669 ? 39% |
Pros
Cons
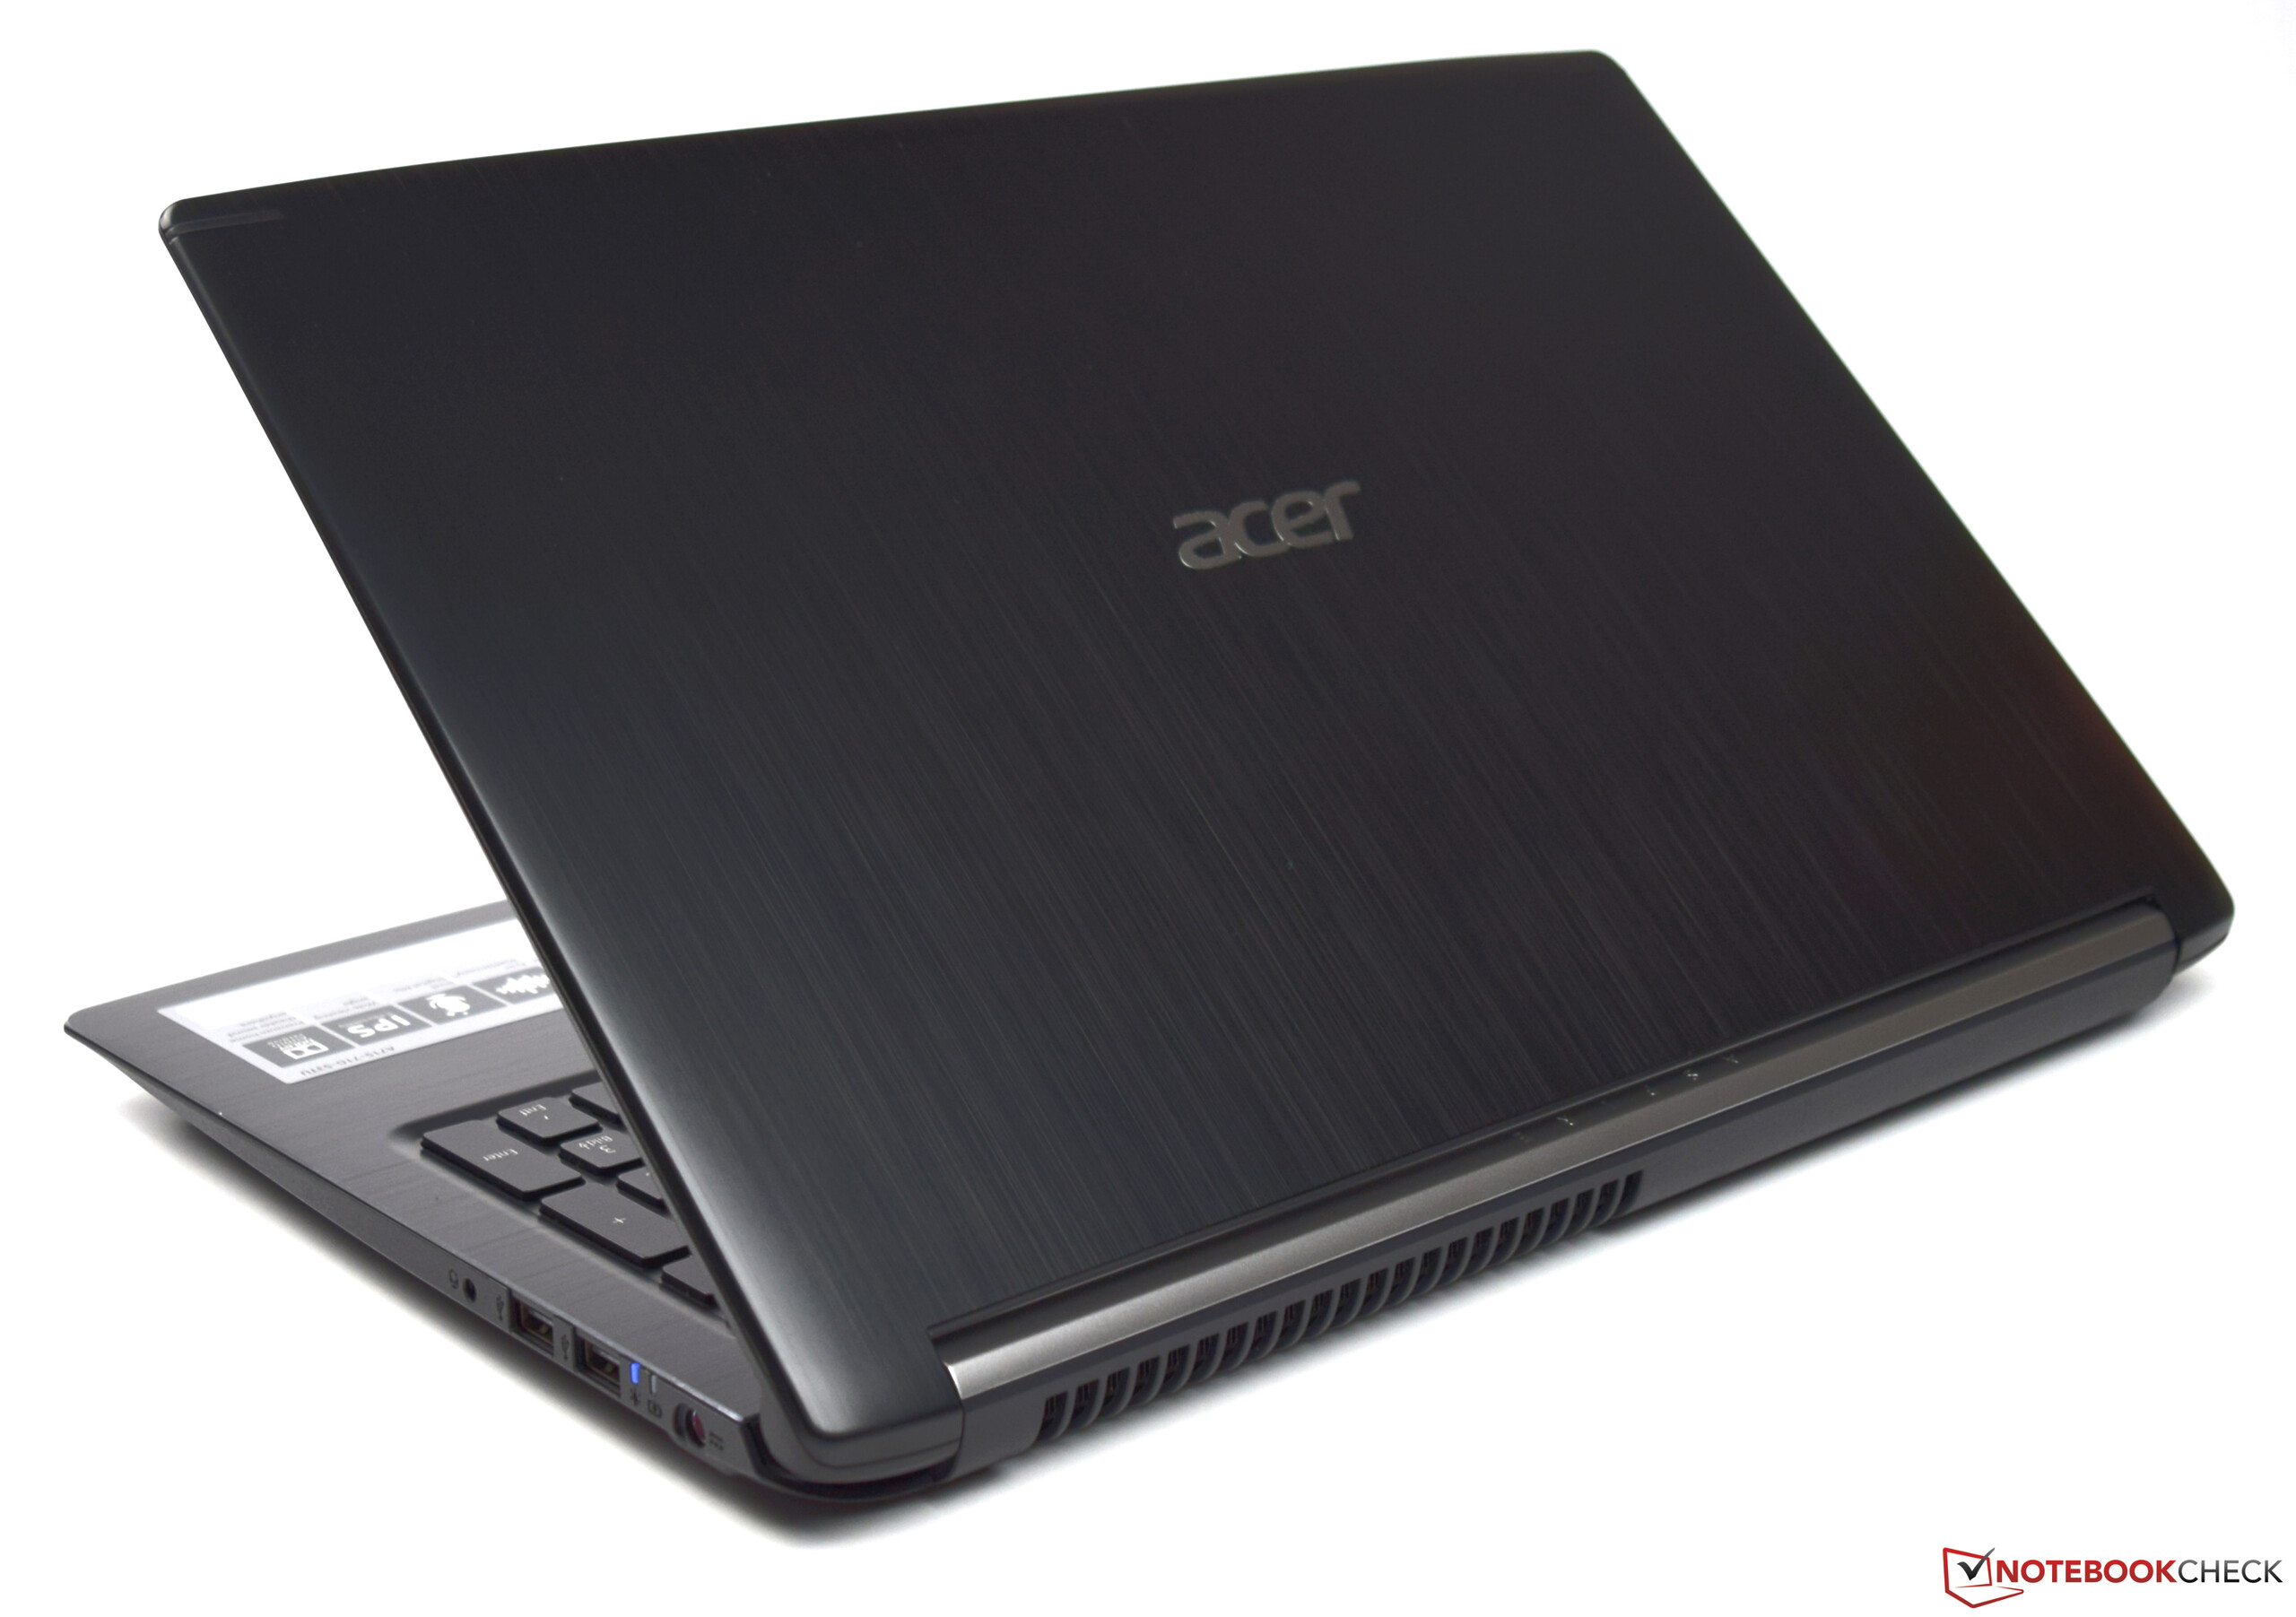
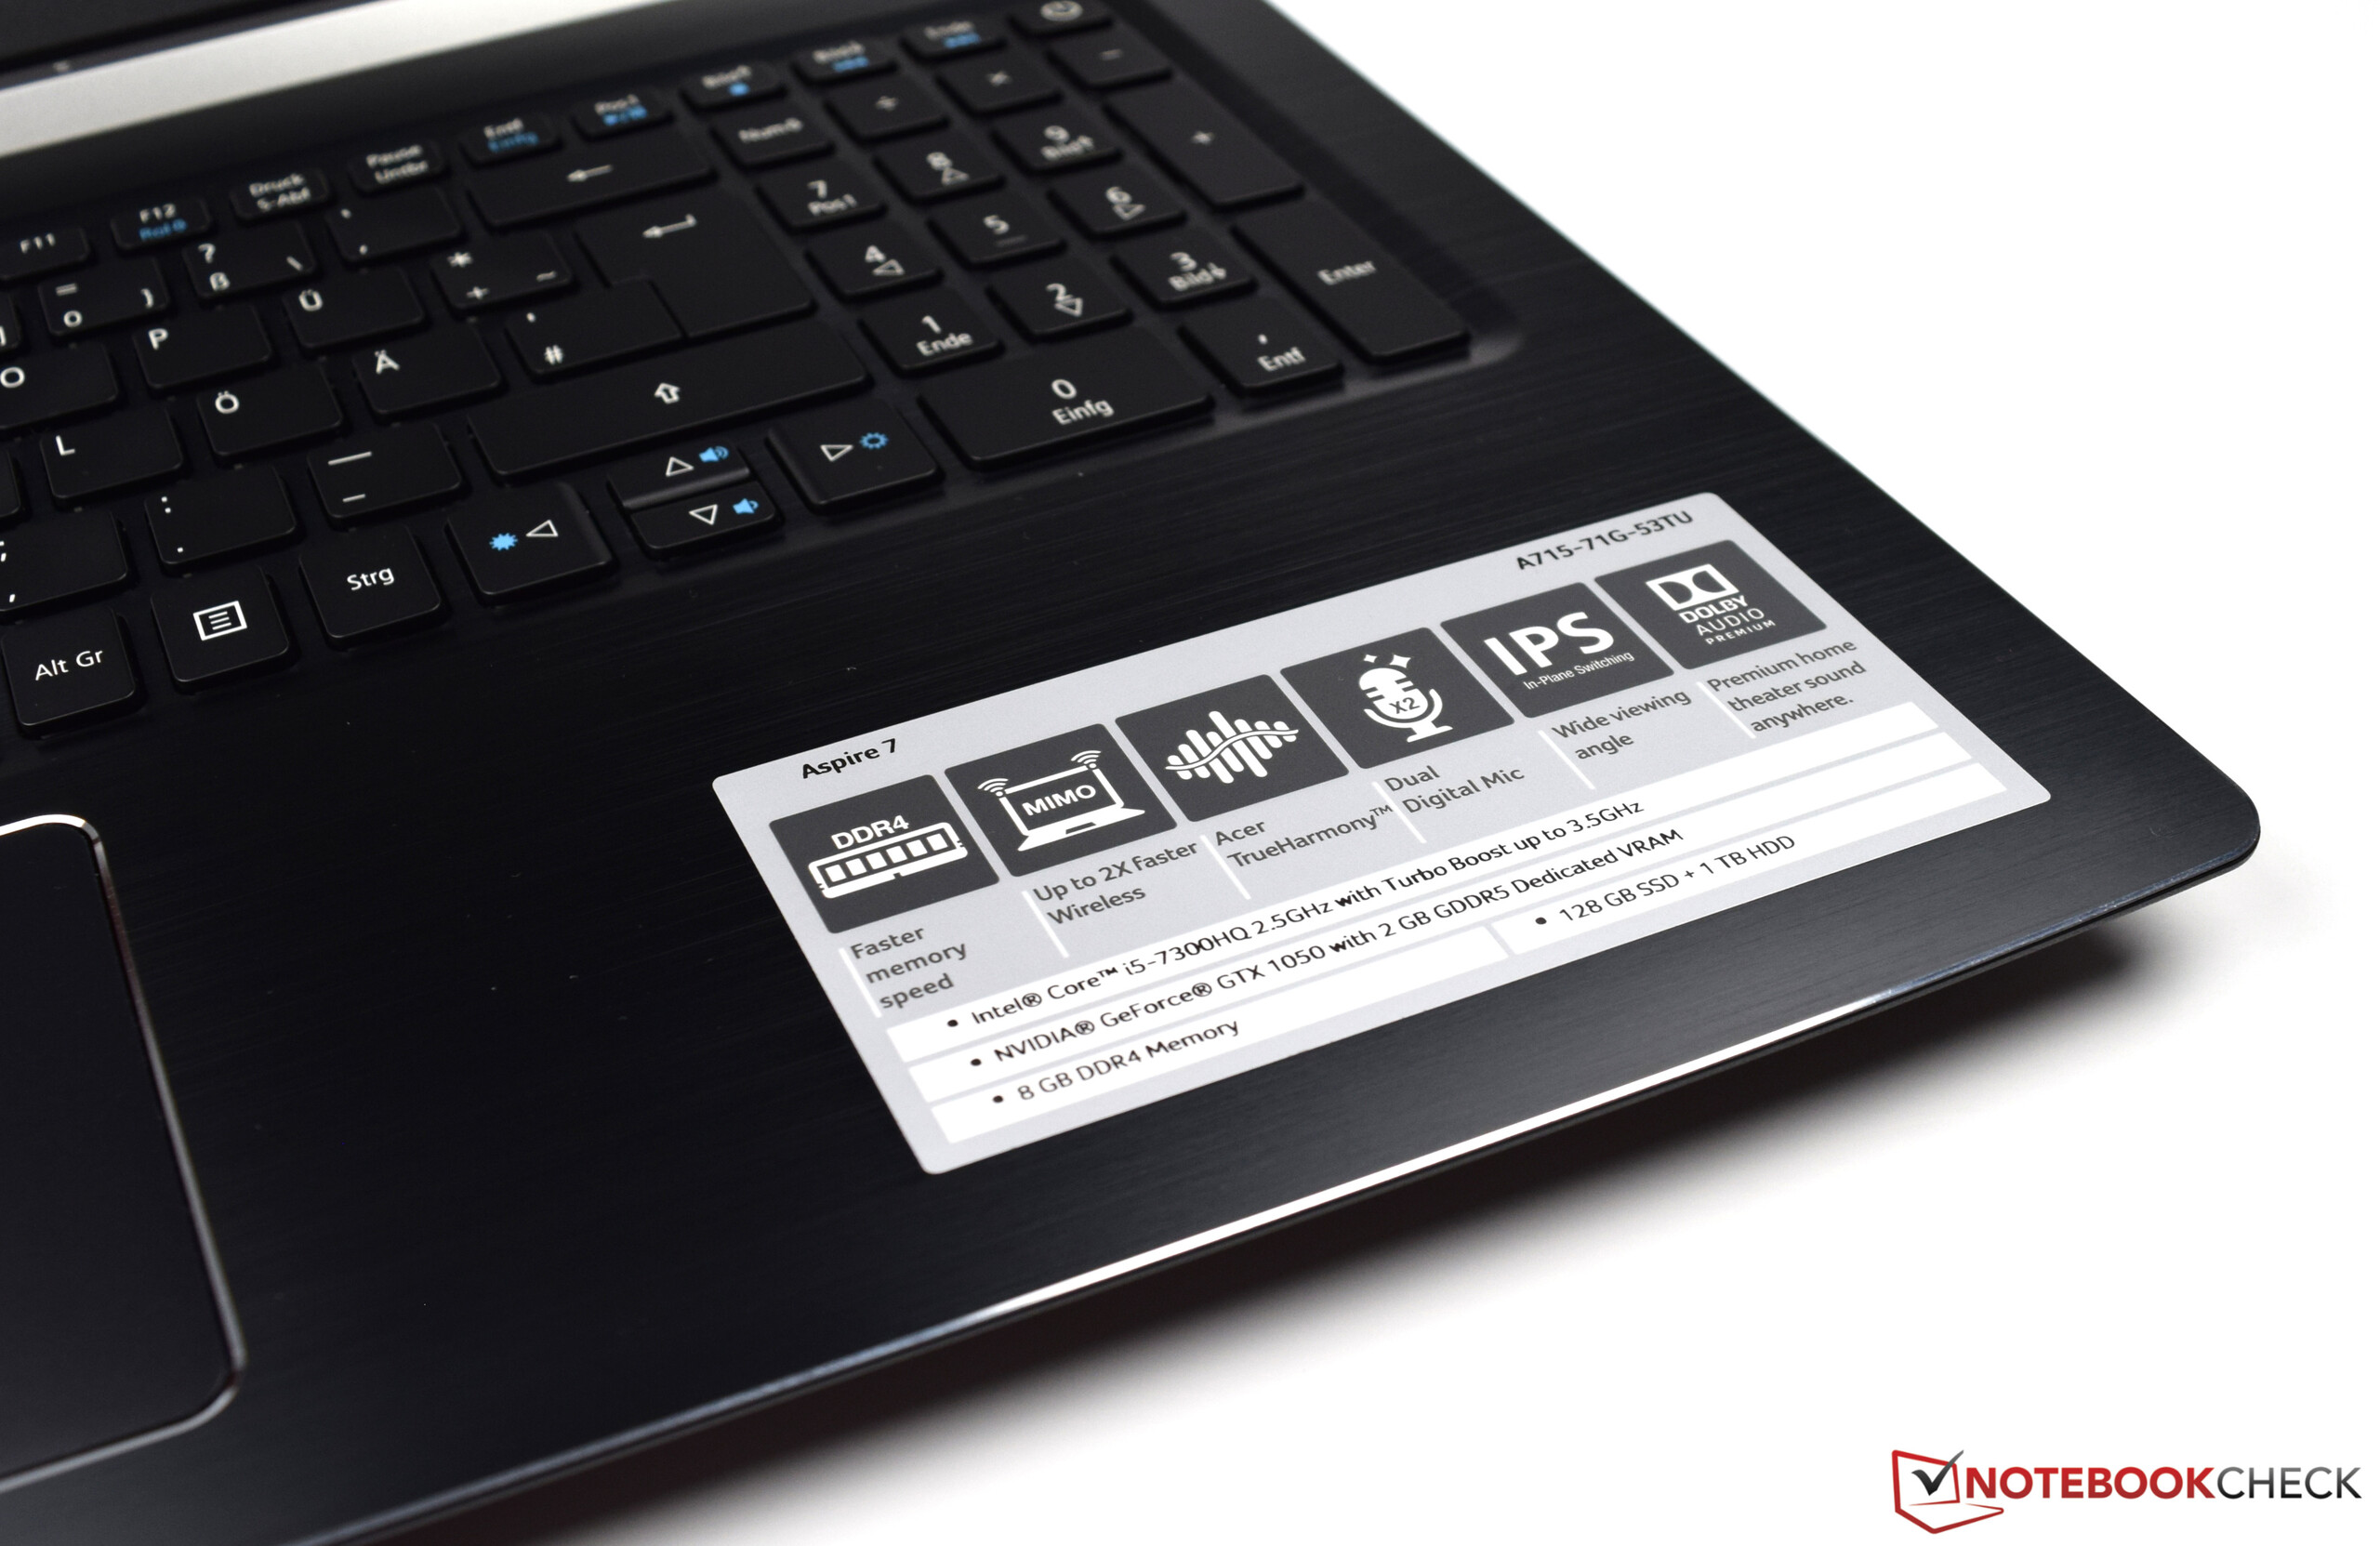
威武骑士A715-72G是一款适合游戏的15.6英寸多媒体笔记本电脑。内置的i7-8750H在很长一段时间内都不会过时。GeForce GTX 1050 Ti也能够顺畅地运行所有最新的大型游戏。
“全能的宏碁给我们留下了良好的印象,但它并不是没有瑕疵。”
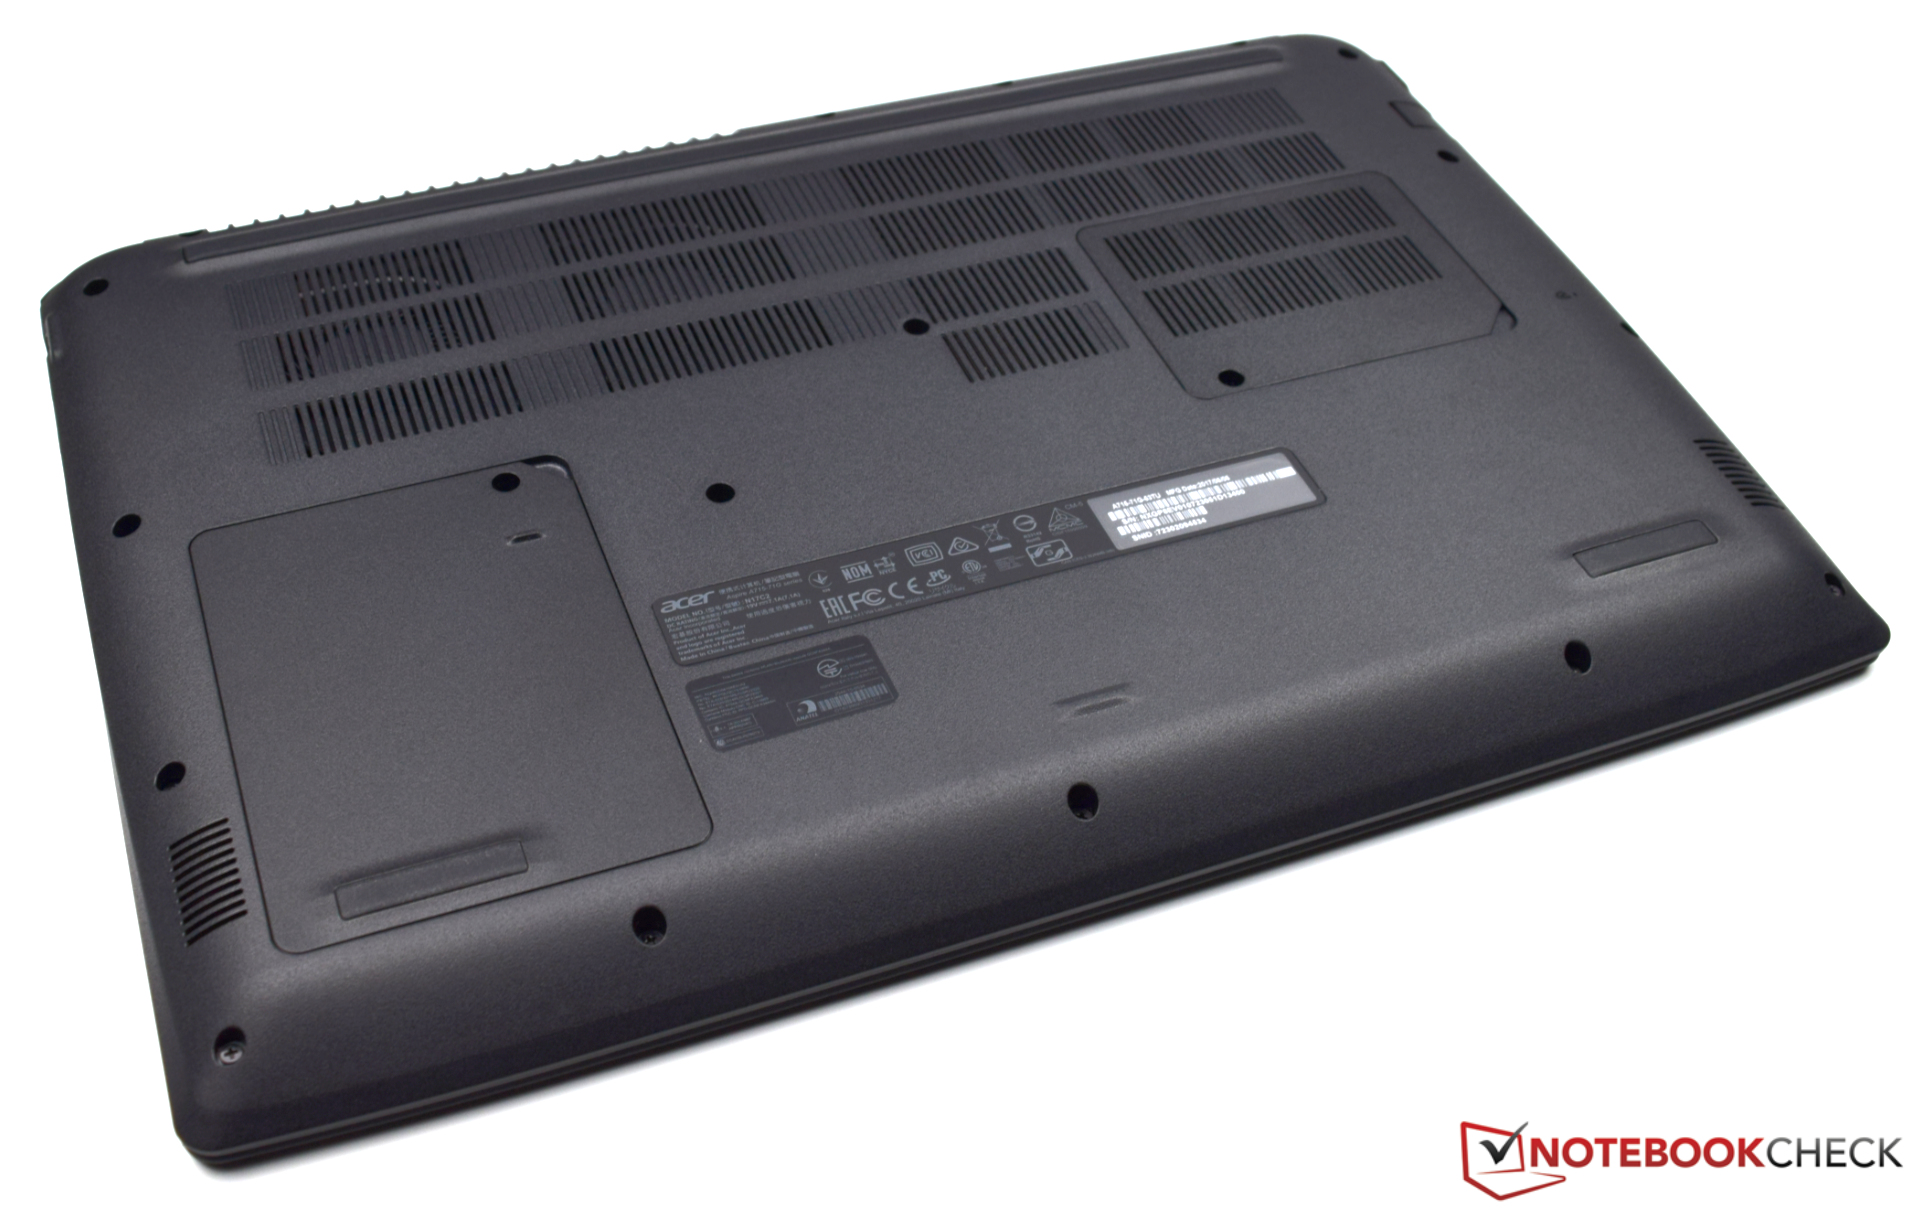
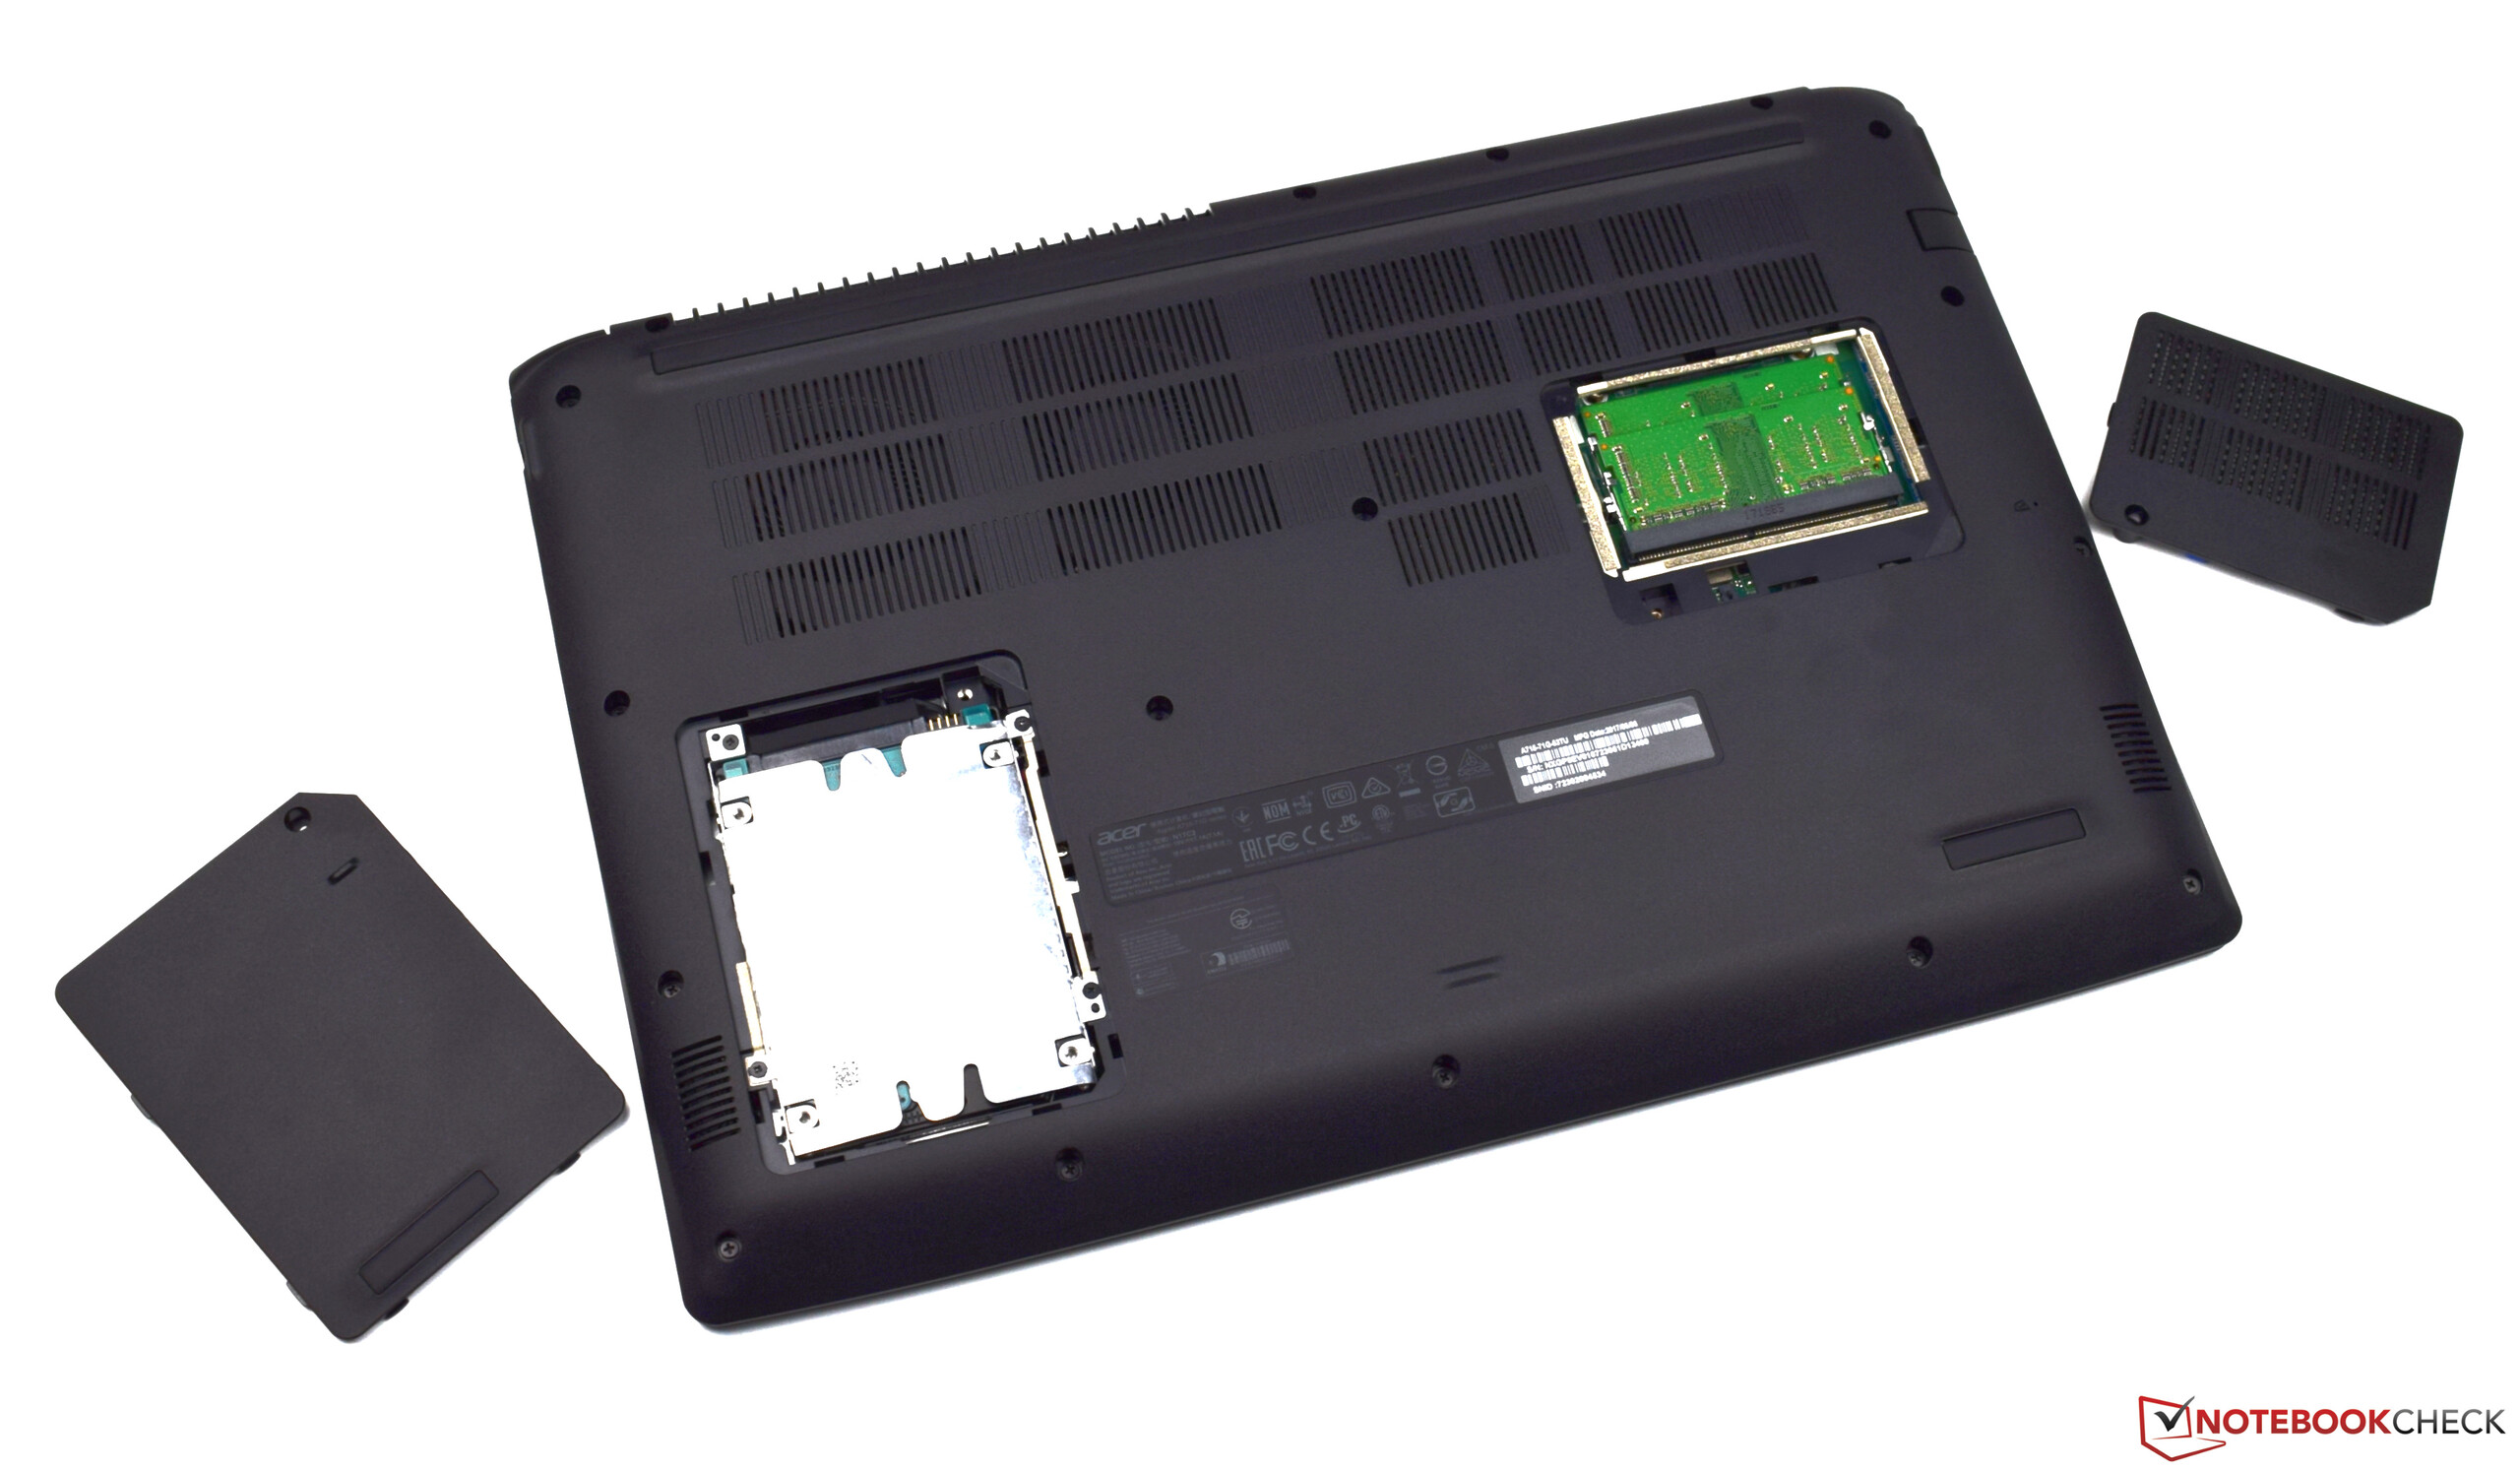
尽管功能强大,但笔记本电脑在使用办公应用程序和浏览互联网时基本上没有声音。NVMe SSD使得系统响应迅速。A715提供充足的存储空间。除了SSD之外,Aspire 7还配备一块1 TB硬盘。对于具有这么大功率的笔记本电脑来说,续航时间是可以接受的。此外,宏碁的笔记本还配备了带背光的键盘。
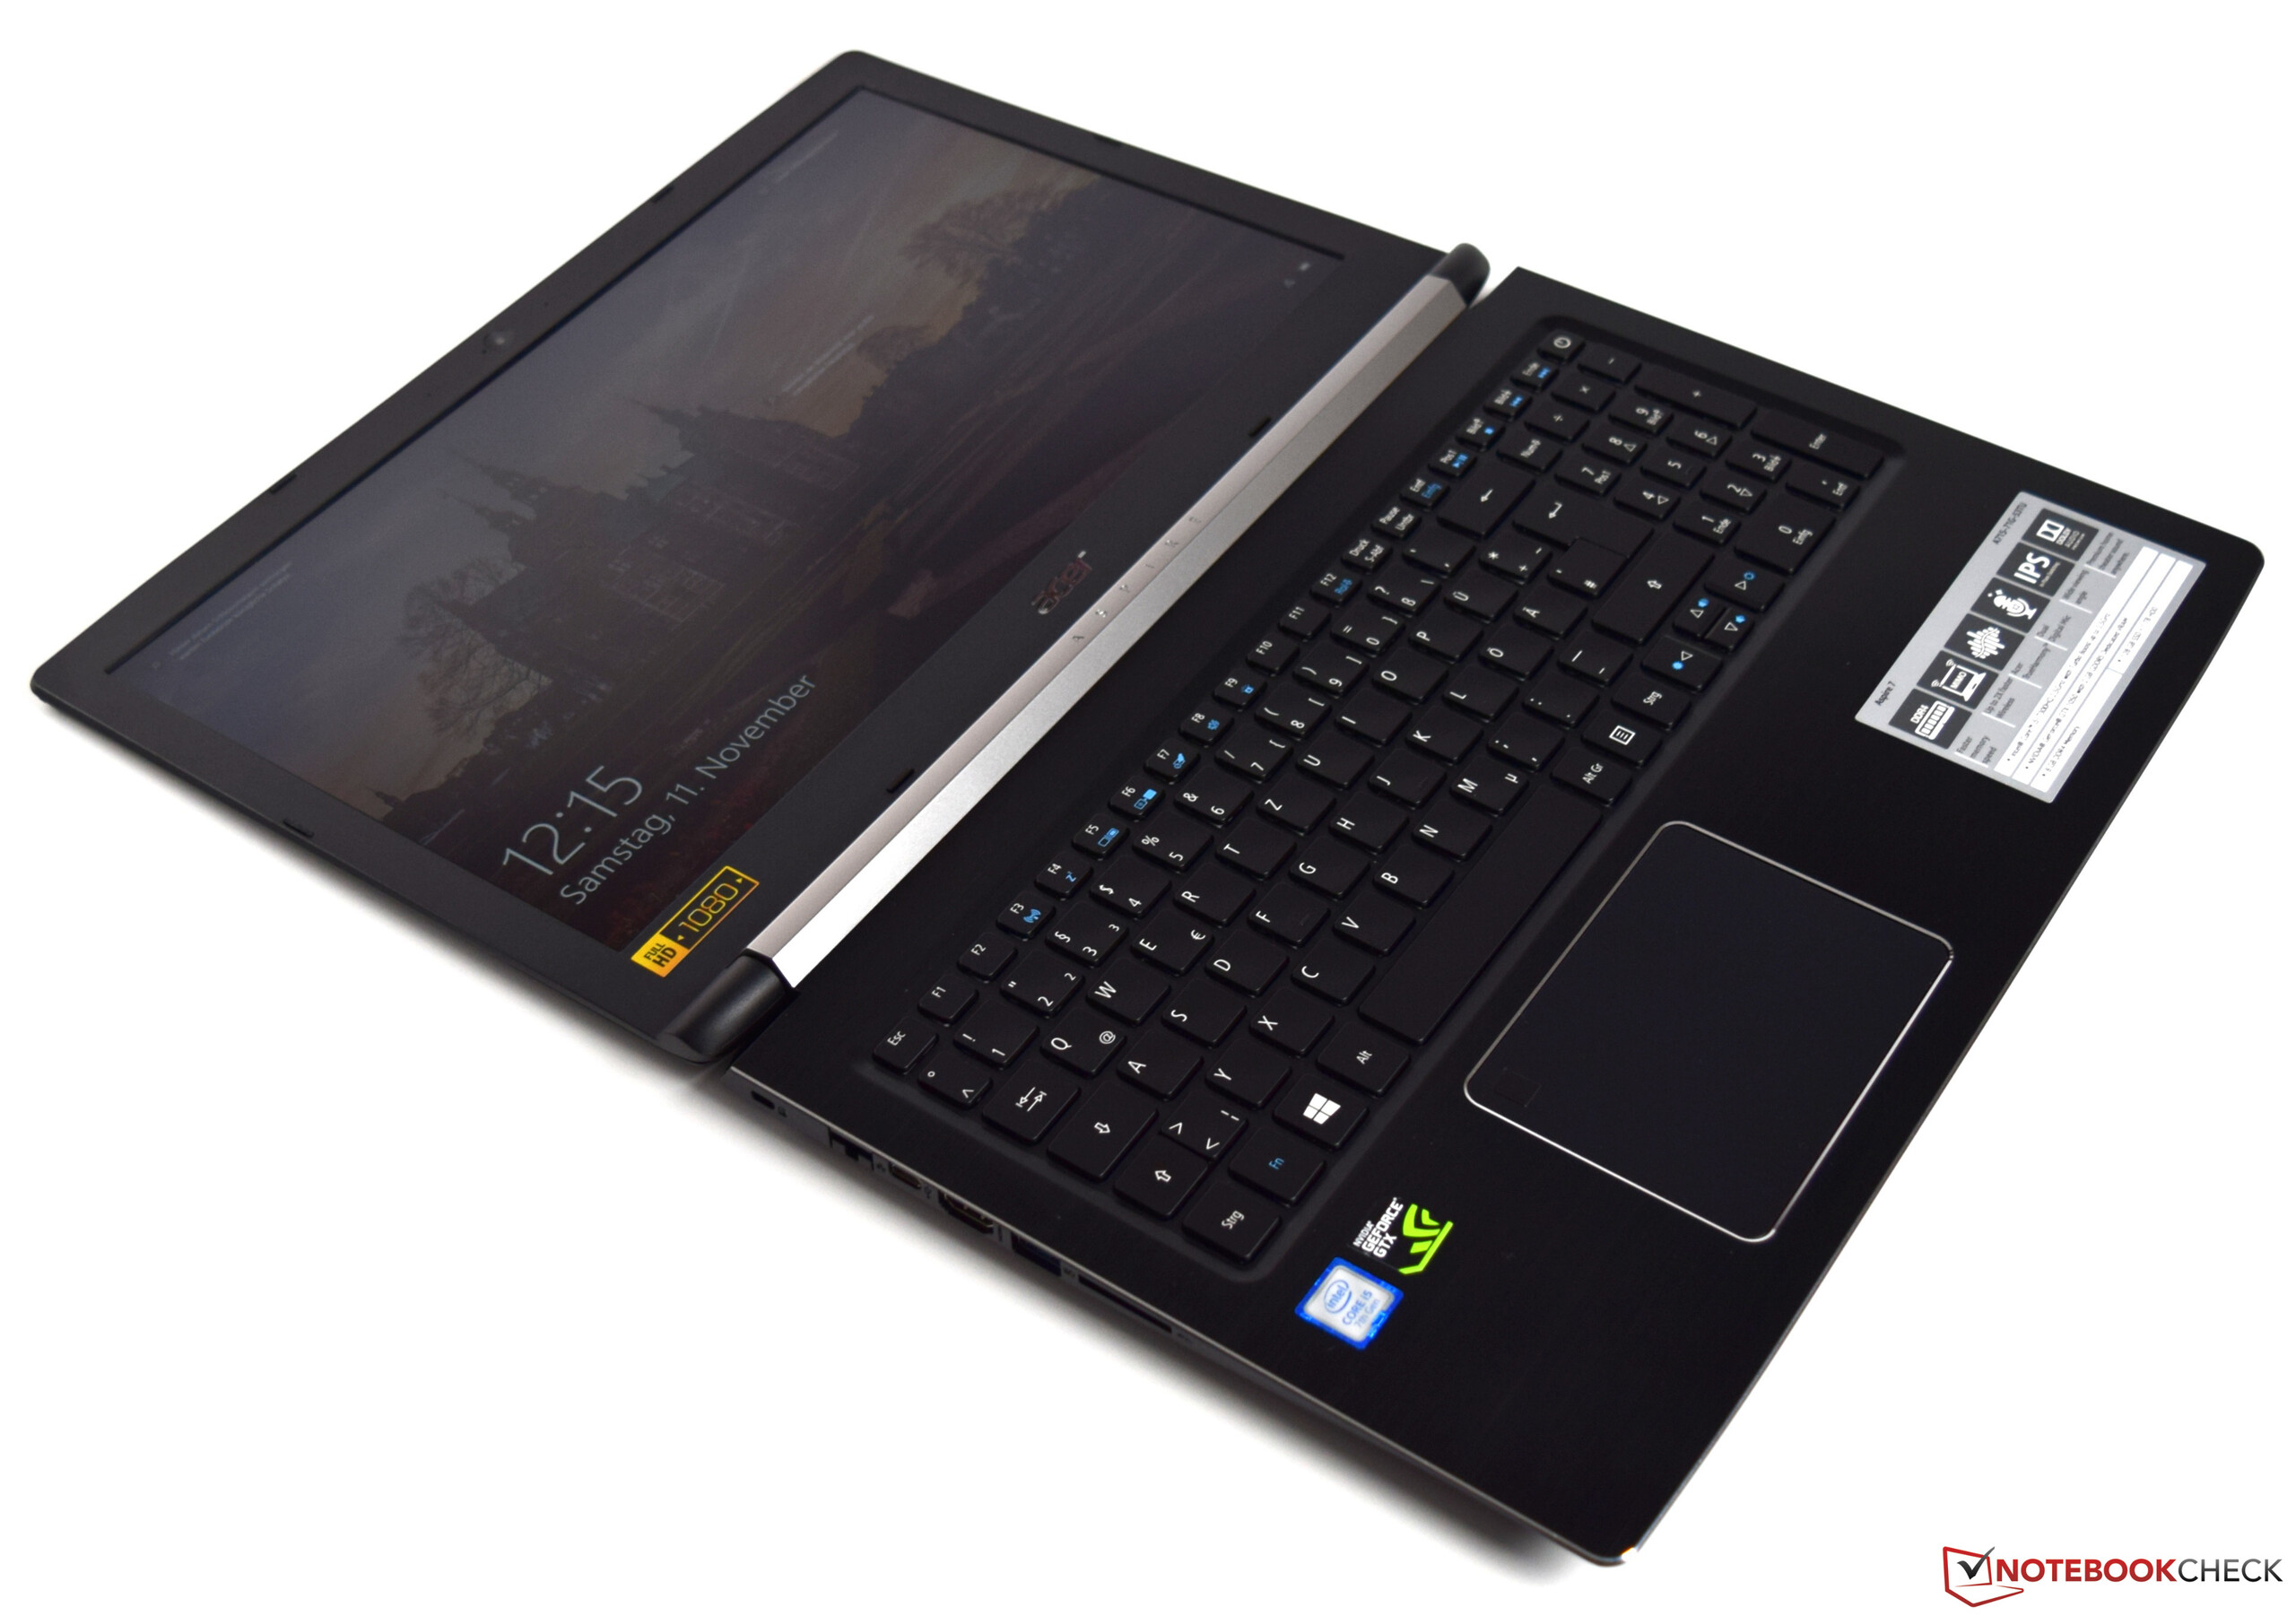
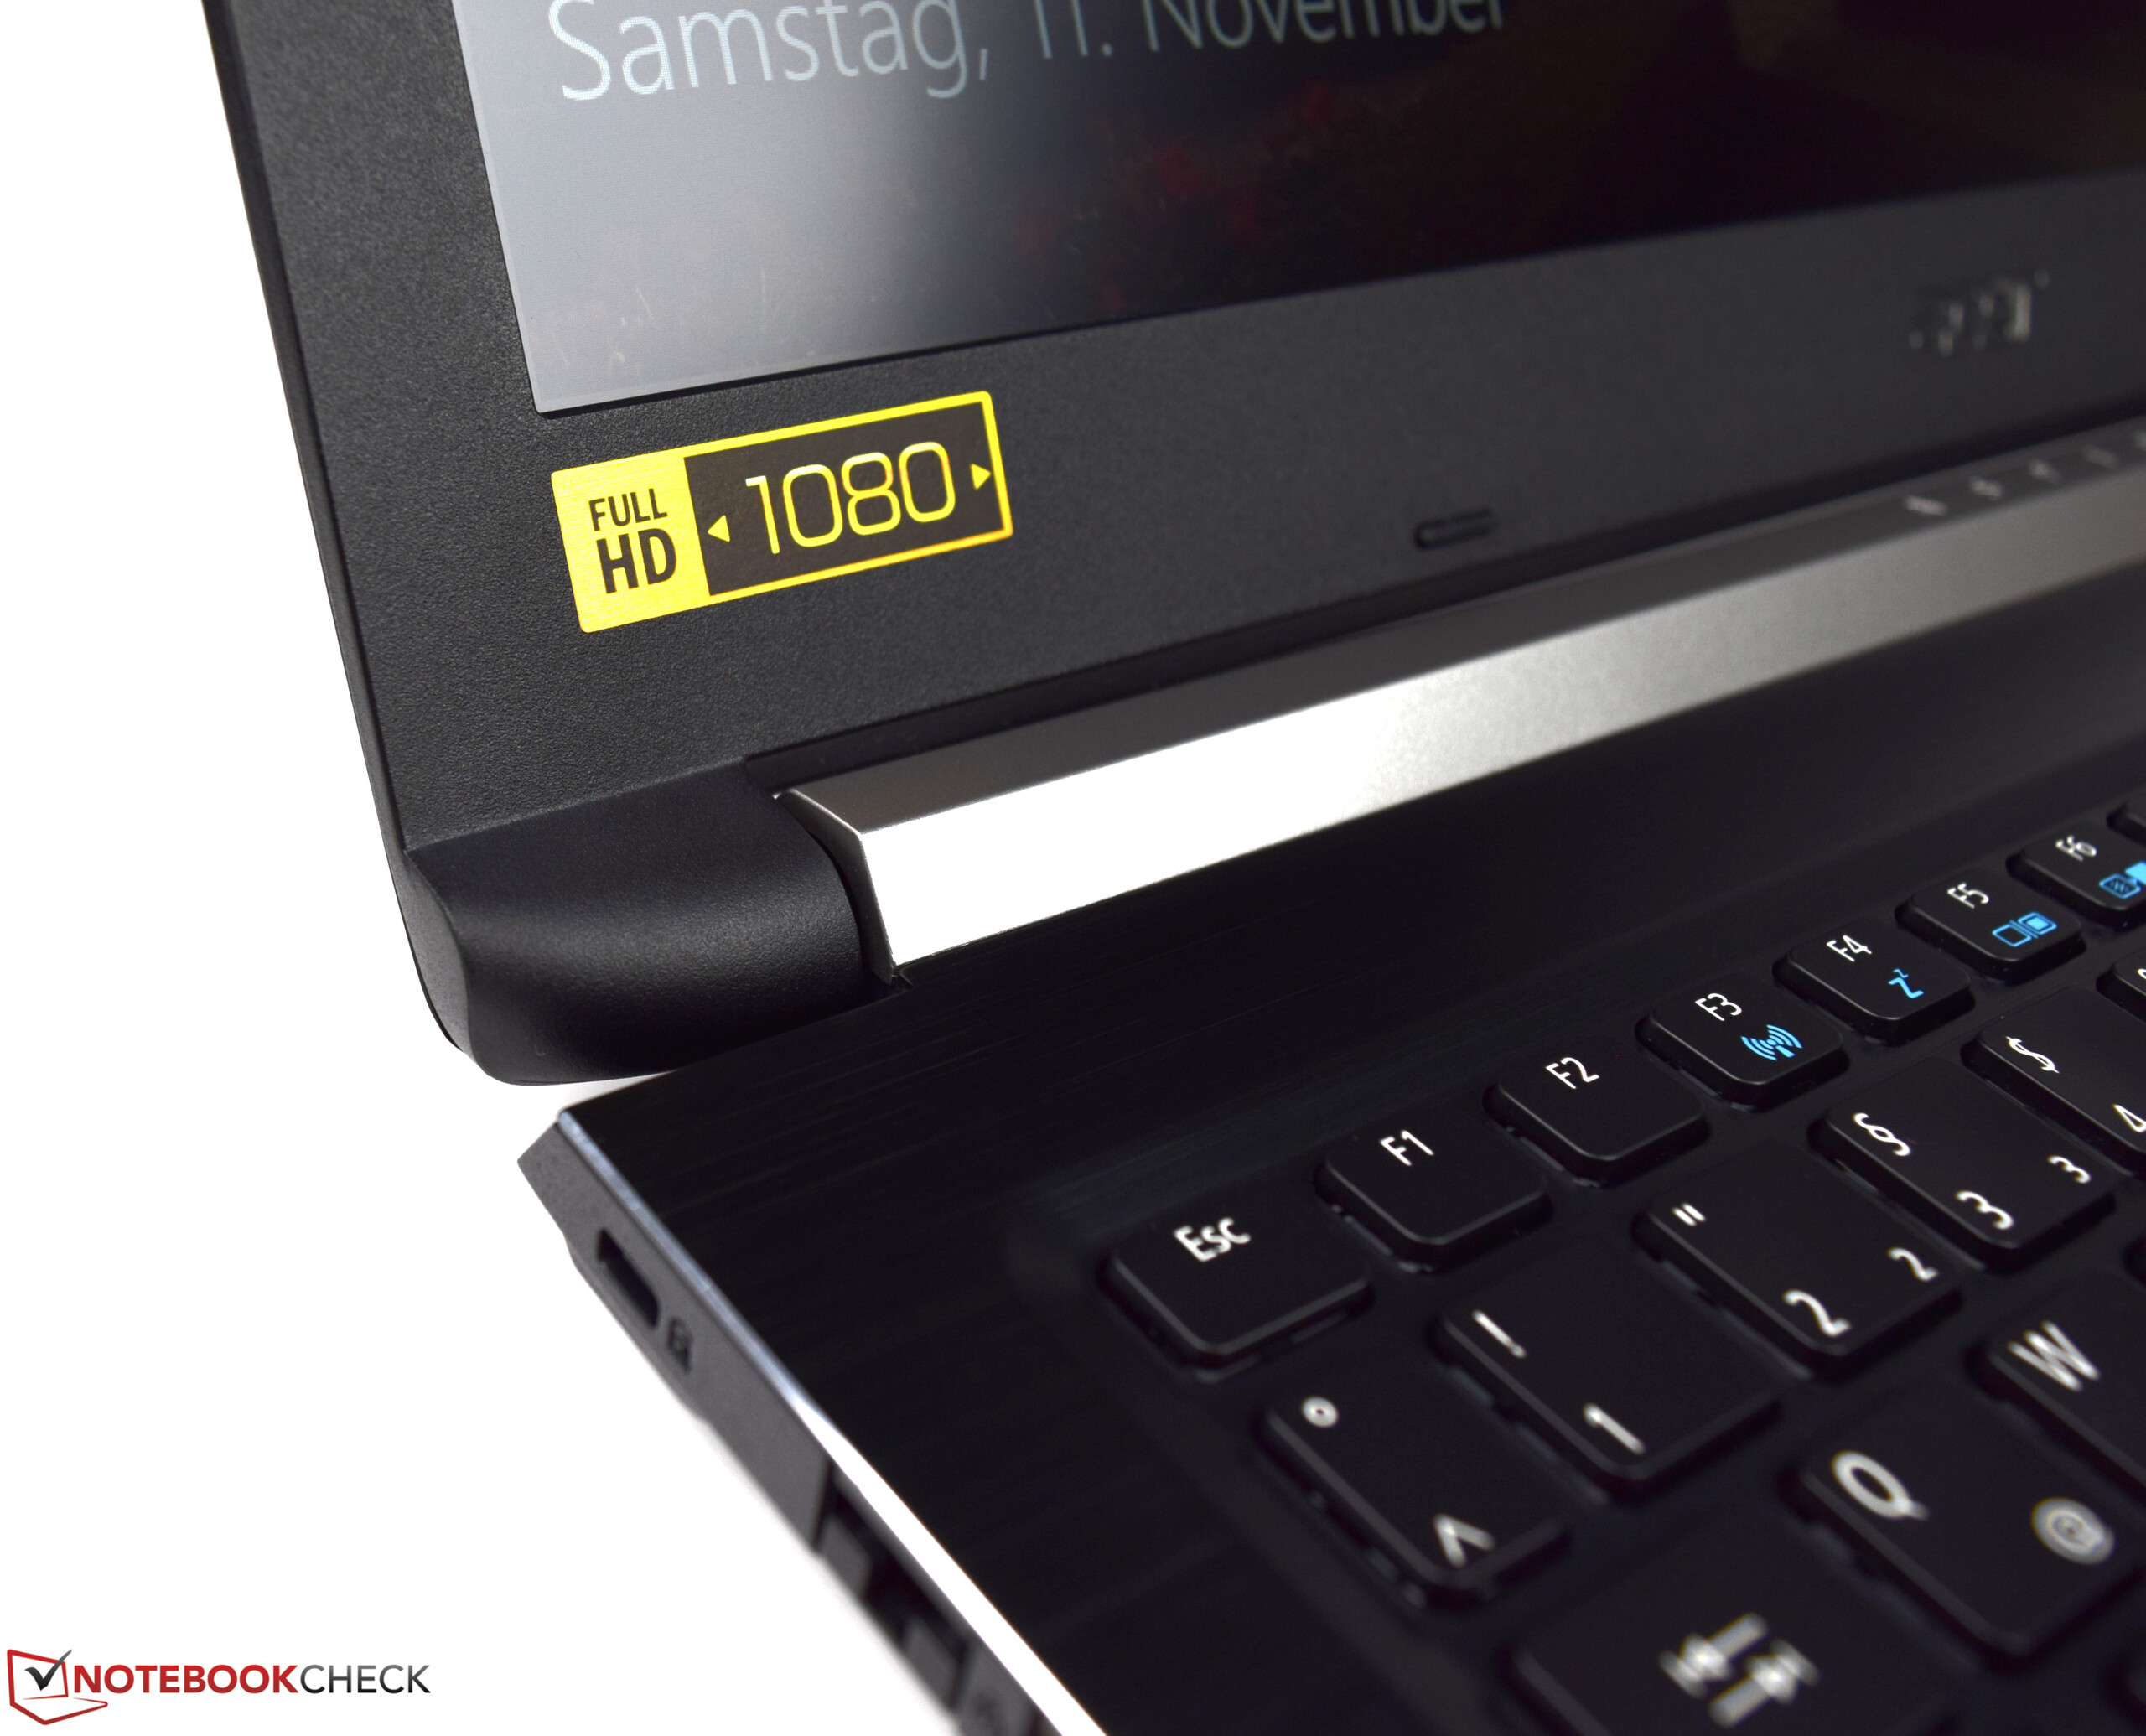
IPS显示器无需多说,它的主要优点包括哑光屏幕表面和良好的可视角度。对于一台价值9300元的笔记本电脑,亮度和对比度都太低了。电流噪音是另一个缺点,它的风扇很安静,但电流噪音在安静的环境中很烦人。
Acer Aspire 7 A715-72G-704Q
- 01/30/2019 v6 (old)
Sascha Mölck
Price comparison
