Notebookcheck Logo
英特尔与 AMD

英特尔酷睿至尊 9 285K VS AMD Ryzen 9 9950X3D

得益于最新的微代码更新,英特尔酷睿至尊 9 285K 缩小了与 AMD Ryzen 9 9950X3D 在性能上的大部分差距,在许多工作负载中实现了近乎均等的性能。现在,两者的差距已缩小到个位数,在台式机 CPU 市场的高端产品中,这场对决已成为一场真正的双向较量。
Bogdan Solca, 👁 Bogdan Solca (translated by DeepL / Ninh Duy) Published 🇺🇸 🇷🇺 ...
AMD Benchmark CPU Intel Nvidia

判决

一年之后 英特尔箭湖-S 发布一年后,酷睿至尊9 285K的性能得到了 性能显著提高在不影响能效的情况下。这些改进是否足以让它成为 AMD Ryzen 9 9950X3D 的强劲对手? AMD Ryzen 9 9950X3D考虑到在发布之初,酷睿至尊 9 285K 甚至无法击败上一代的 i9-14900K?根据我们的最新测试,看起来确实如此。虽然英特尔 CPU 总体上仍处于落后状态,但它绝对已经赶上了大多数差异仅为个位数百分比的水平。

AIDA64 测试表明,Ryzen 9 9950X3D 在重计算负载下的速度仍然要快得多,而且更适合游戏场景,尤其是在未激活 Nvidia DLSS 的情况下。不过,合成 3D 渲染基准测试表明,这两个竞争对手的性能应该更接近。

在英特尔方面,酷睿至尊 9 285K 在包括游戏在内的大多数情况下都保持了电源效率的领先地位。尽管内存带宽增加了,但与 AMD 竞争对手相比,重计算负载仍然较慢,但在实际生产力和内容创建场景中,英特尔仍然更胜一筹。与一年前相比,酷睿至尊 9 285K 在游戏方面的表现无疑要好得多,现在仅以个位数的差距落后于 9950X3D,甚至在启用 Nvidia DLSS 的某些情况下还能胜出。蓝队的固态硬盘性能也略胜一筹。

英特尔酷睿至尊 9 285K 于 2024 年 10 月底首次推出时,因其电源效率的提升而备受赞誉,但与上一代 i9-14900K 相比,其性能提升几乎不存在,甚至在游戏场景中看起来像是降级了。在 2025 年期间,英特尔发布了不少微码改进,在 Linux 中实现了~9% 的性能提升和更好的能效。.Windows 也是如此吗?这个问题正是本次测试的灵感来源。由于我们的原始测试系统(RTX 4090RTX 4090)和本次测试使用的 XMG 系统(RTX 5090RTX 5090)之间的 GPU 差异,因此无法测试包括游戏在内的 3D 渲染性能。

我们决定将酷睿至尊 9 285K 与 AMD 的 Ryzen 9 9950X3D 进行对比,因为它们代表了两家公司当前台式机的巅峰之作。当然,这两款产品的价格并不相同(英特尔 CPU 的价格要低 100 美元),而且核心配置也不同。尽管如此,Ryzen 9 9950X3D 自 2025 年 3 月发布以来也获得了一些稳定性更新,因此重新测试似乎是合适的。

测试平台

这次测试要感谢 XMG / Schenker 的朋友,他们提供了基于其 Trinity X 型号的两套测试系统。有关XMG Trinity X - IntelXMG Trinity X - AMD系统的规格和价格,请访问Bestware。.

除了主板和 CPU 之外,这两款 PC 的设计尽可能相似,以便严格关注 CPU 性能差异。因此,两套系统都配备了华硕 TUF Gaming RTX 5090GPU,64 GB DDR5-6000 CL 30 from Corsair2 TB Samsung 9100 Pro PCIe 5.0 NVMe SSD、相同的Corsair iCUE Link Titan 360 RXAIO 散热器、相同的 Be Quiet! 机箱风扇、相同的Corsair RM1000e电源,以及同样的HAVN HS 420机箱(黑色和白色版本)。

两套系统的测试环境均为 Windows 11 25H2进行了测试,并进行了最新的安全更新。此外,还激活了高性能电源配置文件,并安装了最新的 BIOS 和芯片组驱动程序。我们知道,AMD 可能仍会建议在游戏中使用平衡电源配置文件,但考虑到大量的合成基准测试,为两套系统选择高性能配置文件是合理的。

计算性能

由于英特尔酷睿至尊 9 285K 集成了一个混合核心集群,拥有 24 个核心,没有超线程功能,而 AMD Ryzen 9 9950X3D 则拥有 16 个核心,因此这两款处理器在大多数工作负载中的表现不尽相同。我们可以看到,与最初的微代码相比,最新的英特尔微代码在 GeekBench 6.5 多核(提升 6%)和 PCMark 10(数字内容提升 5%/生产力提升 61%/ Essentials 提升 4%)中提供了明显更好的性能,但这两个版本在其他方面基本持平。

在 AMD 方面,Ryzen 9 9950X3D 在 AIDA CPU 测试中占据主导地位,尽管内存读取和复制速度比英特尔平台慢 15-20%。在 FPU Julia 和 Mandel AIDA 测试中,最新修订版代码有一些明显的改进,但总体而言,与原始修订版相比,改进幅度仅为个位数。

英特尔系统的 HWInfo 详情
英特尔系统的 HWInfo 详情
AMD 系统的 HWInfo 详情
AMD 系统的 HWInfo 详情
英特尔酷睿至尊 9 285K 3DMark CPU 配置文件分数
AMD Ryzen 9 9950X3D 3DMark CPU Profile 分数
英特尔酷睿 Ultra 9 285K GPGPU 跑分
AMD Ryzen 9 9950X3D GPGPU 分数
Cinebench 2024
CPU Multi Core (sort by value)
XMG Trinity X - AMD Ryzen 9 9950X3D
R9 9950X3D, GeForce RTX 5090
2410 Points
XMG Trinity X - Intel Core Ultra 9 285K
Ultra 9 285K, GeForce RTX 5090
2413 Points 0%
Intel Core Ultra 9 285K (Previous)
Ultra 9 285K, GeForce RTX 4090
2436 Points +1%
AMD Ryzen 9 9950X3D (Previous)
R9 9950X3D, GeForce RTX 4090
2365 Points -2%
CPU Single Core (sort by value)
XMG Trinity X - AMD Ryzen 9 9950X3D
R9 9950X3D, GeForce RTX 5090
139 Points
XMG Trinity X - Intel Core Ultra 9 285K
Ultra 9 285K, GeForce RTX 5090
144 Points +4%
Intel Core Ultra 9 285K (Previous)
Ultra 9 285K, GeForce RTX 4090
144 Points +4%
AMD Ryzen 9 9950X3D (Previous)
R9 9950X3D, GeForce RTX 4090
138.4 Points 0%
Geekbench 6.5
Multi-Core (sort by value)
XMG Trinity X - AMD Ryzen 9 9950X3D
R9 9950X3D, GeForce RTX 5090
22850 Points
XMG Trinity X - Intel Core Ultra 9 285K
Ultra 9 285K, GeForce RTX 5090
23079 Points +1%
Intel Core Ultra 9 285K (Previous)
Ultra 9 285K, GeForce RTX 4090
21688 Points -5%
AMD Ryzen 9 9950X3D (Previous)
R9 9950X3D, GeForce RTX 4090
22405 Points -2%
Single-Core (sort by value)
XMG Trinity X - AMD Ryzen 9 9950X3D
R9 9950X3D, GeForce RTX 5090
3427 Points
XMG Trinity X - Intel Core Ultra 9 285K
Ultra 9 285K, GeForce RTX 5090
3230 Points -6%
Intel Core Ultra 9 285K (Previous)
Ultra 9 285K, GeForce RTX 4090
3306 Points -4%
AMD Ryzen 9 9950X3D (Previous)
R9 9950X3D, GeForce RTX 4090
3434 Points 0%
AIDA64
Memory Write (sort by value)
XMG Trinity X - AMD Ryzen 9 9950X3D
R9 9950X3D, GeForce RTX 5090
82642 MB/s
XMG Trinity X - Intel Core Ultra 9 285K
Ultra 9 285K, GeForce RTX 5090
87518 MB/s +6%
Intel Core Ultra 9 285K (Previous)
Ultra 9 285K, GeForce RTX 4090
84216 MB/s +2%
AMD Ryzen 9 9950X3D (Previous)
R9 9950X3D, GeForce RTX 4090
78410 MB/s -5%
Memory Read (sort by value)
XMG Trinity X - AMD Ryzen 9 9950X3D
R9 9950X3D, GeForce RTX 5090
78579 MB/s
XMG Trinity X - Intel Core Ultra 9 285K
Ultra 9 285K, GeForce RTX 5090
93805 MB/s +19%
Intel Core Ultra 9 285K (Previous)
Ultra 9 285K, GeForce RTX 4090
92063 MB/s +17%
AMD Ryzen 9 9950X3D (Previous)
R9 9950X3D, GeForce RTX 4090
76128 MB/s -3%
Memory Copy (sort by value)
XMG Trinity X - AMD Ryzen 9 9950X3D
R9 9950X3D, GeForce RTX 5090
71638 MB/s
XMG Trinity X - Intel Core Ultra 9 285K
Ultra 9 285K, GeForce RTX 5090
90298 MB/s +26%
Intel Core Ultra 9 285K (Previous)
Ultra 9 285K, GeForce RTX 4090
88386 MB/s +23%
AMD Ryzen 9 9950X3D (Previous)
R9 9950X3D, GeForce RTX 4090
70077 MB/s -2%
Memory Latency (sort by value)
XMG Trinity X - AMD Ryzen 9 9950X3D
R9 9950X3D, GeForce RTX 5090
79.4 ns *
XMG Trinity X - Intel Core Ultra 9 285K
Ultra 9 285K, GeForce RTX 5090
88.7 ns * -12%
Intel Core Ultra 9 285K (Previous)
Ultra 9 285K, GeForce RTX 4090
89.3 ns * -12%
AMD Ryzen 9 9950X3D (Previous)
R9 9950X3D, GeForce RTX 4090
77.8 ns * +2%
FP32 Ray-Trace (sort by value)
XMG Trinity X - AMD Ryzen 9 9950X3D
R9 9950X3D, GeForce RTX 5090
88746 KRay/s
XMG Trinity X - Intel Core Ultra 9 285K
Ultra 9 285K, GeForce RTX 5090
42410 KRay/s -52%
Intel Core Ultra 9 285K (Previous)
Ultra 9 285K, GeForce RTX 4090
42871 KRay/s -52%
AMD Ryzen 9 9950X3D (Previous)
R9 9950X3D, GeForce RTX 4090
84577 KRay/s -5%
FP64 Ray-Trace (sort by value)
XMG Trinity X - AMD Ryzen 9 9950X3D
R9 9950X3D, GeForce RTX 5090
46880 KRay/s
XMG Trinity X - Intel Core Ultra 9 285K
Ultra 9 285K, GeForce RTX 5090
22852 KRay/s -51%
Intel Core Ultra 9 285K (Previous)
Ultra 9 285K, GeForce RTX 4090
23501 KRay/s -50%
AMD Ryzen 9 9950X3D (Previous)
R9 9950X3D, GeForce RTX 4090
43617 KRay/s -7%
FPU Julia (sort by value)
XMG Trinity X - AMD Ryzen 9 9950X3D
R9 9950X3D, GeForce RTX 5090
425461 Points
XMG Trinity X - Intel Core Ultra 9 285K
Ultra 9 285K, GeForce RTX 5090
217182 Points -49%
Intel Core Ultra 9 285K (Previous)
Ultra 9 285K, GeForce RTX 4090
220808 Points -48%
AMD Ryzen 9 9950X3D (Previous)
R9 9950X3D, GeForce RTX 4090
246125 Points -42%
FPU SinJulia (sort by value)
XMG Trinity X - AMD Ryzen 9 9950X3D
R9 9950X3D, GeForce RTX 5090
34891 Points
XMG Trinity X - Intel Core Ultra 9 285K
Ultra 9 285K, GeForce RTX 5090
14741 Points -58%
Intel Core Ultra 9 285K (Previous)
Ultra 9 285K, GeForce RTX 4090
14755 Points -58%
AMD Ryzen 9 9950X3D (Previous)
R9 9950X3D, GeForce RTX 4090
34073 Points -2%
FPU Mandel (sort by value)
XMG Trinity X - AMD Ryzen 9 9950X3D
R9 9950X3D, GeForce RTX 5090
224752 Points
XMG Trinity X - Intel Core Ultra 9 285K
Ultra 9 285K, GeForce RTX 5090
111625 Points -50%
Intel Core Ultra 9 285K (Previous)
Ultra 9 285K, GeForce RTX 4090
114044 Points -49%
AMD Ryzen 9 9950X3D (Previous)
R9 9950X3D, GeForce RTX 4090
129745 Points -42%
CPU SHA3 (sort by value)
XMG Trinity X - AMD Ryzen 9 9950X3D
R9 9950X3D, GeForce RTX 5090
11055 MB/s
XMG Trinity X - Intel Core Ultra 9 285K
Ultra 9 285K, GeForce RTX 5090
9987 MB/s -10%
Intel Core Ultra 9 285K (Previous)
Ultra 9 285K, GeForce RTX 4090
10804 MB/s -2%
AMD Ryzen 9 9950X3D (Previous)
R9 9950X3D, GeForce RTX 4090
10405 MB/s -6%
CPU AES (sort by value)
XMG Trinity X - AMD Ryzen 9 9950X3D
R9 9950X3D, GeForce RTX 5090
257033 MB/s
XMG Trinity X - Intel Core Ultra 9 285K
Ultra 9 285K, GeForce RTX 5090
141426 MB/s -45%
Intel Core Ultra 9 285K (Previous)
Ultra 9 285K, GeForce RTX 4090
253364 MB/s -1%
AMD Ryzen 9 9950X3D (Previous)
R9 9950X3D, GeForce RTX 4090
172869 MB/s -33%
CPU ZLib (sort by value)
XMG Trinity X - AMD Ryzen 9 9950X3D
R9 9950X3D, GeForce RTX 5090
2728.1 MB/s
XMG Trinity X - Intel Core Ultra 9 285K
Ultra 9 285K, GeForce RTX 5090
2366.9 MB/s -13%
Intel Core Ultra 9 285K (Previous)
Ultra 9 285K, GeForce RTX 4090
2380 MB/s -13%
AMD Ryzen 9 9950X3D (Previous)
R9 9950X3D, GeForce RTX 4090
2674 MB/s -2%
CPU PhotoWorxx (sort by value)
XMG Trinity X - AMD Ryzen 9 9950X3D
R9 9950X3D, GeForce RTX 5090
52631 MPixel/s
XMG Trinity X - Intel Core Ultra 9 285K
Ultra 9 285K, GeForce RTX 5090
63167 MPixel/s +20%
Intel Core Ultra 9 285K (Previous)
Ultra 9 285K, GeForce RTX 4090
54680 MPixel/s +4%
AMD Ryzen 9 9950X3D (Previous)
R9 9950X3D, GeForce RTX 4090
48827 MPixel/s -7%
PassMark PerformanceTest V11 - Passmark Rating 11.1 (sort by value)
XMG Trinity X - AMD Ryzen 9 9950X3D
R9 9950X3D, GeForce RTX 5090
19193 Points
XMG Trinity X - Intel Core Ultra 9 285K
Ultra 9 285K, GeForce RTX 5090
19778.4 Points +3%
PCMark 10
Extended Score (sort by value)
XMG Trinity X - AMD Ryzen 9 9950X3D
R9 9950X3D, GeForce RTX 5090
17833 Points
XMG Trinity X - Intel Core Ultra 9 285K
Ultra 9 285K, GeForce RTX 5090
17007 Points -5%
Digital Content Creation (sort by value)
XMG Trinity X - AMD Ryzen 9 9950X3D
R9 9950X3D, GeForce RTX 5090
22442 Points
XMG Trinity X - Intel Core Ultra 9 285K
Ultra 9 285K, GeForce RTX 5090
22996 Points +2%
Intel Core Ultra 9 285K (Previous)
Ultra 9 285K, GeForce RTX 4090
22005 Points -2%
AMD Ryzen 9 9950X3D (Previous)
R9 9950X3D, GeForce RTX 4090
22121 Points -1%
Productivity (sort by value)
XMG Trinity X - AMD Ryzen 9 9950X3D
R9 9950X3D, GeForce RTX 5090
18234 Points
XMG Trinity X - Intel Core Ultra 9 285K
Ultra 9 285K, GeForce RTX 5090
19922 Points +9%
Intel Core Ultra 9 285K (Previous)
Ultra 9 285K, GeForce RTX 4090
12340 Points -32%
AMD Ryzen 9 9950X3D (Previous)
R9 9950X3D, GeForce RTX 4090
12578 Points -31%
Essentials (sort by value)
XMG Trinity X - AMD Ryzen 9 9950X3D
R9 9950X3D, GeForce RTX 5090
12523 Points
XMG Trinity X - Intel Core Ultra 9 285K
Ultra 9 285K, GeForce RTX 5090
12022 Points -4%
Intel Core Ultra 9 285K (Previous)
Ultra 9 285K, GeForce RTX 4090
11613 Points -7%
AMD Ryzen 9 9950X3D (Previous)
R9 9950X3D, GeForce RTX 4090
12435 Points -1%
Gaming (sort by value)
XMG Trinity X - AMD Ryzen 9 9950X3D
R9 9950X3D, GeForce RTX 5090
53320 Points
XMG Trinity X - Intel Core Ultra 9 285K
Ultra 9 285K, GeForce RTX 5090
41041 Points -23%

* ... smaller is better

存储性能

虽然两款系统都支持 PCIe 5.0 固态硬盘,但英特尔主板似乎在某种程度上限制了 PCIe 5.0 X4 插槽,因为 CrystalDiskMark 报告称,最大读取速度仅达到 12 GB/s 以上,而不是 14 GB/s。不过,在模拟实际使用情况的测试中,这一限制并没有成为问题。事实上,英特尔系统在 3DMark 存储测试中快 13%,在 DirectStorage 测试中快 4%。

AMD 系统
AMD 系统
英特尔系统
英特尔系统
3DMark
Storage Score
XMG Trinity X - Intel
GeForce RTX 5090, Ultra 9 285K, Samsung 9100 Pro 2 TB
4204 Points +13%
XMG Trinity X - AMD
GeForce RTX 5090, R9 9950X3D, Samsung 9100 Pro 2 TB
3704 Points
DirectStorage
XMG Trinity X - Intel
GeForce RTX 5090, Ultra 9 285K, Samsung 9100 Pro 2 TB
200.3 % +4%
XMG Trinity X - AMD
GeForce RTX 5090, R9 9950X3D, Samsung 9100 Pro 2 TB
193.3 %

3D 渲染性能

通过分析 3DMark 套件中最受欢迎的测试,我们发现两款系统在Steel Nomad 和Time Spy Extreme 等 4K 测试以及 1440p Speed Way 测试中不相上下。另一方面,英特尔系统在 Port Royal 和Time Spy 1440p 测试中占据优势,性能差距高达 29%。

在 SpecViewPerf 15 中,两款系统互有胜负,但 AMD 略胜一筹。

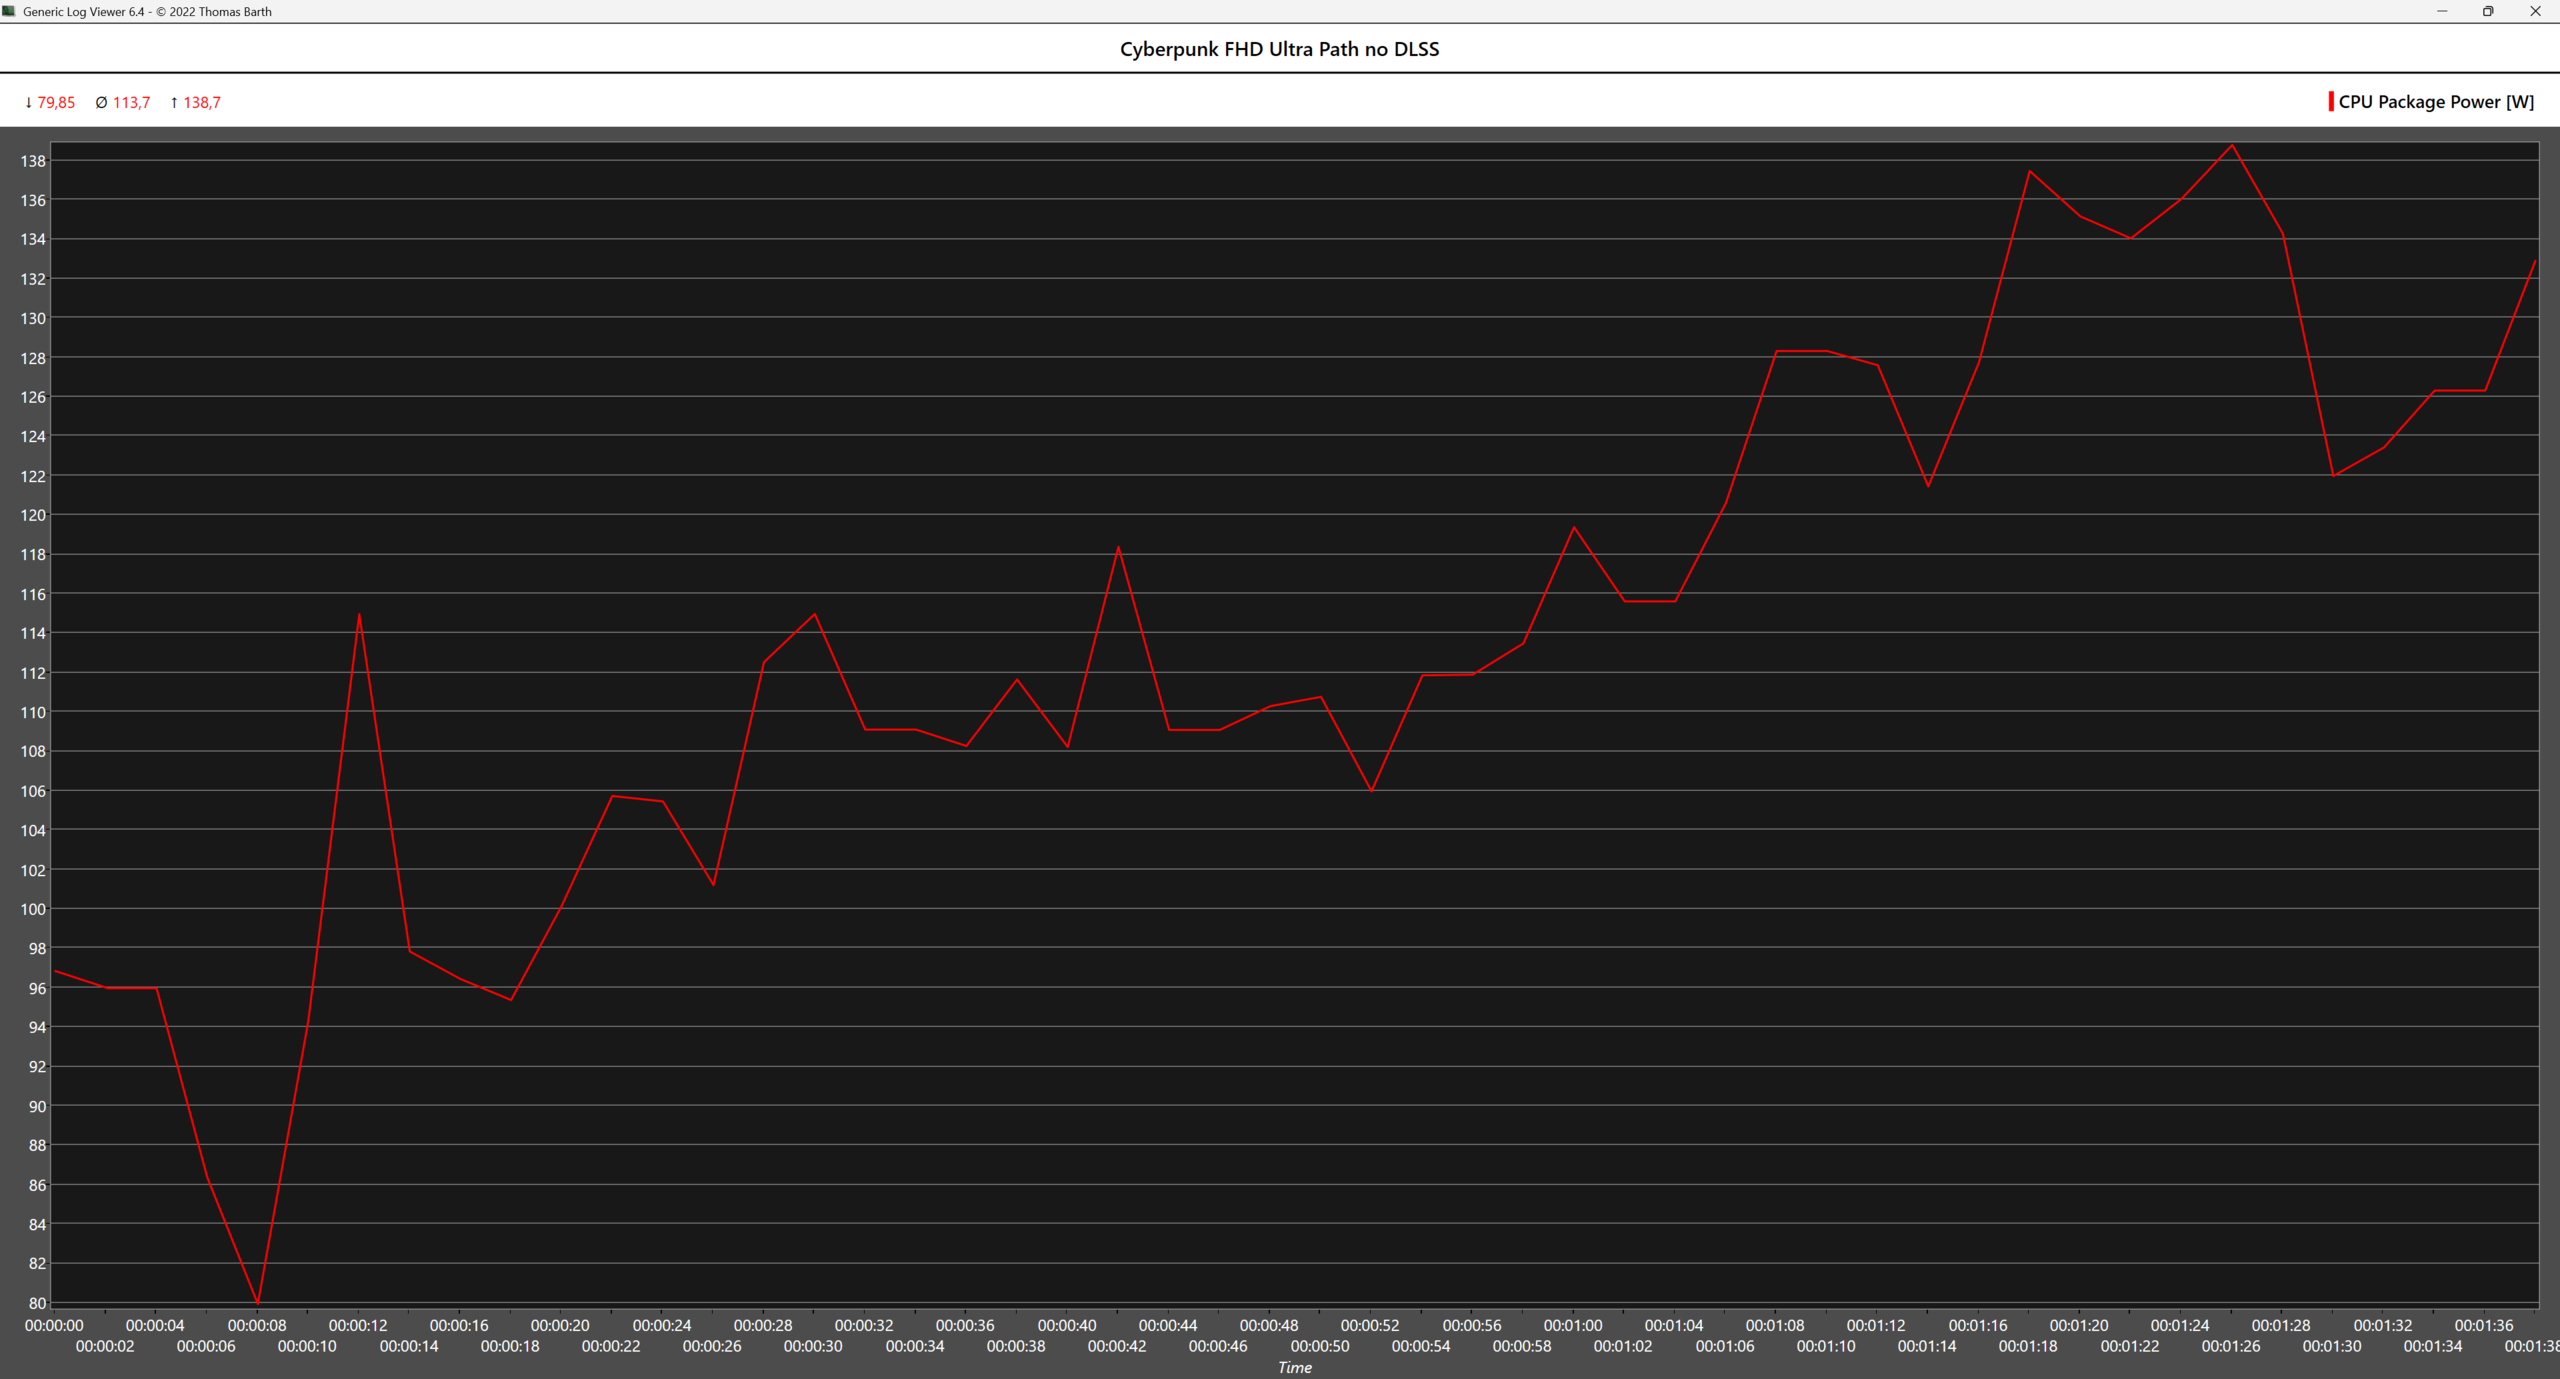
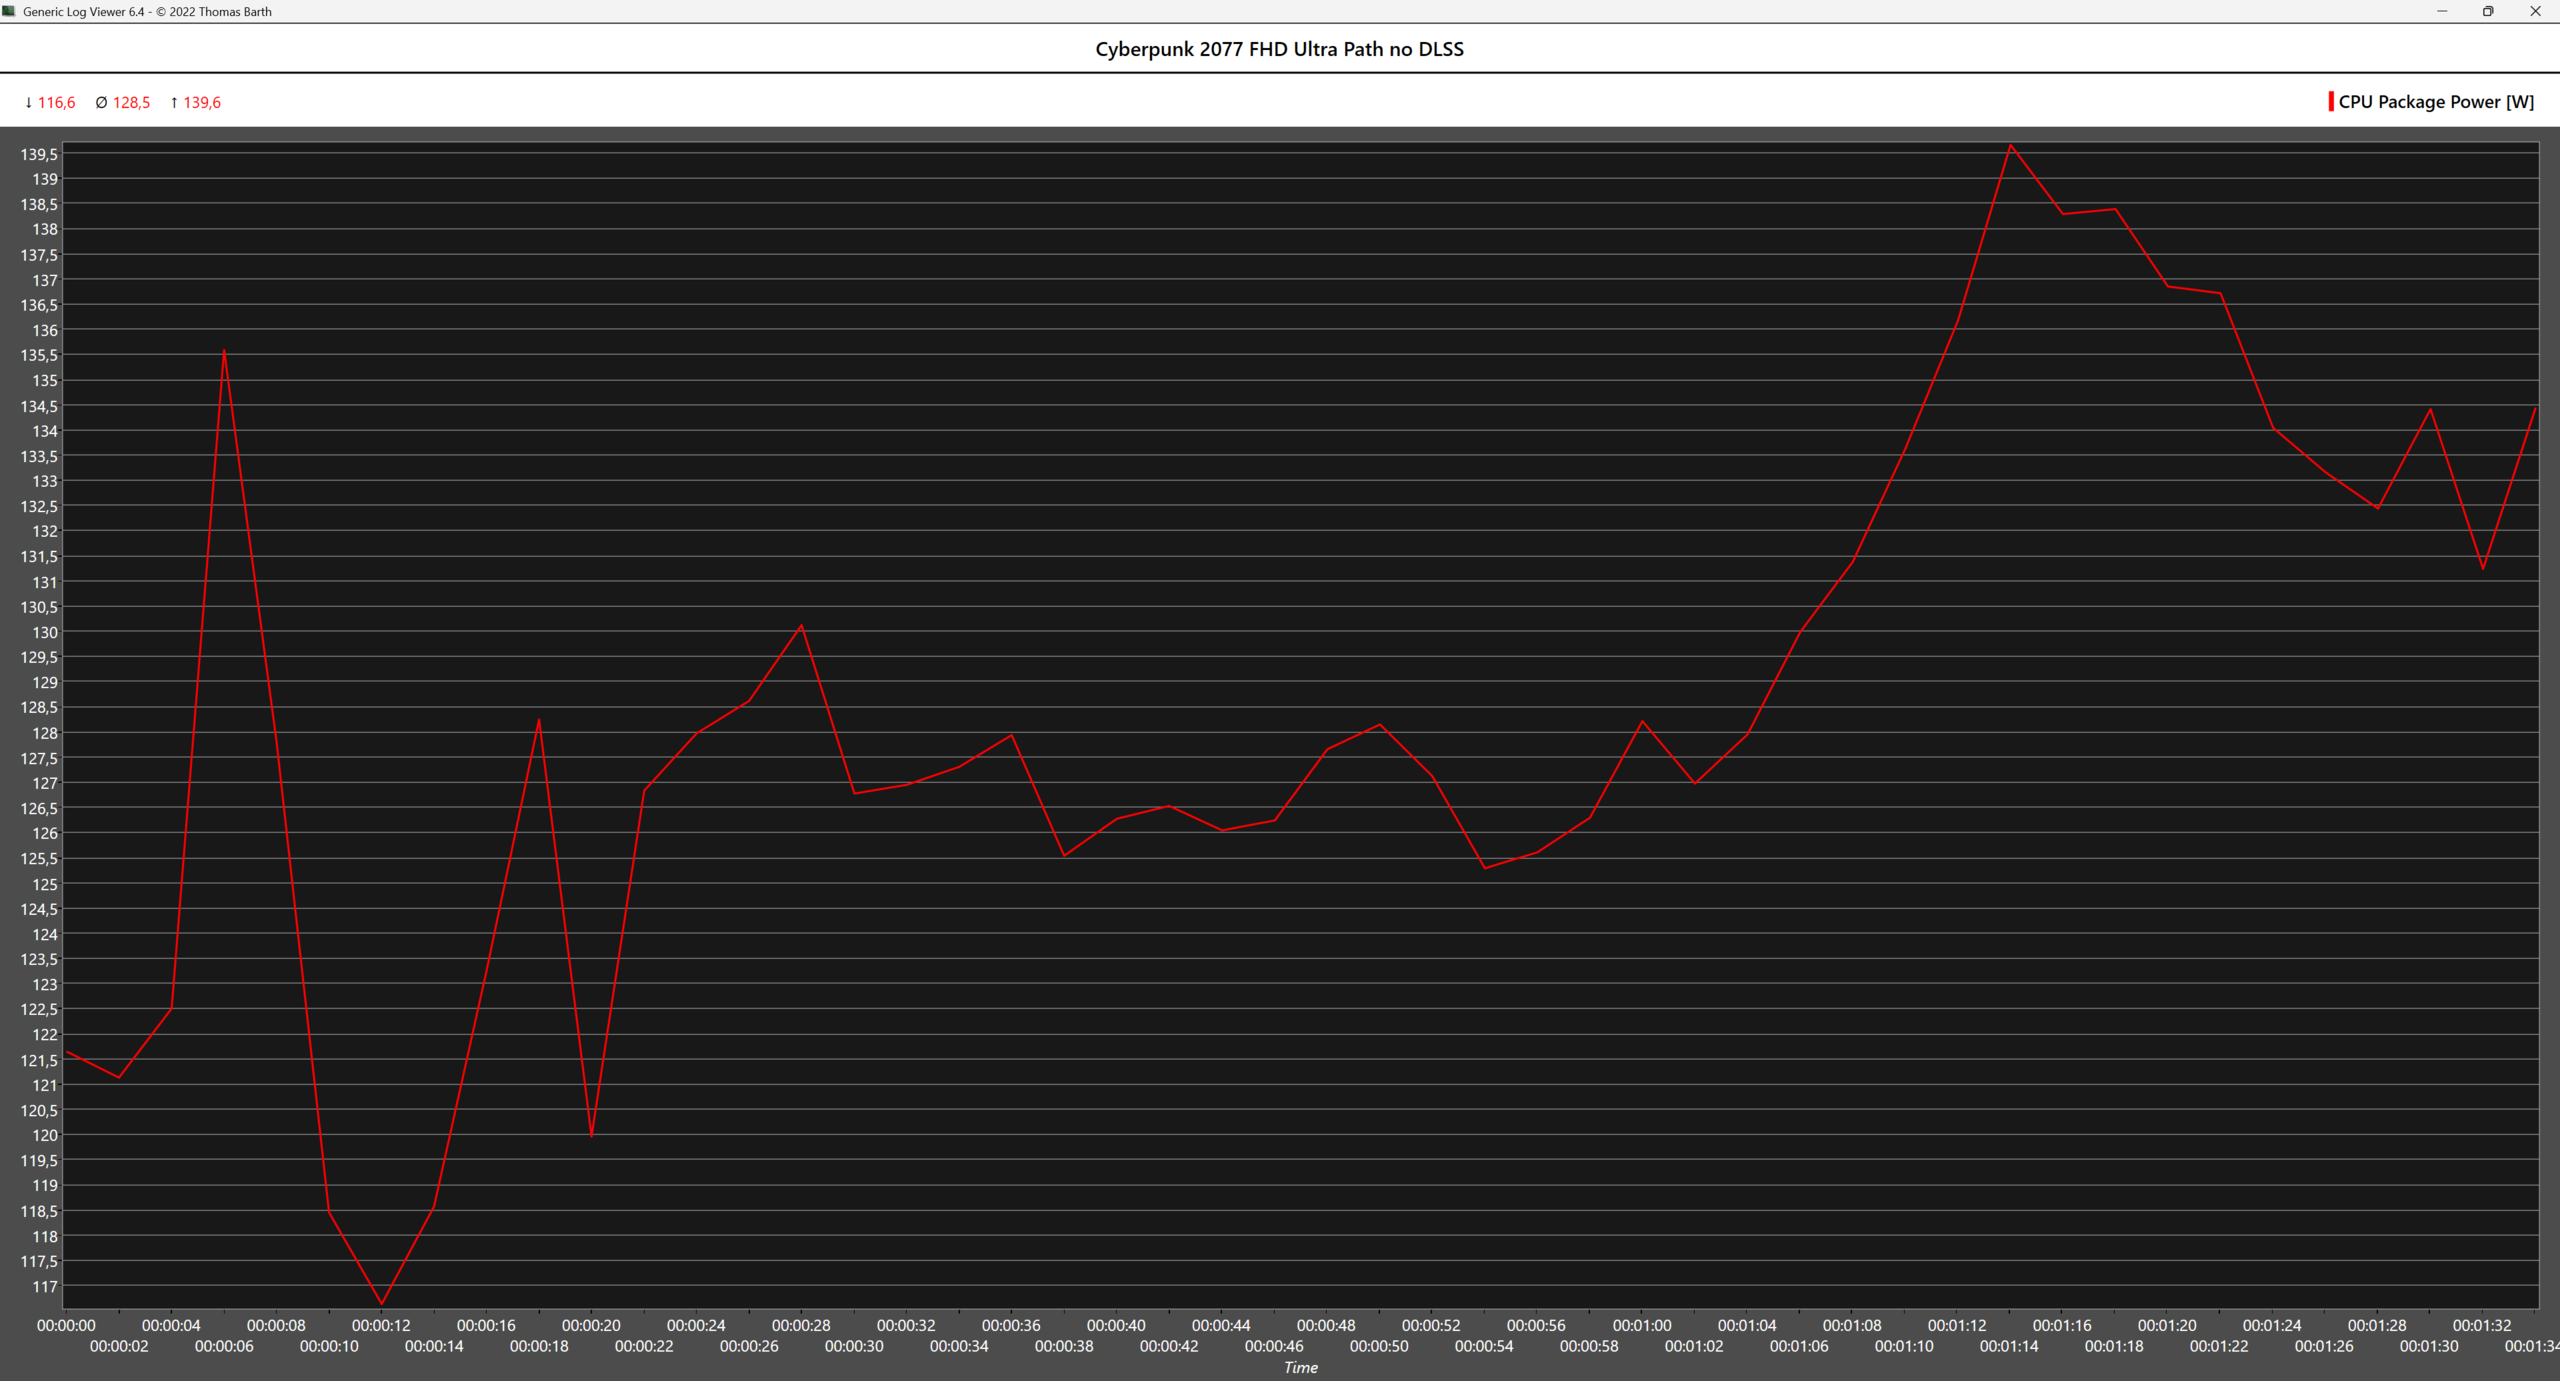
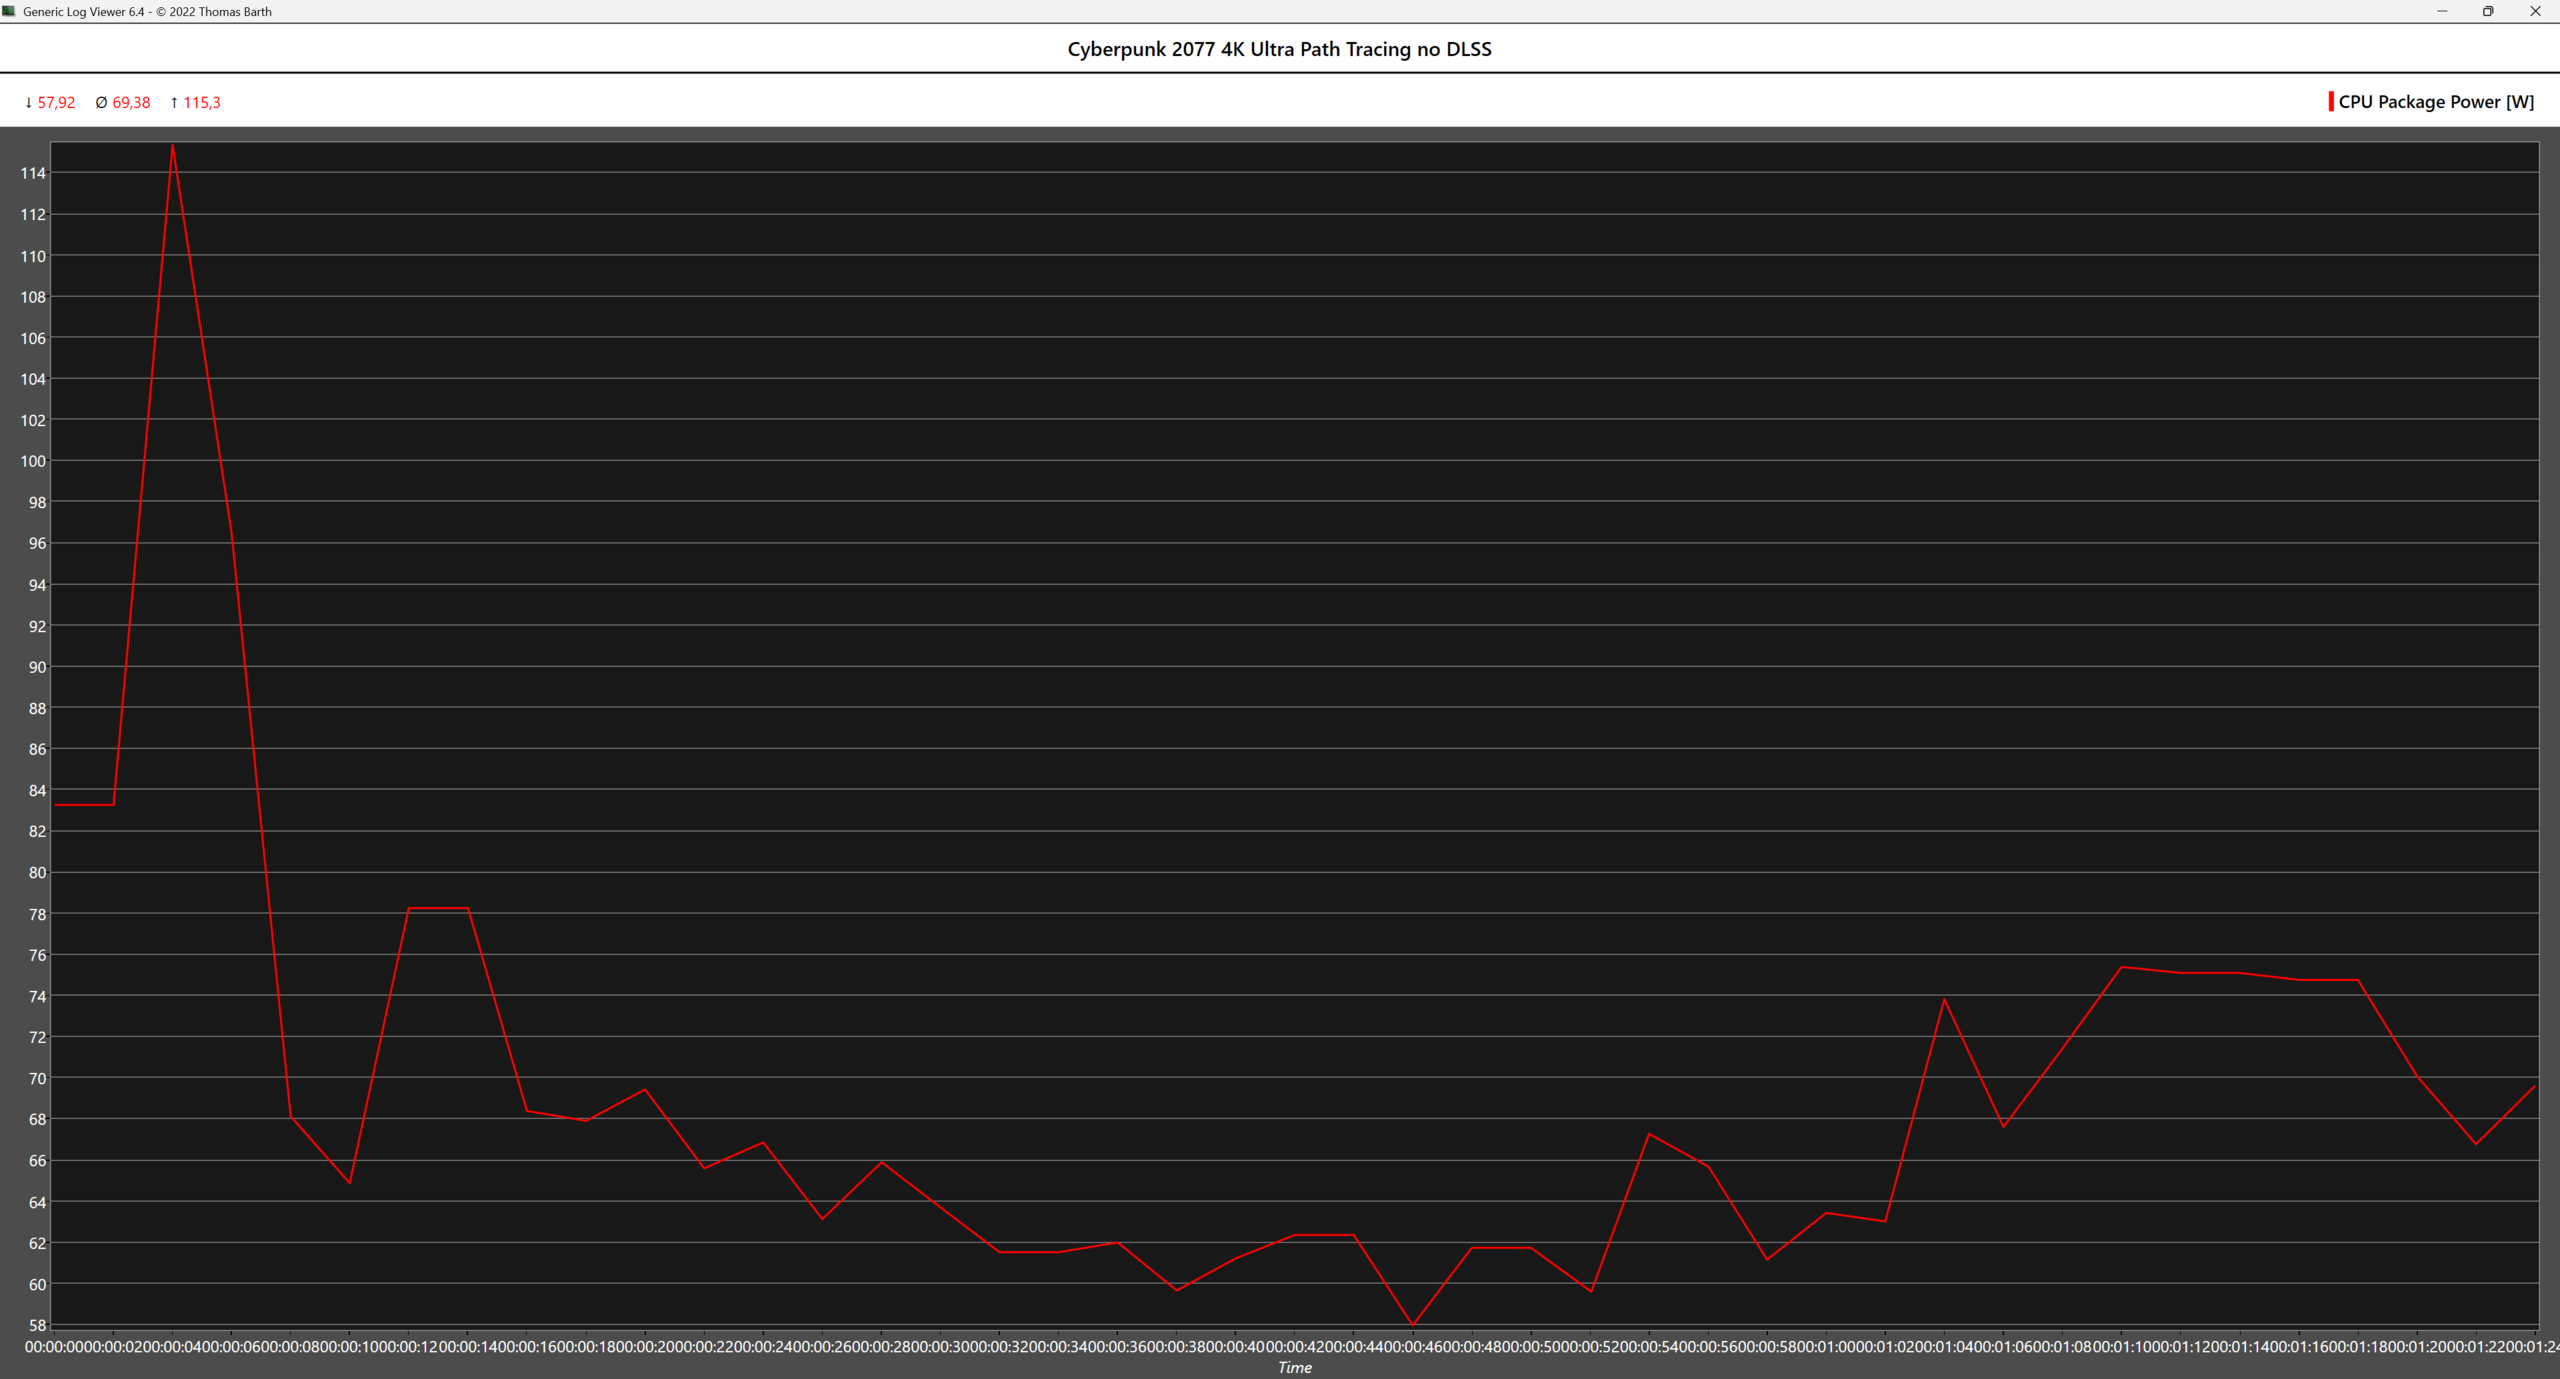
在所有其他设置为最大值的 4K 非 DLSS 游戏中,AMD 系统在 8 款游戏中的 6 款中处于领先地位,尽管差距很小,但《赛博朋克 2077》是个例外,AMD 系统的 RTX 5090 在该游戏中的性能几乎是英特尔平台 RTX 5090 的两倍。当启用 DLSS 画质和帧生成功能以及路径追踪和光线重构功能时,情况就比较平衡了,两款系统分别在 4 款游戏中胜出。其中有两款游戏表现突出:在《艾伦觉醒 2》中,英特尔平台的速度快了 56.85%,而在《赛博朋克 2077》中,AMD 平台的速度快了 81.83%。其他方面的差异均为个位数。

生成式人工智能能力还通过ComfyUI 和 Wan 2.2 图像-视频进行了测试。.RTX 5090 搭配任一款 CPU 都能渲染 10 秒钟的 mp4 视频,分辨率如下:

  • 480 x 704,5 分钟
  • 672 x 992,7 分 28 秒
  • 800 x 1152,10 分 55 秒
3DMark / Port Royal Graphics
XMG Trinity X - Intel
GeForce RTX 5090, Ultra 9 285K, Samsung 9100 Pro 2 TB
34265 Points +17%
XMG Trinity X - AMD
GeForce RTX 5090, R9 9950X3D, Samsung 9100 Pro 2 TB
29178 Points
3DMark / Speed Way Score
XMG Trinity X - AMD
GeForce RTX 5090, R9 9950X3D, Samsung 9100 Pro 2 TB
14814 Points
XMG Trinity X - Intel
GeForce RTX 5090, Ultra 9 285K, Samsung 9100 Pro 2 TB
14641 Points -1%
3DMark / Steel Nomad Score
XMG Trinity X - Intel
GeForce RTX 5090, Ultra 9 285K, Samsung 9100 Pro 2 TB
14509 Points 0%
XMG Trinity X - AMD
GeForce RTX 5090, R9 9950X3D, Samsung 9100 Pro 2 TB
14472 Points
3DMark / Time Spy Score
XMG Trinity X - Intel
GeForce RTX 5090, Ultra 9 285K, Samsung 9100 Pro 2 TB
38584 Points +26%
XMG Trinity X - AMD
GeForce RTX 5090, R9 9950X3D, Samsung 9100 Pro 2 TB
30709 Points
3DMark / Time Spy Graphics
XMG Trinity X - Intel
GeForce RTX 5090, Ultra 9 285K, Samsung 9100 Pro 2 TB
46954 Points +29%
XMG Trinity X - AMD
GeForce RTX 5090, R9 9950X3D, Samsung 9100 Pro 2 TB
36435 Points
3DMark / Time Spy CPU
XMG Trinity X - Intel
GeForce RTX 5090, Ultra 9 285K, Samsung 9100 Pro 2 TB
19195 Points +18%
XMG Trinity X - AMD
GeForce RTX 5090, R9 9950X3D, Samsung 9100 Pro 2 TB
16244 Points
3DMark / Time Spy Extreme Score
XMG Trinity X - AMD
GeForce RTX 5090, R9 9950X3D, Samsung 9100 Pro 2 TB
22832 Points
XMG Trinity X - Intel
GeForce RTX 5090, Ultra 9 285K, Samsung 9100 Pro 2 TB
22820 Points 0%
3DMark / Time Spy Extreme Graphics
XMG Trinity X - AMD
GeForce RTX 5090, R9 9950X3D, Samsung 9100 Pro 2 TB
25827 Points
XMG Trinity X - Intel
GeForce RTX 5090, Ultra 9 285K, Samsung 9100 Pro 2 TB
25548 Points -1%
3DMark / Time Spy Extreme CPU
XMG Trinity X - Intel
GeForce RTX 5090, Ultra 9 285K, Samsung 9100 Pro 2 TB
14218 Points +3%
XMG Trinity X - AMD
GeForce RTX 5090, R9 9950X3D, Samsung 9100 Pro 2 TB
13779 Points
SPECviewperf 15 / 3ds Max 2023 (3dsmax-08)
XMG Trinity X - AMD
GeForce RTX 5090, R9 9950X3D, Samsung 9100 Pro 2 TB
106.02 fps
XMG Trinity X - Intel
GeForce RTX 5090, Ultra 9 285K, Samsung 9100 Pro 2 TB
101.89 fps -4%
SPECviewperf 15 / Blender 3.6 (blender-01)
XMG Trinity X - Intel
GeForce RTX 5090, Ultra 9 285K, Samsung 9100 Pro 2 TB
114.91 fps +2%
XMG Trinity X - AMD
GeForce RTX 5090, R9 9950X3D, Samsung 9100 Pro 2 TB
112.81 fps
SPECviewperf 15 / Catia V5 (catia-07)
XMG Trinity X - AMD
GeForce RTX 5090, R9 9950X3D, Samsung 9100 Pro 2 TB
86.17 fps
XMG Trinity X - Intel
GeForce RTX 5090, Ultra 9 285K, Samsung 9100 Pro 2 TB
84.01 fps -3%
SPECviewperf 15 / Creo 9 (creo-04)
XMG Trinity X - AMD
GeForce RTX 5090, R9 9950X3D, Samsung 9100 Pro 2 TB
134.48 fps
XMG Trinity X - Intel
GeForce RTX 5090, Ultra 9 285K, Samsung 9100 Pro 2 TB
126.88 fps -6%
SPECviewperf 15 / OpendTect (energy-04)
XMG Trinity X - Intel
GeForce RTX 5090, Ultra 9 285K, Samsung 9100 Pro 2 TB
94.49 fps 0%
XMG Trinity X - AMD
GeForce RTX 5090, R9 9950X3D, Samsung 9100 Pro 2 TB
94.09 fps
SPECviewperf 15 / Enscape 4.0 (enscape-01)
XMG Trinity X - AMD
GeForce RTX 5090, R9 9950X3D, Samsung 9100 Pro 2 TB
69.66 fps
XMG Trinity X - Intel
GeForce RTX 5090, Ultra 9 285K, Samsung 9100 Pro 2 TB
69.36 fps 0%
SPECviewperf 15 / Maya 2025 (maya-07)
XMG Trinity X - AMD
GeForce RTX 5090, R9 9950X3D, Samsung 9100 Pro 2 TB
183.33 fps
XMG Trinity X - Intel
GeForce RTX 5090, Ultra 9 285K, Samsung 9100 Pro 2 TB
171.95 fps -6%
SPECviewperf 15 / Tuvok (medical-04)
XMG Trinity X - Intel
GeForce RTX 5090, Ultra 9 285K, Samsung 9100 Pro 2 TB
51.17 fps 0%
XMG Trinity X - AMD
GeForce RTX 5090, R9 9950X3D, Samsung 9100 Pro 2 TB
50.99 fps
SPECviewperf 15 / Solidworks 2024 (solidworks-08)
XMG Trinity X - AMD
GeForce RTX 5090, R9 9950X3D, Samsung 9100 Pro 2 TB
58.5 fps
XMG Trinity X - Intel
GeForce RTX 5090, Ultra 9 285K, Samsung 9100 Pro 2 TB
57.95 fps -1%
SPECviewperf 15 / Unreal Engine 5.4.2 (unreal_engine-01)
XMG Trinity X - AMD
GeForce RTX 5090, R9 9950X3D, Samsung 9100 Pro 2 TB
113.02 fps
XMG Trinity X - Intel
GeForce RTX 5090, Ultra 9 285K, Samsung 9100 Pro 2 TB
105.87 fps -6%

游戏性能

Alan Wake 2

艾伦-唤醒 2 4K 无 DLSS
艾伦-唤醒 2 4K 无 DLSS
艾伦-唤醒 2 4K DLSS 质量 + FG X4
Core Ultra 9 285K 艾伦觉醒 2 4K 无 DLSS 详细视图
Core Ultra 9 285K 艾伦觉醒 2 4K DLSS 画质 + FG X4 详细视图
Ryzen 9 9950X3D 艾伦觉醒 2 4K 无 DLSS 详细视图
Ryzen 9 9950X3D 艾伦觉醒 2 4K DLSS 画质 + FG X4 详细视图

Black Myth: Wukong

黑色神话:悟空 4K 没有 DLSS
黑色神话:悟空 4K 没有 DLSS
黑色神话:悟空 4K DLSS 画质 + FG X4
酷睿超 9 285K 黑色神话:悟空 4K 无 DLSS 详细视图
Core Ultra 9 285K 黑色神话:悟空 4K DLSS 画质 + FG X4 详细视图
Ryzen 9 9950X3D 黑色神话:悟空 4K 无 DLSS 详细视图
Ryzen 9 9950X3D 黑色神话:悟空 4K DLSS 画质 + FG X4 详细视图

Cyberpunk 2077

赛博朋克 2077 4K 无 DLSS
赛博朋克 2077 4K 无 DLSS
赛博朋克 2077 4K DLSS 画质 + FG X4
Core Ultra 9 285K 赛博朋克 2077 4K 无 DLSS 详细视图
Core Ultra 9 285K 赛博朋克 2077 4K DLSS 画质 + FG X4 详细视图
Ryzen 9 9950X3D 赛博朋克 2077 4K 无 DLSS 详细视图
Ryzen 9 9950X3D 赛博朋克 2077 4K DLSS 画质 + FG X4 详细视图

Doom - The Dark Ages

毁灭战士黑暗时代 4K 无 DLSS
毁灭战士黑暗时代 4K 无 DLSS
毁灭战士黑暗时代 4K DLSS 画质 + FG X4
Core Ultra 9 285K 《毁灭战士:黑暗时代》4K 无 DLSS 详细视图
核心超 9 285K 《毁灭战士:黑暗时代》4K DLSS 画质 + FG X4 详细视图
Ryzen 9 9950X3D Doom The Dark Ages 4K no DLSS 详细视图
Ryzen 9 9950X3D 《毁灭战士:黑暗时代》4K DLSS 画质 + FG X4 详细视图

Forza Horizon 5

极限竞速地平线 5 4K 没有 DLSS
极限竞速地平线 5 4K DLSS 质量 + FG
Core Ultra 9 285K Forza Horizon 5 4K no DLSS 详细视图
Core Ultra 9 285K Forza Horizon 5 4K DLSS 画质 + FG 详细视图
Ryzen 9 9950X3D Forza Horizon 5 4K 无 DLSS 详细视图
Ryzen 9 9950X3D Forza Horizon 5 4K DLSS 画质 + FG 详细视图

Red Dead Redemption 2

死亡救赎 2 4K 无 DLSS
死亡救赎 2 4K 无 DLSS
死亡救赎 2 4K DLSS 质量
死亡救赎 2 4K DLSS 质量
Core Ultra 9 285K Red Dead Redemption 2 4K no DLSS 详细视图
Core Ultra 9 285K Red Dead Redemption 2 4K DLSS 品质详细视图
Ryzen 9 9950X3D 《红色死亡救赎 2》4K(无 DLSS)详细视图
Ryzen 9 9950X3D 《红色死亡救赎 2》4K DLSS 品质详细视图

S.T.A.L.K.E.R. 2 - Heart of Chernobyl

潜行者 2 4K 无 DLSS
潜行者 2 4K 无 DLSS
潜行者 2 4K DLSS 质量 + FG
Core Ultra 9 285K Stalker 2 4K no DLSS 详细视图
Core Ultra 9 285K Stalker 2 4K DLSS 质量 + FG 详细视图
Ryzen 9 9950X3D Stalker 2 4K 无 DLSS 详细视图
Ryzen 9 9950X3D Stalker 2 4K DLSS 质量 + FG 详细视图

The Last of Us Part I
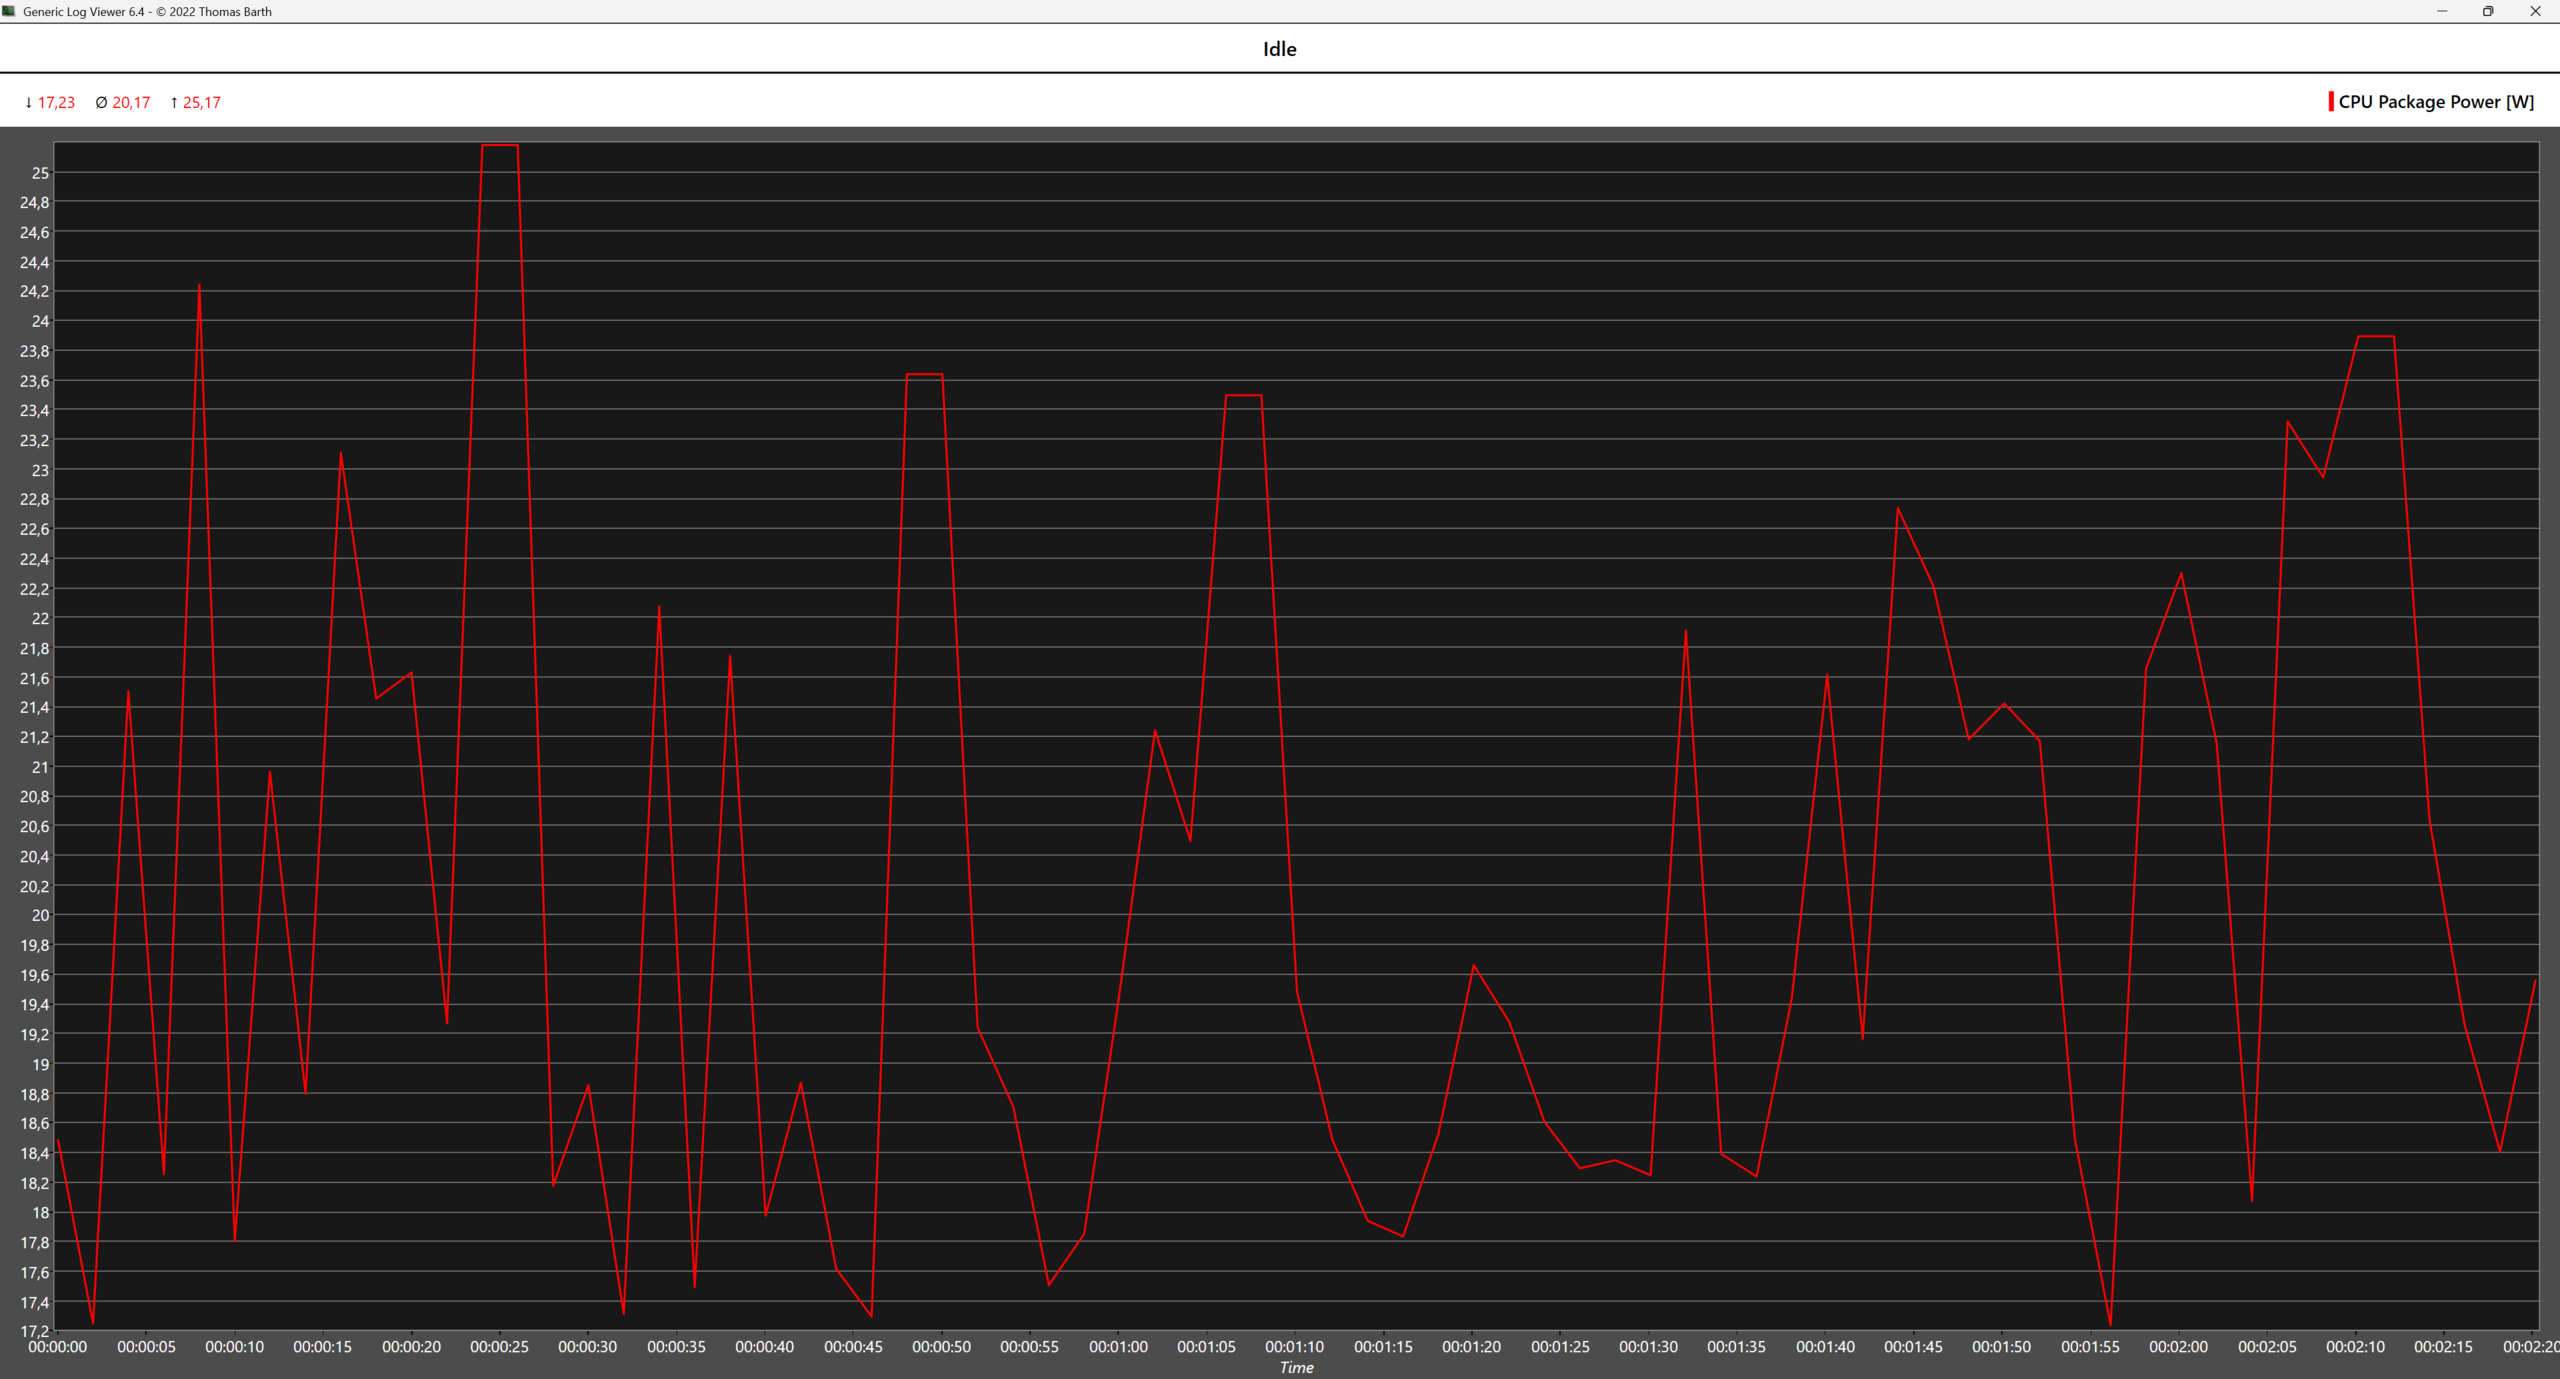
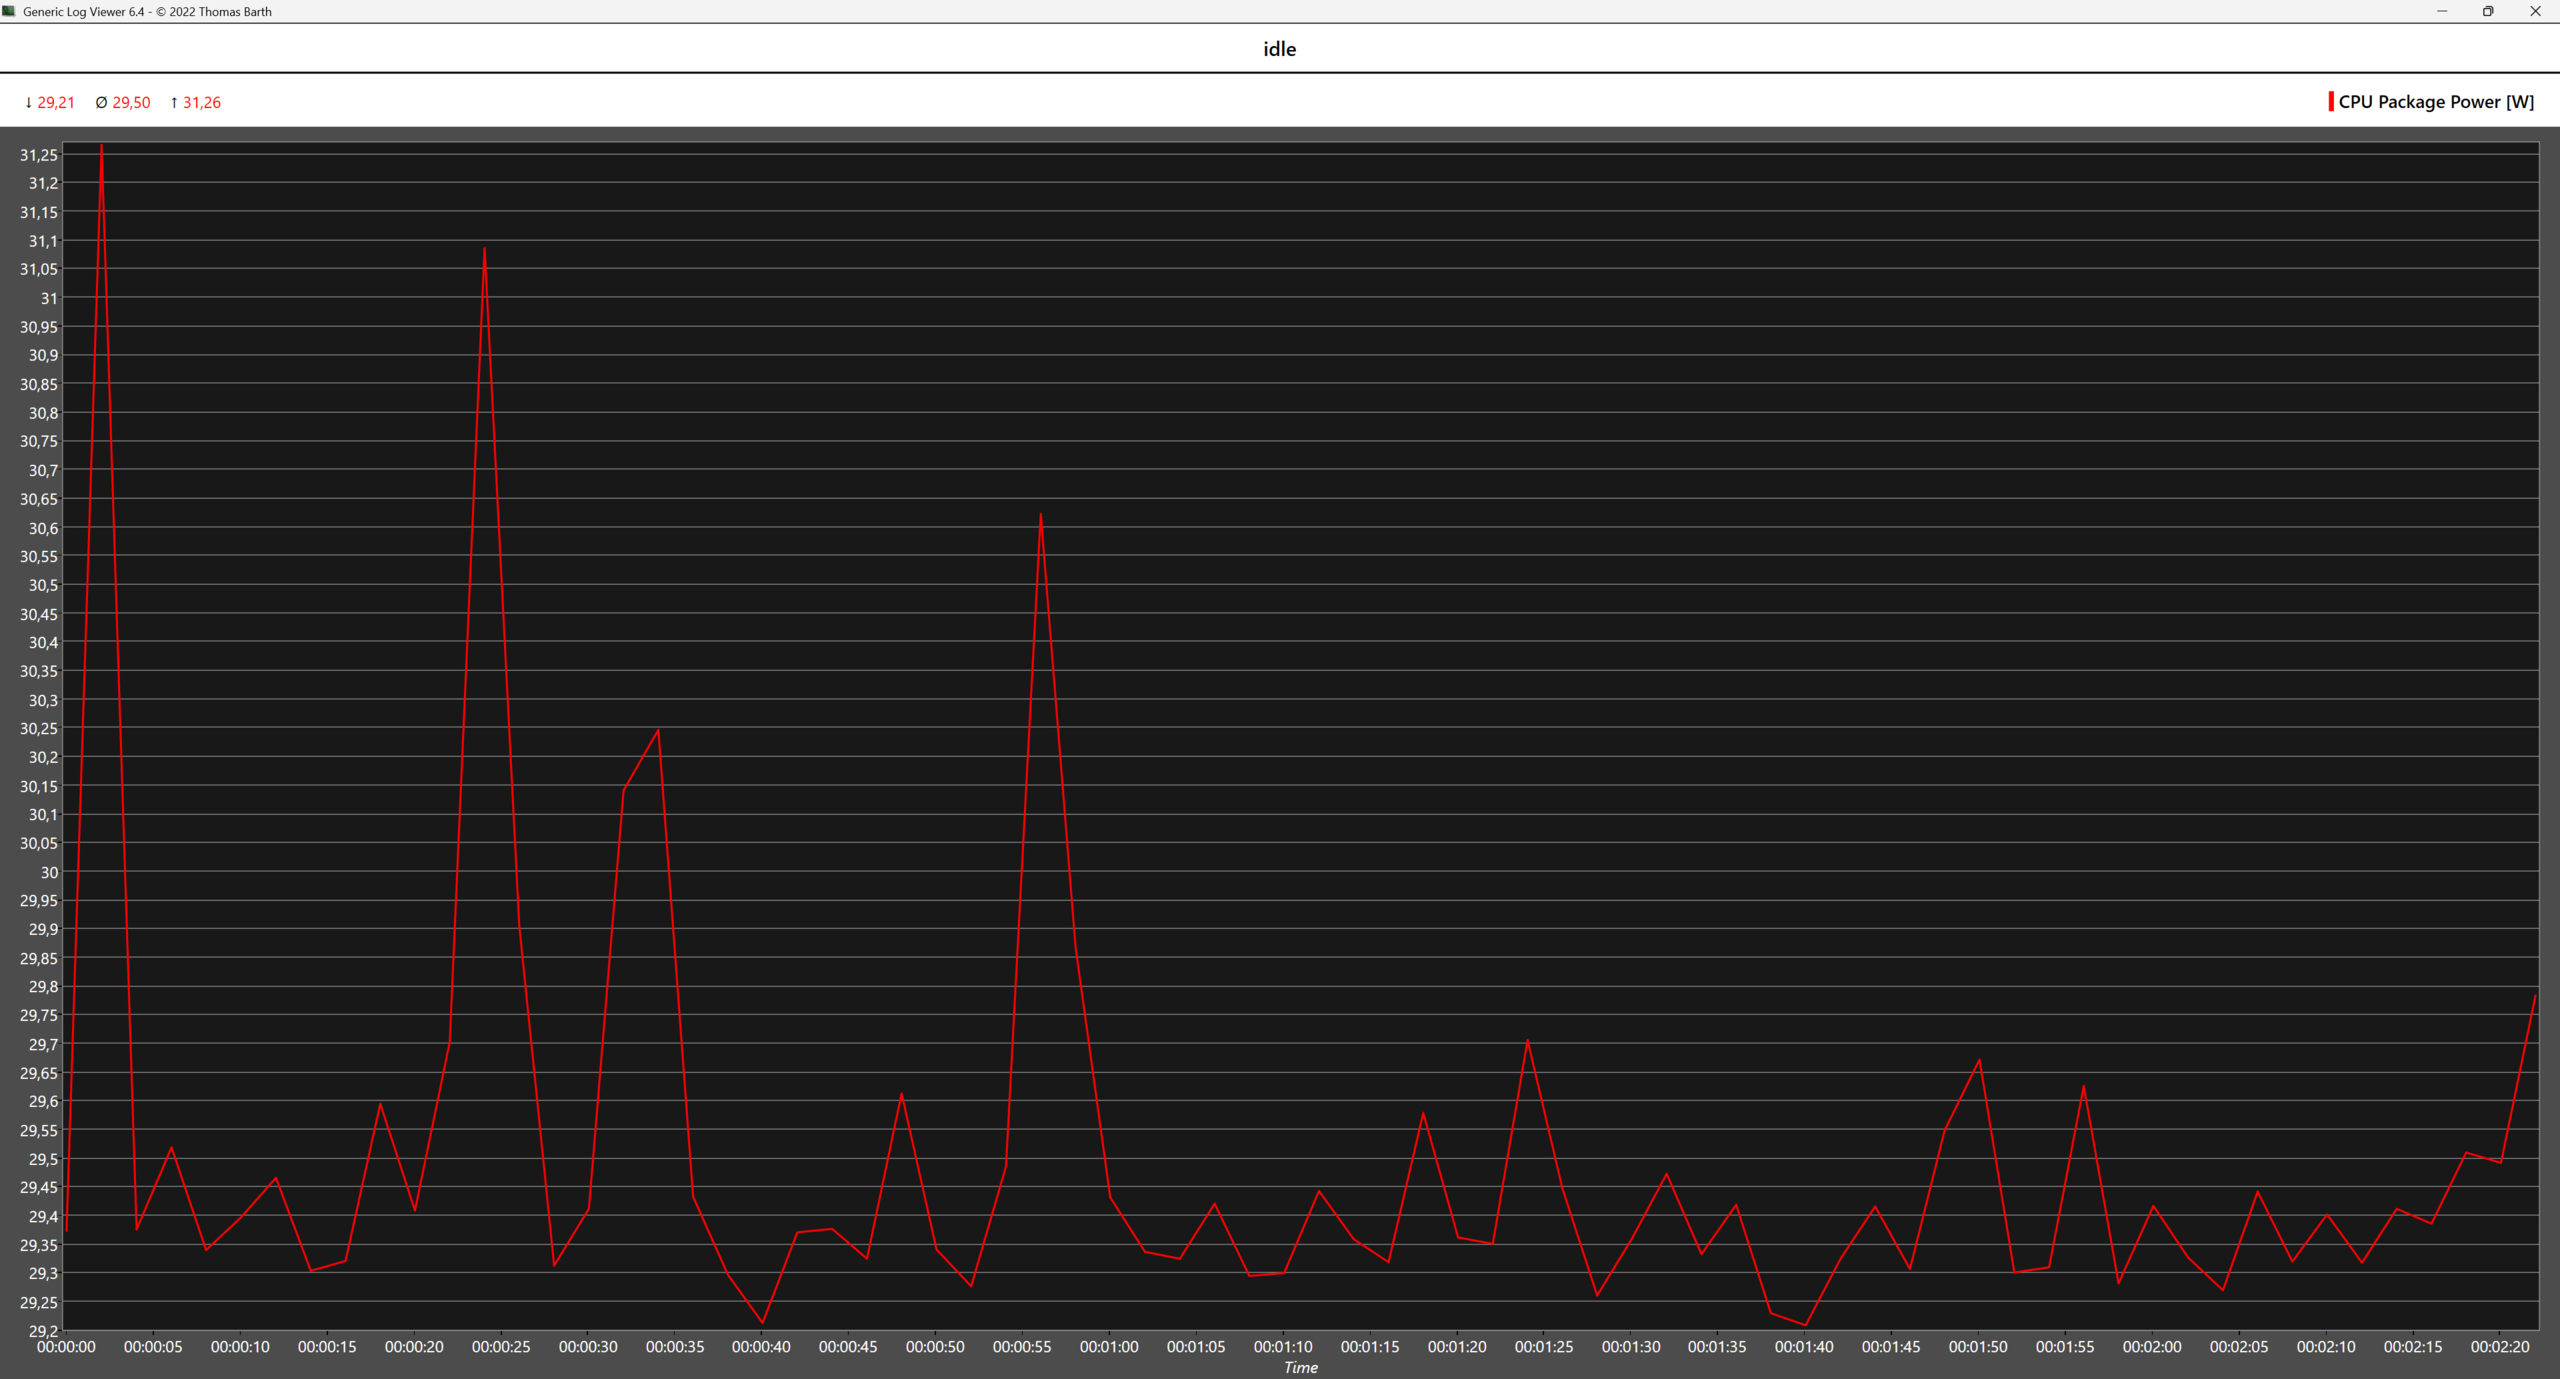
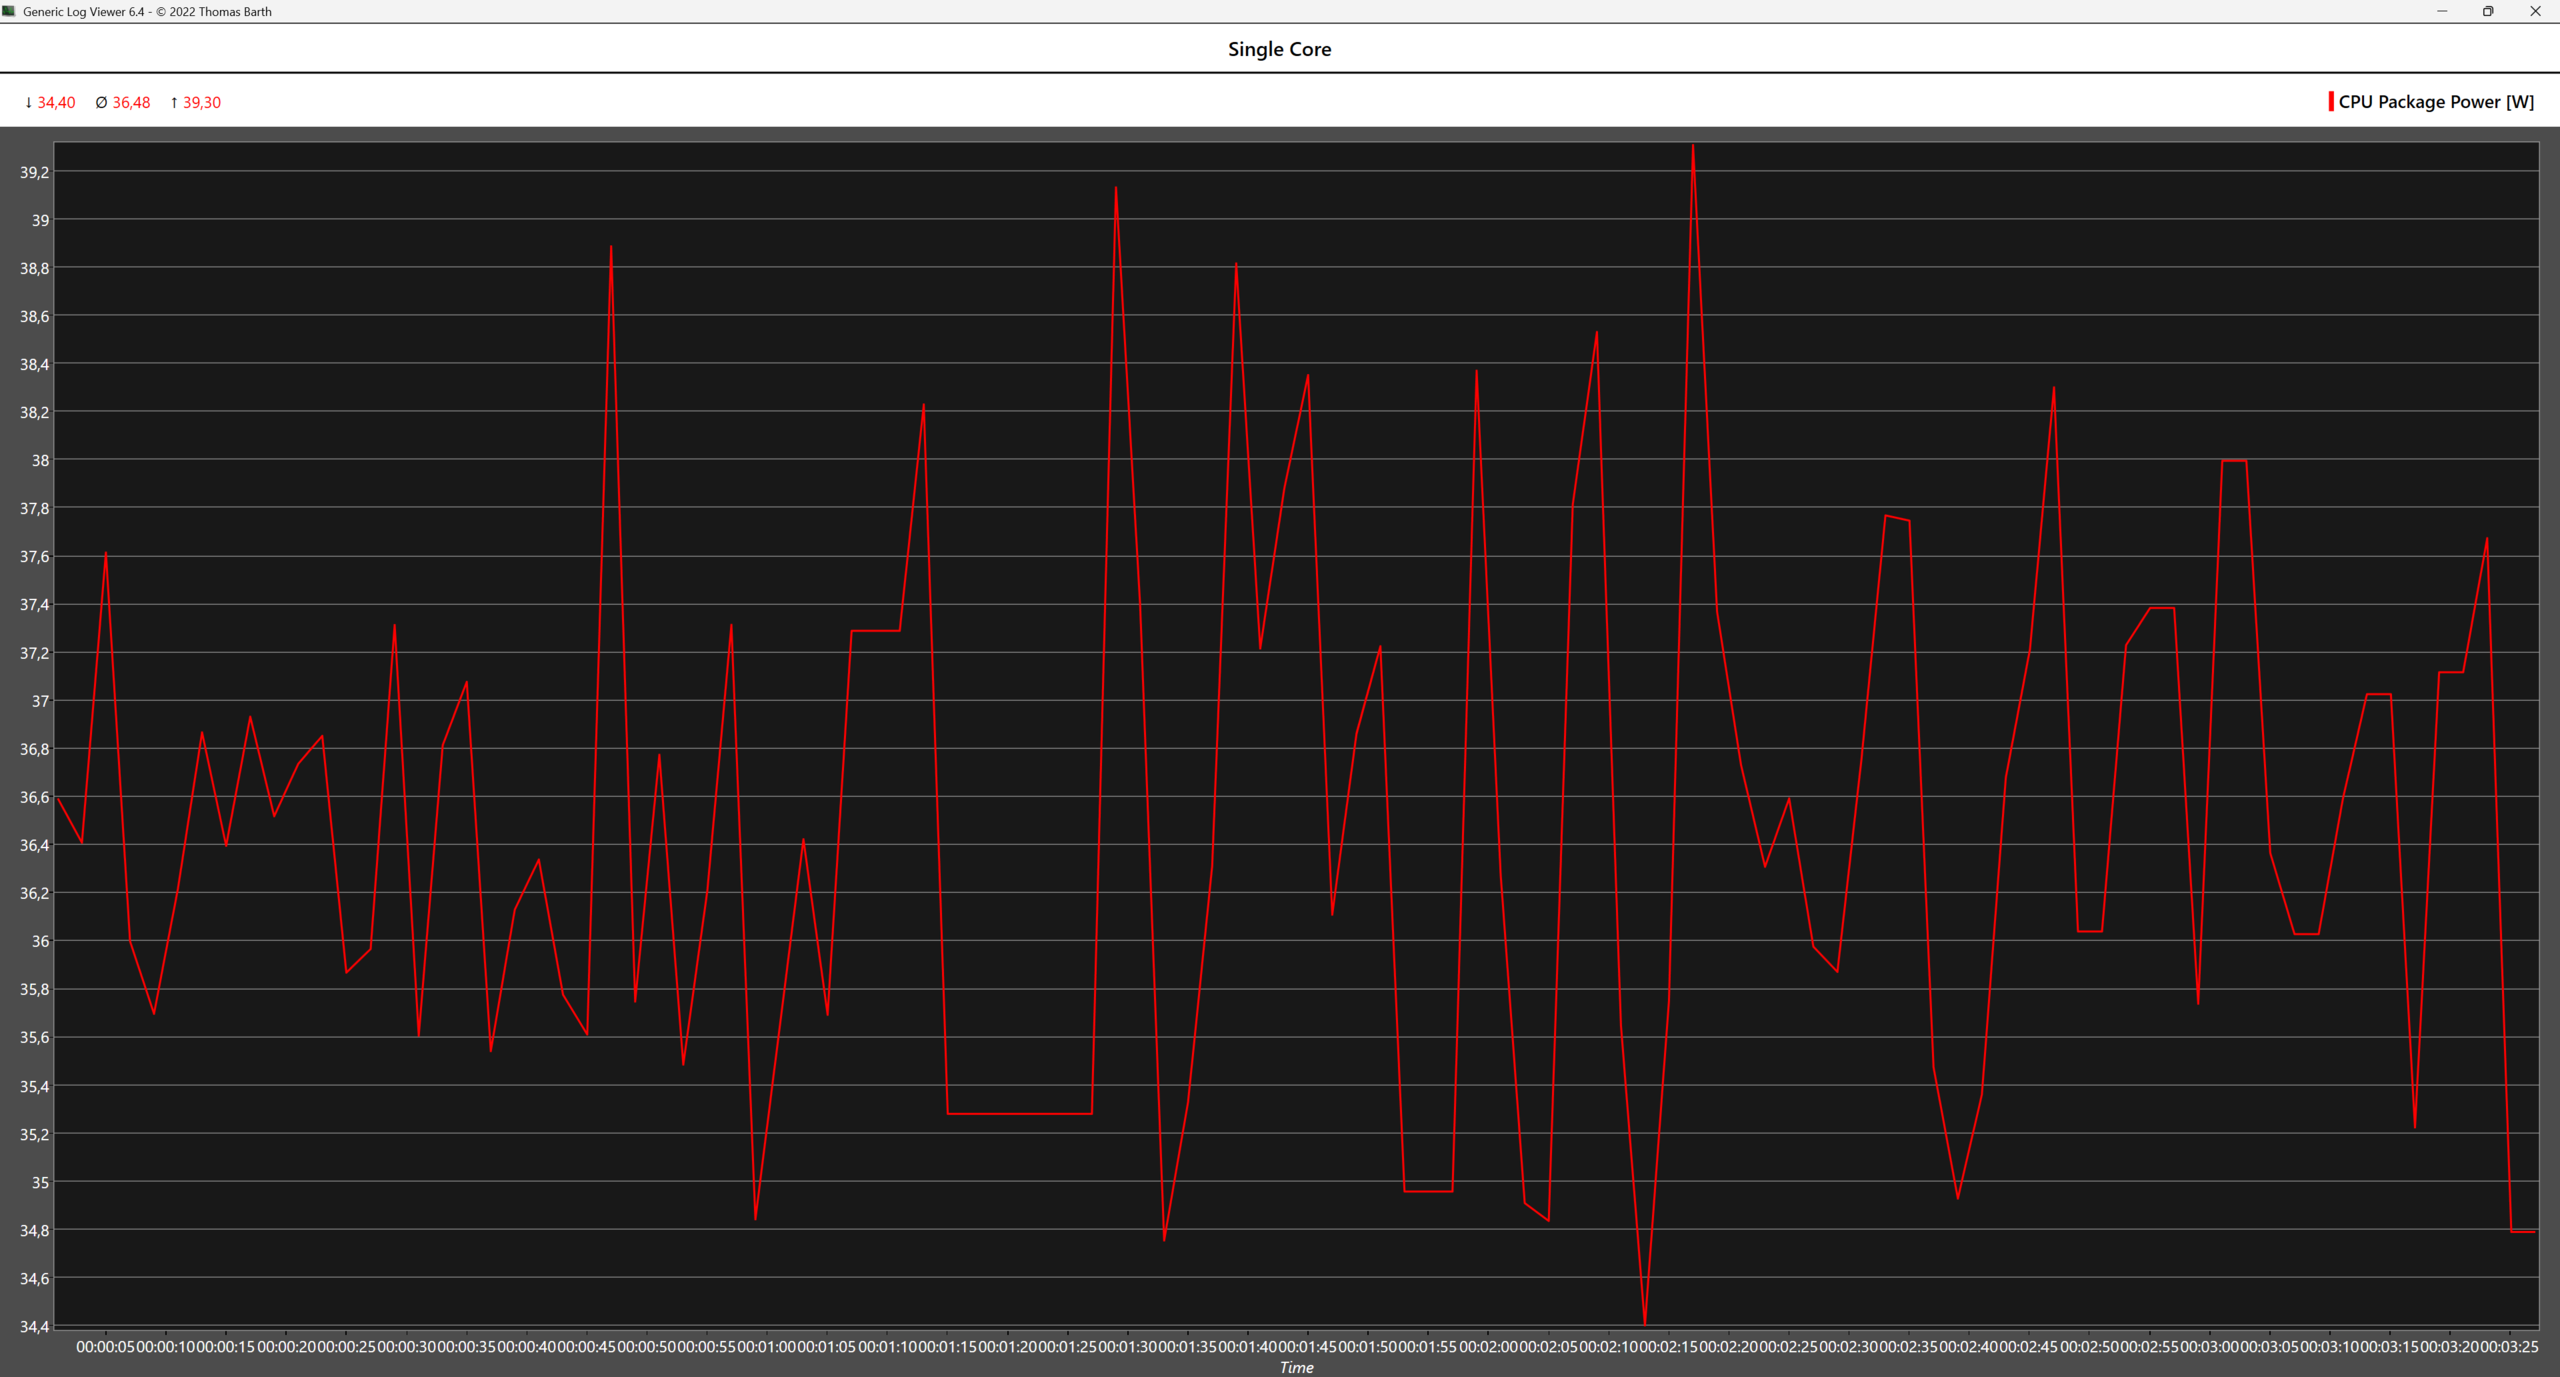
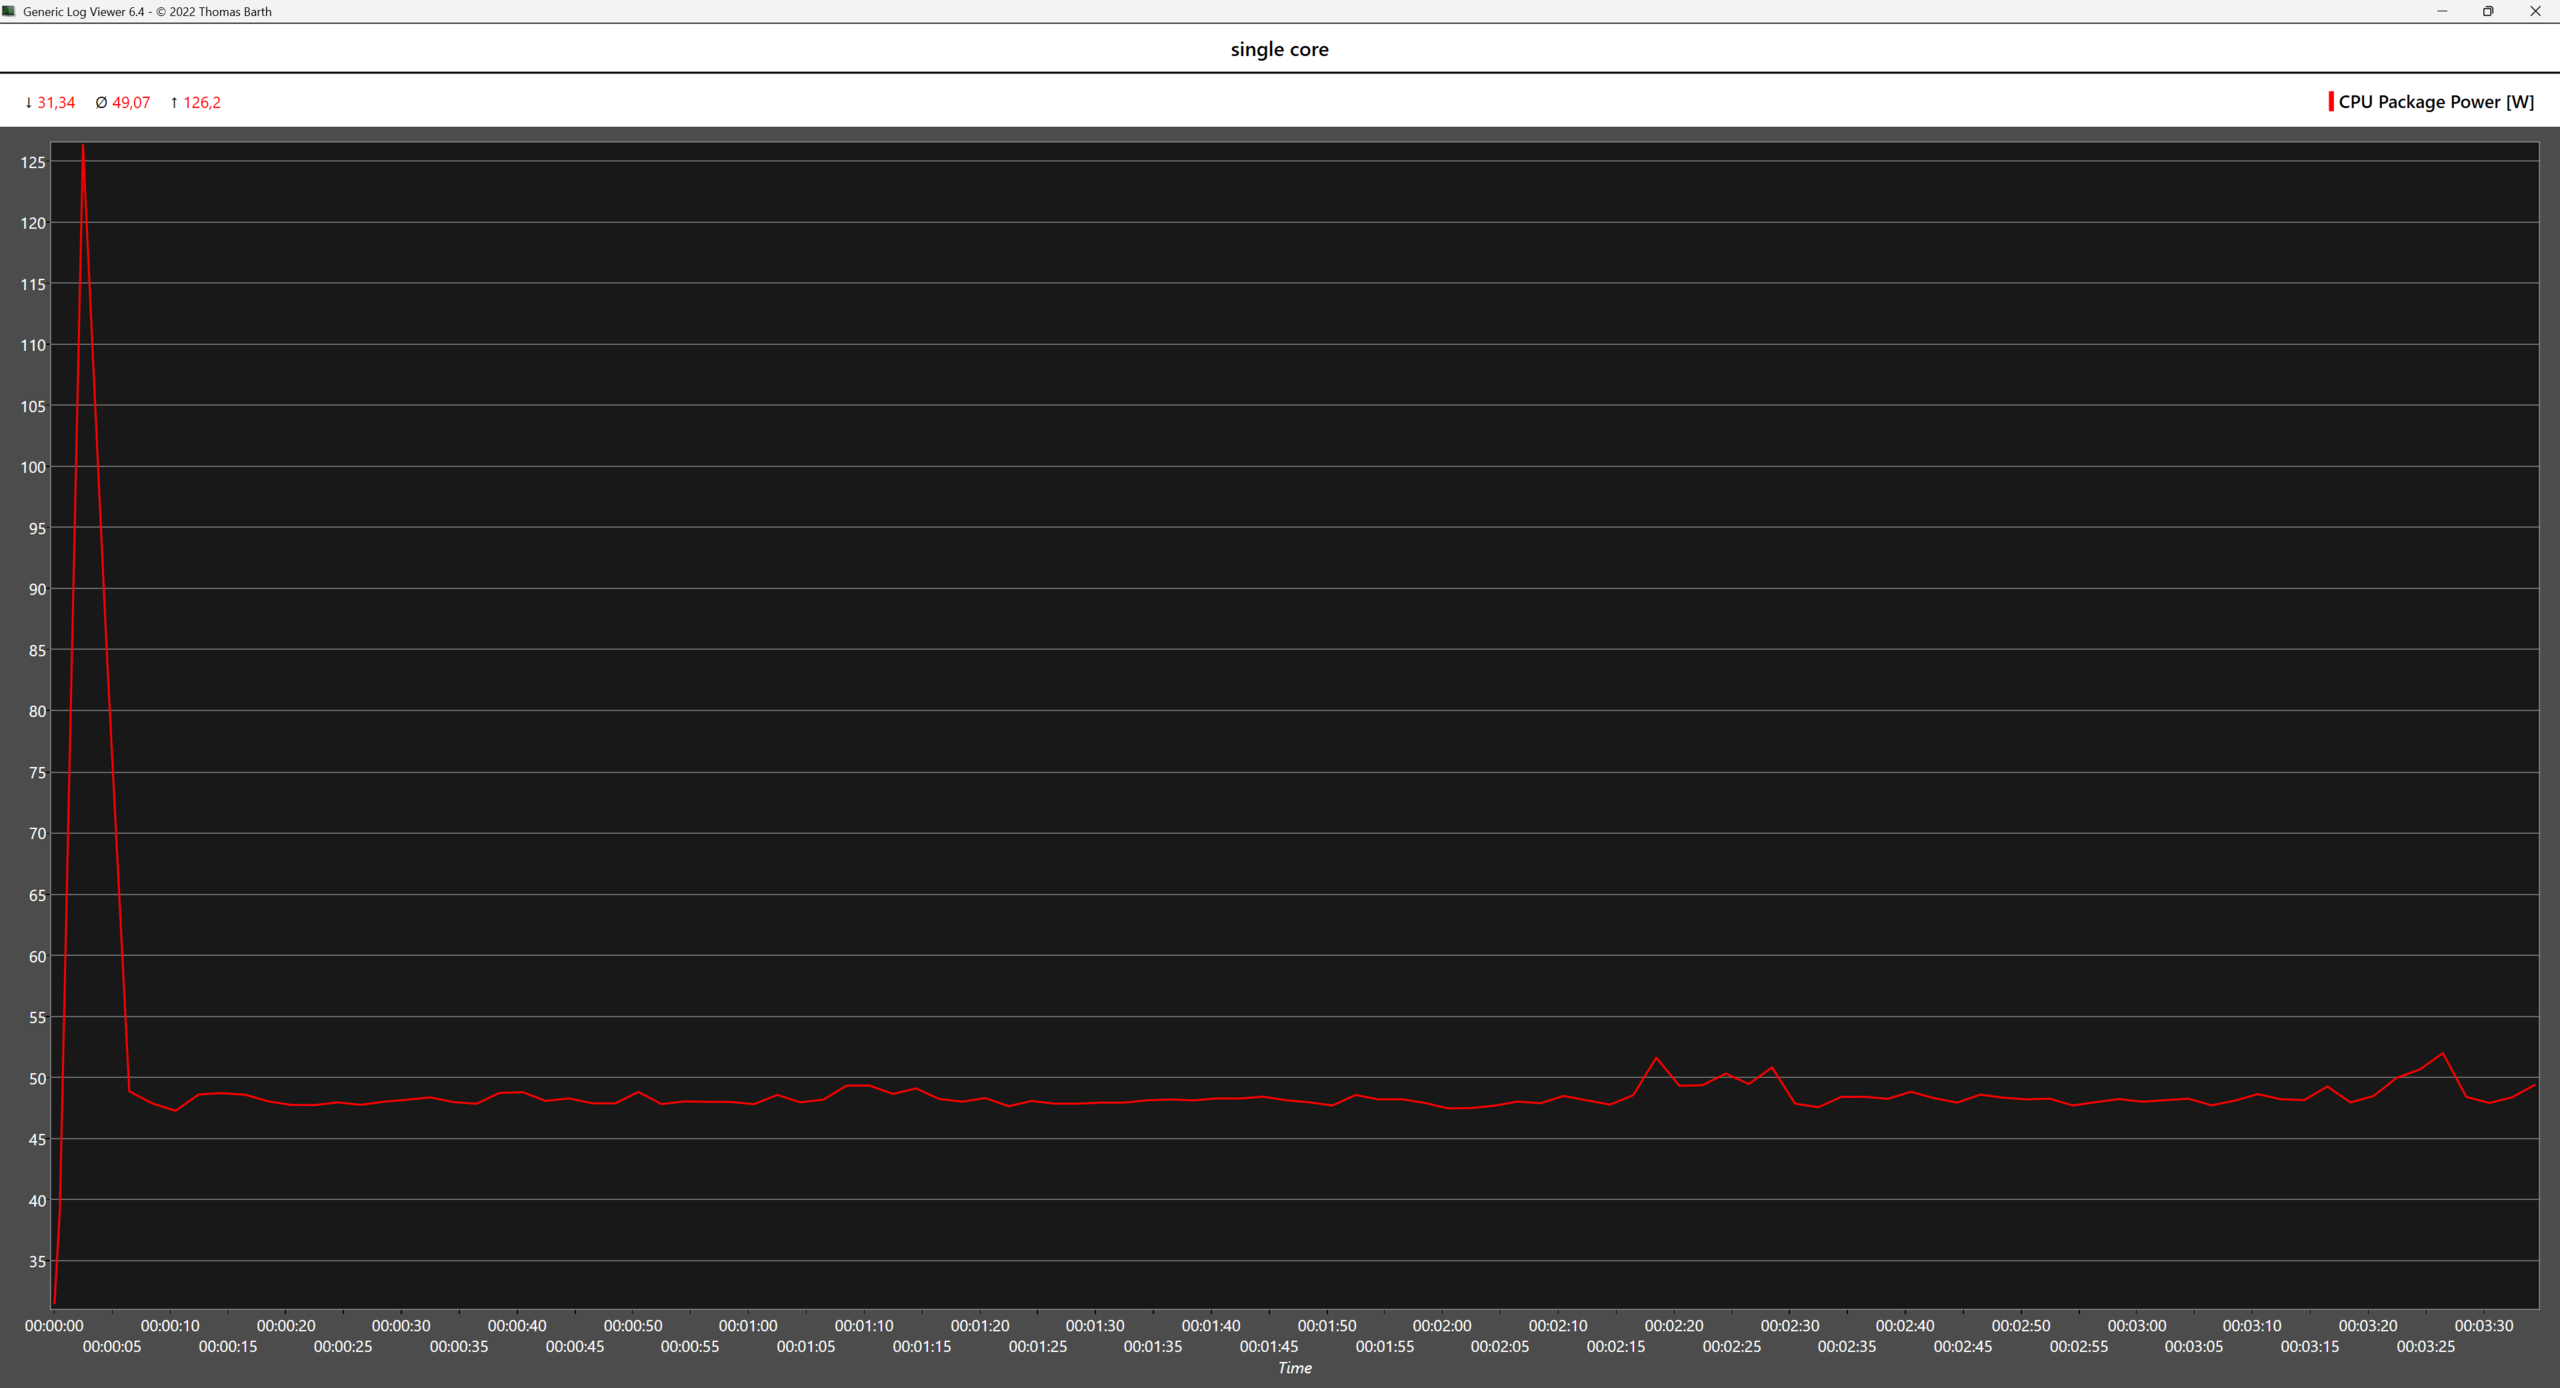
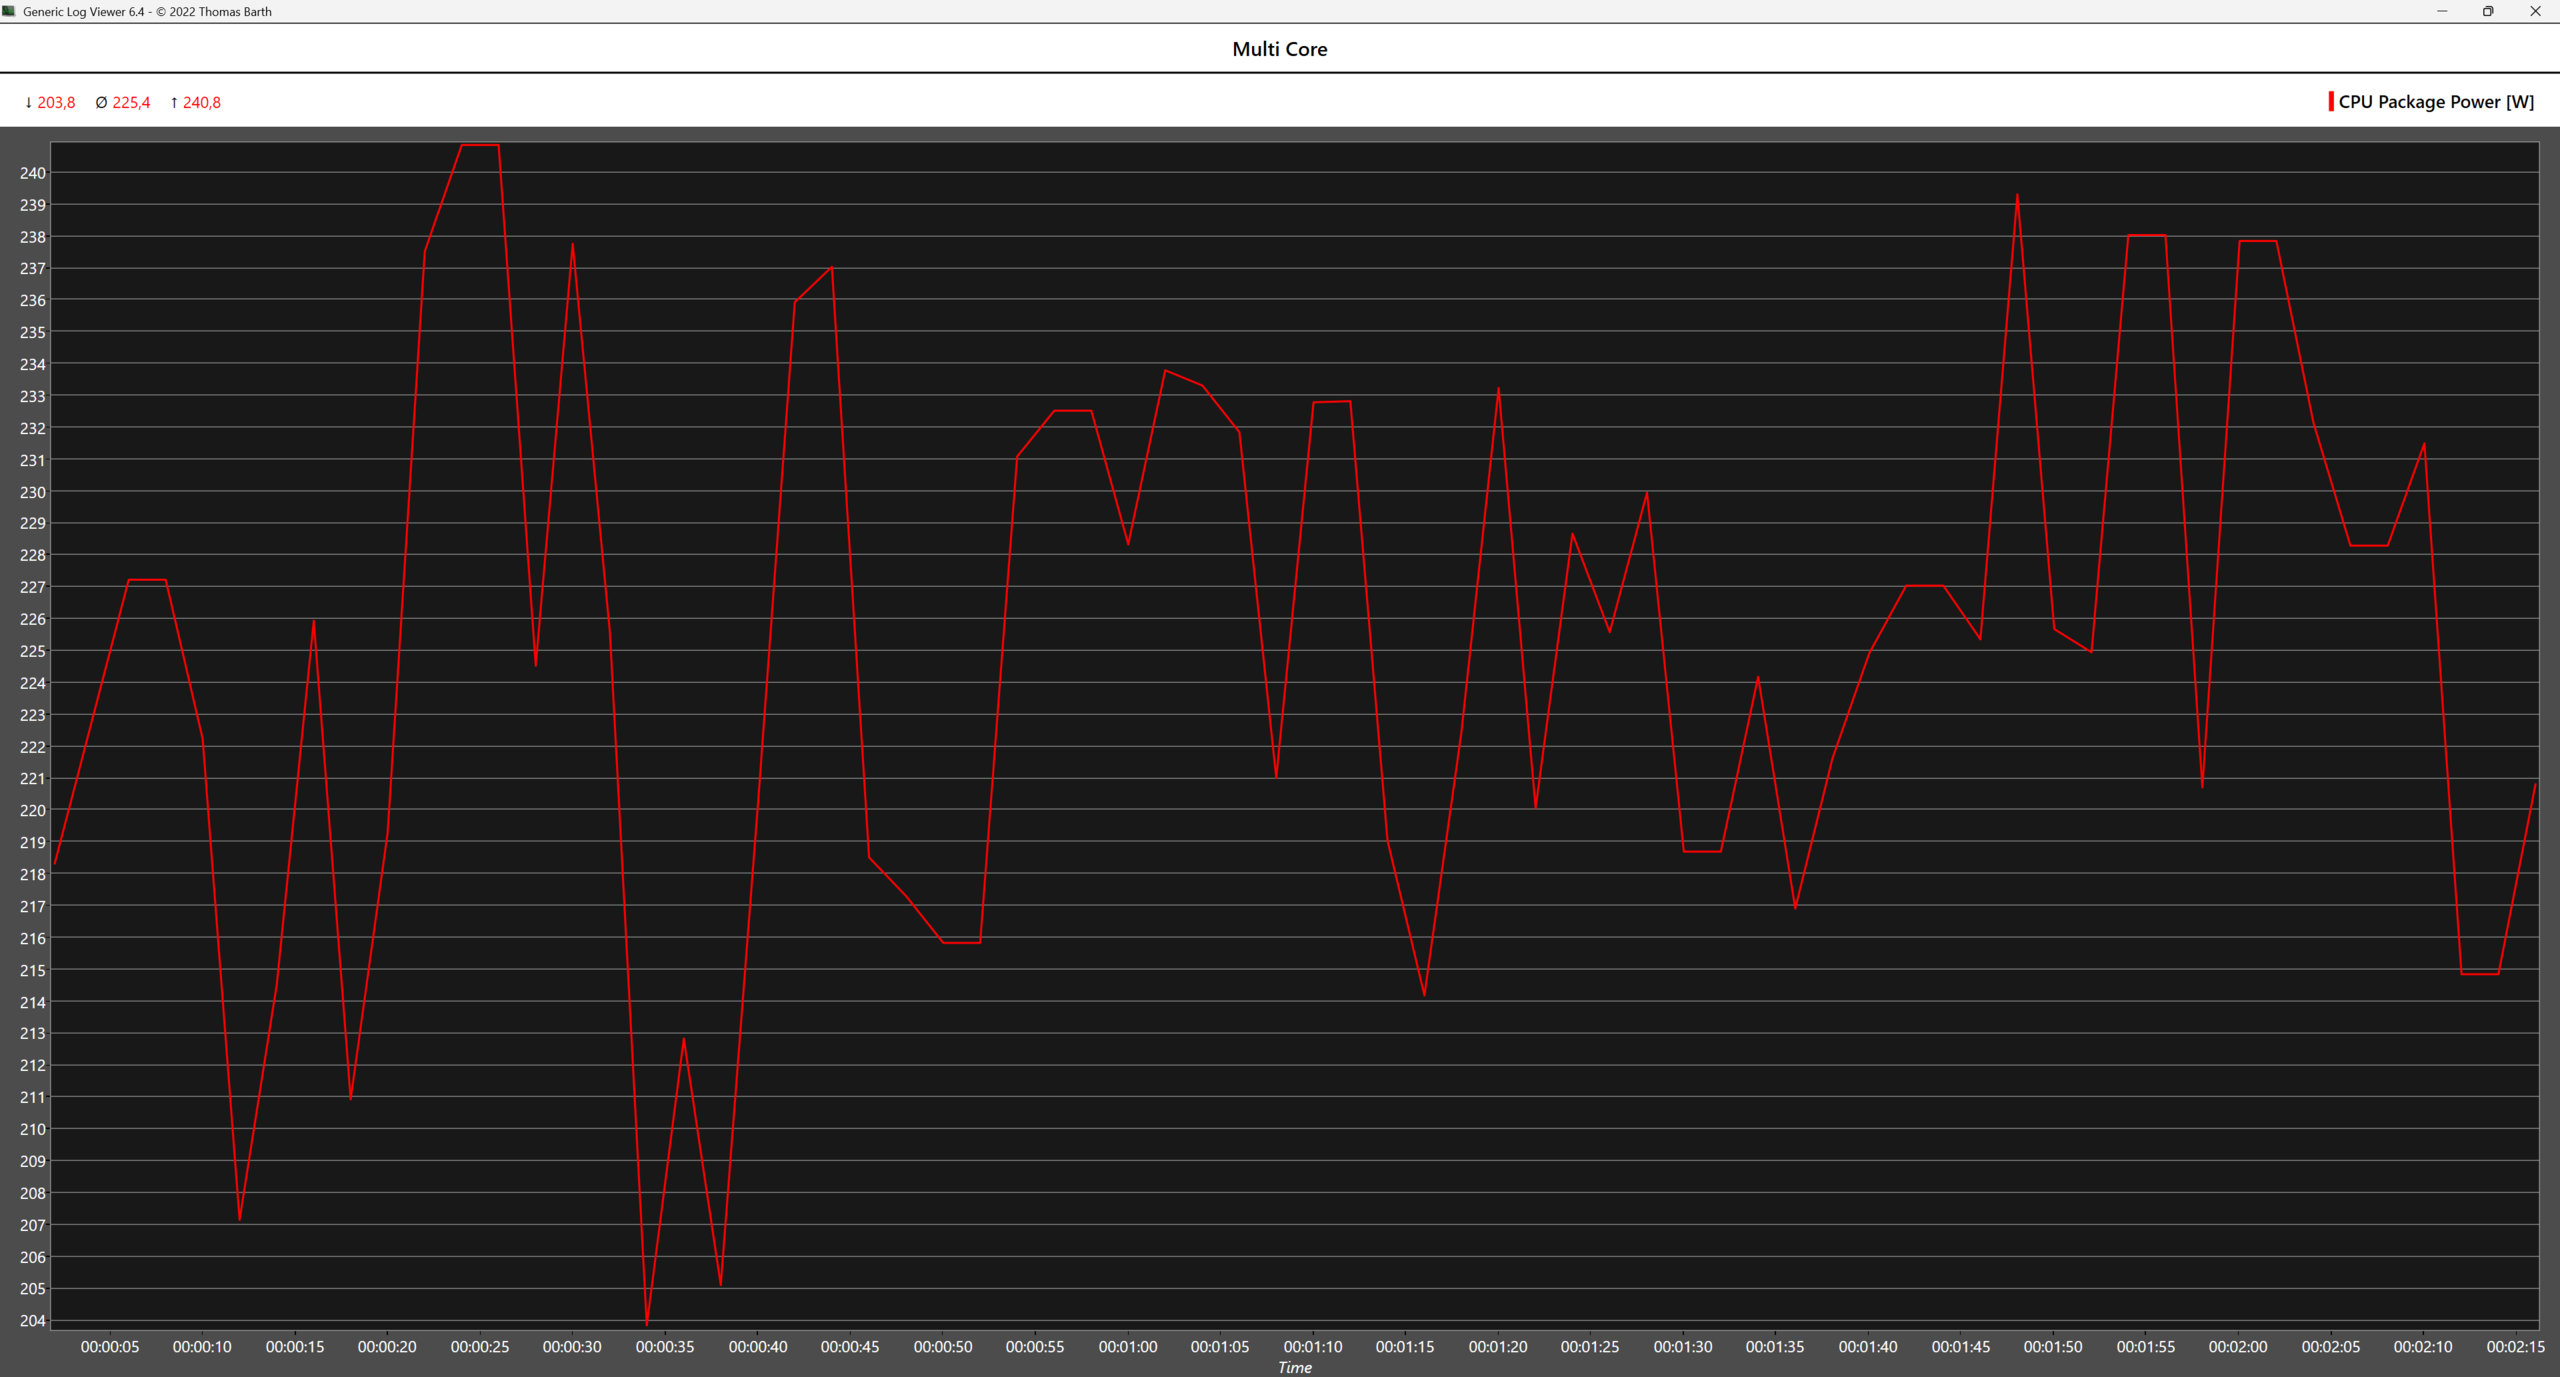
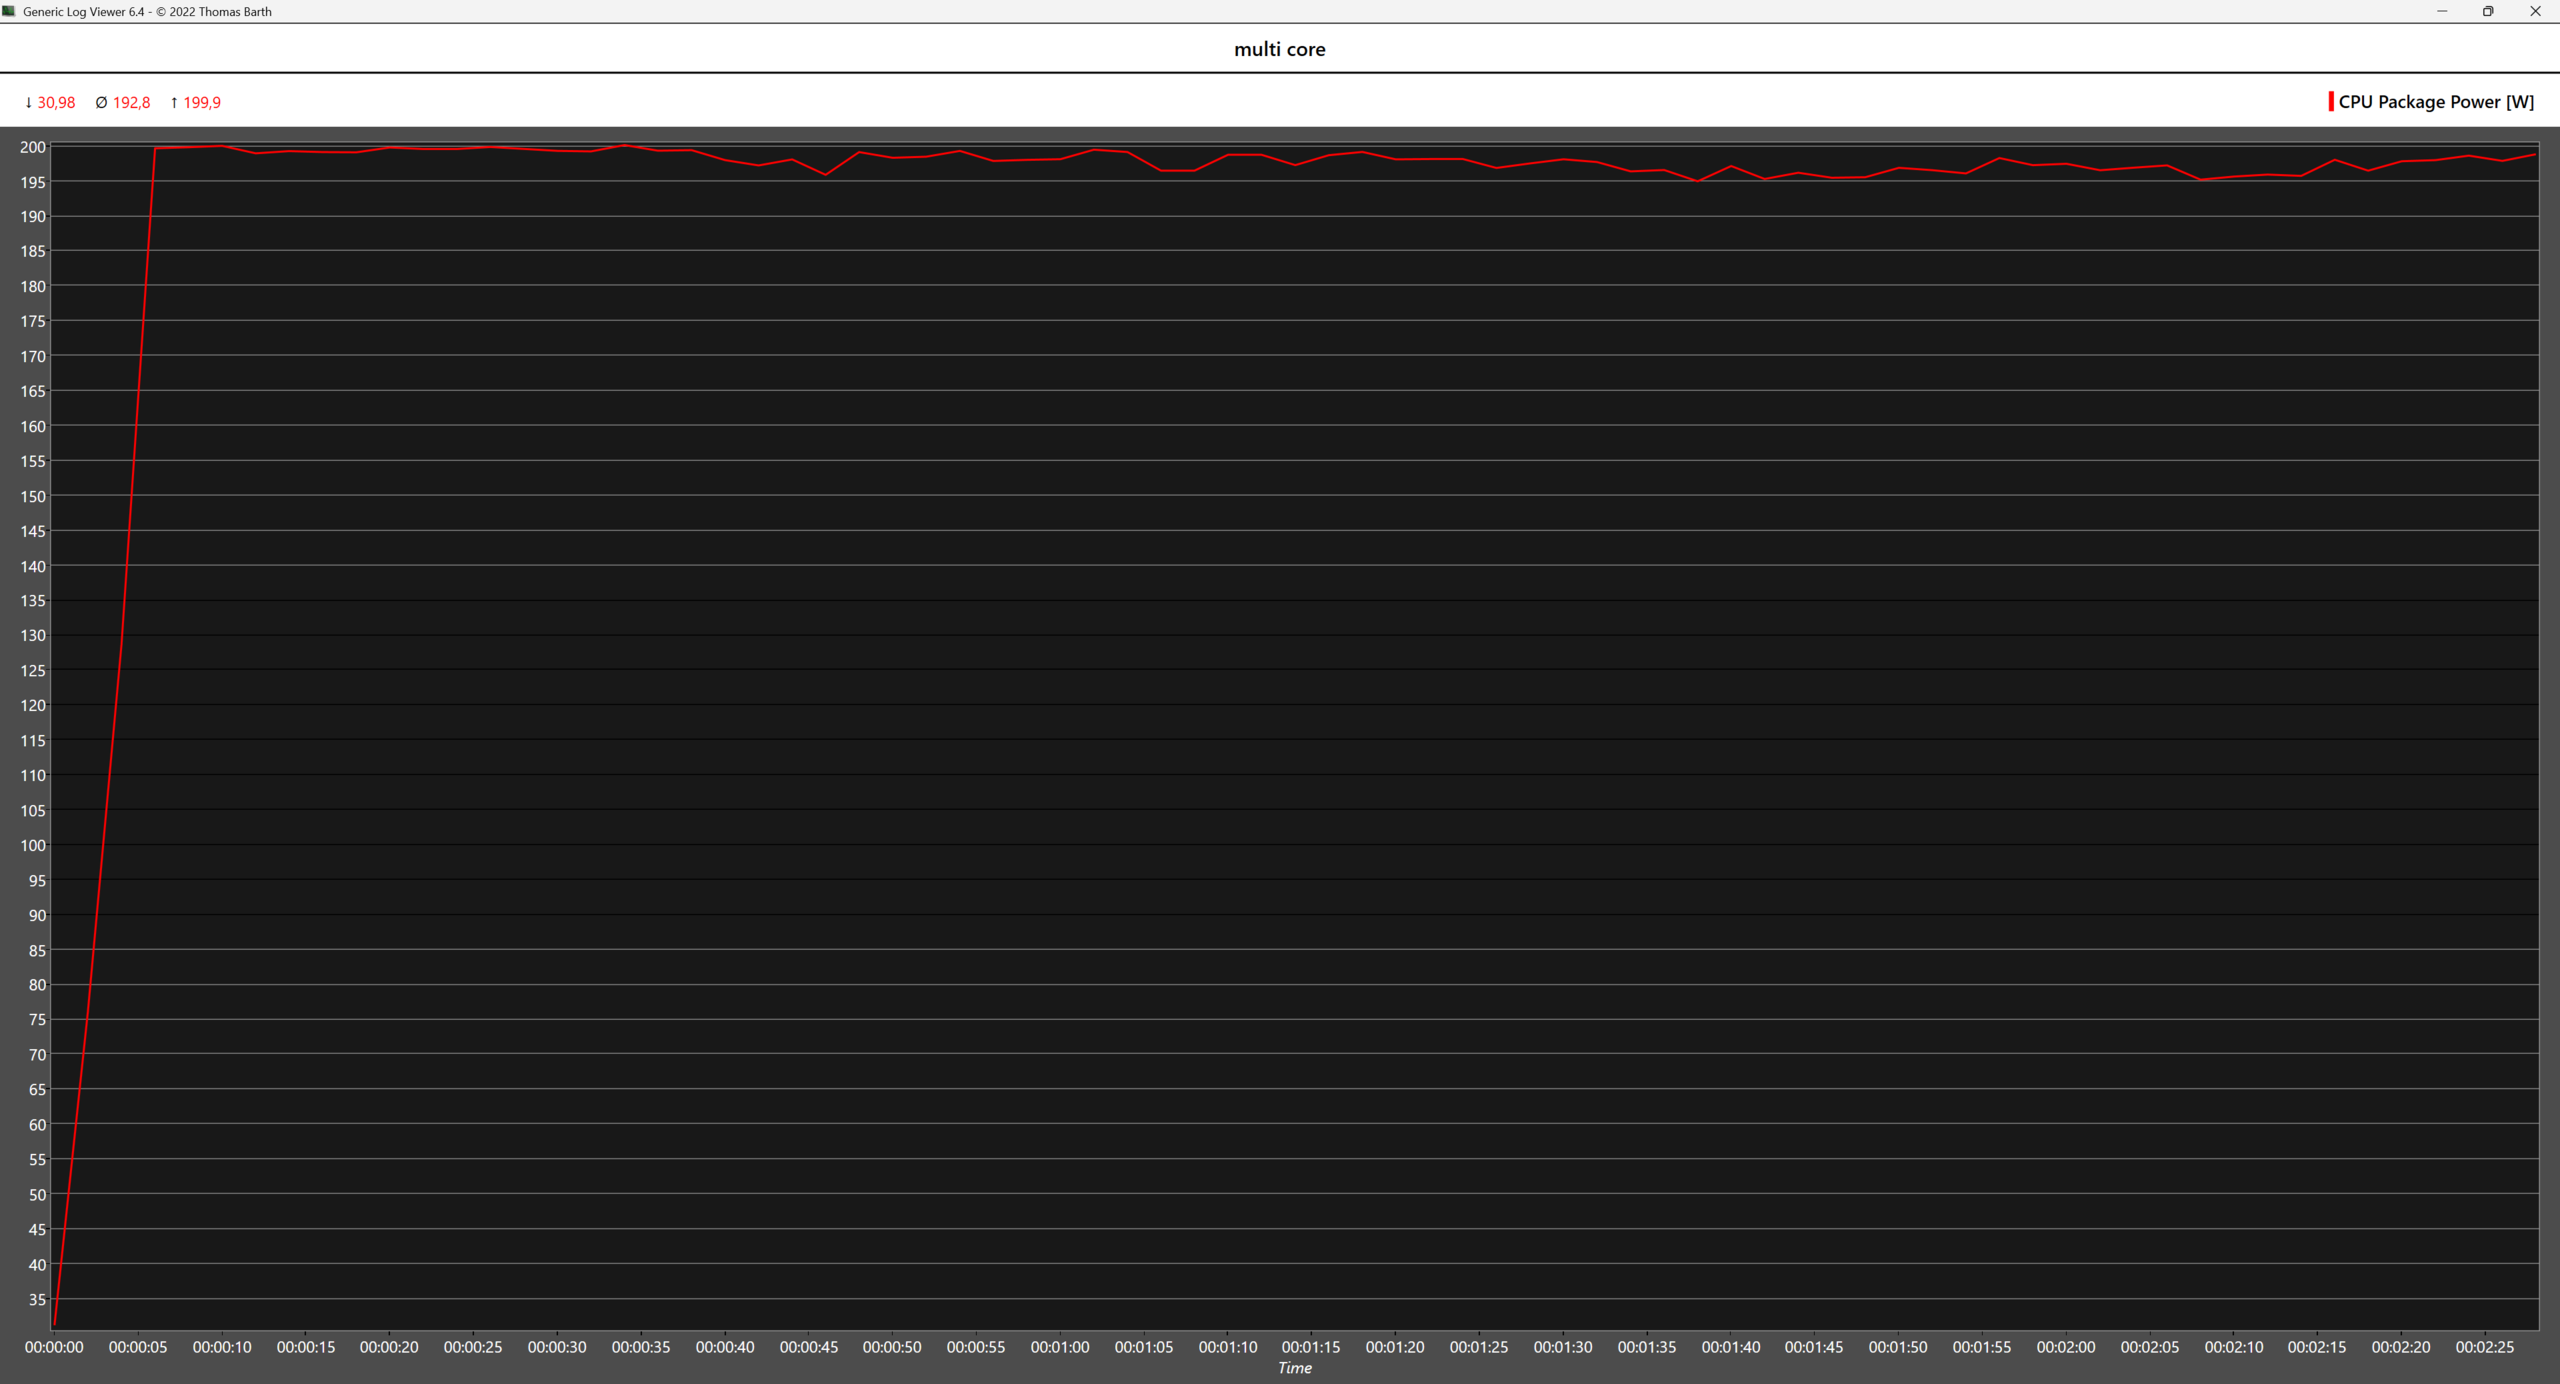
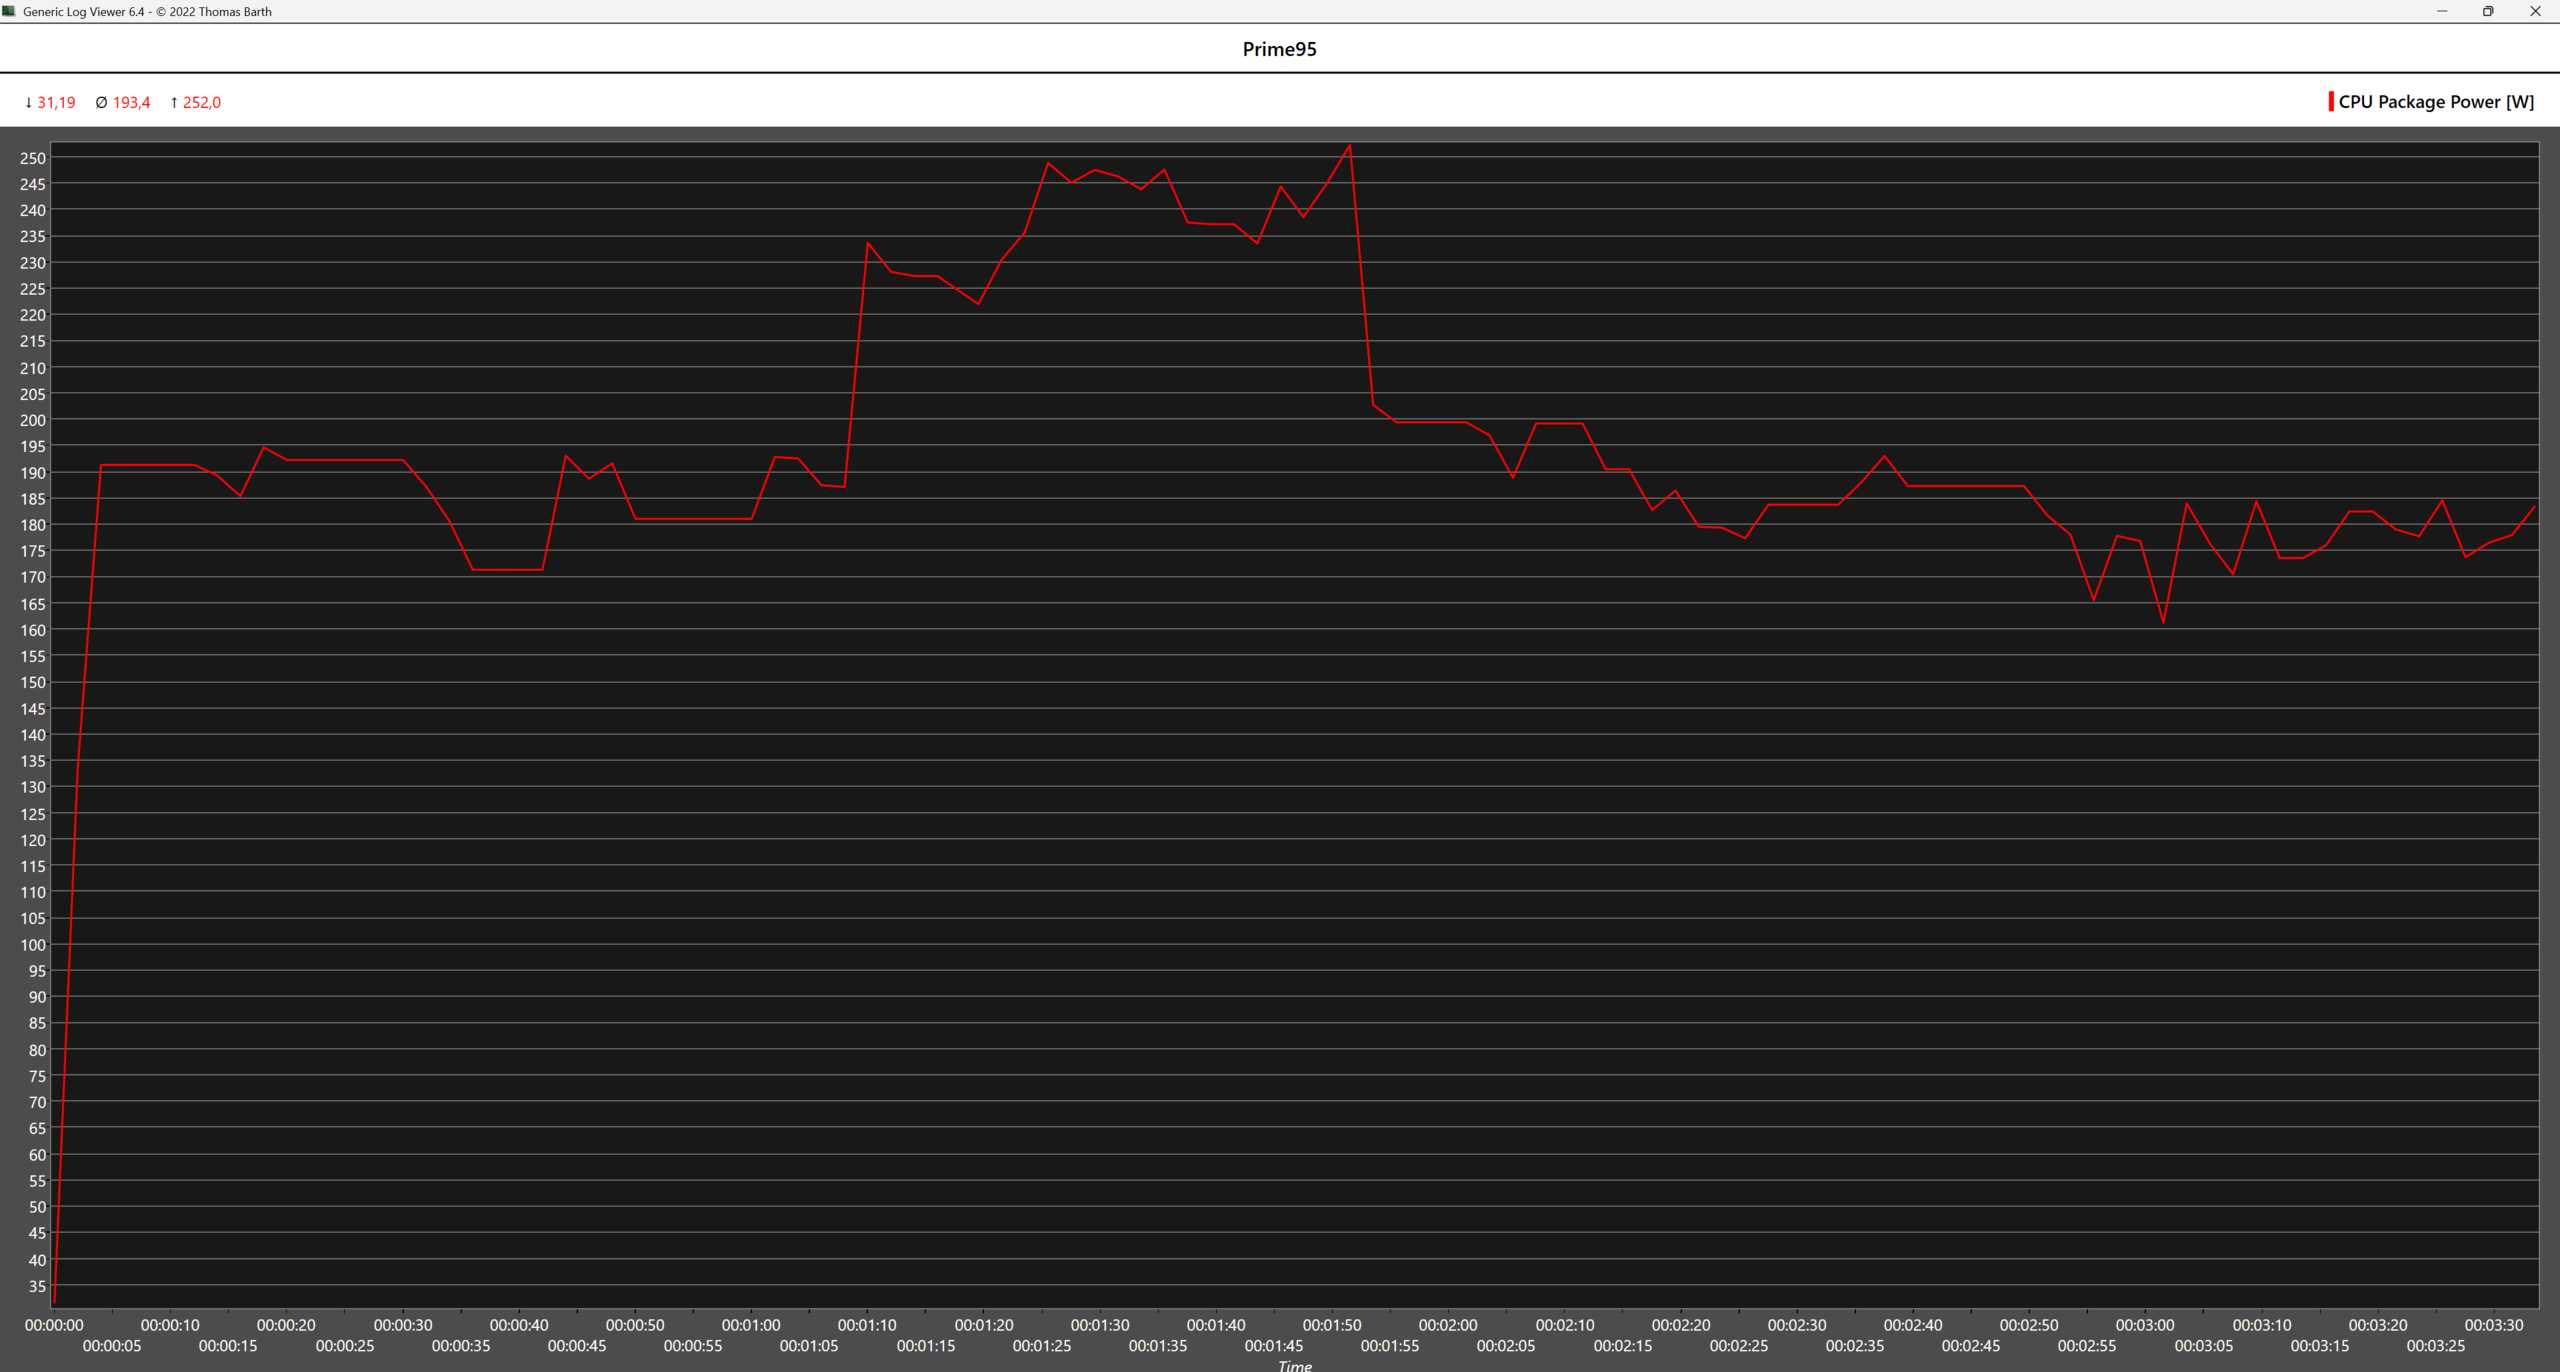
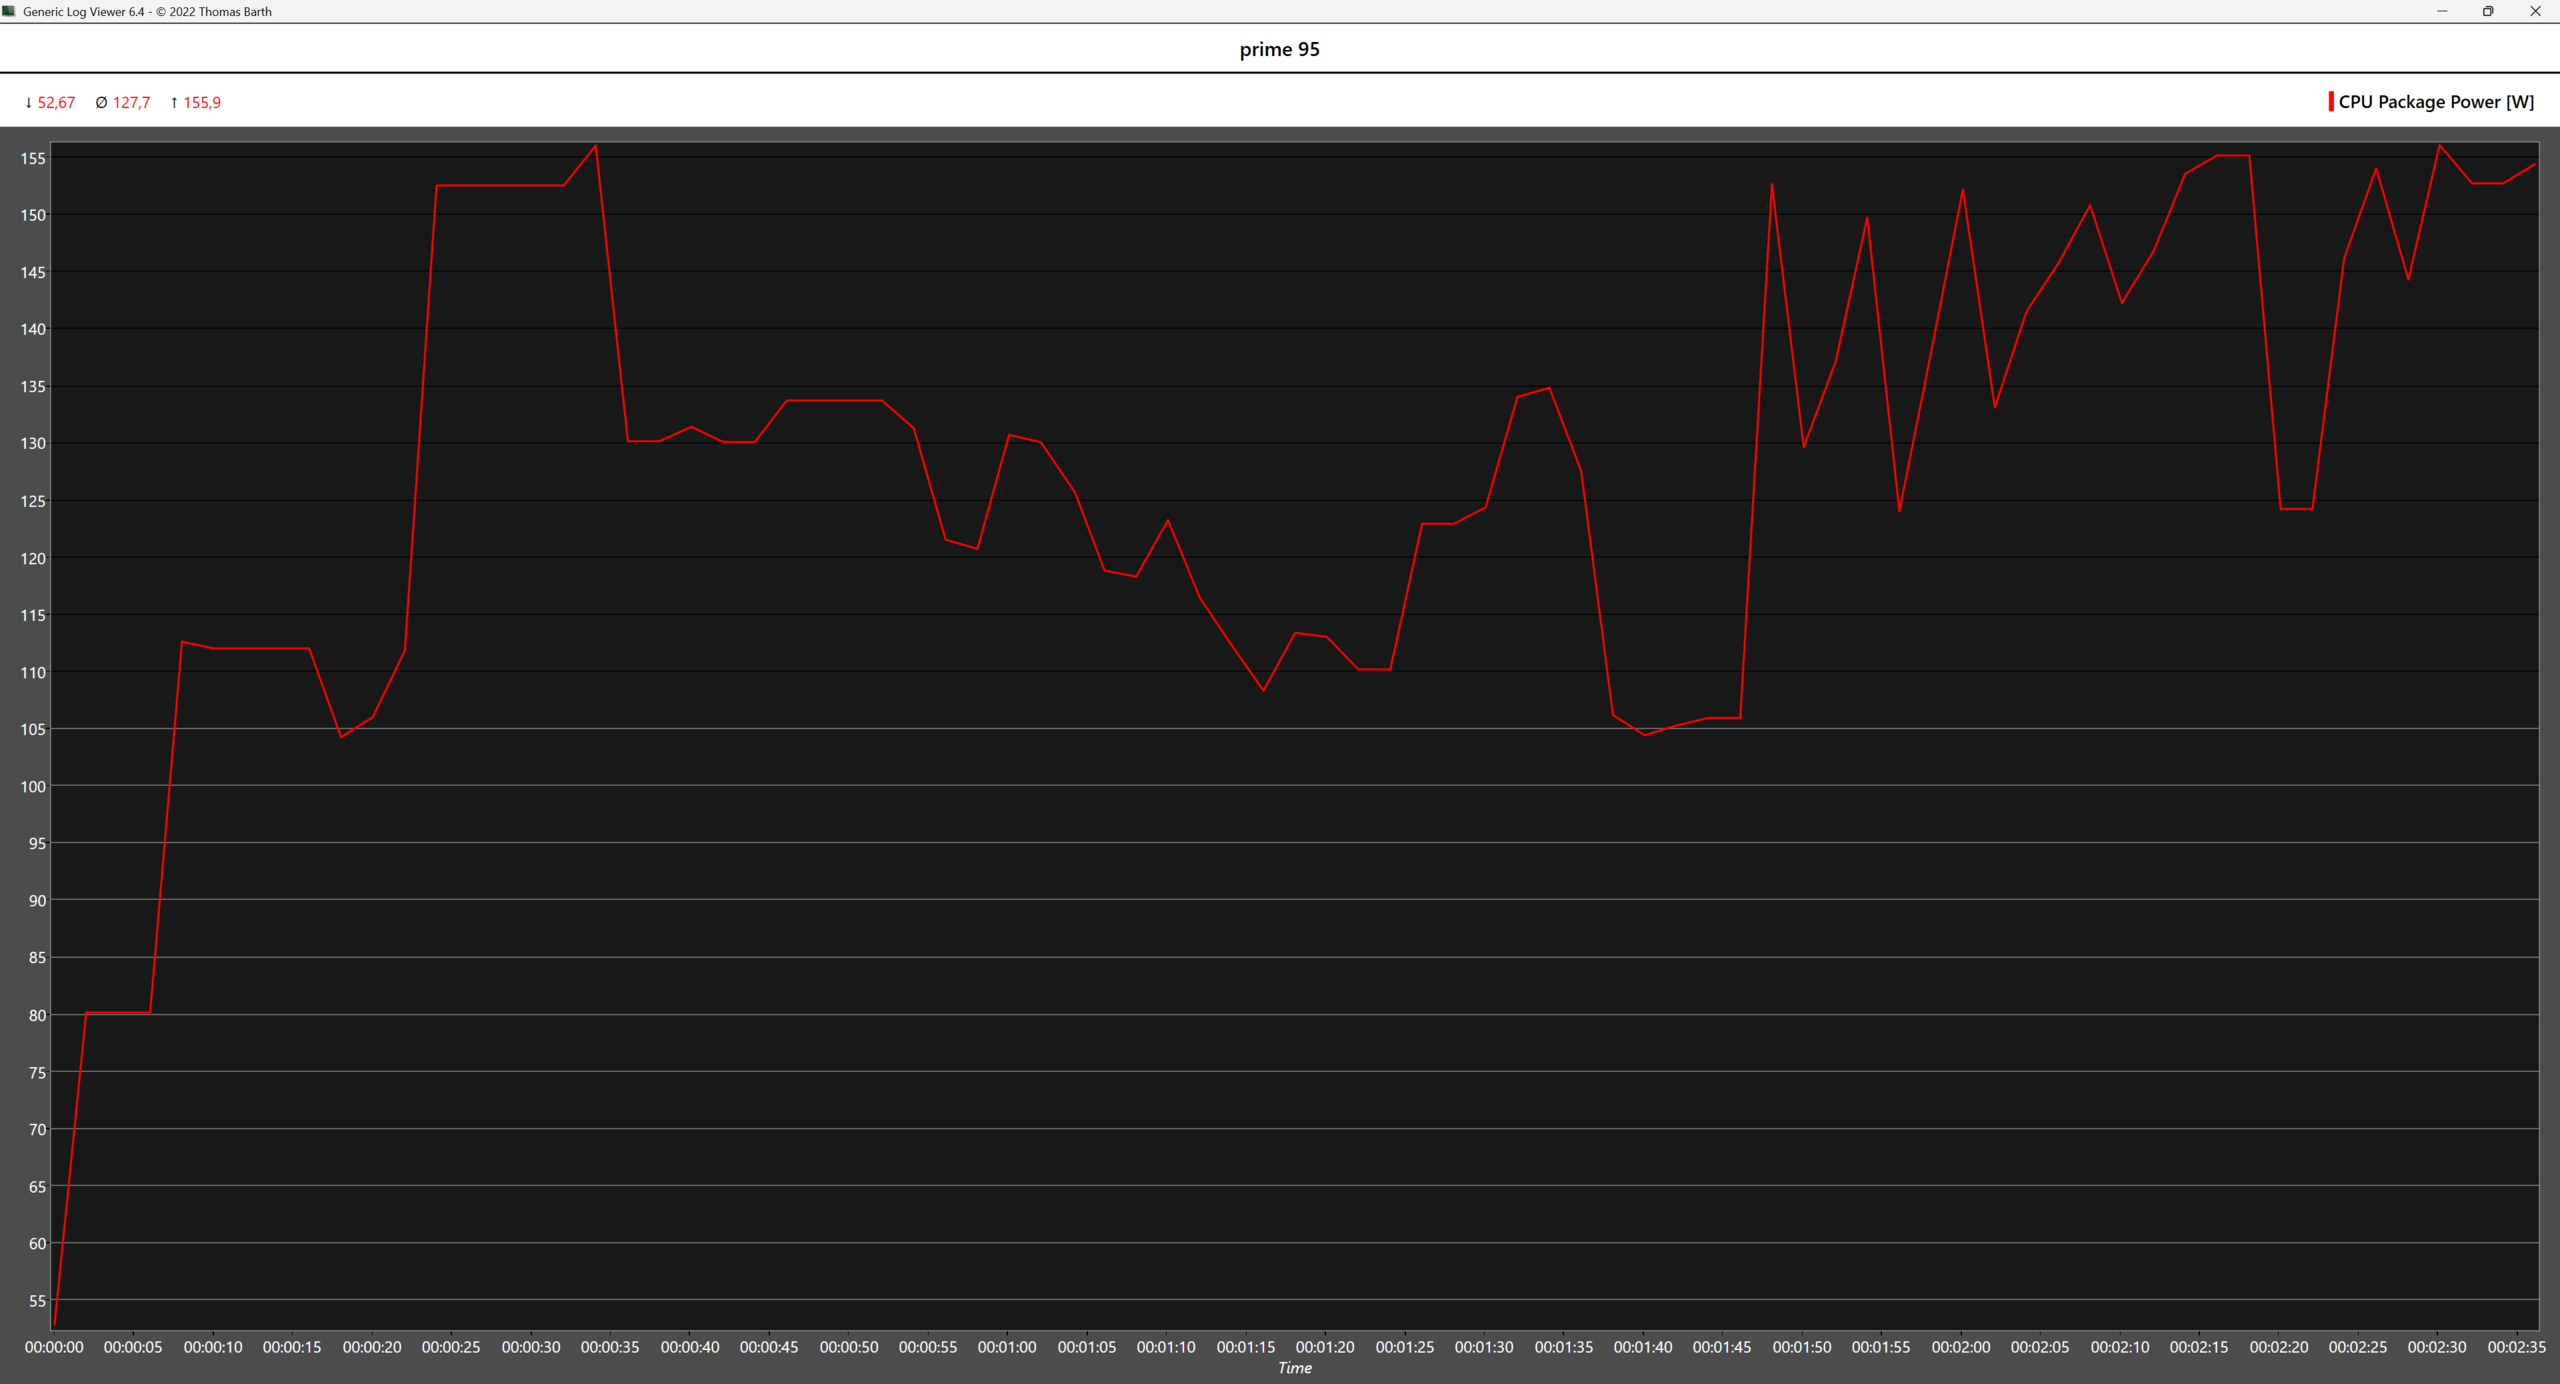
最后的我们 4K 没有 DLSS
最后的我们 4K 没有 DLSS
最后的我们 4K DLSS 质量
最后的我们 4K DLSS 质量
Core Ultra 9 285K 《最后的我们》4K 无 DLSS 详细视图
Core Ultra 9 285K 《最后的我们》4K DLSS 画质详细视图
Ryzen 9 9950X3D 《最后的我们》4K(无 DLSS)详细视图
Ryzen 9 9950X3D 《最后的我们》4K DLSS 画质详细视图

耗电量

在非重载情况下,英特尔处理器似乎比其 AMD 竞争对手更省电一些。因此,在空闲和单核情况下,甚至在大多数游戏测试中(GPU 承担大部分工作),英特尔 CPU 的平均功耗要低 20-30 瓦。如果在 Windows 11 中激活 "平衡功耗配置文件",AMD CPU 的功耗可以得到改善,在很大程度上可以与英特尔 CPU 相匹敌,其游戏性能似乎也不会受到影响,但这可能会对生产力和内容创建工作负载产生一些负面影响。

在使用所有内核的情况下,例如 Cinebench 2024 的多内核压力测试或 Prime 95 大型 FTT 测试,即使在高性能电源配置文件下,AMD CPU 的功耗也较低。在 Prime 95 中,AMD CPU 的平均功耗比英特尔 CPU 低 65 瓦,而英特尔 CPU 也进入了热节流状态,几乎在测试的第一分钟就达到了 TJMAX,之后温度逐渐降低。不过,这些极端情况在实际应用中不太可能发生。

Core Ultra 9 285K 闲置
Ryzen 9 9950X3D 闲置
Ryzen 9 9950X3D 闲置
Core Ultra 9 285K 单核 Cinebench 2024
Ryzen 9 9950X3D 单核 Cinebench 2024
Core Ultra 9 285K 多核 Cinebench 2024
Ryzen 9 9950X3D 多核 Cinebench 2024
Core Ultra 9 285K Prime 95 Large FTT
Ryzen 9 9950X3D Prime 95 Large FTT
Core Ultra 9 285K Prime 95 的温度
Ryzen 9 9950X3D Prime 95 温度
Core Ultra 9 285K 赛博朋克 2077 FHD 超高清路径追踪无 DLSS
Ryzen 9 9950X3D 赛博朋克 2077 FHD 超高清路径追踪无 DLSS
Core Ultra 9 285K 赛博朋克 2077 4K 超强路径追踪无 DLSS
Ryzen 9 9950X3D 《赛博朋克 2077》4K 超路径追踪(无 DLSS

Transparency

The selection of devices to be reviewed is made by our editorial team. The test sample was provided to the author as a loan by the manufacturer or retailer for the purpose of this review. The lender had no influence on this review, nor did the manufacturer receive a copy of this review before publication. There was no obligation to publish this review. As an independent media company, Notebookcheck is not subjected to the authority of manufacturers, retailers or publishers.

This is how Notebookcheck is testing

Every year, Notebookcheck independently reviews hundreds of laptops and smartphones using standardized procedures to ensure that all results are comparable. We have continuously developed our test methods for around 20 years and set industry standards in the process. In our test labs, high-quality measuring equipment is utilized by experienced technicians and editors. These tests involve a multi-stage validation process. Our complex rating system is based on hundreds of well-founded measurements and benchmarks, which maintains objectivity. Further information on our test methods can be found here.

Please share our article, every link counts!
Mail Logo
> Notebookcheck中文版(NBC中国) > 评测 > 英特尔酷睿至尊 9 285K VS AMD Ryzen 9 9950X3D
Bogdan Solca, 2026-01- 7 (Update: 2026-01- 7)