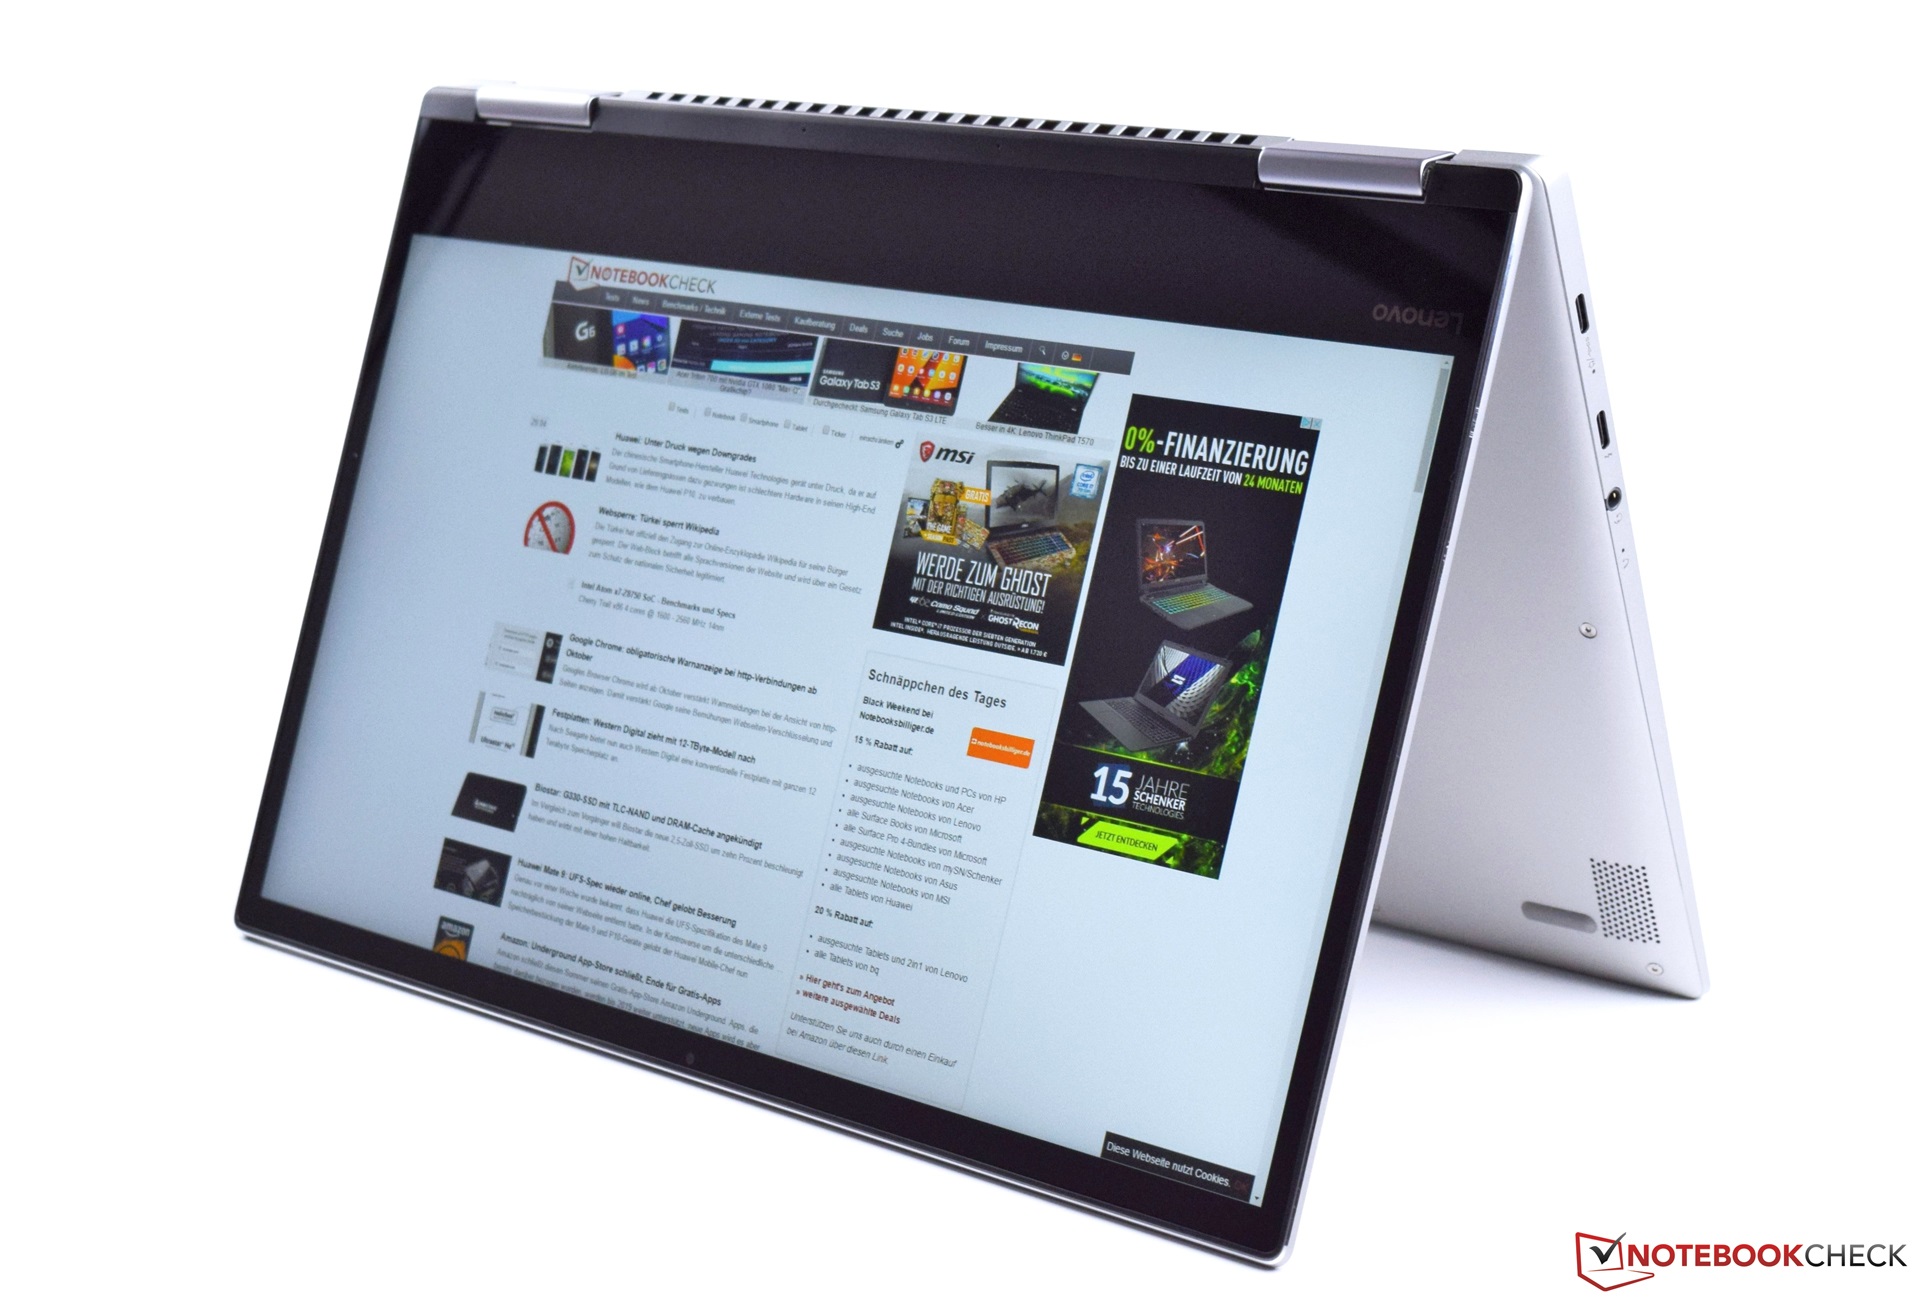
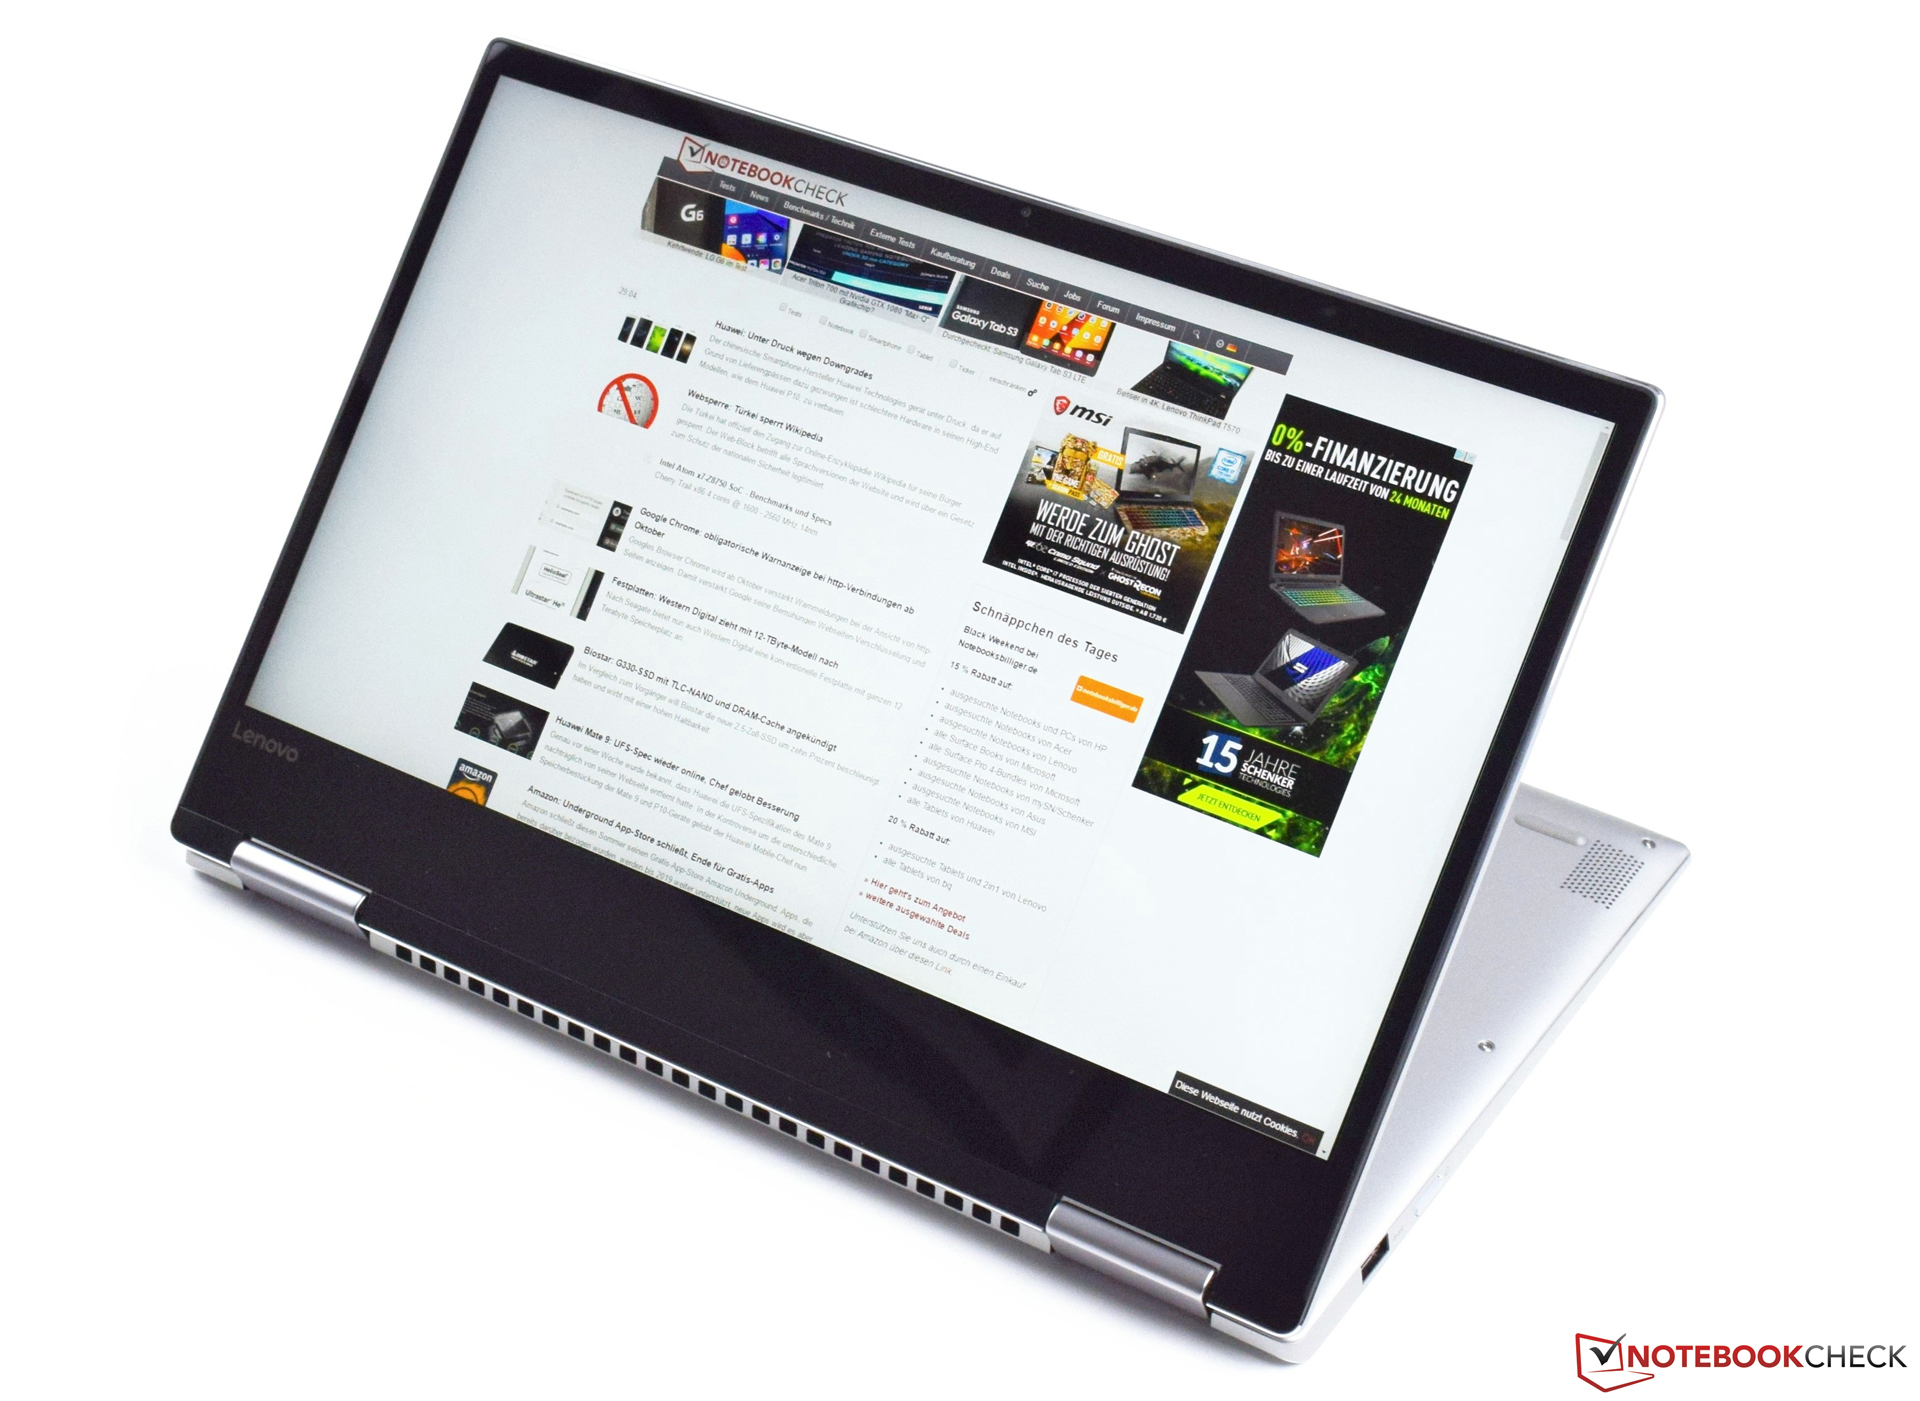
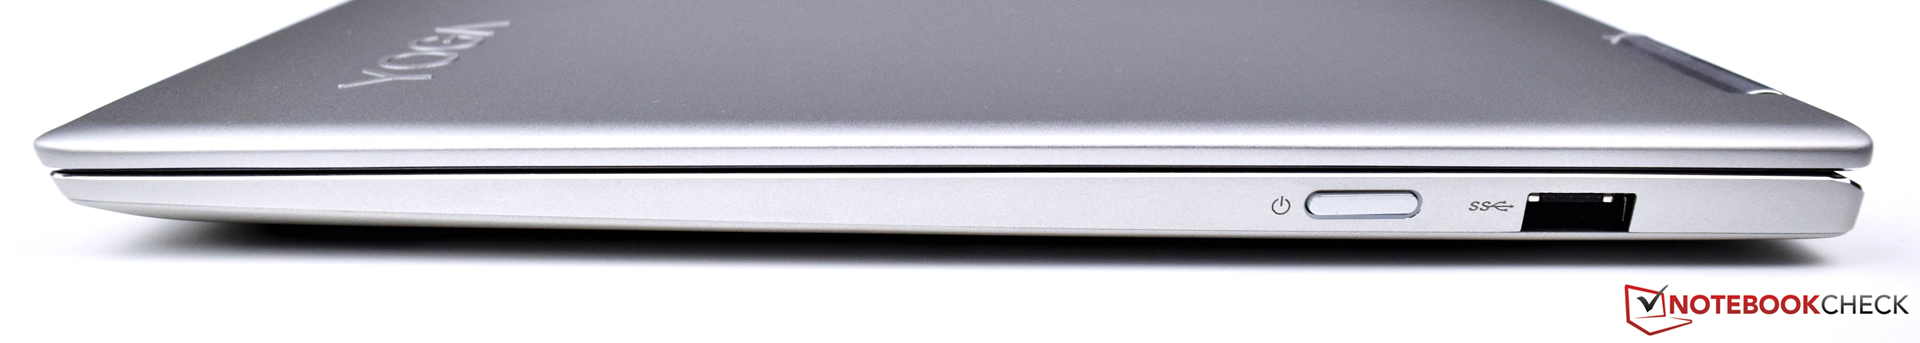
联想 Yoga 720-13IKB (7200U, 全高清) 笔记本电脑简短评测
| Networking | |
| iperf3 transmit AX12 | |
| Asus Zenbook Flip UX360UAK-BB351T | |
| Lenovo Yoga 720-13IKB | |
| Acer Spin 5 SP513-51 | |
| iperf3 receive AX12 | |
| Lenovo Yoga 720-13IKB | |
| Asus Zenbook Flip UX360UAK-BB351T | |
| Acer Spin 5 SP513-51 | |
| |||||||||||||||||||||||||
Brightness Distribution: 82 %
Center on Battery: 351 cd/m²
Contrast: 949:1 (Black: 0.37 cd/m²)
ΔE ColorChecker Calman: 5.03 | ∀{0.5-29.43 Ø4.71}
ΔE Greyscale Calman: 3.62 | ∀{0.09-98 Ø4.96}
84% sRGB (Argyll 1.6.3 3D)
55% AdobeRGB 1998 (Argyll 1.6.3 3D)
61.2% AdobeRGB 1998 (Argyll 3D)
83.7% sRGB (Argyll 3D)
65.3% Display P3 (Argyll 3D)
Gamma: 2.18
CCT: 6323 K
| Lenovo Yoga 720-13IKB IPS, 1920x1080, 13.3" | Asus Zenbook Flip UX360UAK-BB351T IPS, 1920x1080, 13.3" | Dell Inspiron 13 7359-4839 IPS, 1920x1080, 13.3" | Lenovo Yoga 3 Pro 13 80HE004LGE IPS, 3200x1800, 13.3" | Acer Spin 5 SP513-51 IPS LED, 1920x1080, 13.3" | |
|---|---|---|---|---|---|
| Display | 5% | -33% | 4% | -33% | |
| Display P3 Coverage (%) | 65.3 | 64.1 -2% | 40.31 -38% | 64.6 -1% | 39.99 -39% |
| sRGB Coverage (%) | 83.7 | 91.8 10% | 60.5 -28% | 89.5 7% | 59.5 -29% |
| AdobeRGB 1998 Coverage (%) | 61.2 | 65.2 7% | 41.65 -32% | 65.5 7% | 41.32 -32% |
| Response Times | -9% | -16% | -11% | -40% | |
| Response Time Grey 50% / Grey 80% * (ms) | 32 ? | 36 ? -13% | 38 ? -19% | 36 ? -13% | 56 ? -75% |
| Response Time Black / White * (ms) | 26 ? | 27 ? -4% | 29 ? -12% | 28 ? -8% | 27 ? -4% |
| PWM Frequency (Hz) | 50 ? | 1330 ? | |||
| Screen | 6% | -31% | 4% | -1% | |
| Brightness middle (cd/m²) | 351 | 368 5% | 253 -28% | 314 -11% | 245 -30% |
| Brightness (cd/m²) | 310 | 350 13% | 232 -25% | 294 -5% | 233 -25% |
| Brightness Distribution (%) | 82 | 87 6% | 83 1% | 83 1% | 87 6% |
| Black Level * (cd/m²) | 0.37 | 0.29 22% | 0.28 24% | 0.57 -54% | 0.21 43% |
| Contrast (:1) | 949 | 1269 34% | 904 -5% | 551 -42% | 1167 23% |
| Colorchecker dE 2000 * | 5.03 | 5.26 -5% | 6.36 -26% | 2.18 57% | 4.2 17% |
| Colorchecker dE 2000 max. * | 12 | 8.78 27% | 12.72 -6% | 6.48 46% | 8.75 27% |
| Greyscale dE 2000 * | 3.62 | 5.87 -62% | 10.26 -183% | 2.45 32% | 3.94 -9% |
| Gamma | 2.18 101% | 2.42 91% | 2.28 96% | 2.39 92% | 2.66 83% |
| CCT | 6323 103% | 6998 93% | 6500 100% | 6745 96% | 6096 107% |
| Color Space (Percent of AdobeRGB 1998) (%) | 55 | 60 9% | 38 -31% | 58 5% | 38 -31% |
| Color Space (Percent of sRGB) (%) | 84 | 92 10% | 60 -29% | 89 6% | 59 -30% |
| Total Average (Program / Settings) | 1% /
4% | -27% /
-29% | -1% /
2% | -25% /
-13% |
* ... smaller is better
Display Response Times
| ↔ Response Time Black to White | ||
|---|---|---|
| 26 ms ... rise ↗ and fall ↘ combined | ↗ 15 ms rise | 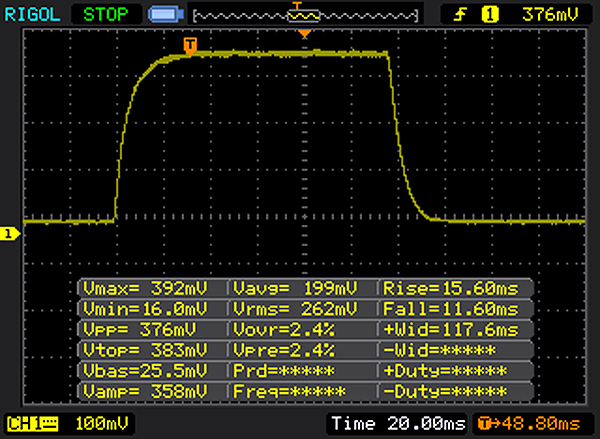 |
| ↘ 11 ms fall | ||
| The screen shows relatively slow response rates in our tests and may be too slow for gamers. In comparison, all tested devices range from 0.1 (minimum) to 240 (maximum) ms. » 63 % of all devices are better. This means that the measured response time is worse than the average of all tested devices (19.8 ms). | ||
| ↔ Response Time 50% Grey to 80% Grey | ||
| 32 ms ... rise ↗ and fall ↘ combined | ↗ 15 ms rise | 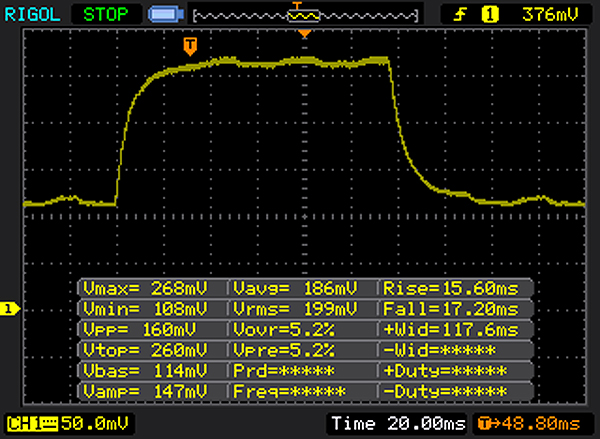 |
| ↘ 17 ms fall | ||
| The screen shows slow response rates in our tests and will be unsatisfactory for gamers. In comparison, all tested devices range from 0.165 (minimum) to 636 (maximum) ms. » 43 % of all devices are better. This means that the measured response time is similar to the average of all tested devices (30.9 ms). | ||
Screen Flickering / PWM (Pulse-Width Modulation)
| Screen flickering / PWM not detected | ||
In comparison: 52 % of all tested devices do not use PWM to dim the display. If PWM was detected, an average of 7748 (minimum: 5 - maximum: 343500) Hz was measured. | ||
| Cinebench R15 | |
| CPU Single 64Bit | |
| Lenovo Yoga 720-13IKB | |
| Asus Zenbook Flip UX360UAK-BB351T | |
| Dell Inspiron 13 7359-4839 | |
| Acer Spin 5 SP513-51 | |
| Lenovo Yoga 3 Pro 13 80HE004LGE | |
| CPU Multi 64Bit | |
| Asus Zenbook Flip UX360UAK-BB351T | |
| Dell Inspiron 13 7359-4839 | |
| Lenovo Yoga 720-13IKB | |
| Acer Spin 5 SP513-51 | |
| Lenovo Yoga 3 Pro 13 80HE004LGE | |
| JetStream 1.1 - 1.1 Total | |
| Asus Zenbook Flip UX360UAK-BB351T | |
| Lenovo Yoga 720-13IKB | |
| Dell Inspiron 13 7359-4839 | |
| Lenovo Yoga 3 Pro 13 80HE004LGE | |
| Acer Spin 5 SP513-51 | |
| Octane V2 - Total Score | |
| Lenovo Yoga 720-13IKB | |
| Dell Inspiron 13 7359-4839 | |
| Acer Spin 5 SP513-51 | |
| Lenovo Yoga 3 Pro 13 80HE004LGE | |
| Mozilla Kraken 1.1 - Total | |
| Lenovo Yoga 3 Pro 13 80HE004LGE | |
| Acer Spin 5 SP513-51 | |
| Lenovo Yoga 720-13IKB | |
| Dell Inspiron 13 7359-4839 | |
* ... smaller is better
| PCMark 8 | |
| Home Score Accelerated v2 | |
| Lenovo Yoga 720-13IKB | |
| Asus Zenbook Flip UX360UAK-BB351T | |
| Dell Inspiron 13 7359-4839 | |
| Acer Spin 5 SP513-51 | |
| Lenovo Yoga 3 Pro 13 80HE004LGE | |
| Work Score Accelerated v2 | |
| Lenovo Yoga 720-13IKB | |
| Dell Inspiron 13 7359-4839 | |
| Acer Spin 5 SP513-51 | |
| Lenovo Yoga 3 Pro 13 80HE004LGE | |
| Creative Score Accelerated v2 | |
| Lenovo Yoga 720-13IKB | |
| Lenovo Yoga 3 Pro 13 80HE004LGE | |
| PCMark 7 Score | 5471 points | |
| PCMark 8 Home Score Accelerated v2 | 3744 points | |
| PCMark 8 Creative Score Accelerated v2 | 4494 points | |
| PCMark 8 Work Score Accelerated v2 | 4717 points | |
Help | ||
| Lenovo Yoga 720-13IKB Samsung PM961 MZVLW256HEHP | Asus Zenbook Flip UX360UAK-BB351T Micron SSD 1100 (MTFDDAV256TBN) | Dell Inspiron 13 7359-4839 Liteonit LCH-256V2S | Lenovo Yoga 3 Pro 13 80HE004LGE Samsung SSD PM851 MZNTE512HMJH | |
|---|---|---|---|---|
| CrystalDiskMark 3.0 | -59% | -56% | -52% | |
| Read Seq (MB/s) | 2172 | 478.4 -78% | 486.3 -78% | 521 -76% |
| Write Seq (MB/s) | 1222 | 419.9 -66% | 283.7 -77% | 238.6 -80% |
| Read 512 (MB/s) | 1295 | 351.7 -73% | 337.5 -74% | 417.3 -68% |
| Write 512 (MB/s) | 863 | 294.2 -66% | 283.5 -67% | 237.7 -72% |
| Read 4k (MB/s) | 59.5 | 24 -60% | 26.75 -55% | 35.9 -40% |
| Write 4k (MB/s) | 150.3 | 87 -42% | 85.3 -43% | 99.9 -34% |
| Read 4k QD32 (MB/s) | 426.4 | 199.3 -53% | 309.7 -27% | 366.6 -14% |
| Write 4k QD32 (MB/s) | 360 | 232.4 -35% | 250.8 -30% | 236.7 -34% |

| 3DMark | |
| 1280x720 Cloud Gate Standard Graphics | |
| Lenovo Yoga 720-13IKB | |
| Acer Spin 5 SP513-51 | |
| Dell Inspiron 13 7359-4839 | |
| Lenovo Yoga 3 Pro 13 80HE004LGE | |
| 1920x1080 Fire Strike Graphics | |
| Lenovo Yoga 720-13IKB | |
| Acer Spin 5 SP513-51 | |
| Lenovo Yoga 3 Pro 13 80HE004LGE | |
| 3DMark 11 - 1280x720 Performance GPU | |
| Asus Zenbook Flip UX360UAK-BB351T | |
| Lenovo Yoga 720-13IKB | |
| Dell Inspiron 13 7359-4839 | |
| Acer Spin 5 SP513-51 | |
| Lenovo Yoga 3 Pro 13 80HE004LGE | |
| 3DMark 11 Performance | 1672 points | |
| 3DMark Ice Storm Standard Score | 54379 points | |
| 3DMark Cloud Gate Standard Score | 5768 points | |
| 3DMark Fire Strike Score | 858 points | |
| 3DMark Fire Strike Extreme Score | 391 points | |
| 3DMark Time Spy Score | 364 points | |
Help | ||
| low | med. | high | ultra | |
|---|---|---|---|---|
| BioShock Infinite (2013) | 56.5 | 30.2 | 24.9 | 7.8 |
| Battlefield 4 (2013) | 41.3 | 32.1 | 21 | 7.5 |
| The Witcher 3 (2015) | 14.8 | 12.4 | 5.5 | |
| Rise of the Tomb Raider (2016) | 17.9 | 11.2 | 6.7 |
Noise level
| Idle |
| 30.5 / 30.5 / 30.5 dB(A) |
| Load |
| 37.7 / 41.5 dB(A) |
 | ||
30 dB silent 40 dB(A) audible 50 dB(A) loud |
||
min: | ||
| Lenovo Yoga 720-13IKB HD Graphics 620, i5-7200U, Samsung PM961 MZVLW256HEHP | Asus Zenbook Flip UX360UAK-BB351T HD Graphics 620, i5-7200U, Micron SSD 1100 (MTFDDAV256TBN) | Dell Inspiron 13 7359-4839 HD Graphics 520, 6500U, Liteonit LCH-256V2S | Lenovo Yoga 3 Pro 13 80HE004LGE HD Graphics 5300, 5Y70, Samsung SSD PM851 MZNTE512HMJH | Acer Spin 5 SP513-51 HD Graphics 520, 6100U, Hynix HFS128G39TND | |
|---|---|---|---|---|---|
| Noise | 1% | 1% | 4% | 5% | |
| off / environment * (dB) | 30.5 | 30.7 -1% | 32.2 -6% | 31.2 -2% | 30.5 -0% |
| Idle Minimum * (dB) | 30.5 | 30.7 -1% | 32.2 -6% | 31.2 -2% | 30.5 -0% |
| Idle Average * (dB) | 30.5 | 30.7 -1% | 32.2 -6% | 31.4 -3% | 30.5 -0% |
| Idle Maximum * (dB) | 30.5 | 31.7 -4% | 32.2 -6% | 31.8 -4% | 30.6 -0% |
| Load Average * (dB) | 37.7 | 38.5 -2% | 34.1 10% | 32.3 14% | 31 18% |
| Load Maximum * (dB) | 41.5 | 36 13% | 34 18% | 32 23% | 36.8 11% |
* ... smaller is better
(±) The maximum temperature on the upper side is 41.5 °C / 107 F, compared to the average of 35.4 °C / 96 F, ranging from 19.6 to 60 °C for the class Convertible.
(±) The bottom heats up to a maximum of 43.6 °C / 110 F, compared to the average of 36.9 °C / 98 F
(+) In idle usage, the average temperature for the upper side is 24.8 °C / 77 F, compared to the device average of 30.3 °C / 87 F.
(+) The palmrests and touchpad are cooler than skin temperature with a maximum of 30.5 °C / 86.9 F and are therefore cool to the touch.
(-) The average temperature of the palmrest area of similar devices was 28 °C / 82.4 F (-2.5 °C / -4.5 F).
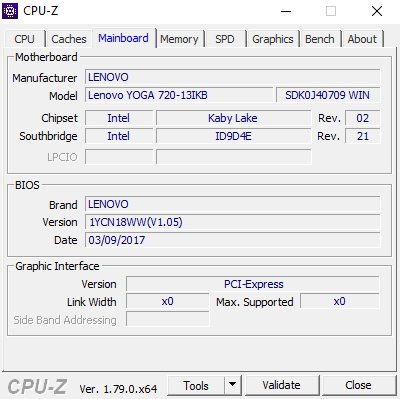
| Lenovo Yoga 720-13IKB i5-7200U, HD Graphics 620 | Asus Zenbook Flip UX360UAK-BB351T i5-7200U, HD Graphics 620 | Dell Inspiron 13 7359-4839 6500U, HD Graphics 520 | Lenovo Yoga 3 Pro 13 80HE004LGE 5Y70, HD Graphics 5300 | Acer Spin 5 SP513-51 6100U, HD Graphics 520 | |
|---|---|---|---|---|---|
| Heat | 5% | 3% | -6% | -2% | |
| Maximum Upper Side * (°C) | 41.5 | 41.2 1% | 39.1 6% | 41 1% | 38.3 8% |
| Maximum Bottom * (°C) | 43.6 | 41 6% | 43.6 -0% | 34.8 20% | 42.5 3% |
| Idle Upper Side * (°C) | 25.8 | 25 3% | 25.5 1% | 34.2 -33% | 28.7 -11% |
| Idle Bottom * (°C) | 27.2 | 25.1 8% | 26.5 3% | 30.4 -12% | 29.4 -8% |
* ... smaller is better
Lenovo Yoga 720-13IKB audio analysis
(-) | not very loud speakers (66 dB)
Bass 100 - 315 Hz
(-) | nearly no bass - on average 21.6% lower than median
(±) | linearity of bass is average (12.1% delta to prev. frequency)
Mids 400 - 2000 Hz
(+) | balanced mids - only 3.1% away from median
(±) | linearity of mids is average (10.2% delta to prev. frequency)
Highs 2 - 16 kHz
(+) | balanced highs - only 2% away from median
(+) | highs are linear (4.7% delta to prev. frequency)
Overall 100 - 16.000 Hz
(±) | linearity of overall sound is average (20.4% difference to median)
Compared to same class
» 53% of all tested devices in this class were better, 7% similar, 40% worse
» The best had a delta of 6%, average was 20%, worst was 57%
Compared to all devices tested
» 54% of all tested devices were better, 8% similar, 38% worse
» The best had a delta of 4%, average was 23%, worst was 134%
Apple MacBook 12 (Early 2016) 1.1 GHz audio analysis
(+) | speakers can play relatively loud (83.6 dB)
Bass 100 - 315 Hz
(±) | reduced bass - on average 11.3% lower than median
(±) | linearity of bass is average (14.2% delta to prev. frequency)
Mids 400 - 2000 Hz
(+) | balanced mids - only 2.4% away from median
(+) | mids are linear (5.5% delta to prev. frequency)
Highs 2 - 16 kHz
(+) | balanced highs - only 2% away from median
(+) | highs are linear (4.5% delta to prev. frequency)
Overall 100 - 16.000 Hz
(+) | overall sound is linear (10.2% difference to median)
Compared to same class
» 7% of all tested devices in this class were better, 2% similar, 90% worse
» The best had a delta of 5%, average was 18%, worst was 53%
Compared to all devices tested
» 5% of all tested devices were better, 1% similar, 94% worse
» The best had a delta of 4%, average was 23%, worst was 134%
| Off / Standby | |
| Idle | |
| Load |
|
Key:
min: | |
| Lenovo Yoga 720-13IKB i5-7200U, HD Graphics 620, Samsung PM961 MZVLW256HEHP, IPS, 1920x1080, 13.3" | Asus Zenbook Flip UX360UAK-BB351T i5-7200U, HD Graphics 620, Micron SSD 1100 (MTFDDAV256TBN), IPS, 1920x1080, 13.3" | Dell Inspiron 13 7359-4839 6500U, HD Graphics 520, Liteonit LCH-256V2S, IPS, 1920x1080, 13.3" | Lenovo Yoga 3 Pro 13 80HE004LGE 5Y70, HD Graphics 5300, Samsung SSD PM851 MZNTE512HMJH, IPS, 3200x1800, 13.3" | Acer Spin 5 SP513-51 6100U, HD Graphics 520, Hynix HFS128G39TND, IPS LED, 1920x1080, 13.3" | |
|---|---|---|---|---|---|
| Power Consumption | 7% | 18% | 4% | 19% | |
| Idle Minimum * (Watt) | 4.3 | 4.2 2% | 4 7% | 4.8 -12% | 4.1 5% |
| Idle Average * (Watt) | 7.9 | 7.4 6% | 4.8 39% | 10.7 -35% | 6.8 14% |
| Idle Maximum * (Watt) | 10 | 8.6 14% | 7.6 24% | 11.8 -18% | 7.9 21% |
| Load Average * (Watt) | 34.2 | 32 6% | 30 12% | 18.3 46% | 20.4 40% |
| Load Maximum * (Watt) | 32.2 | 30.2 6% | 29.3 9% | 19.7 39% | 26.8 17% |
* ... smaller is better
| Lenovo Yoga 720-13IKB i5-7200U, HD Graphics 620, 48 Wh | Asus Zenbook Flip UX360UAK-BB351T i5-7200U, HD Graphics 620, 57 Wh | Dell Inspiron 13 7359-4839 6500U, HD Graphics 520, 44 Wh | Lenovo Yoga 3 Pro 13 80HE004LGE 5Y70, HD Graphics 5300, 44 Wh | Acer Spin 5 SP513-51 6100U, HD Graphics 520, 45 Wh | |
|---|---|---|---|---|---|
| Battery runtime | 39% | -14% | -48% | -14% | |
| Reader / Idle (h) | 16.2 | 14.8 -9% | 12.5 -23% | ||
| H.264 (h) | 7.6 | ||||
| WiFi v1.3 (h) | 8.4 | 11.7 39% | 8.1 -4% | 4.4 -48% | 7.7 -8% |
| Load (h) | 2.5 | 1.8 -28% | 2.2 -12% |
Pros
Cons
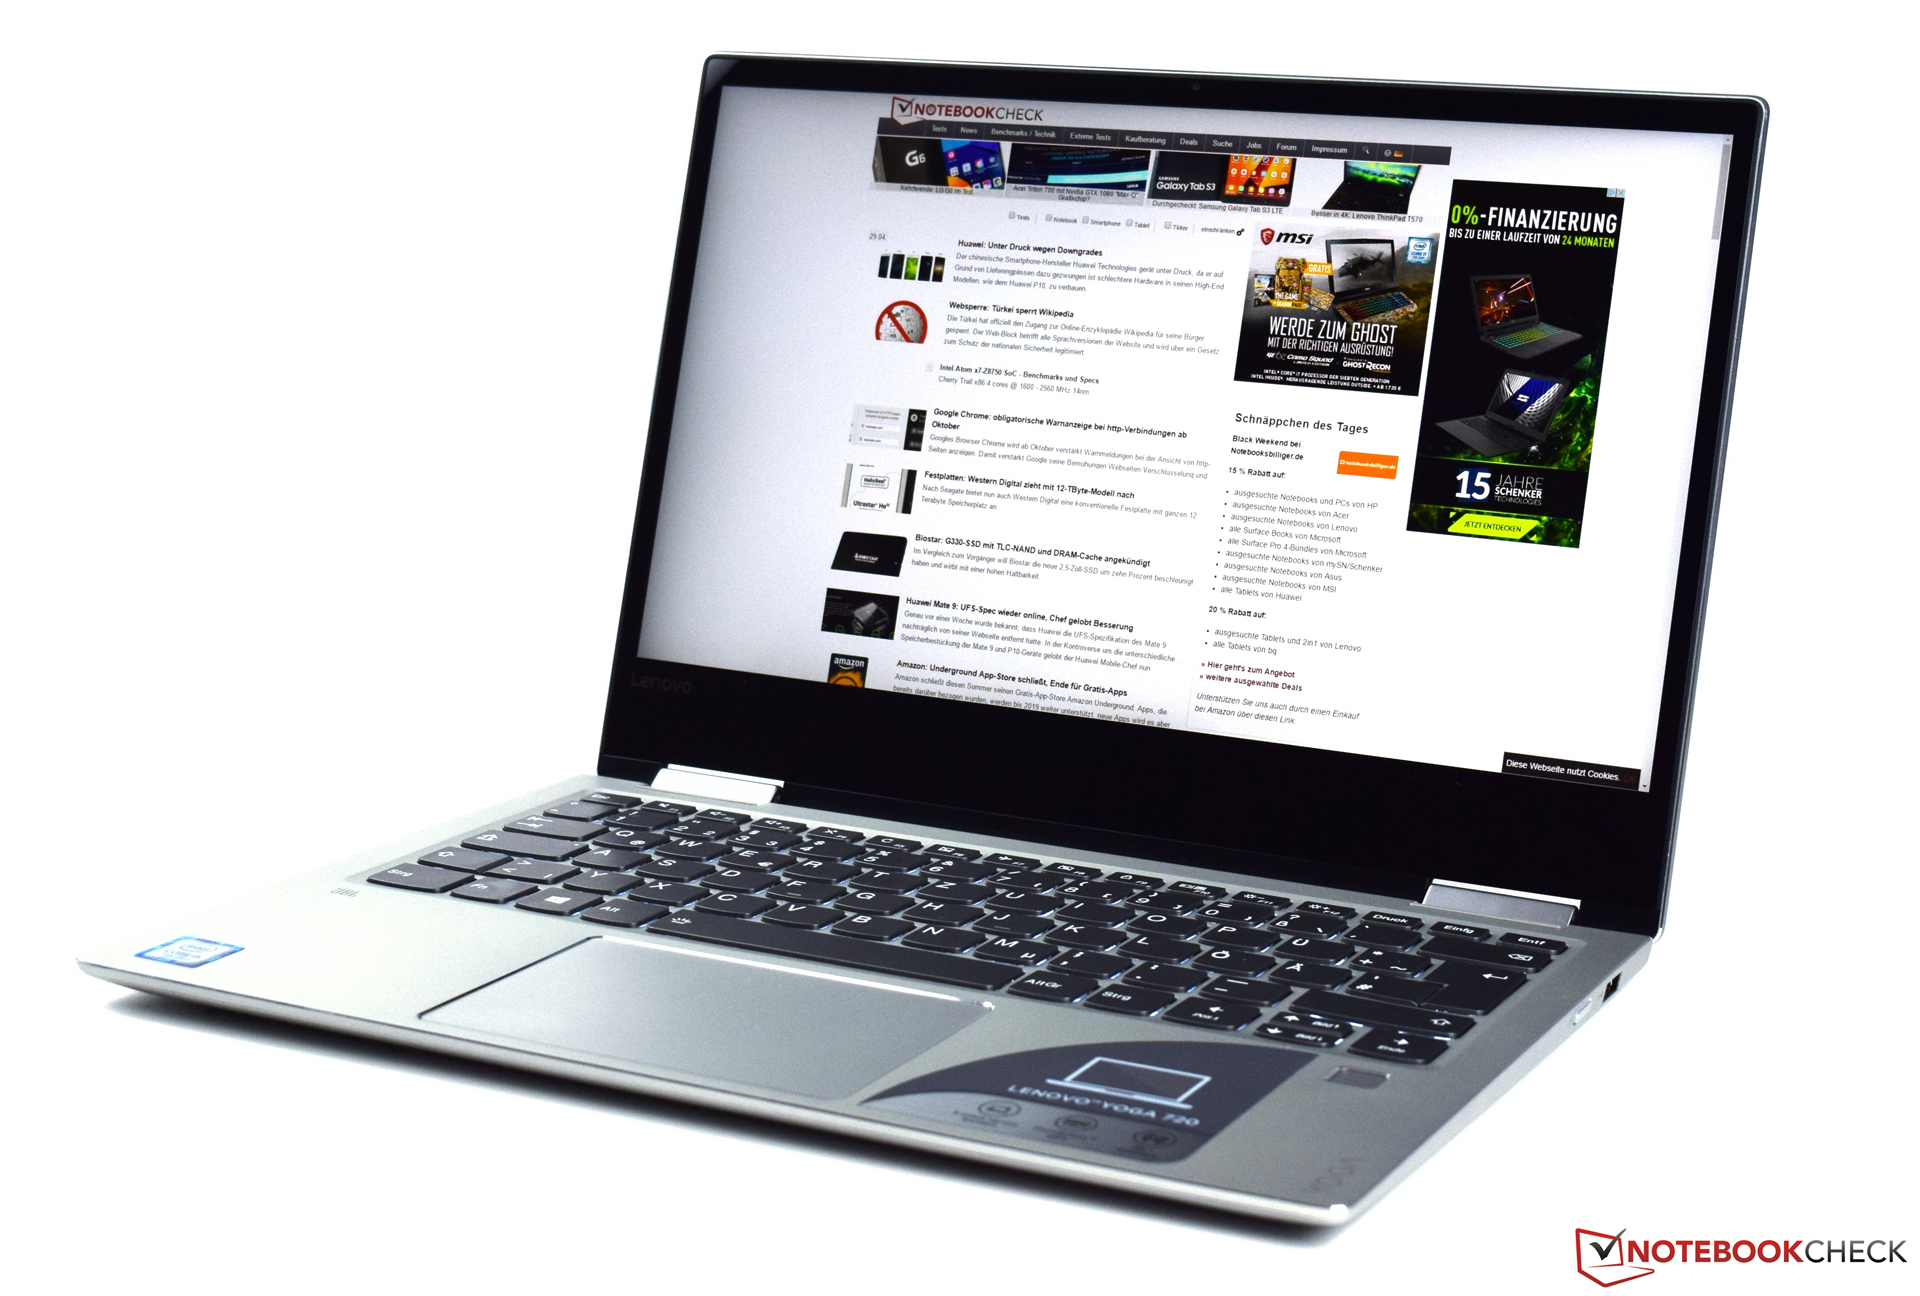
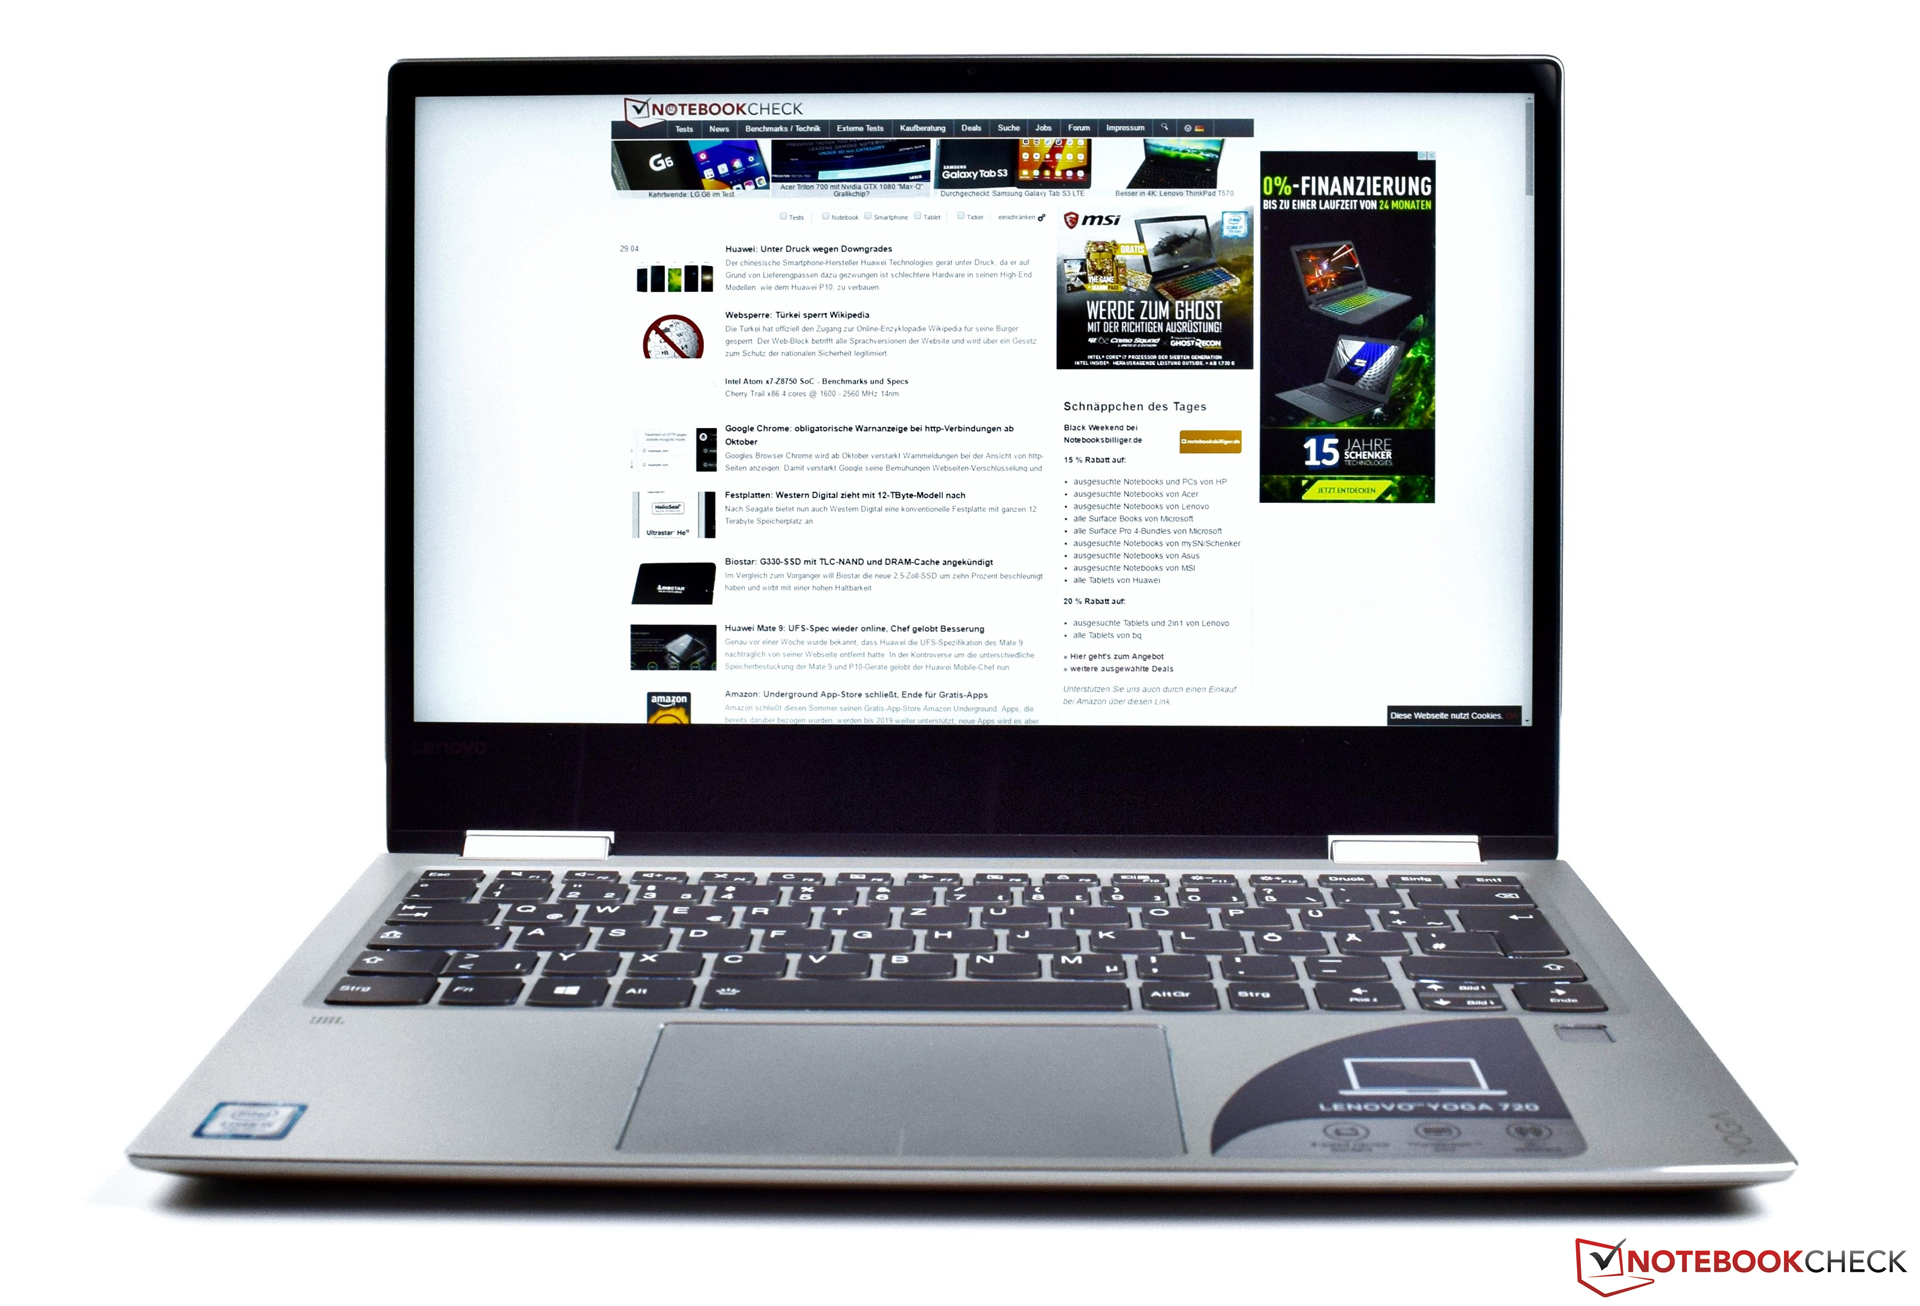
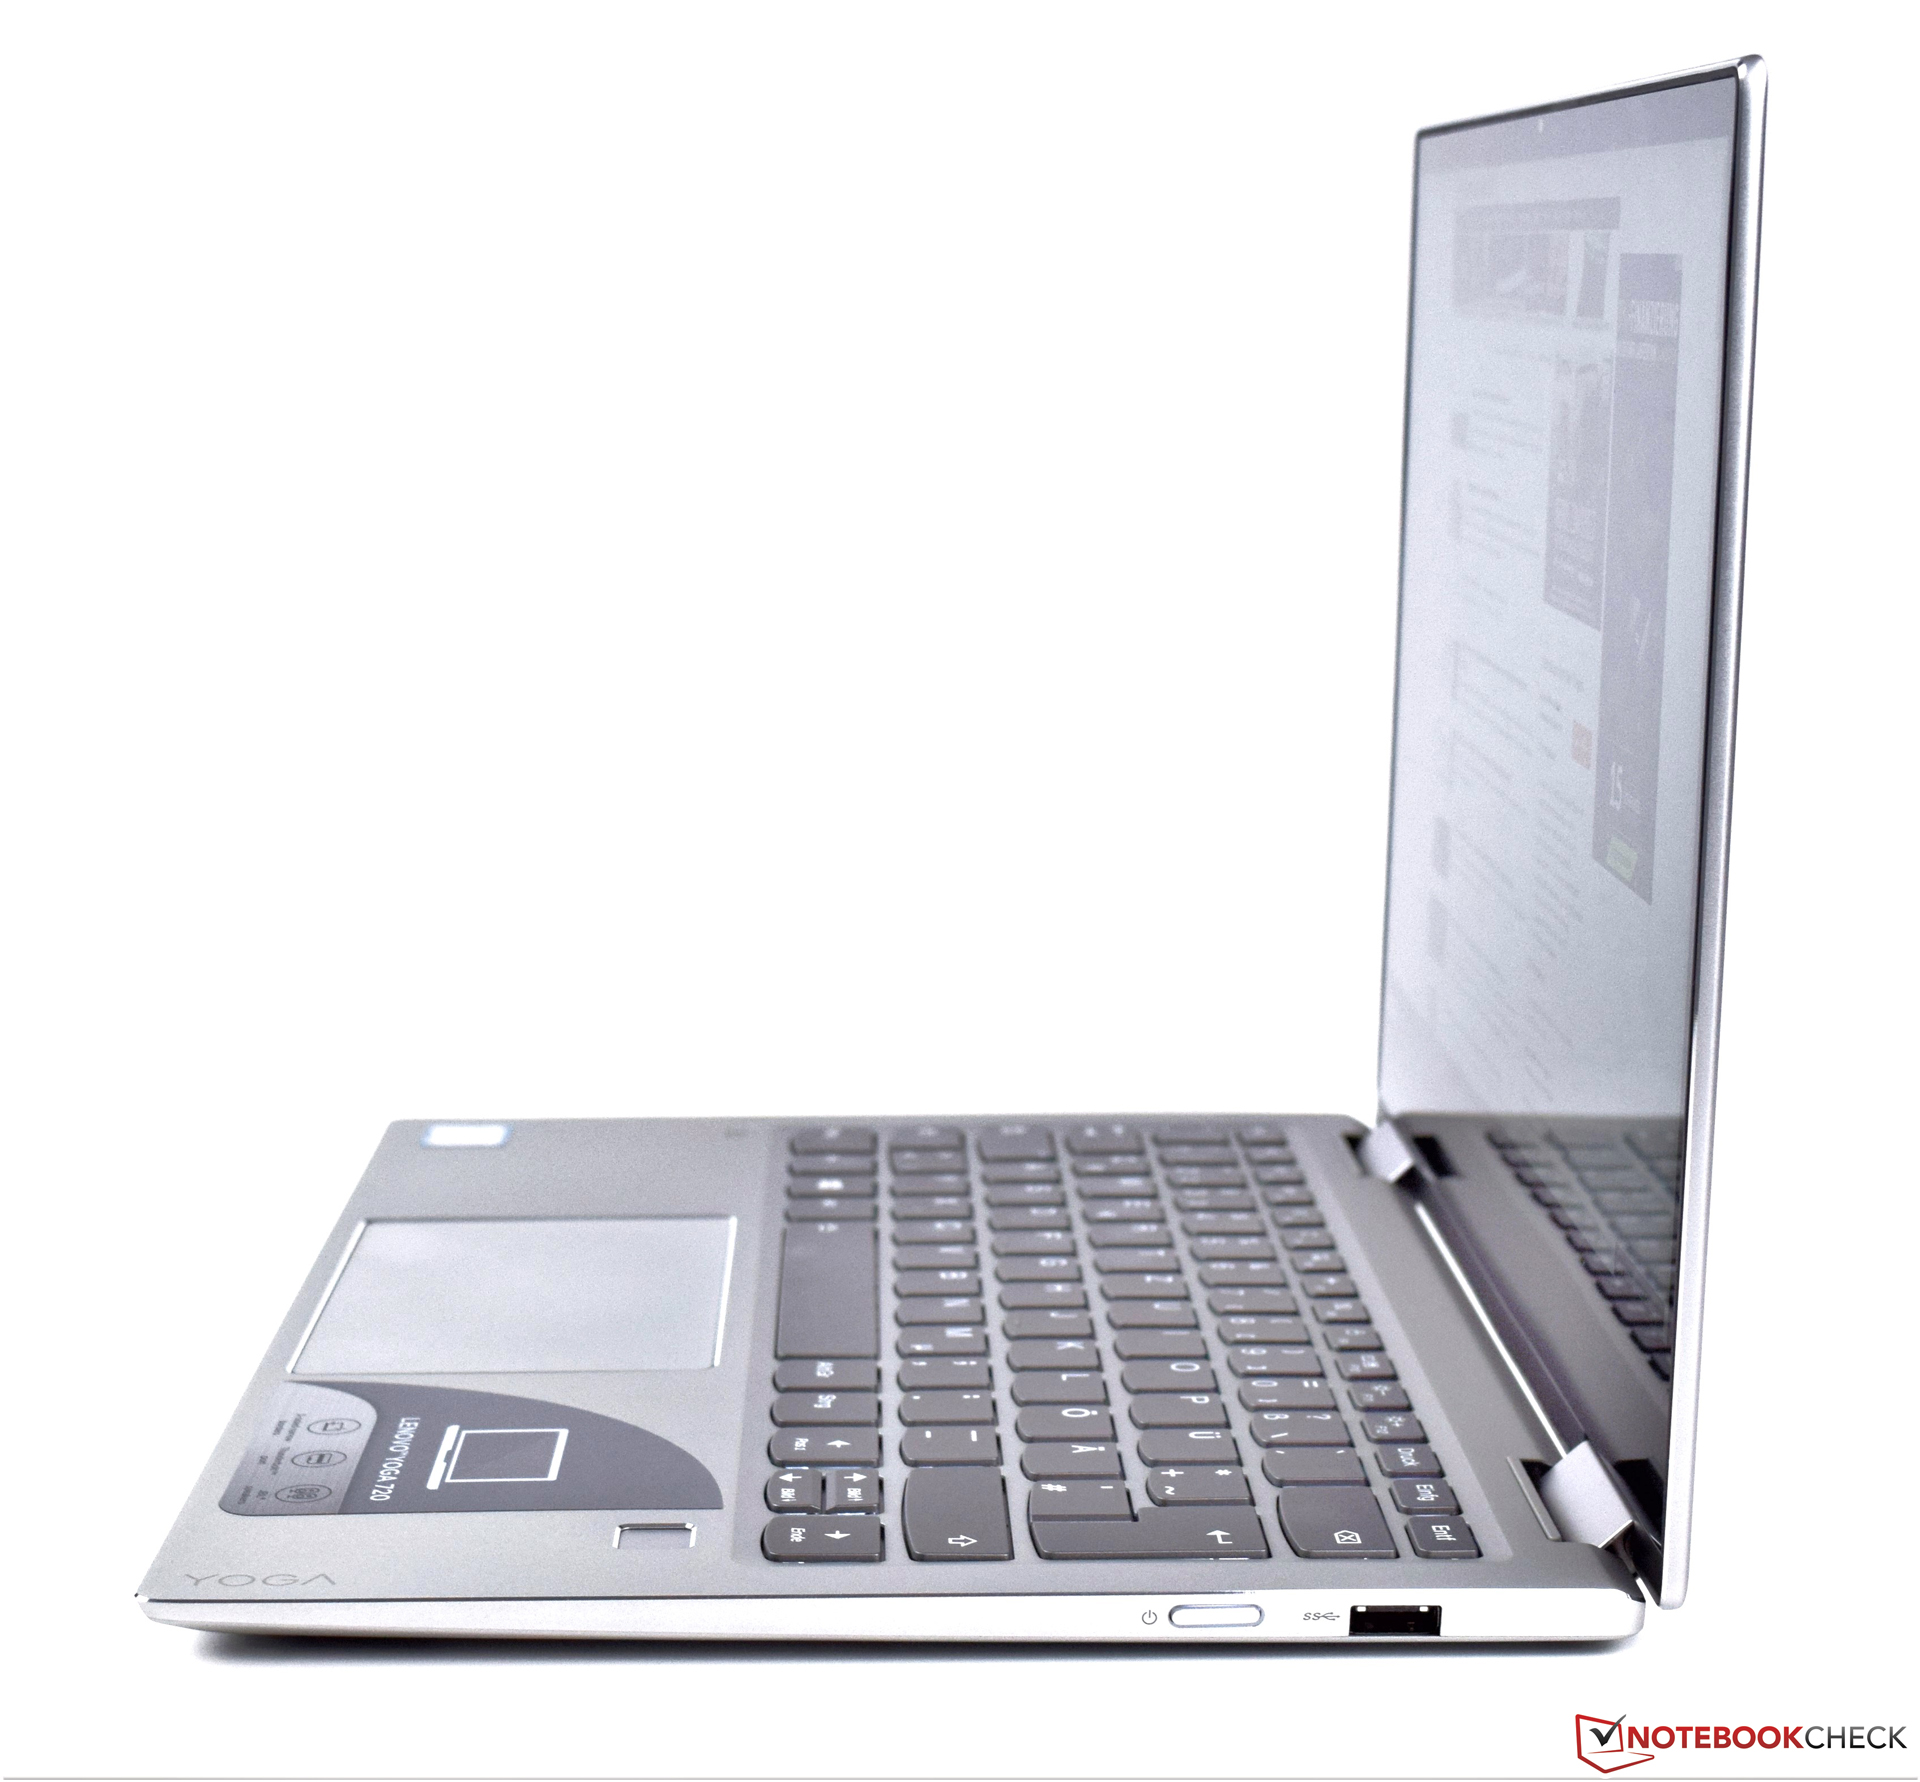
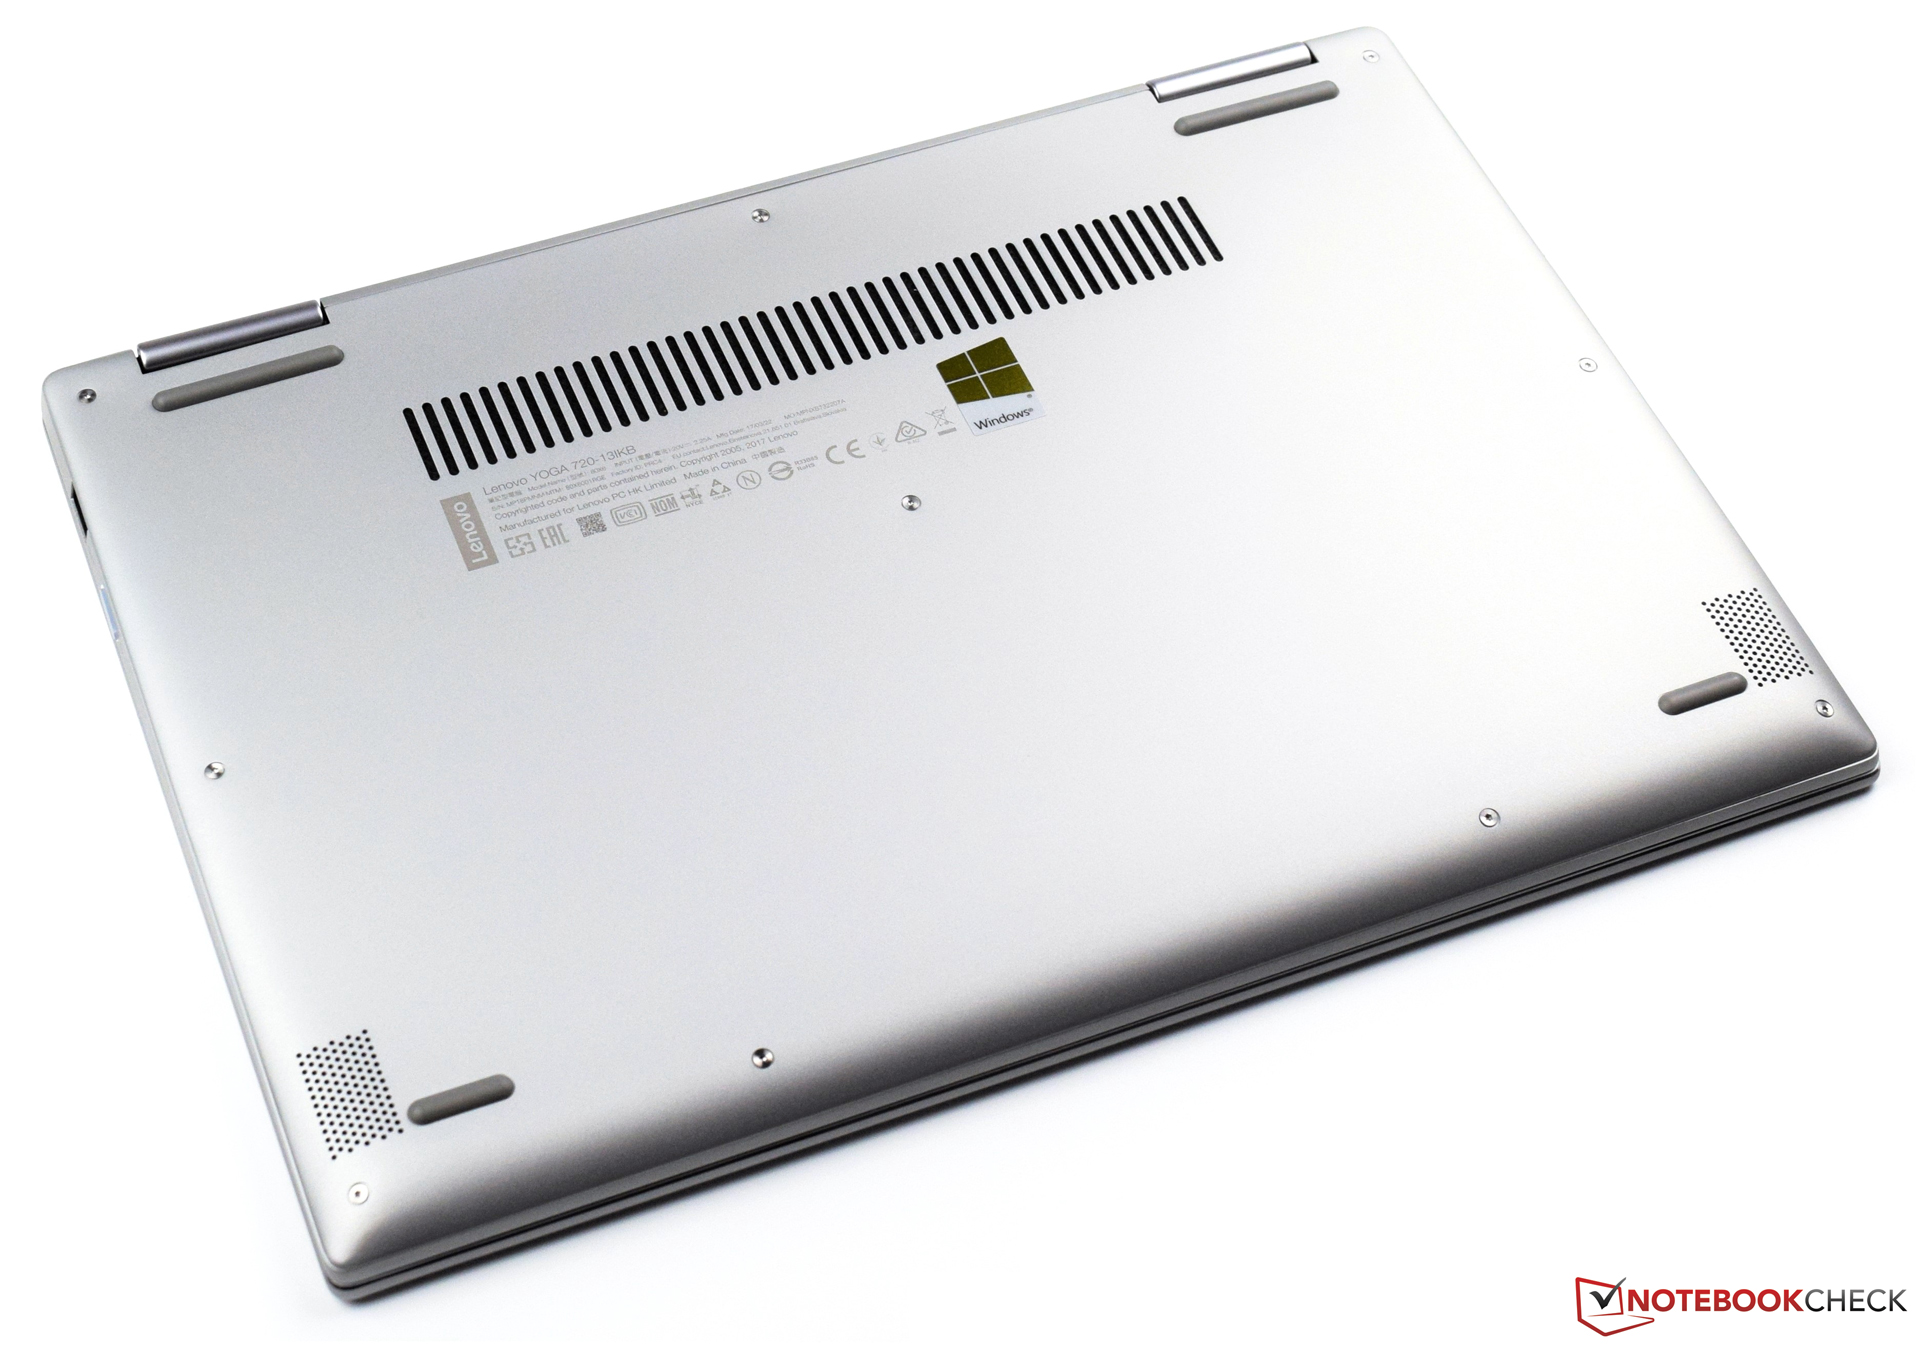
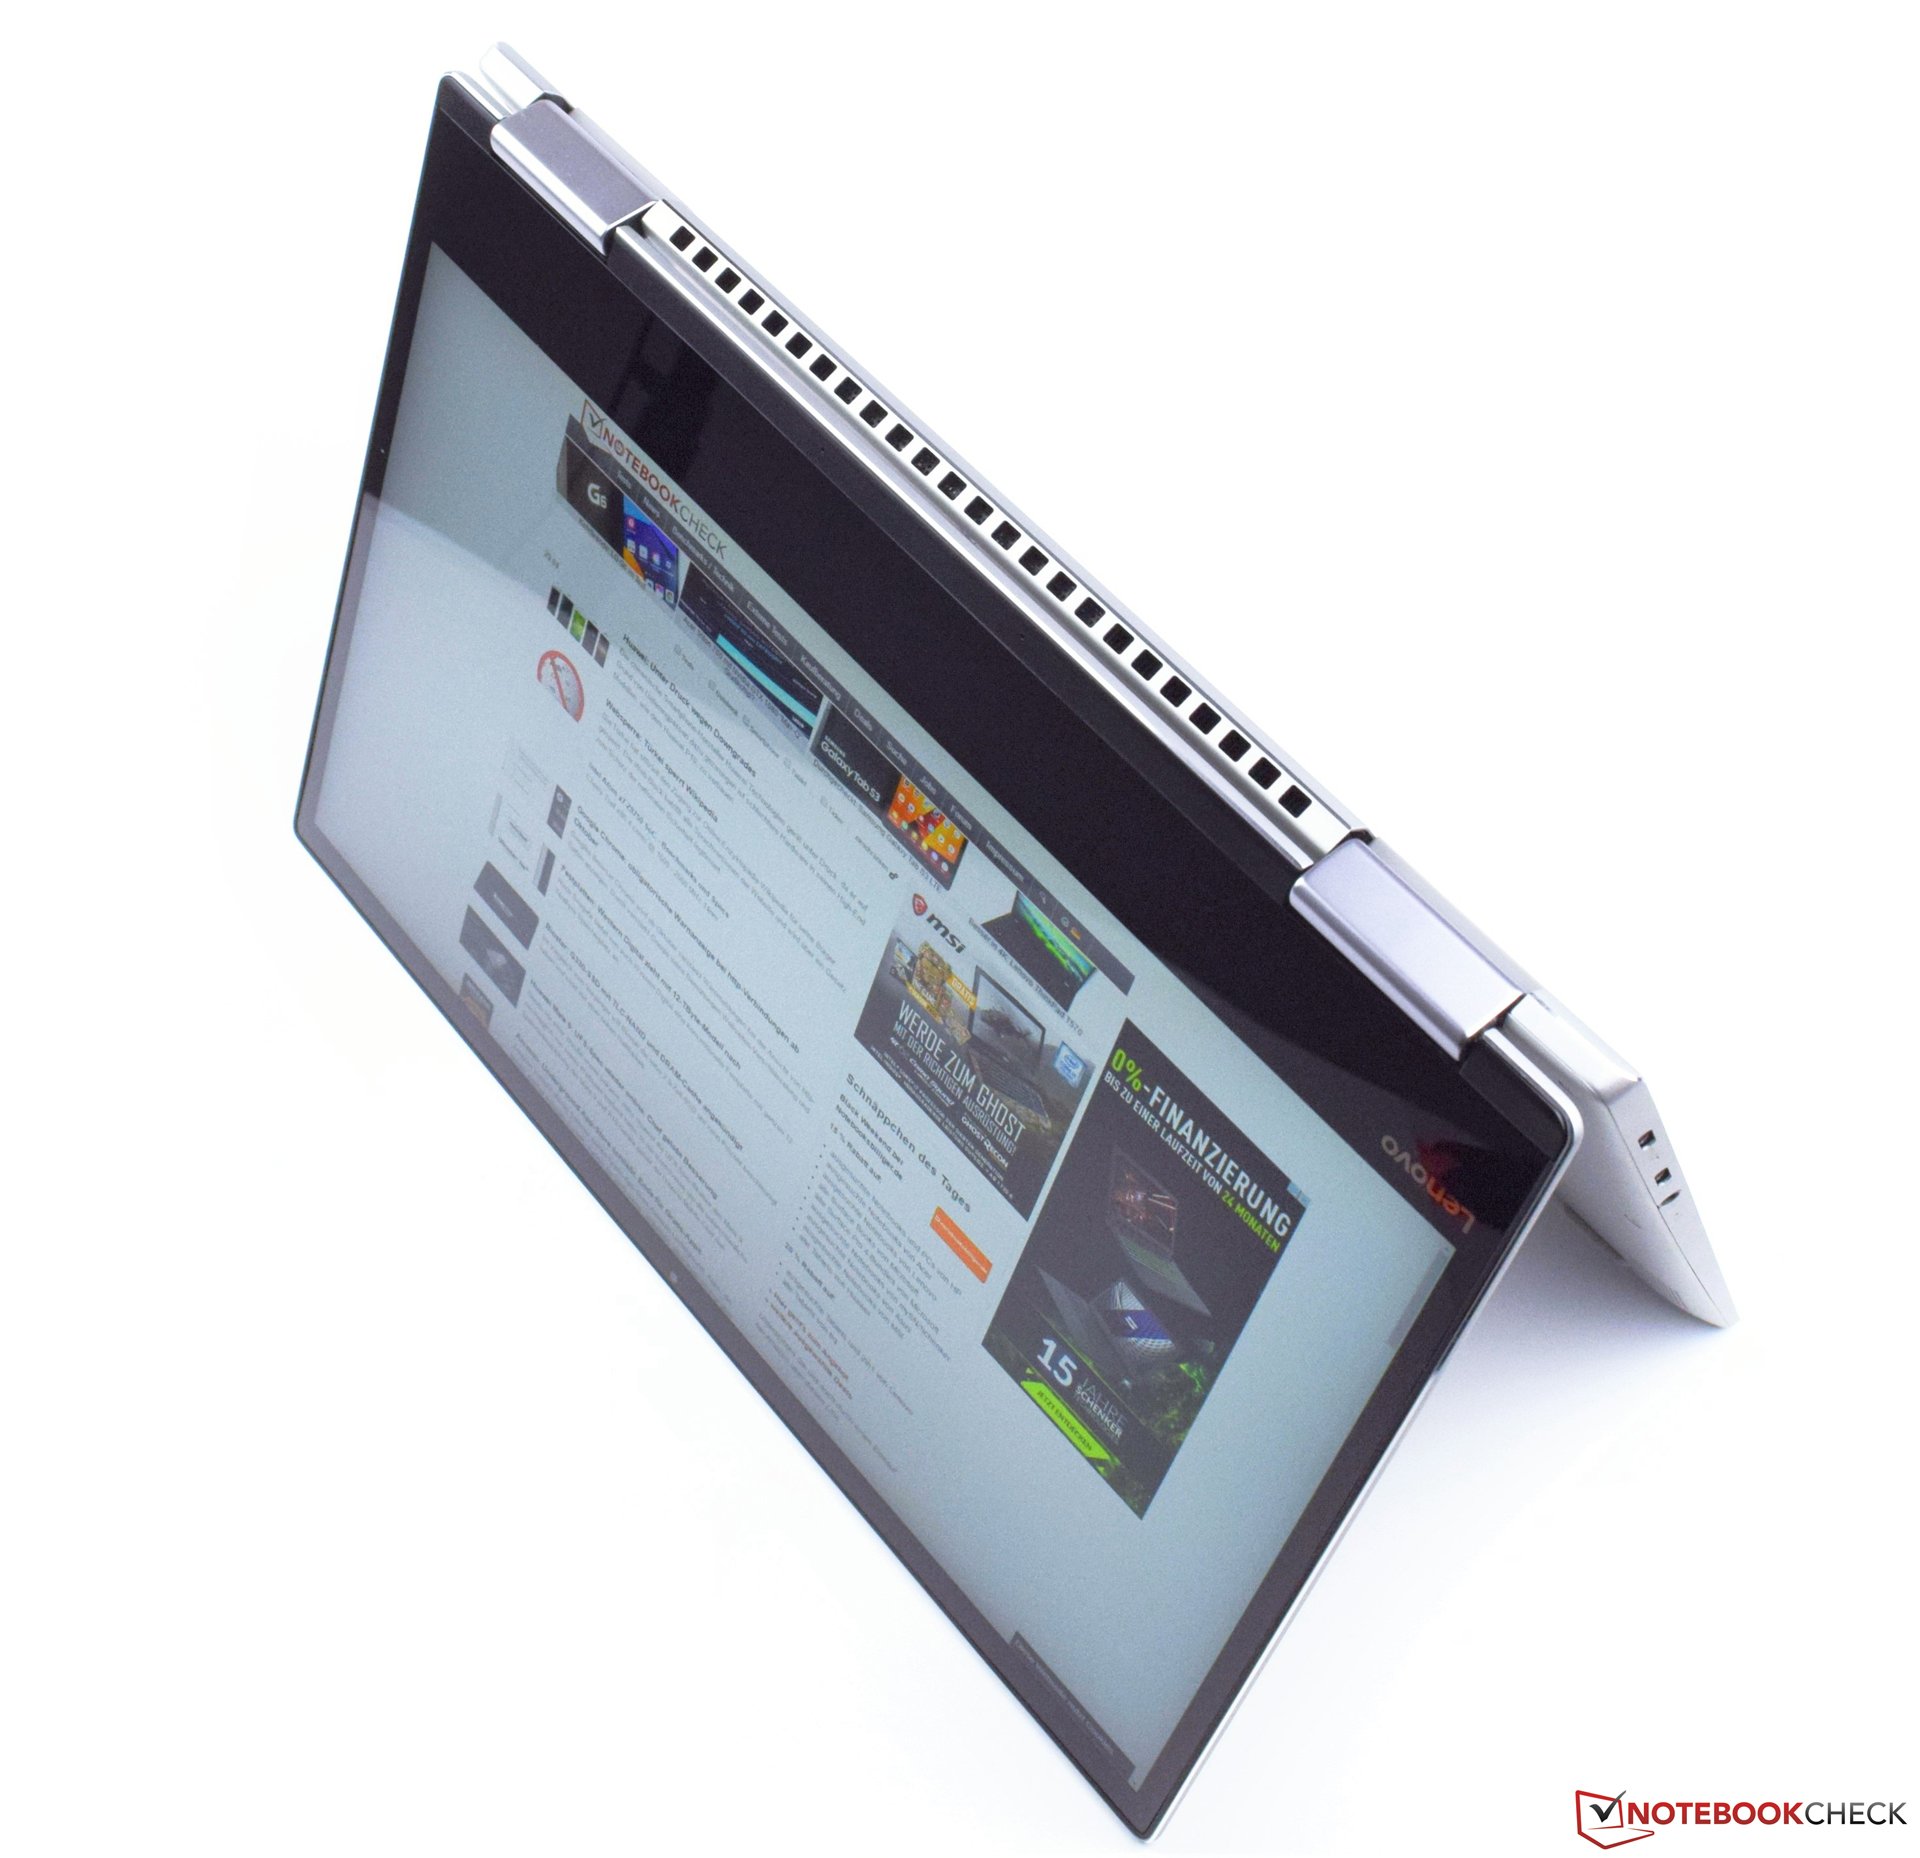
联想瑜伽720-13IKB是一款坚实耐用的多功能13寸变形本,它重量轻,尺寸小,拥有360度的铰链。它基于英特尔的最新一代 酷睿 i5-7200U Kaby Lake处理器,提供了8 GB的运行内存,由于256 GB固态硬盘的速度很快,该机运行速度非常快。结合全高清显示屏,购买价低至850美元。
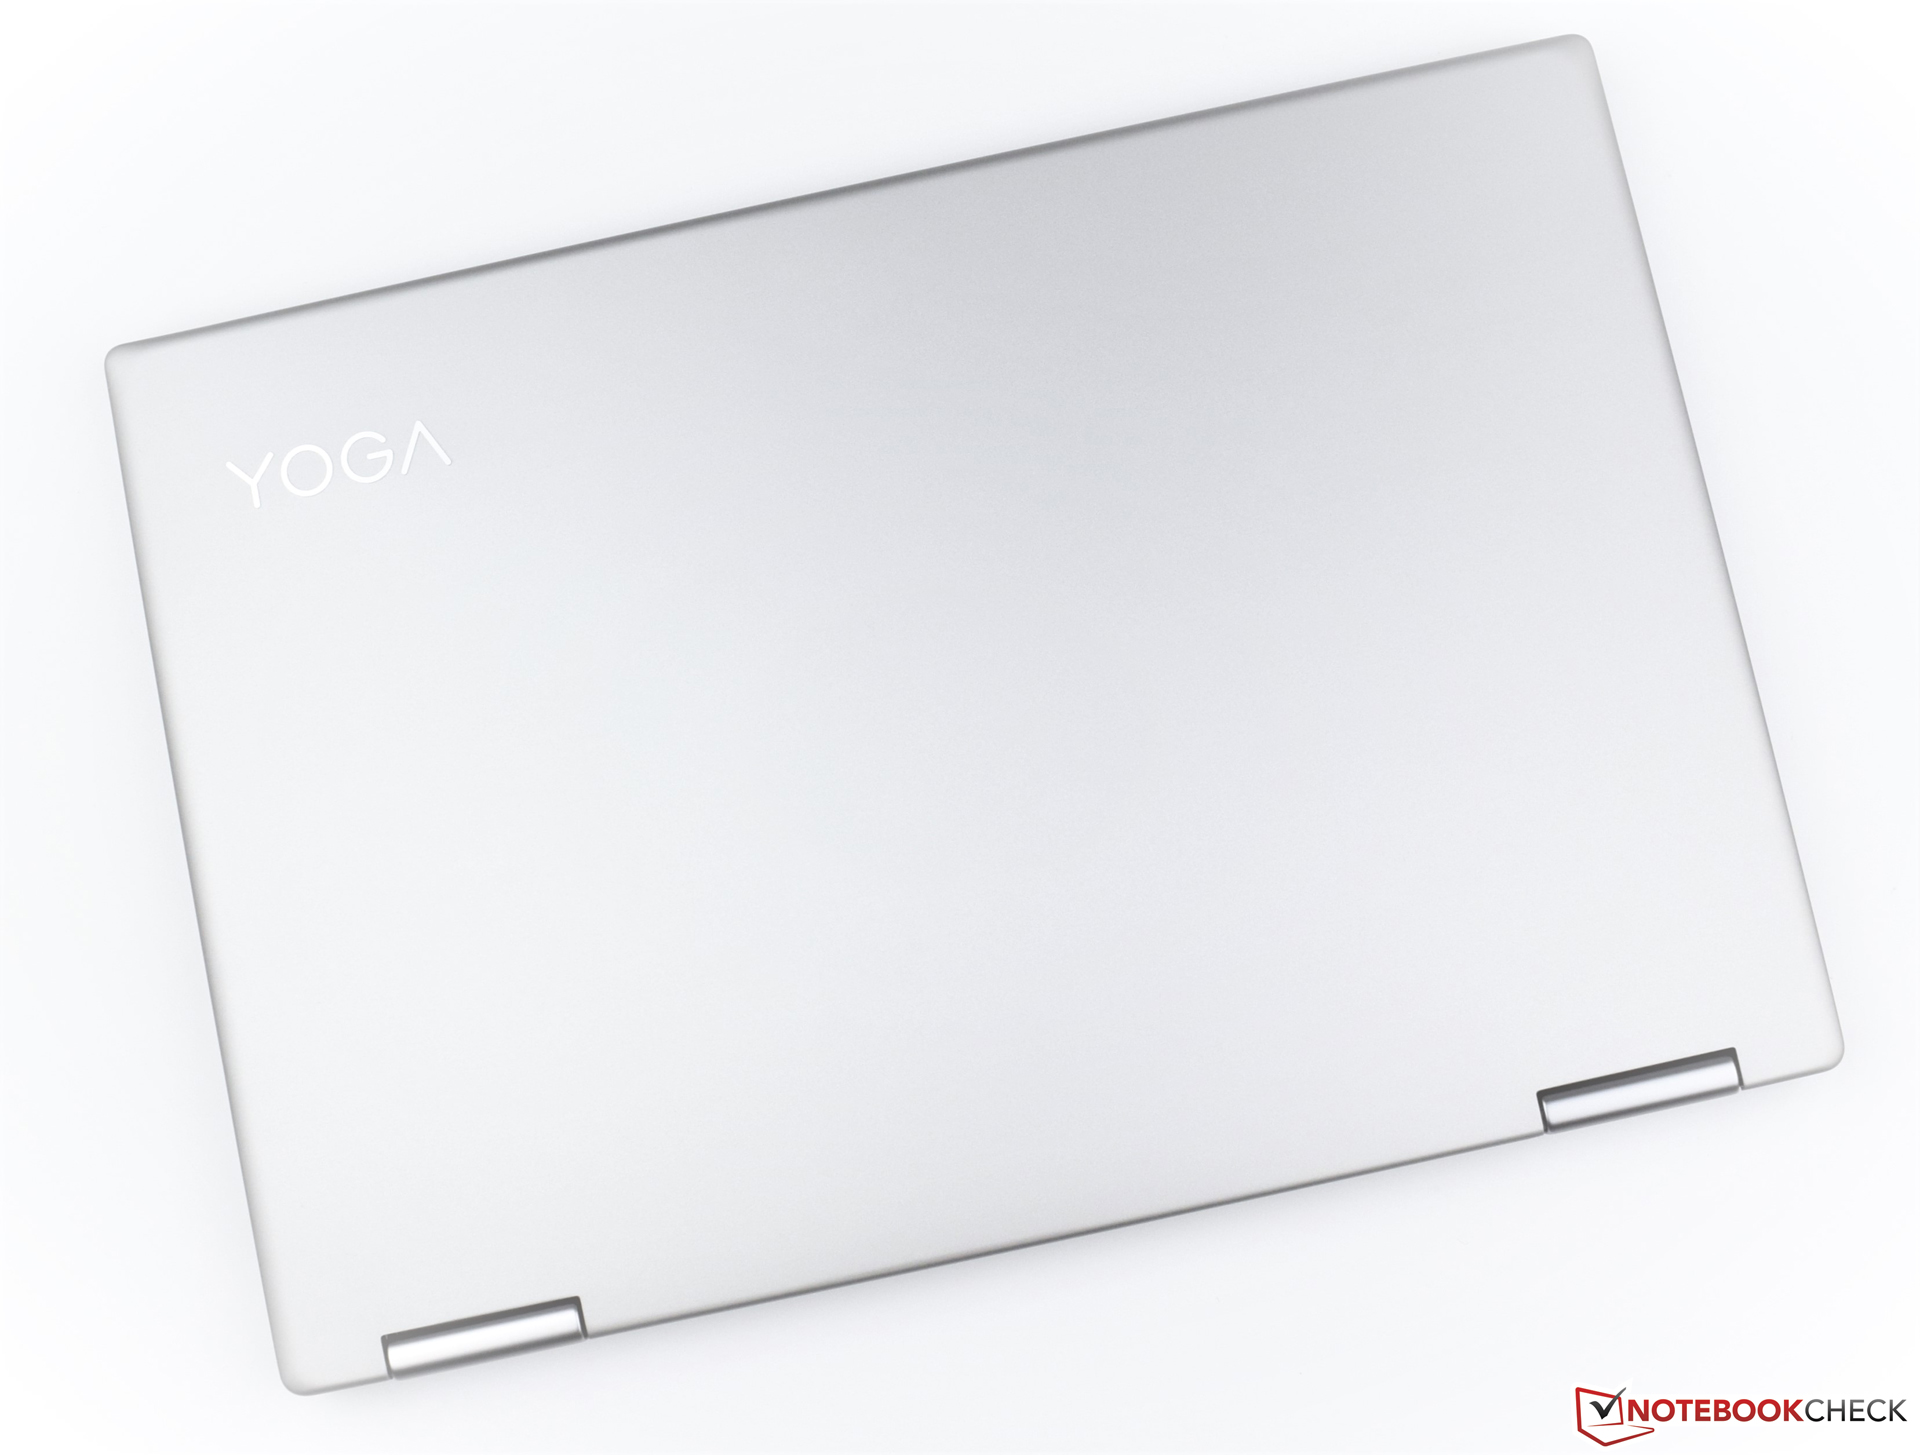
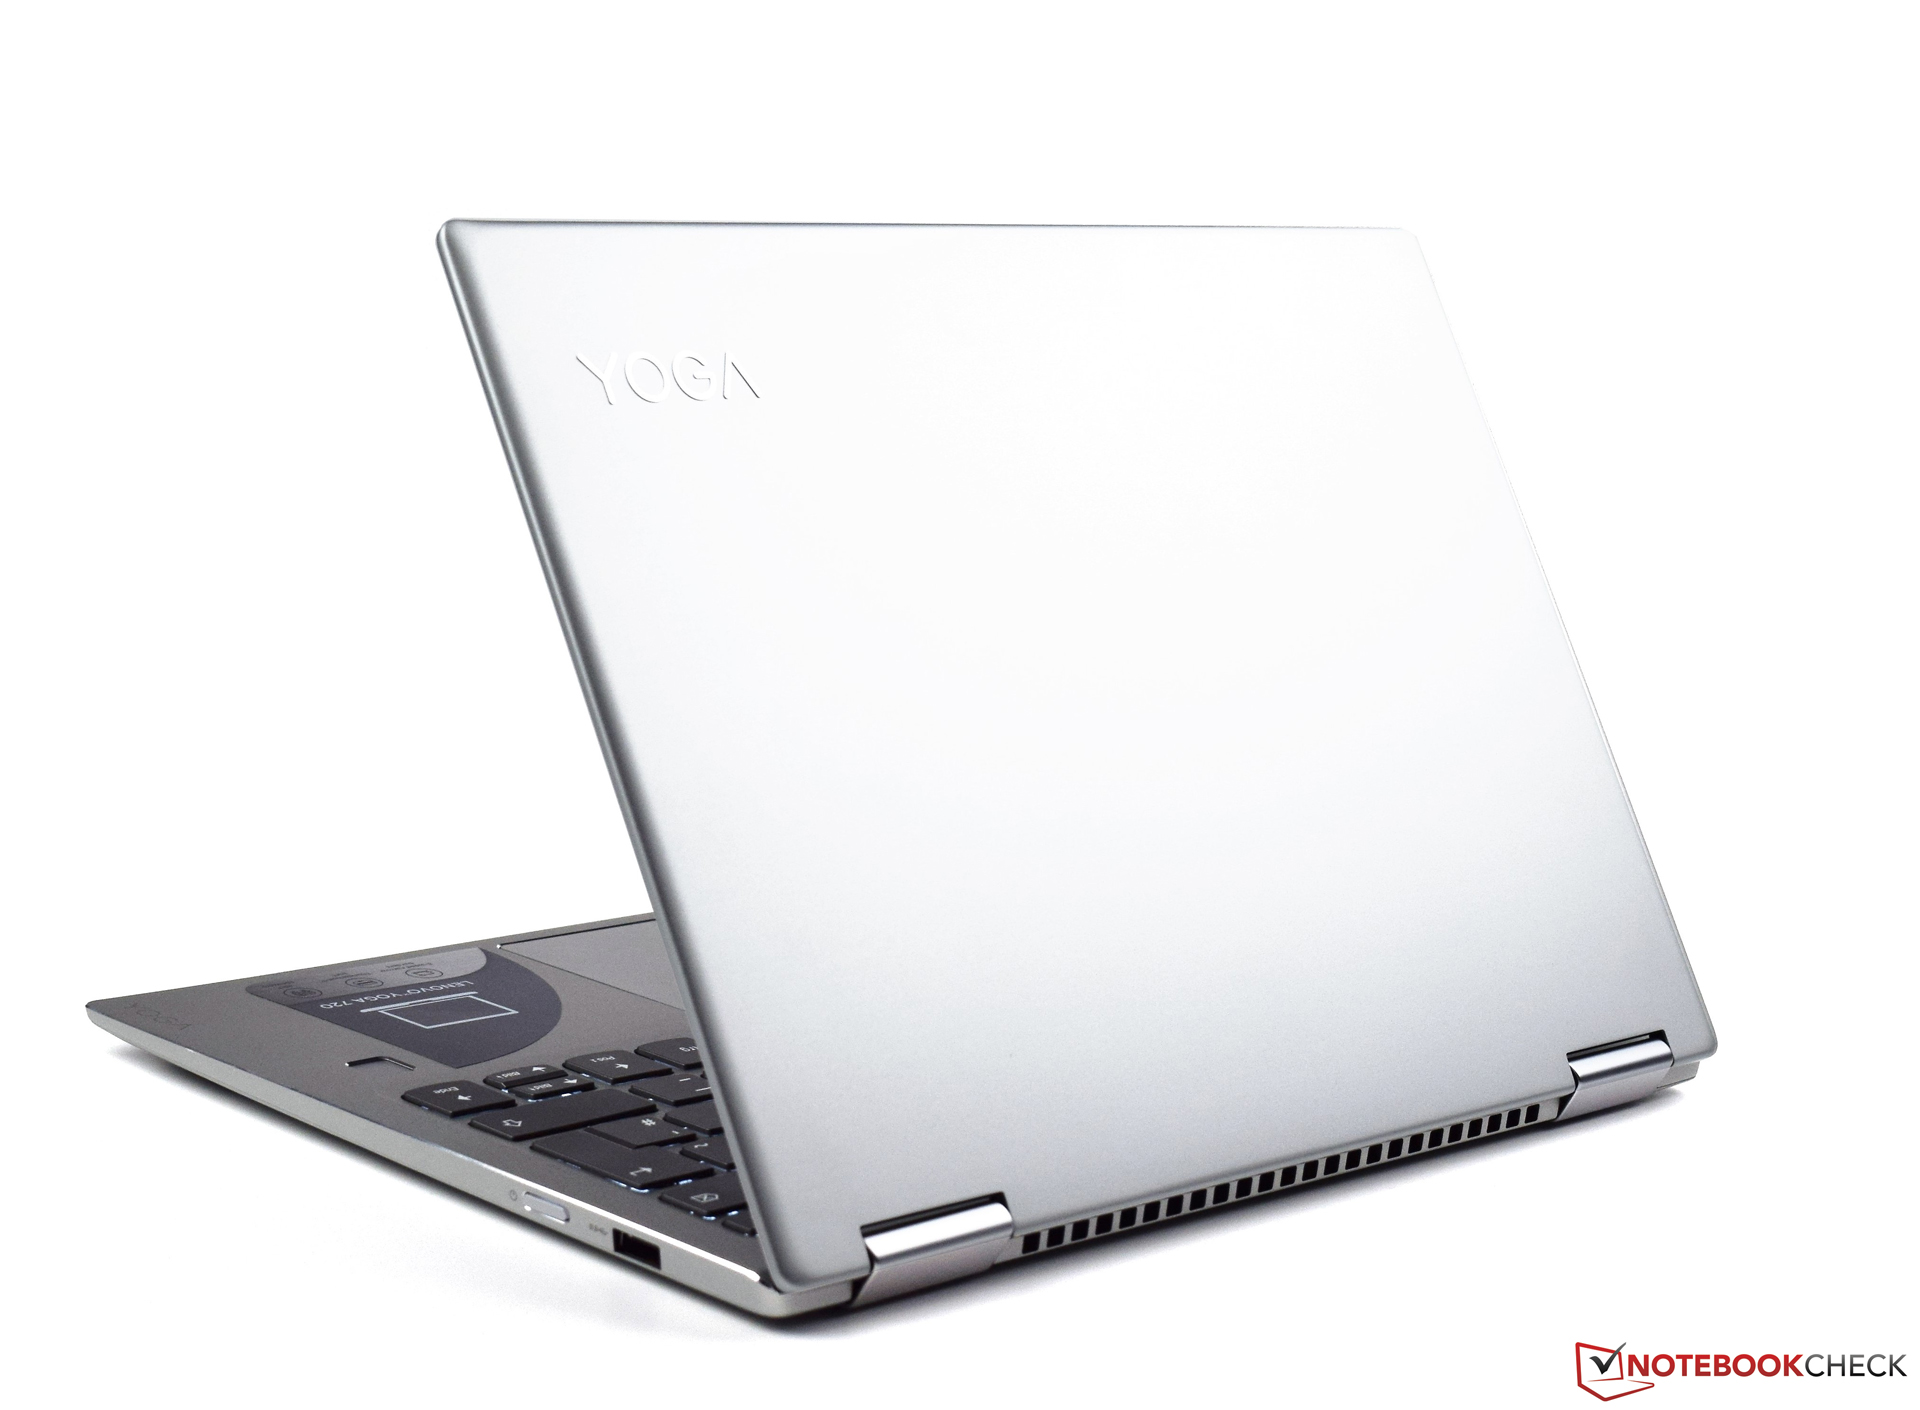
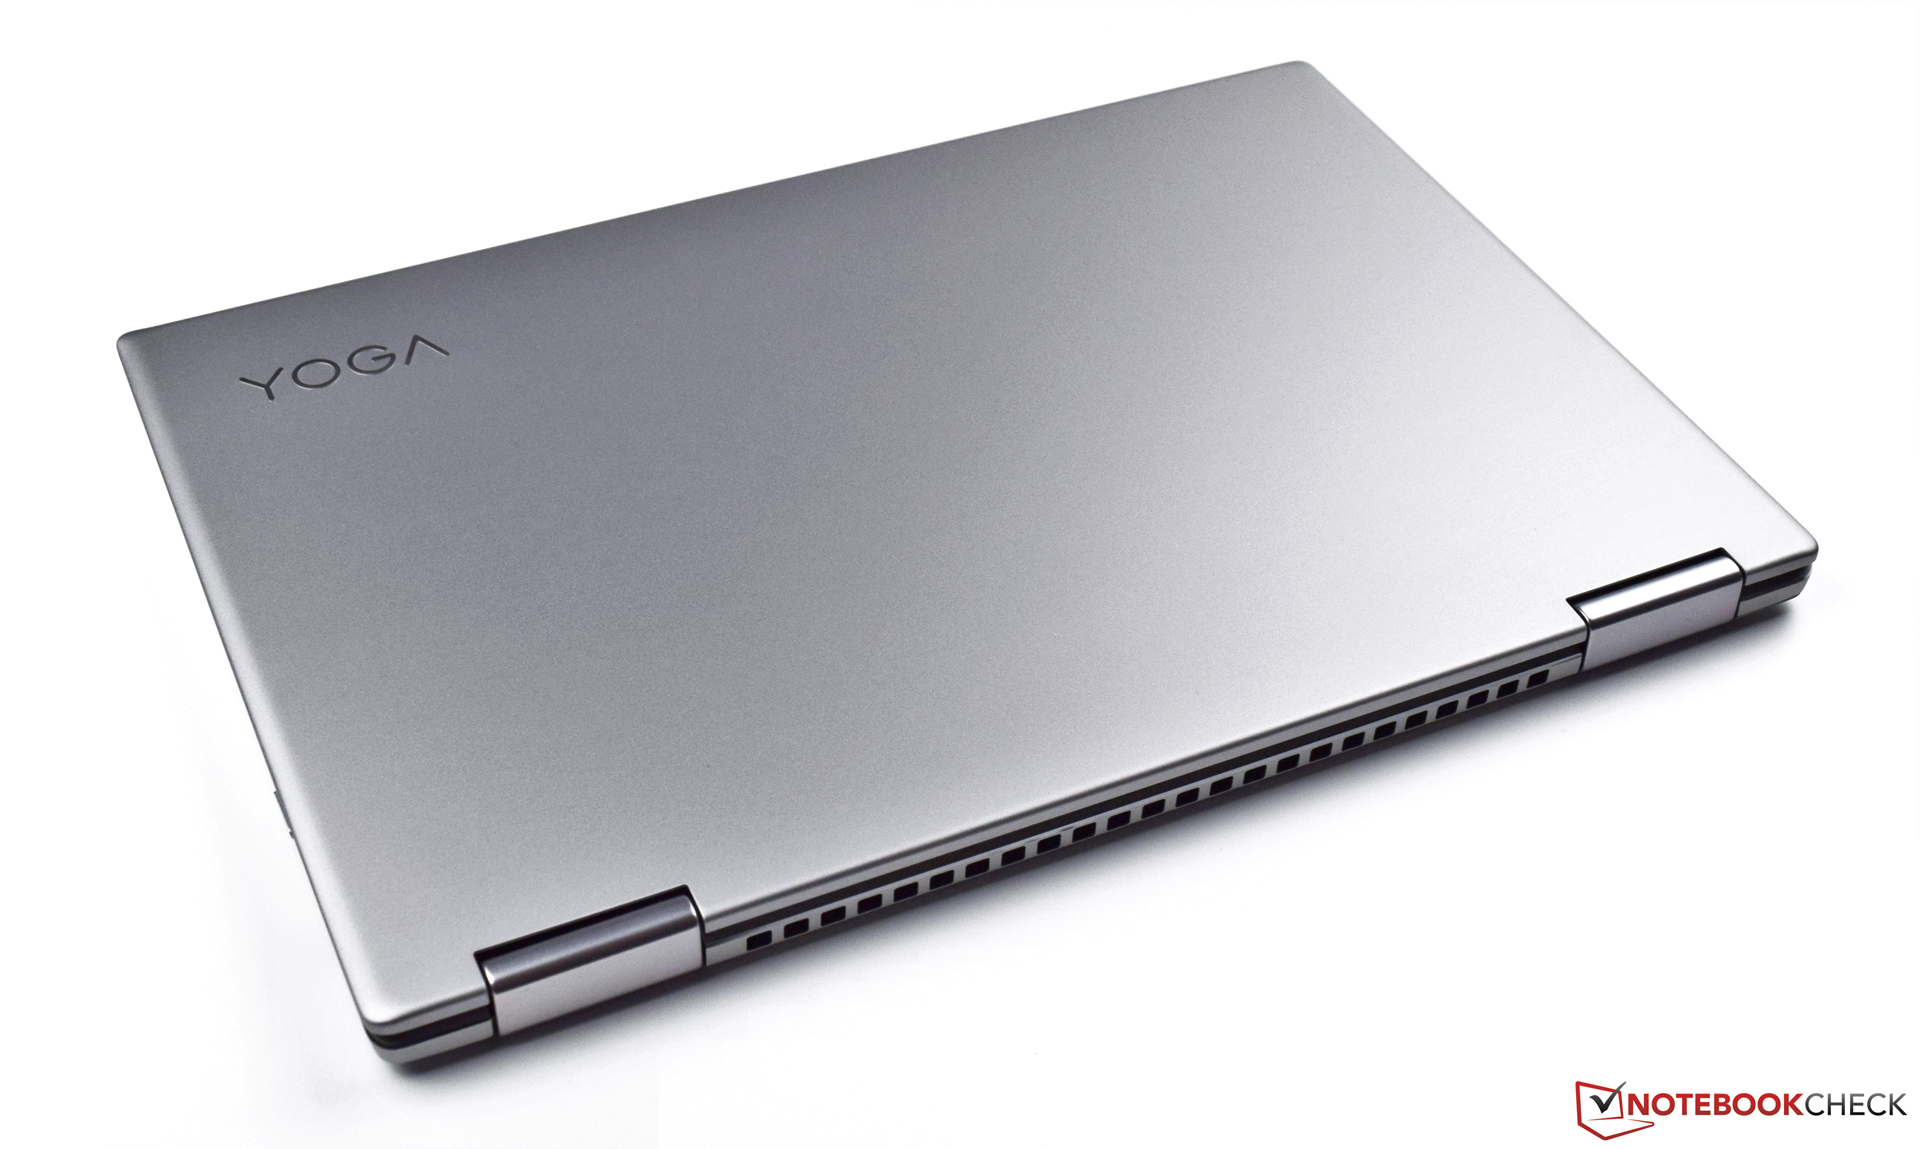
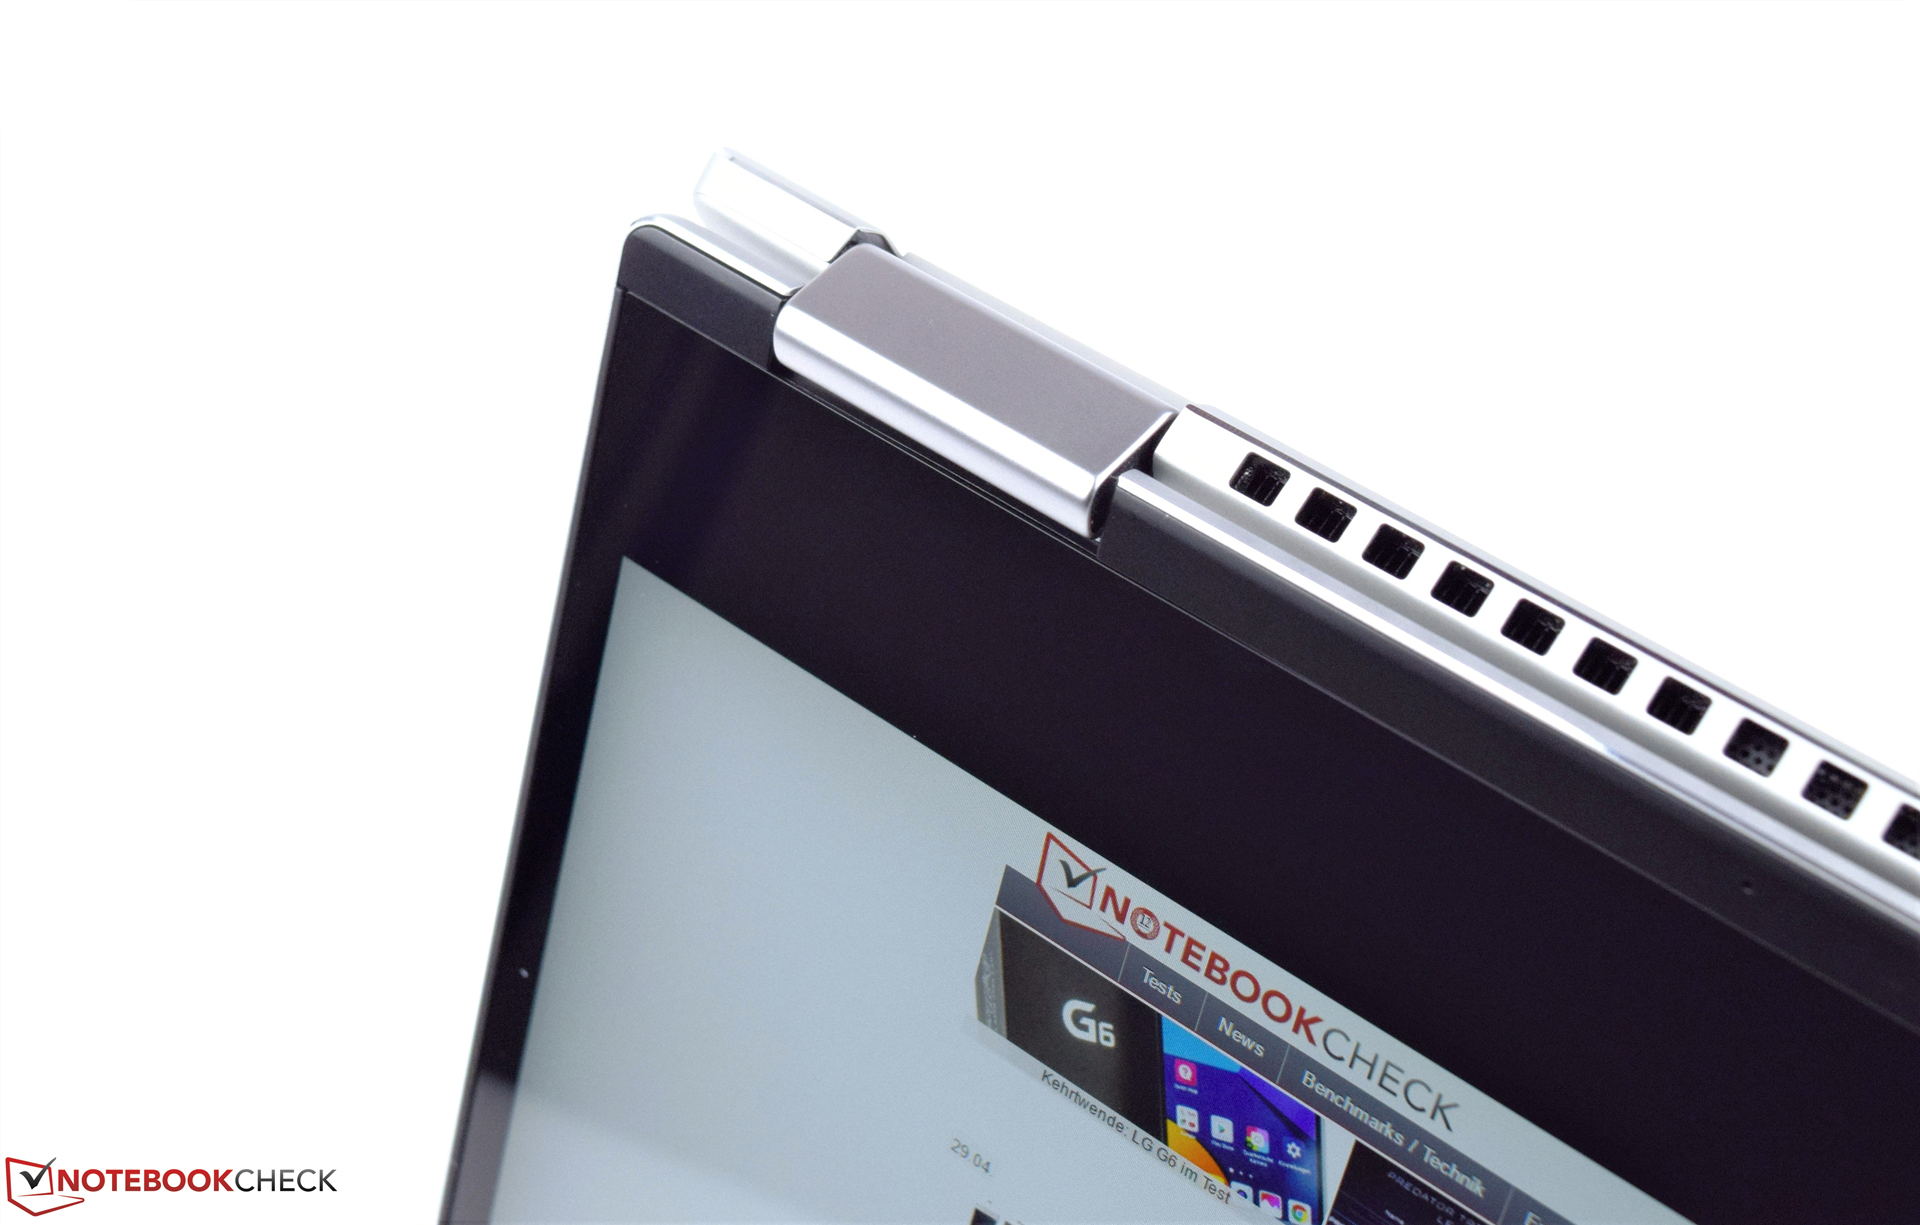
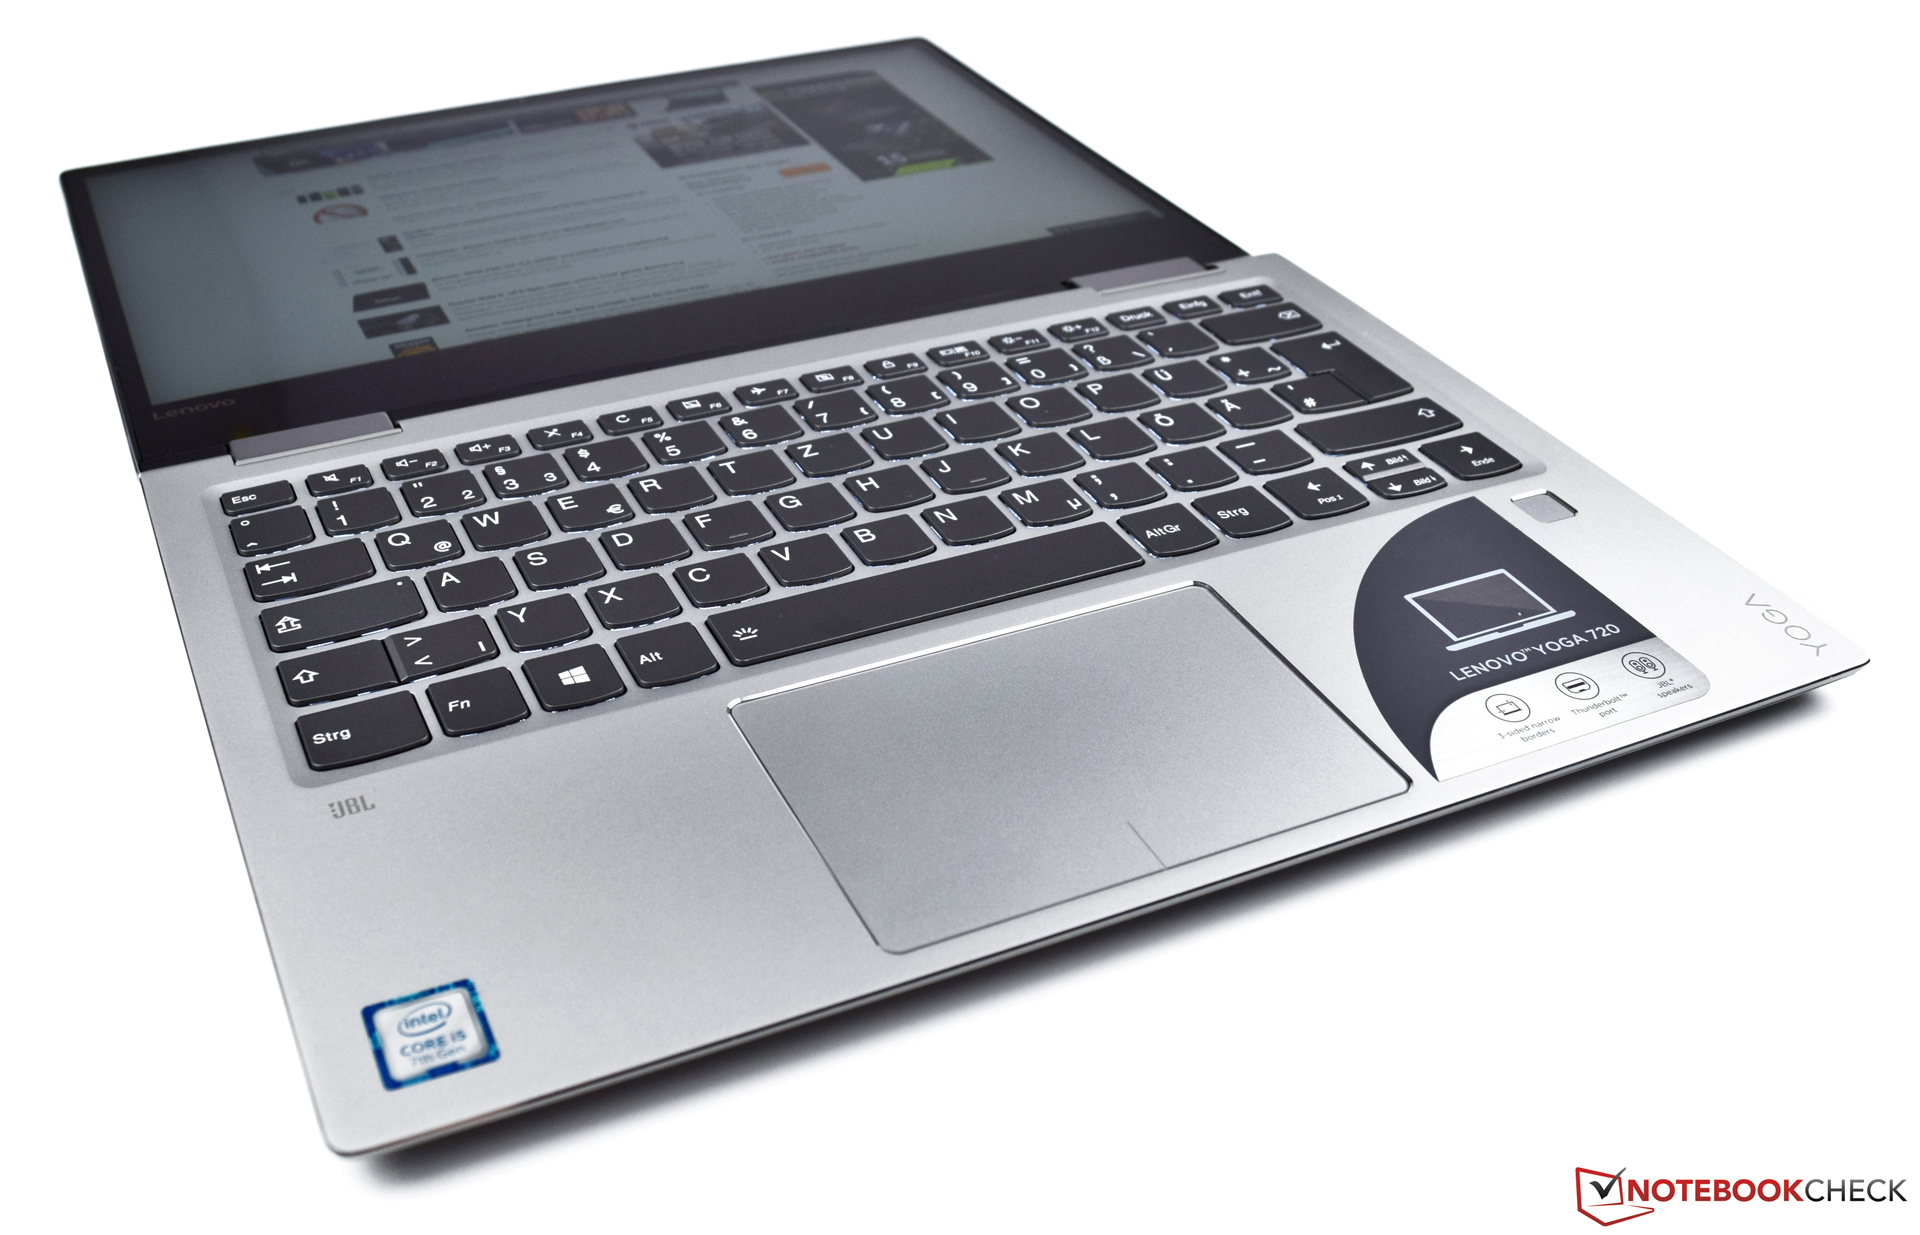
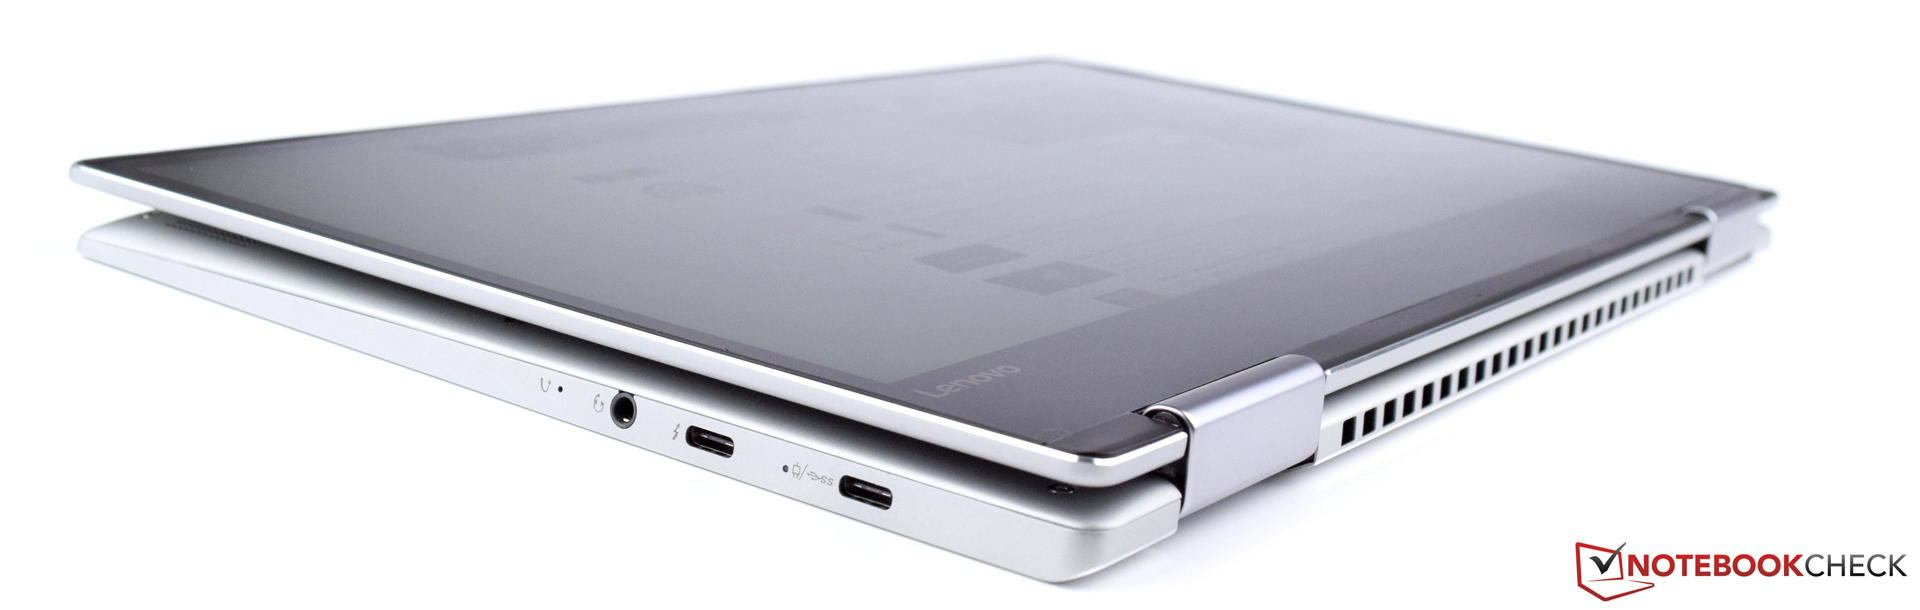
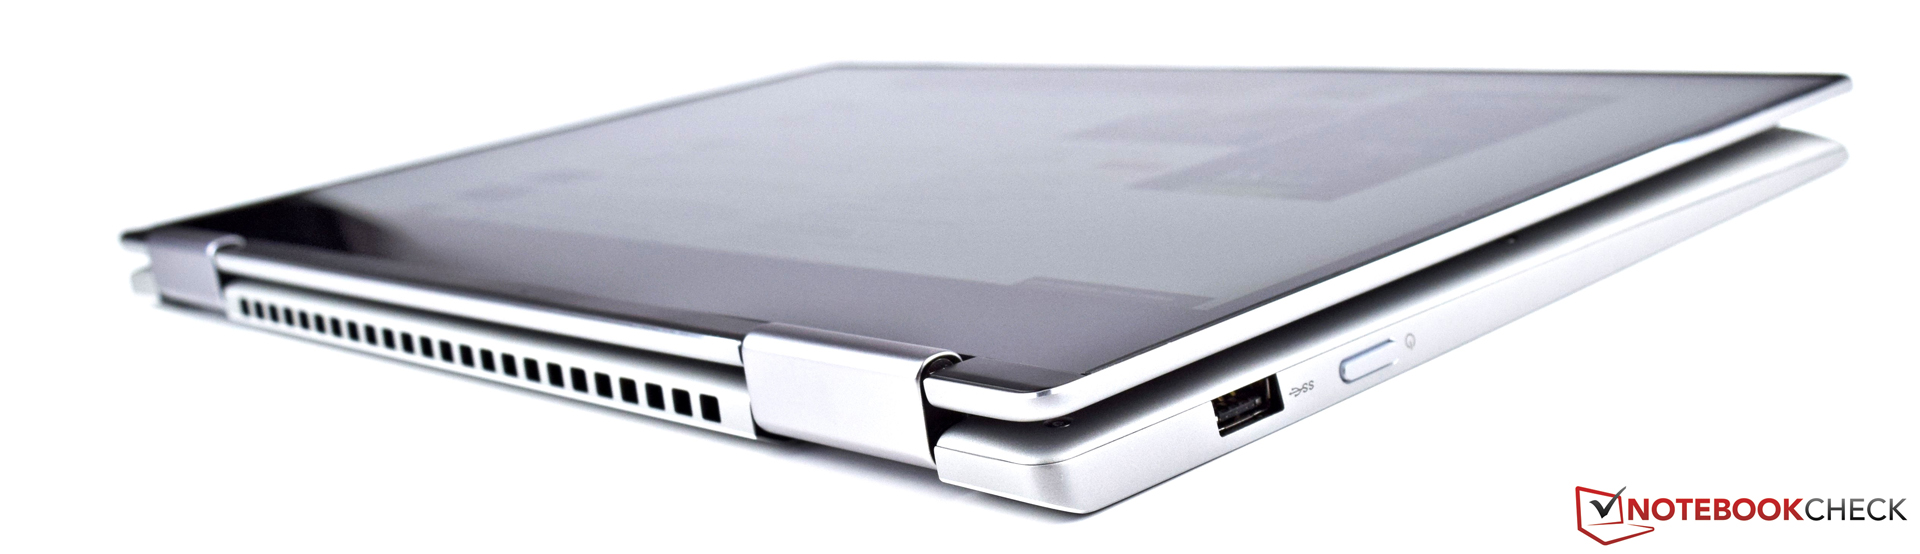
该机采用的永恒的极简主义设计理念——“只做必须”,和材料的选择,赢得了我们的认同。 Yoga 720-13IKB几乎在各方面都做的很好,顺利地通过我们验证和测试。然而,我们还是希望能有不止三个接口。
总的来说,联想Yoga 720-13IKB留下了积极的印象,尽管我们不完全理解SD卡读卡器被遗漏的背后原因。可能是就联想在试图模仿苹果的简约——“少是多”的方法。最终,消费者将决定该妥协是否值得。我们的的测试机提供稳固稳定的表现。我们在使用笔记本电脑时没有遇到任何严重问题。输入设备使用起来让人愉悦。所有的这些,只需要850美元就可以获得,非常实惠。
注:本文是基于完整评测的缩减版本,阅读完整的英文评测,请点击这里。
Lenovo Yoga 720-13IKB
- 05/08/2017 v6 (old)
Sebastian Bade
Price comparison
