华硕 Transformer Book T100HA 变形本简短评测
| |||||||||||||||||||||||||
Brightness Distribution: 85 %
Center on Battery: 480.2 cd/m²
Contrast: 1482:1 (Black: 0.324 cd/m²)
ΔE ColorChecker Calman: 3.45 | ∀{0.5-29.43 Ø4.72}
ΔE Greyscale Calman: 2.67 | ∀{0.09-98 Ø4.97}
84.38% sRGB (Argyll 1.6.3 3D)
47.28% AdobeRGB 1998 (Argyll 1.6.3 3D)
53.3% AdobeRGB 1998 (Argyll 3D)
73% sRGB (Argyll 3D)
52.8% Display P3 (Argyll 3D)
Gamma: 2.34
CCT: 6164 K
| Asus Transformer Book T100HA-C4-GR HD Graphics (Cherry Trail), Z8500, Samsung CGND3R eMMC | Asus T100CHI-B1-BK HD Graphics (Bay Trail), Z3775, 32 GB eMMC Flash | Microsoft Surface 3 HD Graphics (Cherry Trail), Z8700, 128 GB eMMC Flash | Microsoft Surface Pro 3 HD Graphics 4400, 4300U, Hynix HFS128G3MNM | Dell Venue 11 Pro 7140 HD Graphics 5300, 5Y10a, Sandisk X110 M.2 SD6SP1M-128G | |
|---|---|---|---|---|---|
| Display | -12% | 32% | 22% | ||
| Display P3 Coverage (%) | 52.8 | 45.62 -14% | 68.8 30% | 63.6 20% | |
| sRGB Coverage (%) | 73 | 65.7 -10% | 98.7 35% | 88.8 22% | |
| AdobeRGB 1998 Coverage (%) | 53.3 | 47.4 -11% | 70.4 32% | 65.6 23% | |
| Screen | -54% | -2% | -29% | -30% | |
| Brightness middle (cd/m²) | 480.2 | 407.1 -15% | 399 -17% | 355.3 -26% | 386 -20% |
| Brightness (cd/m²) | 455 | 395 -13% | 380 -16% | 338 -26% | 357 -22% |
| Brightness Distribution (%) | 85 | 90 6% | 90 6% | 91 7% | 84 -1% |
| Black Level * (cd/m²) | 0.324 | 0.736 -127% | 0.49 -51% | 0.33 -2% | 0.4 -23% |
| Contrast (:1) | 1482 | 553 -63% | 814 -45% | 1077 -27% | 965 -35% |
| Colorchecker dE 2000 * | 3.45 | 6.11 -77% | 1.66 52% | 4.72 -37% | 3.71 -8% |
| Greyscale dE 2000 * | 2.67 | 6.21 -133% | 2.75 -3% | 6.53 -145% | 5.4 -102% |
| Gamma | 2.34 94% | 1.99 111% | 2.22 99% | 2.17 101% | 2.33 94% |
| CCT | 6164 105% | 6960 93% | 6358 102% | 6707 97% | 6666 98% |
| Color Space (Percent of AdobeRGB 1998) (%) | 47.28 | 43.54 -8% | 64.4 36% | 59.37 26% | |
| Color Space (Percent of sRGB) (%) | 84.38 | 98.8 17% | |||
| Colorchecker dE 2000 max. * | 3.24 | ||||
| Total Average (Program / Settings) | -33% /
-42% | 15% /
6% | -4% /
-15% | -30% /
-30% |
* ... smaller is better

| Cinebench R10 | |
| Shading 64Bit (sort by value) | |
| Asus Transformer Book T100HA-C4-GR | |
| Microsoft Surface Pro 3 | |
| Rendering Multiple CPUs 64Bit (sort by value) | |
| Asus Transformer Book T100HA-C4-GR | |
| Microsoft Surface Pro 3 | |
| Rendering Single CPUs 64Bit (sort by value) | |
| Asus Transformer Book T100HA-C4-GR | |
| Microsoft Surface Pro 3 | |
| Shading 32Bit (sort by value) | |
| Asus Transformer Book T100HA-C4-GR | |
| Asus T100CHI-B1-BK | |
| Microsoft Surface 3 | |
| Microsoft Surface Pro 3 | |
| Rendering Multiple CPUs 32Bit (sort by value) | |
| Asus Transformer Book T100HA-C4-GR | |
| Asus T100CHI-B1-BK | |
| Microsoft Surface 3 | |
| Microsoft Surface Pro 3 | |
| Rendering Single 32Bit (sort by value) | |
| Asus Transformer Book T100HA-C4-GR | |
| Asus T100CHI-B1-BK | |
| Microsoft Surface 3 | |
| Microsoft Surface Pro 3 | |
| Dell Venue 11 Pro 7140 | |
| PCMark 7 Score | 2814 points | |
| PCMark 8 Home Score Accelerated v2 | 1697 points | |
| PCMark 8 Creative Score Accelerated v2 | 1798 points | |
| PCMark 8 Work Score Accelerated v2 | 1372 points | |
Help | ||

| 3DMark 06 Standard Score | 3330 points | |
| 3DMark 11 Performance | 419 points | |
| 3DMark Ice Storm Standard Score | 18603 points | |
| 3DMark Cloud Gate Standard Score | 1905 points | |
| 3DMark Fire Strike Score | 248 points | |
Help | ||
| low | med. | high | ultra | |
|---|---|---|---|---|
| StarCraft 2 (2010) | 64 | 18 | 14 | 7 |
| BioShock Infinite (2013) | 20.46 | 9.82 | 8.42 | 2.59 |
(+) The maximum temperature on the upper side is 35.2 °C / 95 F, compared to the average of 35.4 °C / 96 F, ranging from 19.6 to 60 °C for the class Convertible.
(+) The bottom heats up to a maximum of 33.4 °C / 92 F, compared to the average of 36.9 °C / 98 F
(+) In idle usage, the average temperature for the upper side is 25.7 °C / 78 F, compared to the device average of 30.3 °C / 87 F.
(+) The palmrests and touchpad are cooler than skin temperature with a maximum of 29.6 °C / 85.3 F and are therefore cool to the touch.
(±) The average temperature of the palmrest area of similar devices was 28 °C / 82.4 F (-1.6 °C / -2.9 F).
| Asus Transformer Book T100HA-C4-GR HD Graphics (Cherry Trail), Z8500, Samsung CGND3R eMMC | Asus T100CHI-B1-BK HD Graphics (Bay Trail), Z3775, 32 GB eMMC Flash | Microsoft Surface 3 HD Graphics (Cherry Trail), Z8700, 128 GB eMMC Flash | Microsoft Surface Pro 3 HD Graphics 4400, 4300U, Hynix HFS128G3MNM | Dell Venue 11 Pro 7140 HD Graphics 5300, 5Y10a, Sandisk X110 M.2 SD6SP1M-128G | |
|---|---|---|---|---|---|
| Heat | -13% | -21% | -32% | -28% | |
| Maximum Upper Side * (°C) | 35.2 | 40.2 -14% | 39.9 -13% | 45.2 -28% | 46.3 -32% |
| Maximum Bottom * (°C) | 33.4 | 39.8 -19% | 41.9 -25% | 46.4 -39% | 47 -41% |
| Idle Upper Side * (°C) | 27.6 | 30.4 -10% | 33.9 -23% | 35.2 -28% | 30.6 -11% |
| Idle Bottom * (°C) | 25.8 | 28.4 -10% | 31.2 -21% | 34.4 -33% | 33.3 -29% |
* ... smaller is better
| Asus Transformer Book T100HA-C4-GR HD Graphics (Cherry Trail), Z8500, Samsung CGND3R eMMC | Asus T100CHI-B1-BK HD Graphics (Bay Trail), Z3775, 32 GB eMMC Flash | Microsoft Surface 3 HD Graphics (Cherry Trail), Z8700, 128 GB eMMC Flash | Microsoft Surface Pro 3 HD Graphics 4400, 4300U, Hynix HFS128G3MNM | Dell Venue 11 Pro 7140 HD Graphics 5300, 5Y10a, Sandisk X110 M.2 SD6SP1M-128G | |
|---|---|---|---|---|---|
| Battery runtime | -12% | -30% | -37% | -24% | |
| Reader / Idle (h) | 24.3 | 14.6 -40% | 13.8 -43% | 18.3 -25% | 13 -47% |
| WiFi v1.3 (h) | 9 | 9.8 9% | 7.3 -19% | ||
| Load (h) | 4.1 | 3.9 -5% | 2.9 -29% | 2.1 -49% | 4.1 0% |
| WiFi (h) | 7.1 | 8.4 | 9.4 |
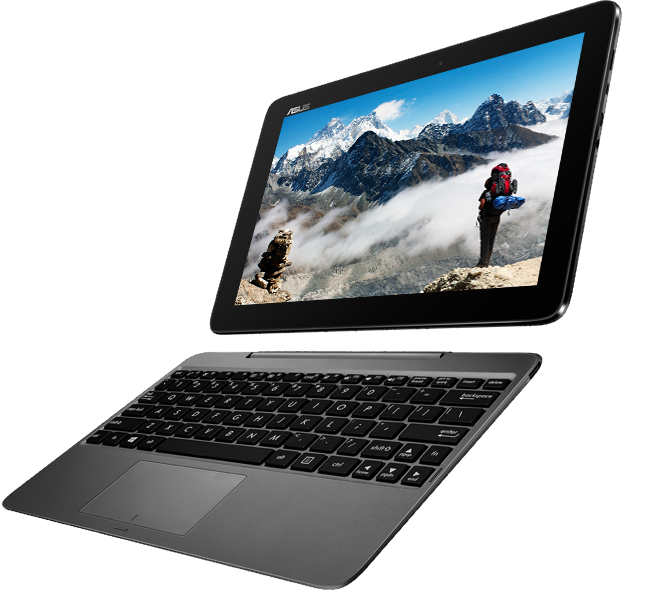
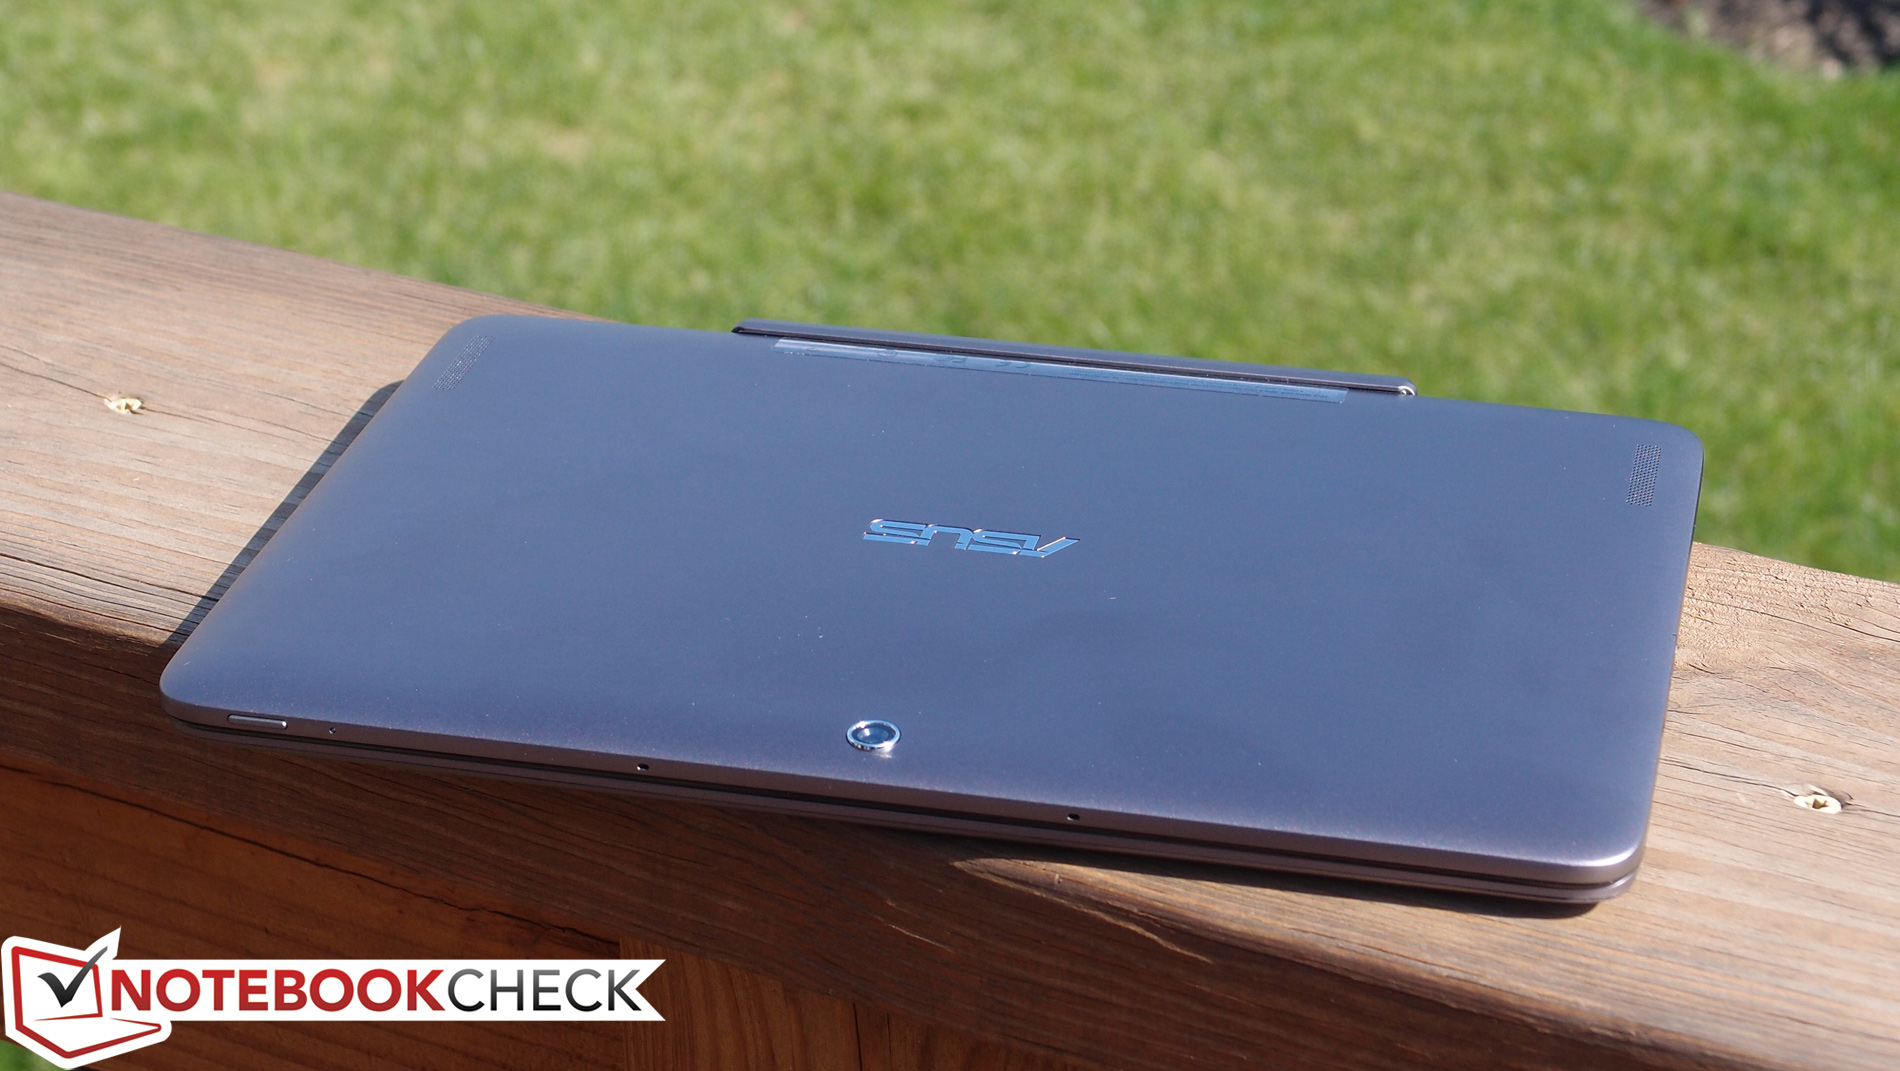
六个月之前,我们对华硕T100 Chi 的评测证明了它是在低价市场中一款不错的变形本产品,仅存在很少的一些问题。例如,键盘底座和平板需要分别充电,内存过小,eMMC闪存容量小且速度慢,缺少维护空间,拥挤的键盘和屏幕的较差色彩还原。现在T100HA几乎解决了所有这些问题,而售价降低达100美元——这是让人非常惊喜的一个开始。
华硕为我们带来了另外一款299美元Windows变形本,优秀的设计让它足以带给Chromebook一拳重击。
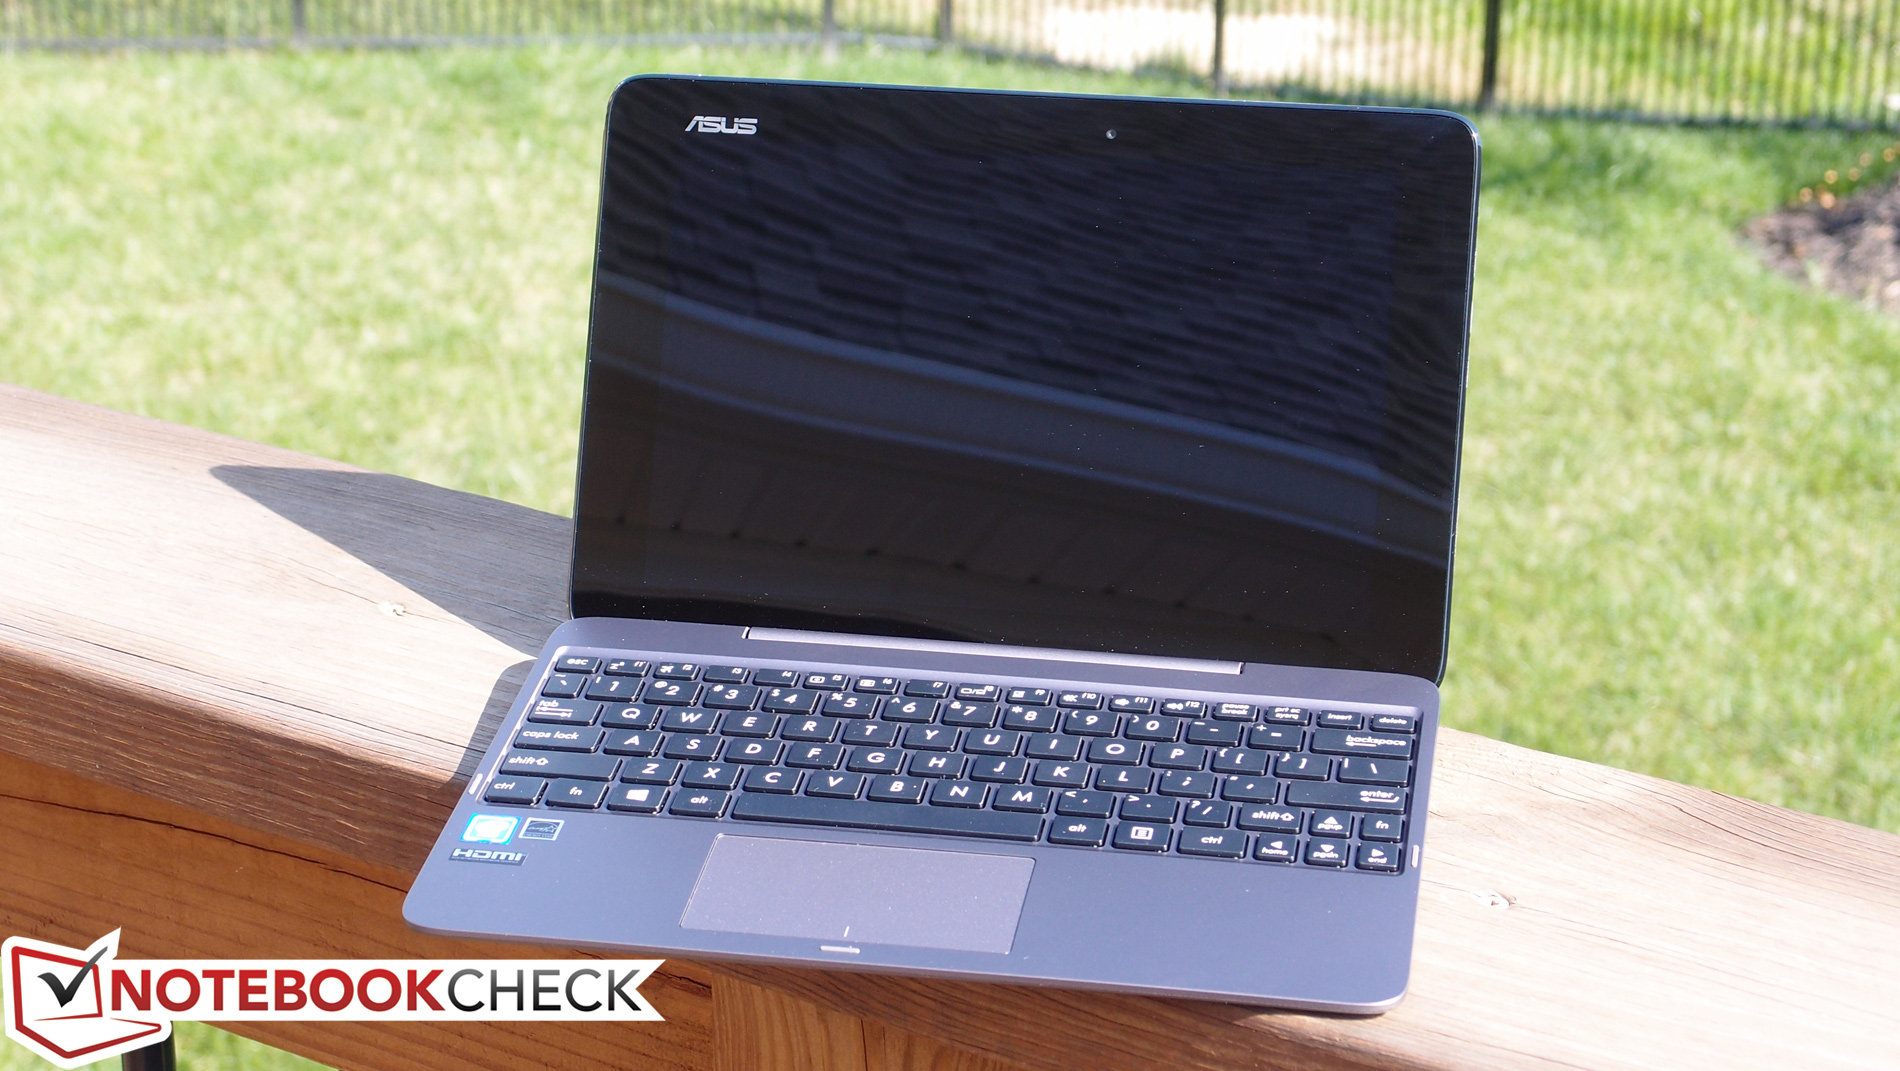
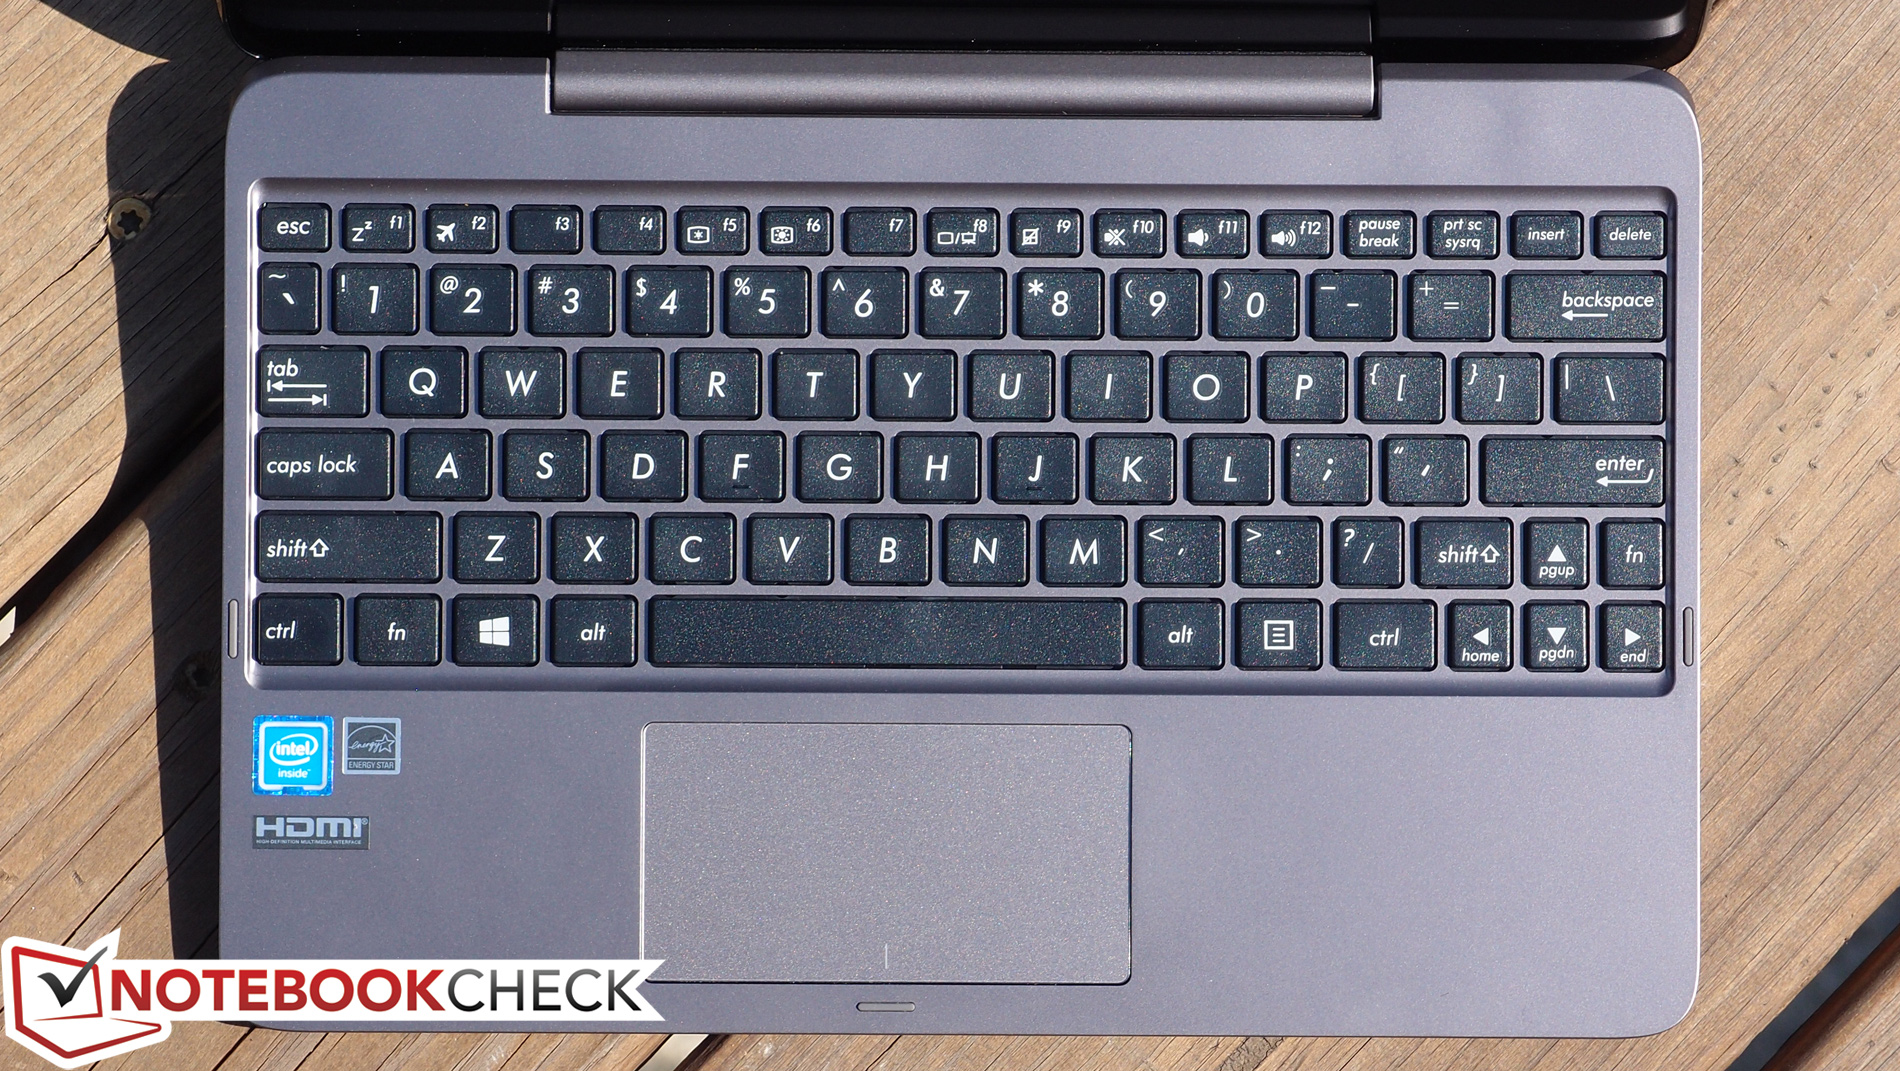
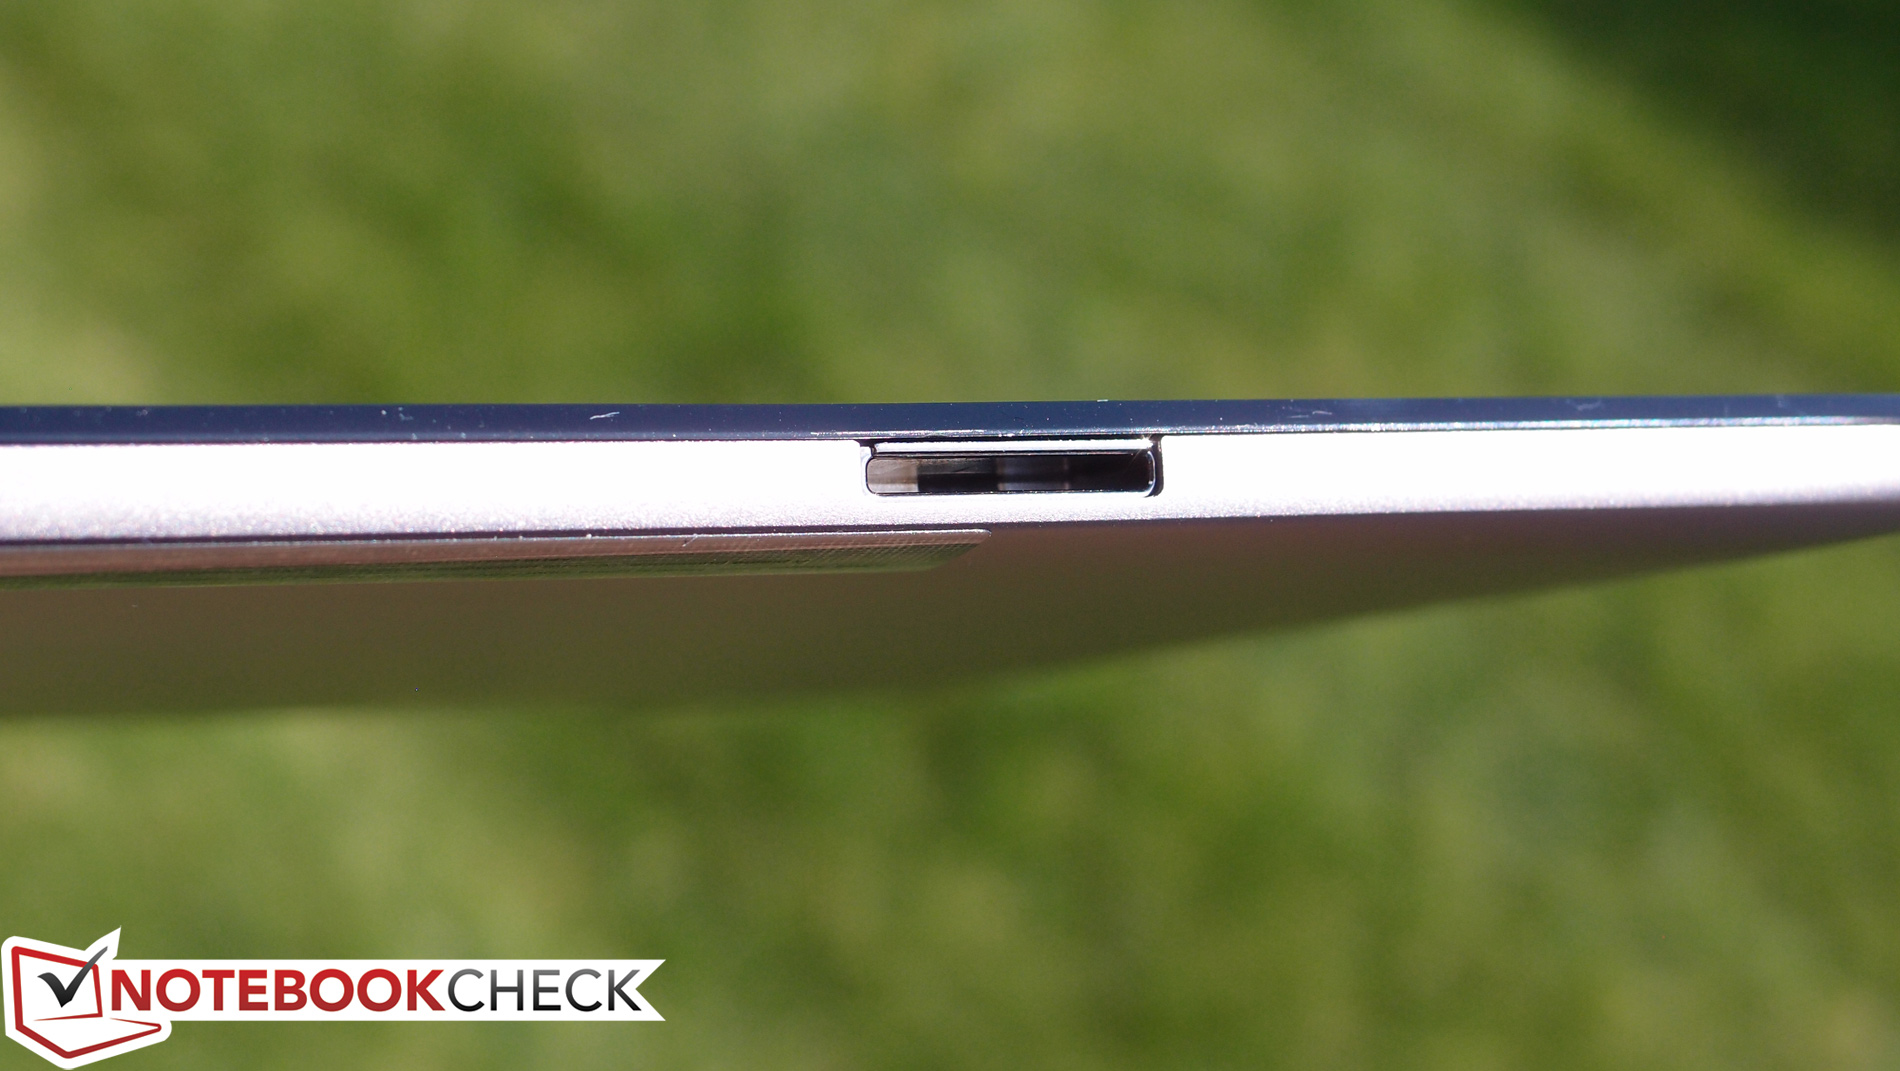
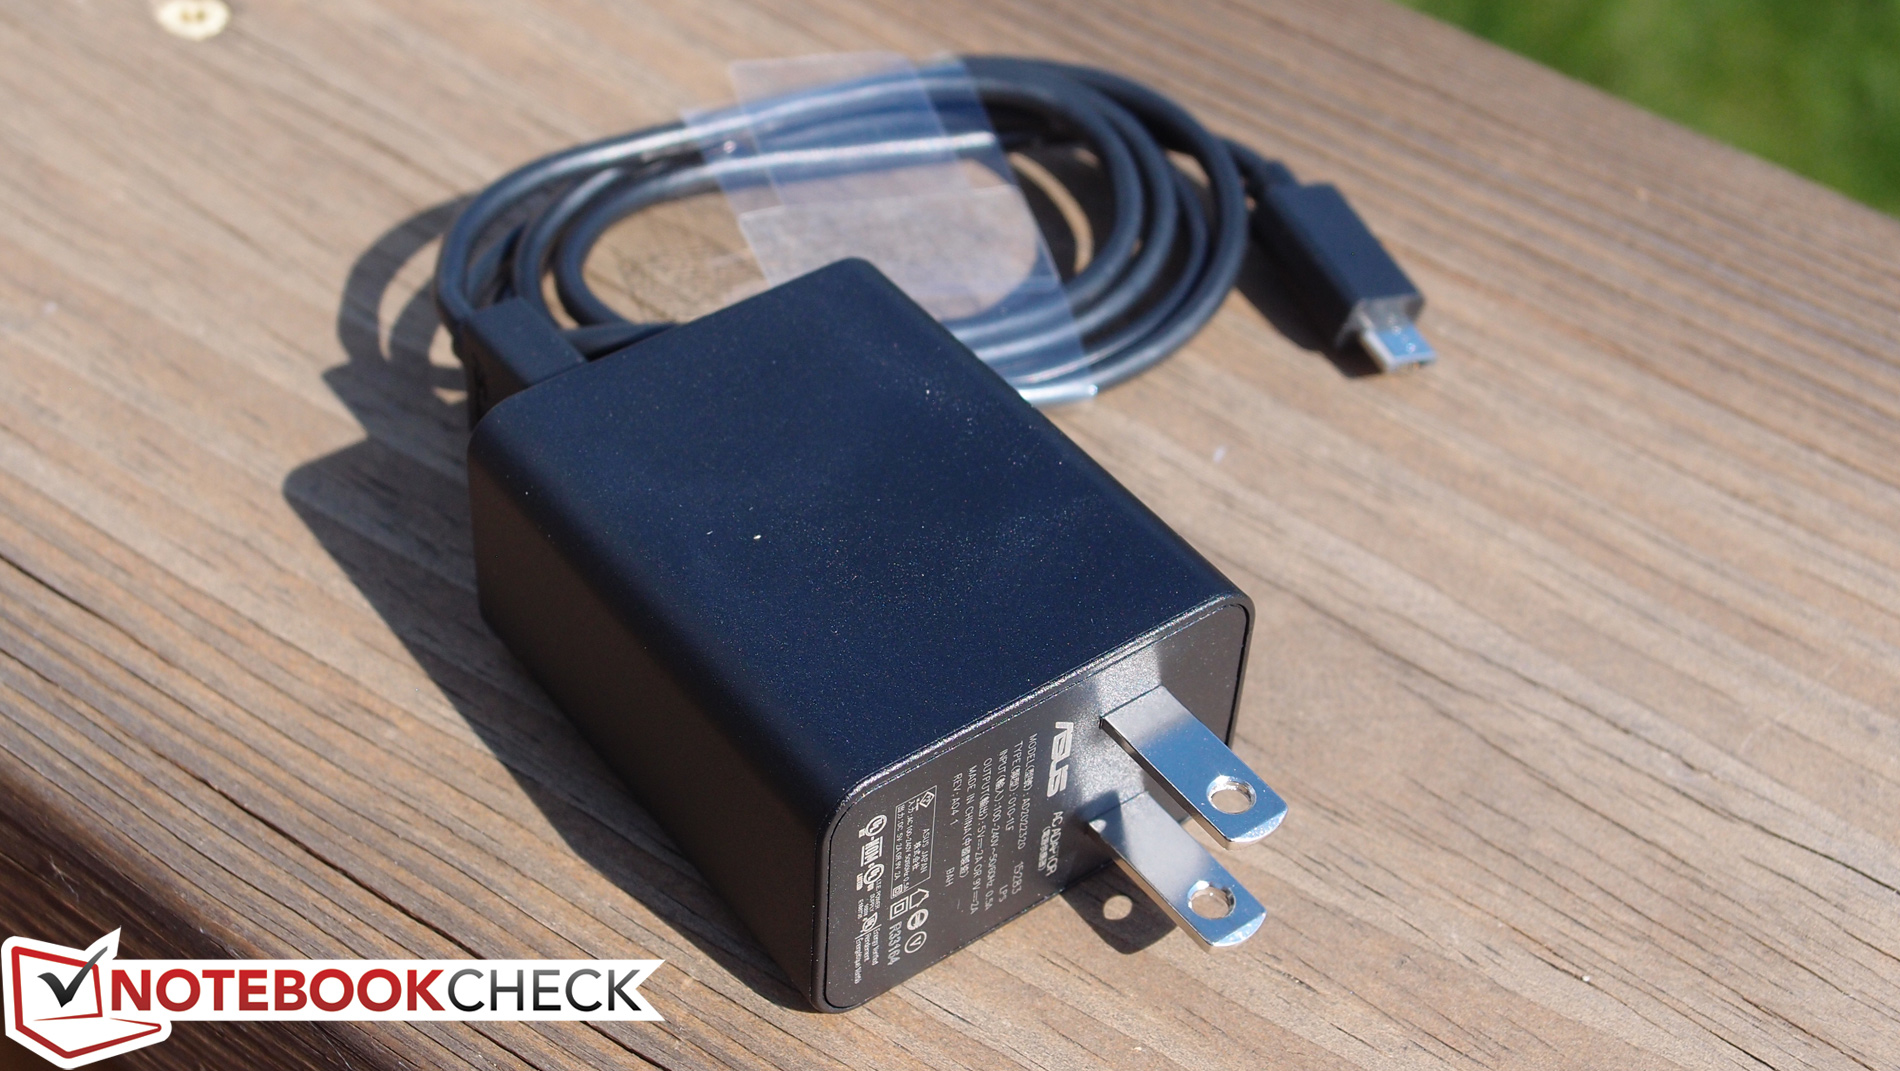
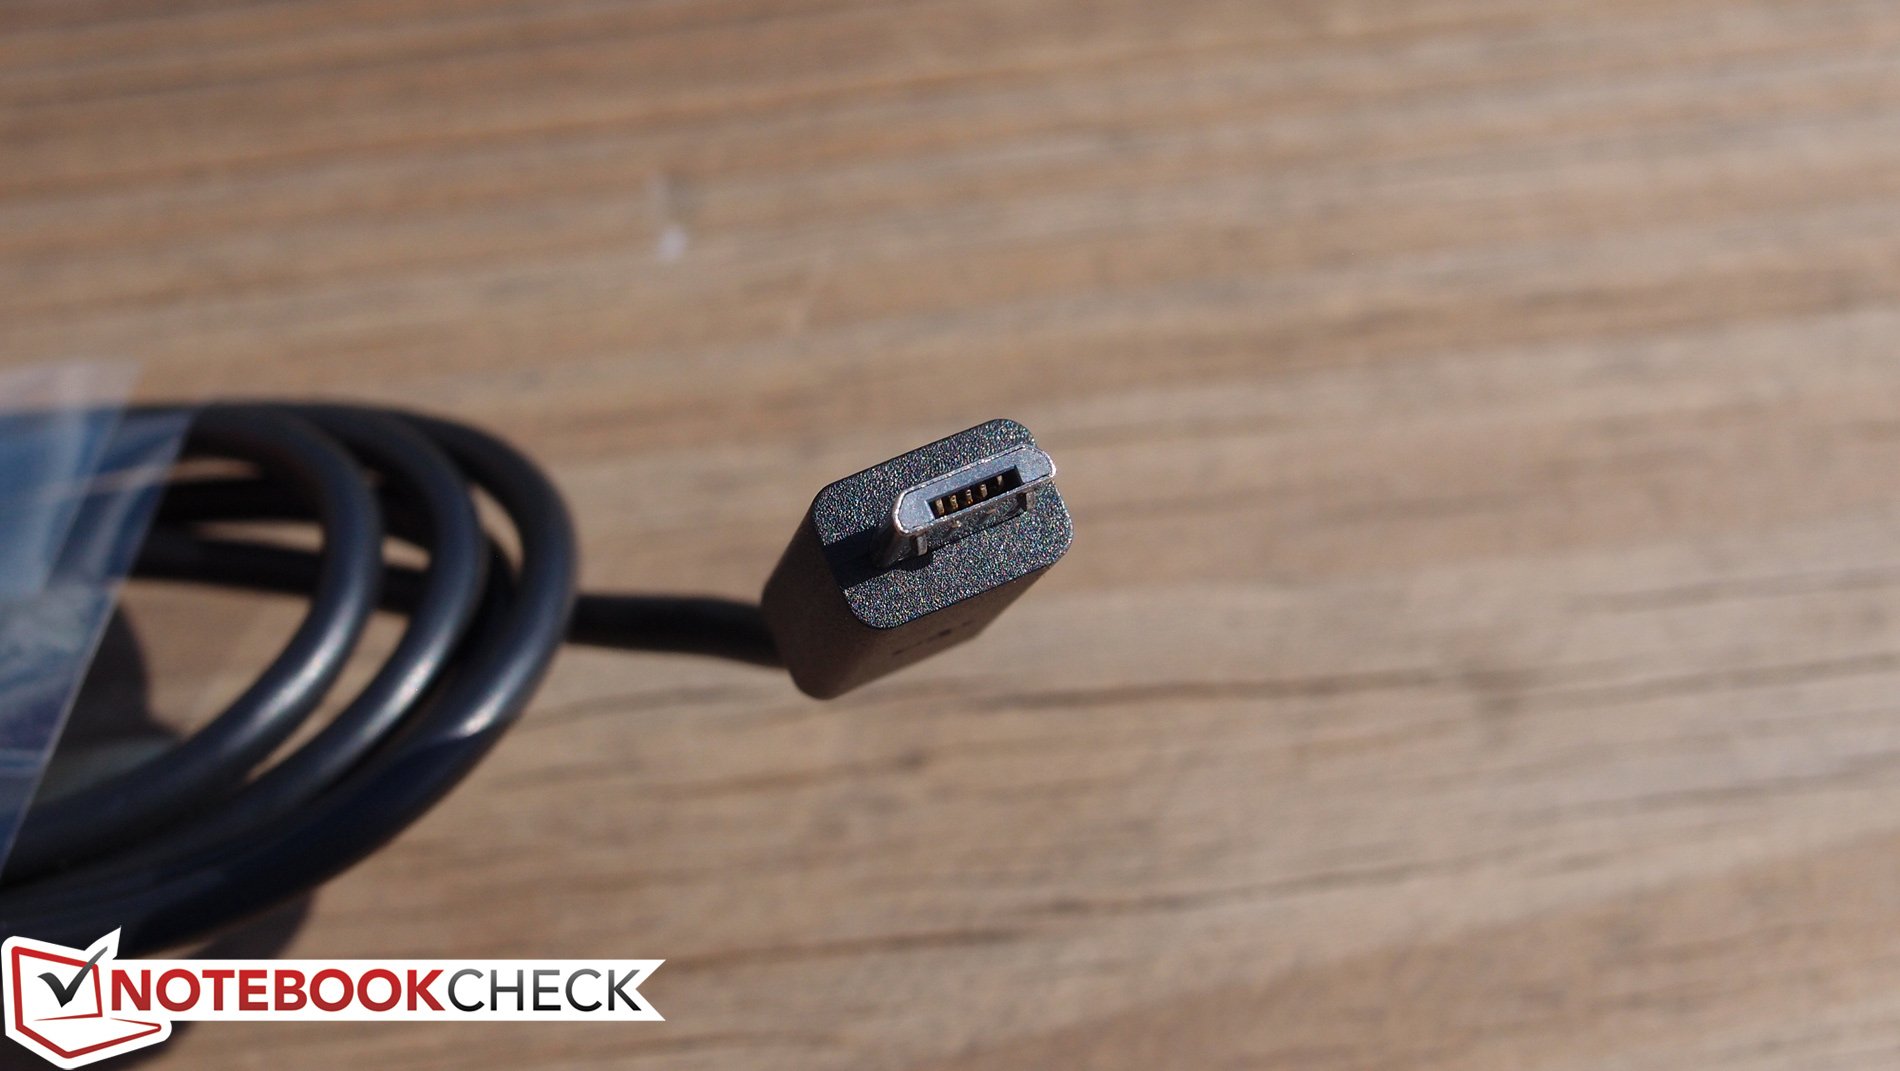
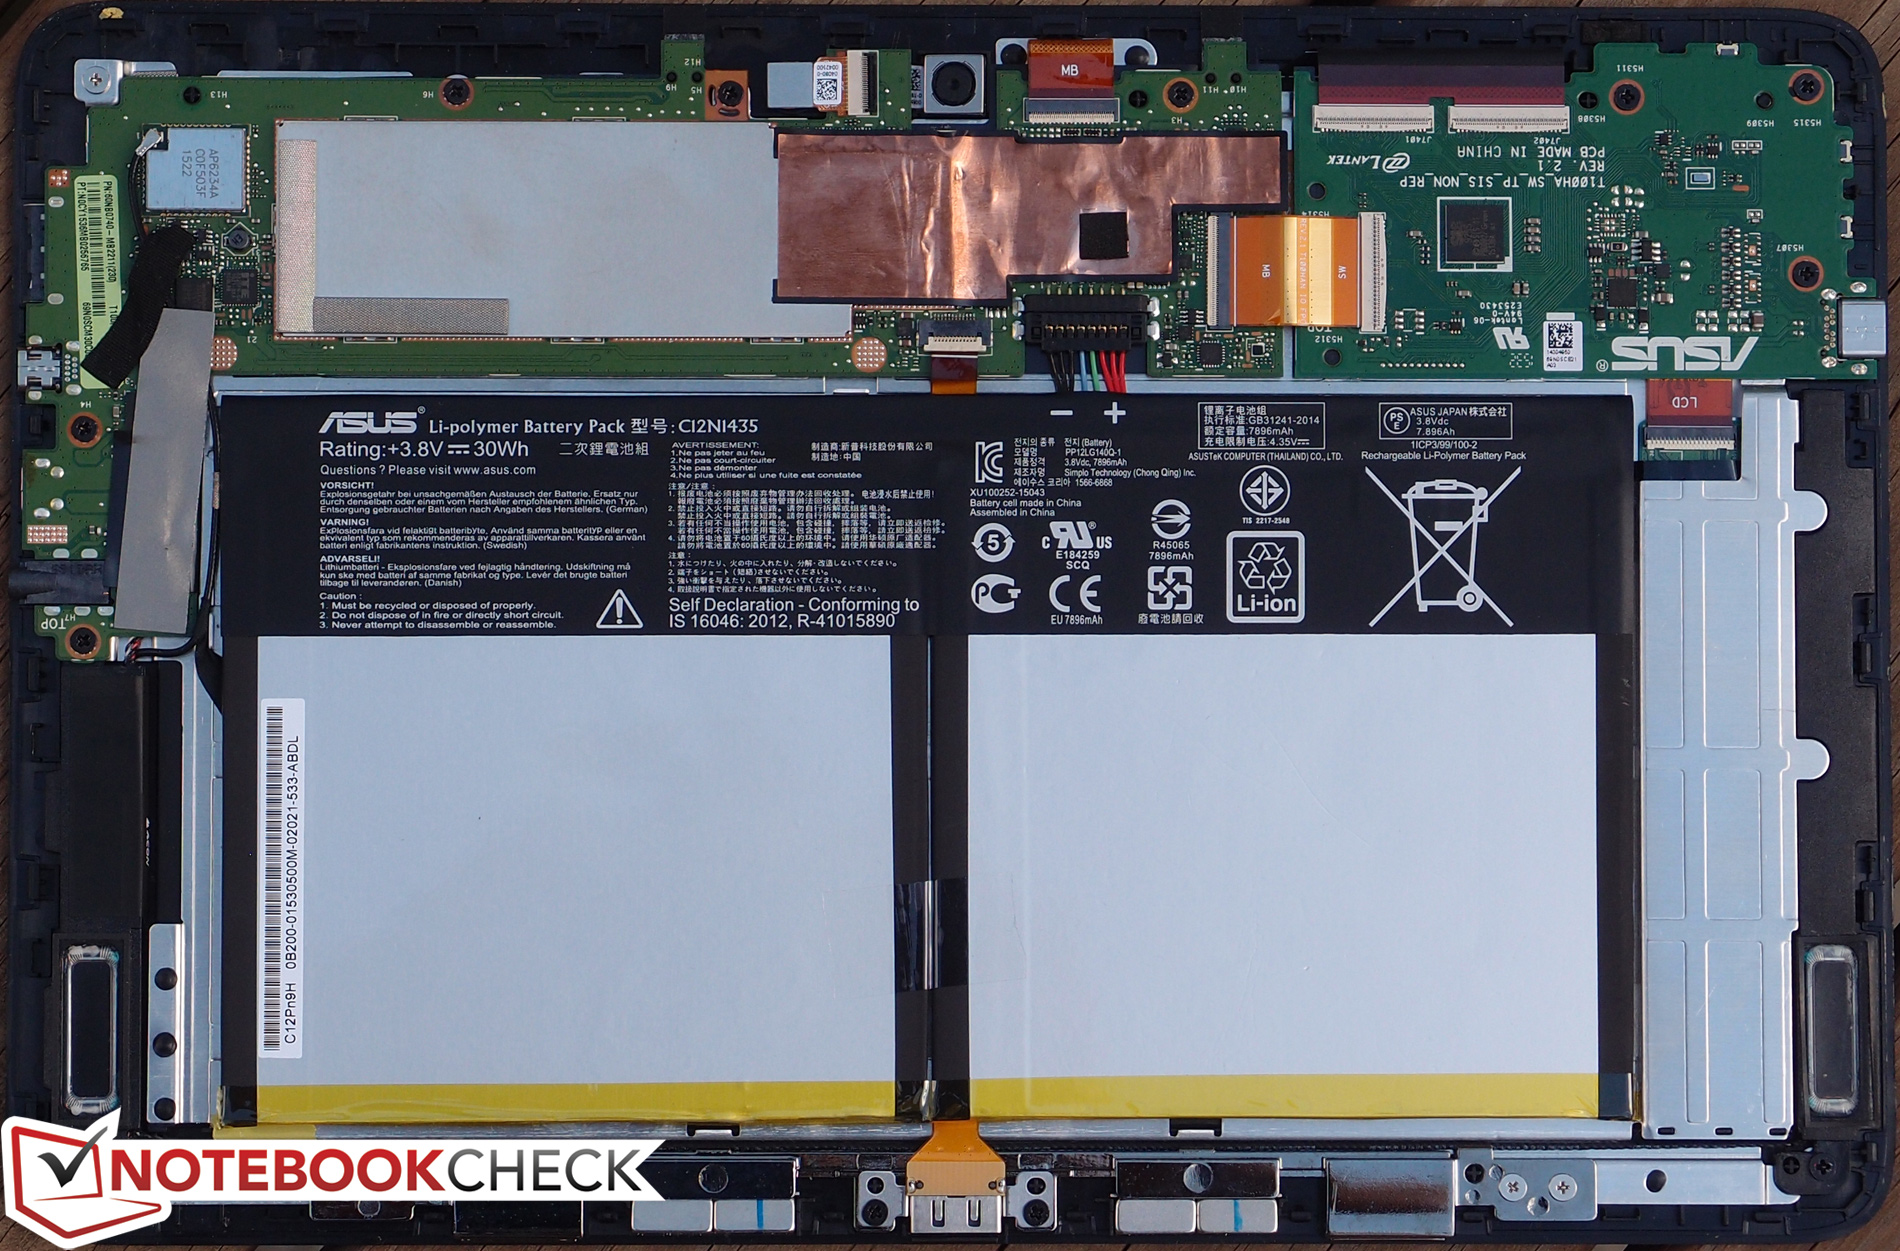
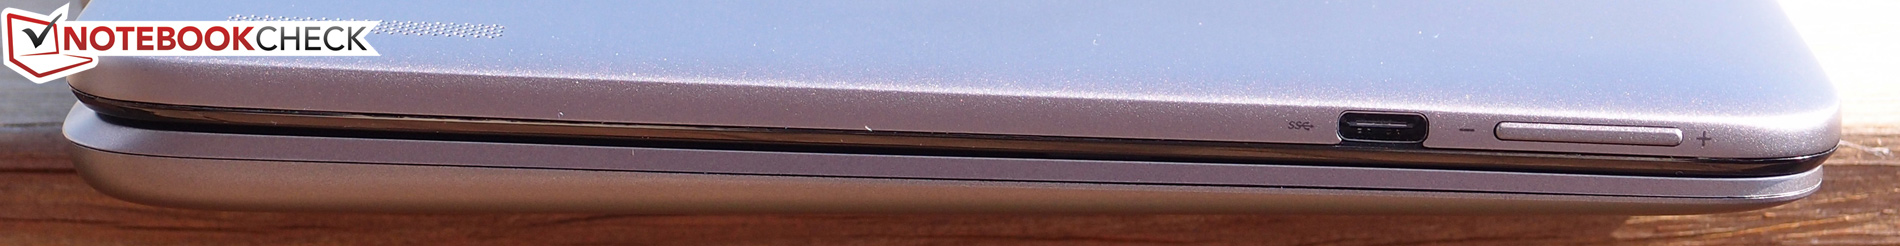
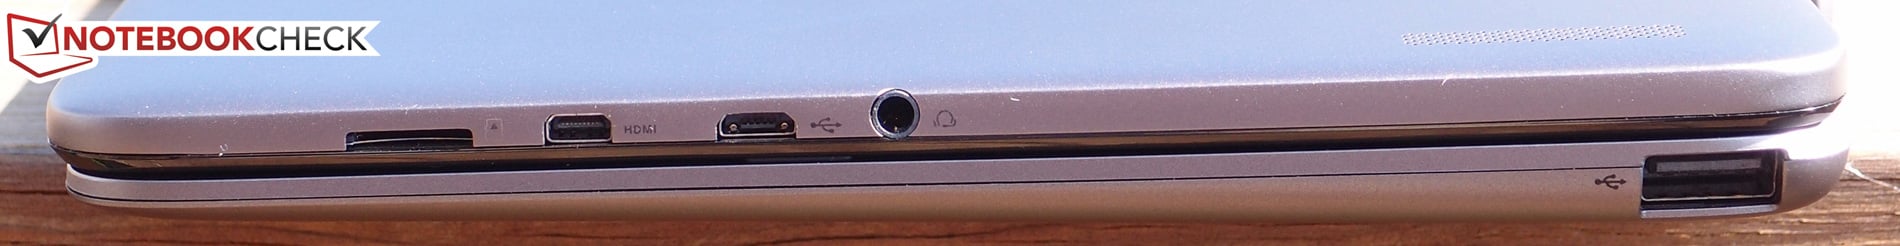
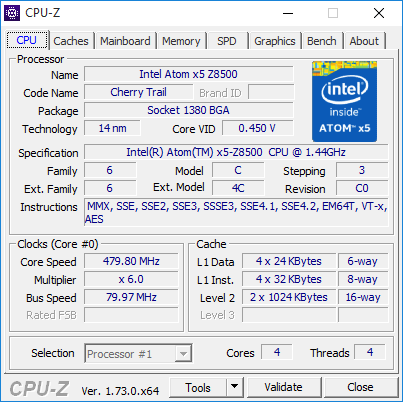
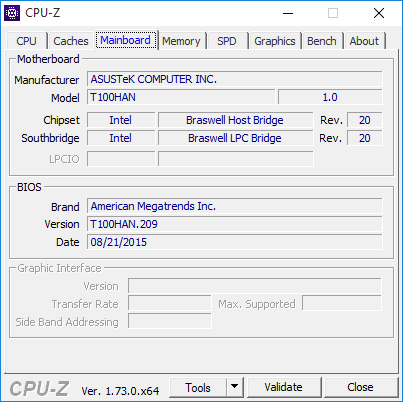
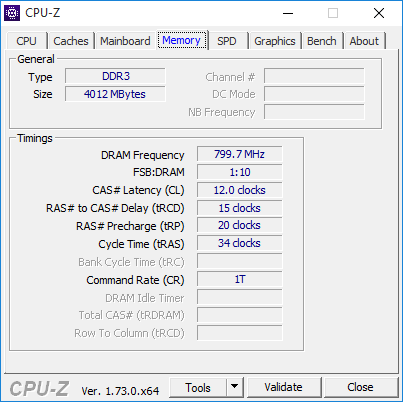
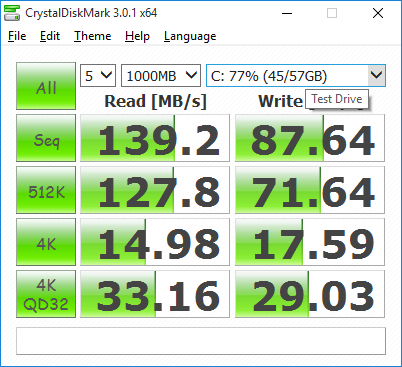
它的键盘底座和平板部分现在通过物理数据交换接口连接(因此底座不需要单独充电且不存在启动延迟)。我们的测试机配备了4 GB的内存,和速度更高(约40%-50%)的64 GB eMMC闪存。现在液晶屏幕也覆盖了近84%的sRGB色域,同时相比T100 Chi在出厂状态时更加准确。它的接口配置也有所改进,现在采用了一个USB 3.1 C型接口,底座提供了一个全尺寸USB 2.0接口(而非前代产品底座的micro-USB接口)。
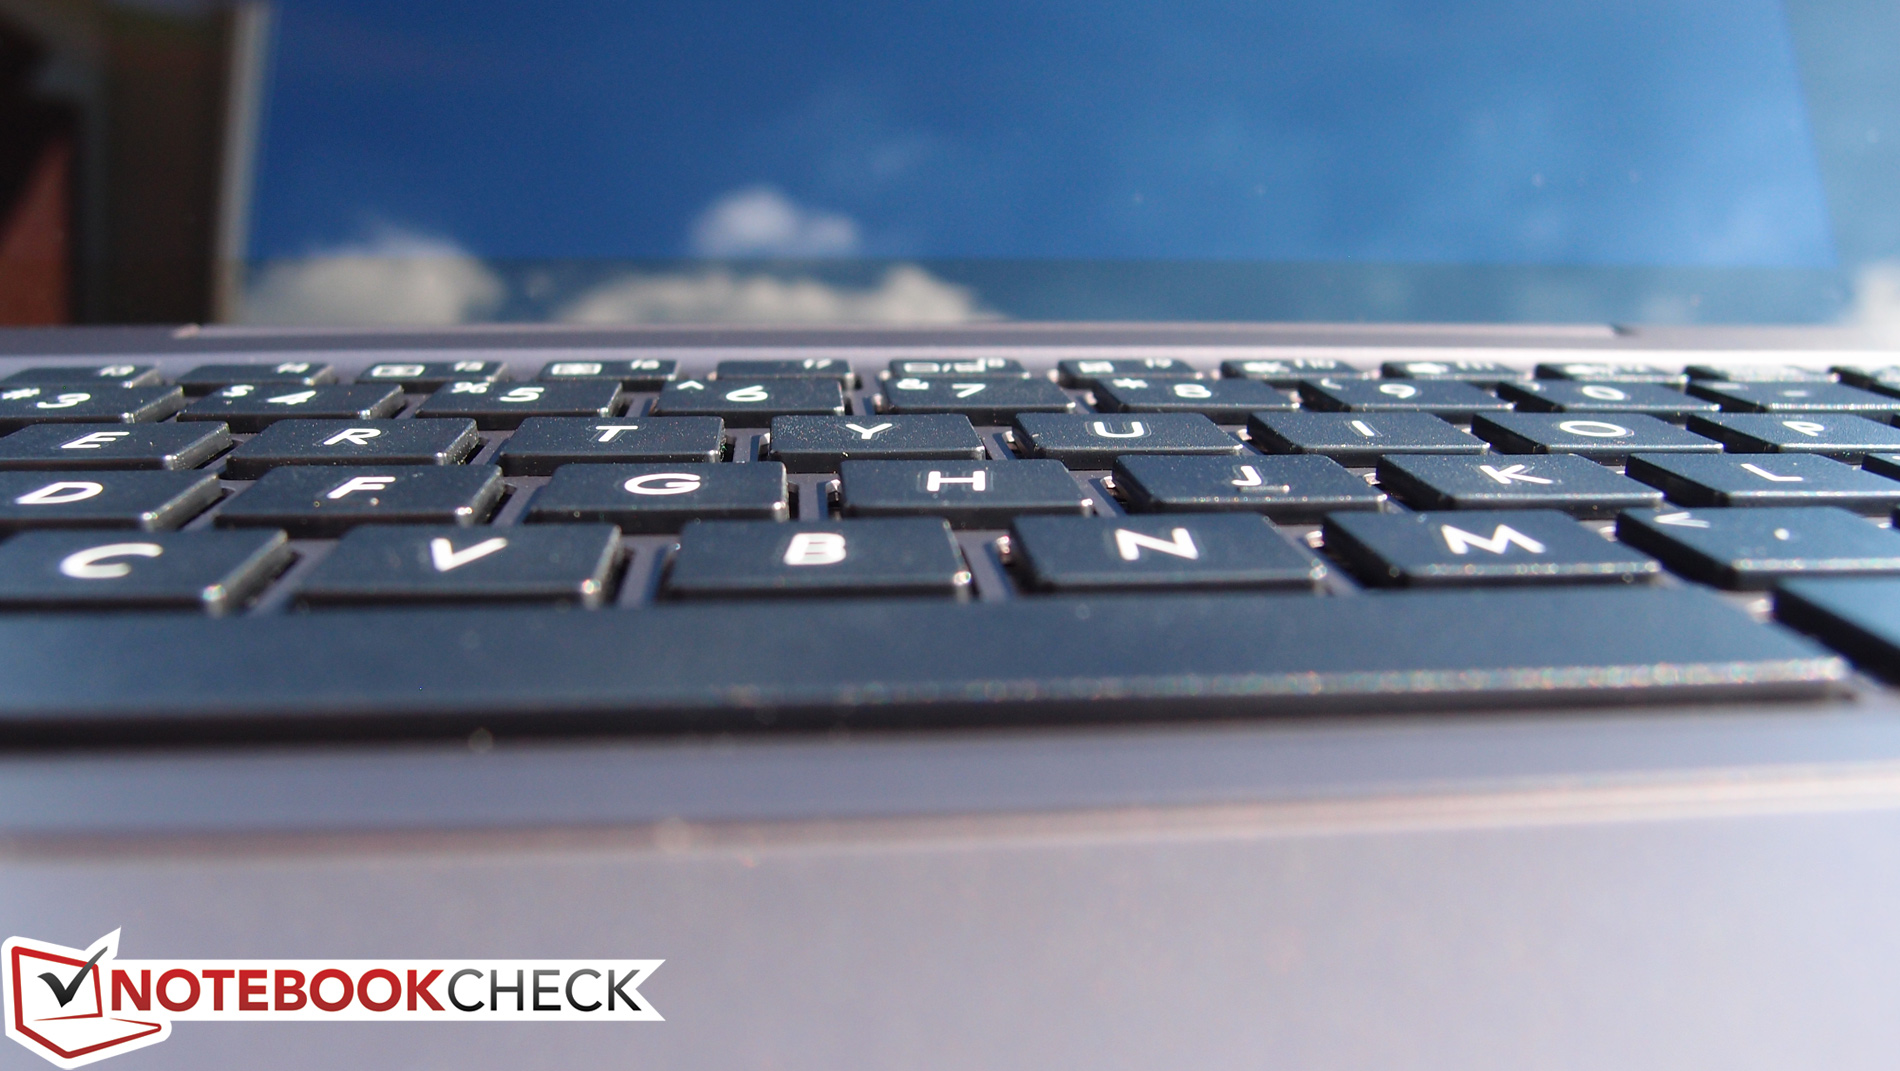
不过当然故事还没有结束。尽管T100HA相比前代产品有了显著的改进,在一些方面它也有了退步。特别是,它的屏幕分辨率从1900x1200降低到了仅仅1280x800,这在平板电脑中只能算低端水平。另外,它的扬声器相比之前也更加单薄孱弱,是最近测试过设备中最弱的之一。最后,可能也是最致命的是,它的键盘让人感觉更脆弱了(只要稍稍用力就会弯曲),在打字时会有咚咚的声音。上一代的T100 Chi键盘相比之下更佳易用,在这方面它让人十分失望。
不过我们也需要意识到:它是一款售价仅299美元的设备——在这个价位上,它的整体表现仍然让人惊艳。当然,你可以选择Microsoft Surface 3 ,它在例如工艺品质,屏幕,和处理器等方面都更加优秀,但售价也高出了200美元——甚至相比之下T100HA也有胜场,例如接口数量。它可以算是话说为我们带来的又一款重量级产品,会给正在考虑Chromebook的用户带来又一个新的选择。
注:本文是基于完整评测的缩减版本,阅读完整的英文评测,请点击这里。
Asus Transformer Book T100HA-C4-GR
- 10/15/2015 v4 (old)
Steve Schardein
Price comparison
