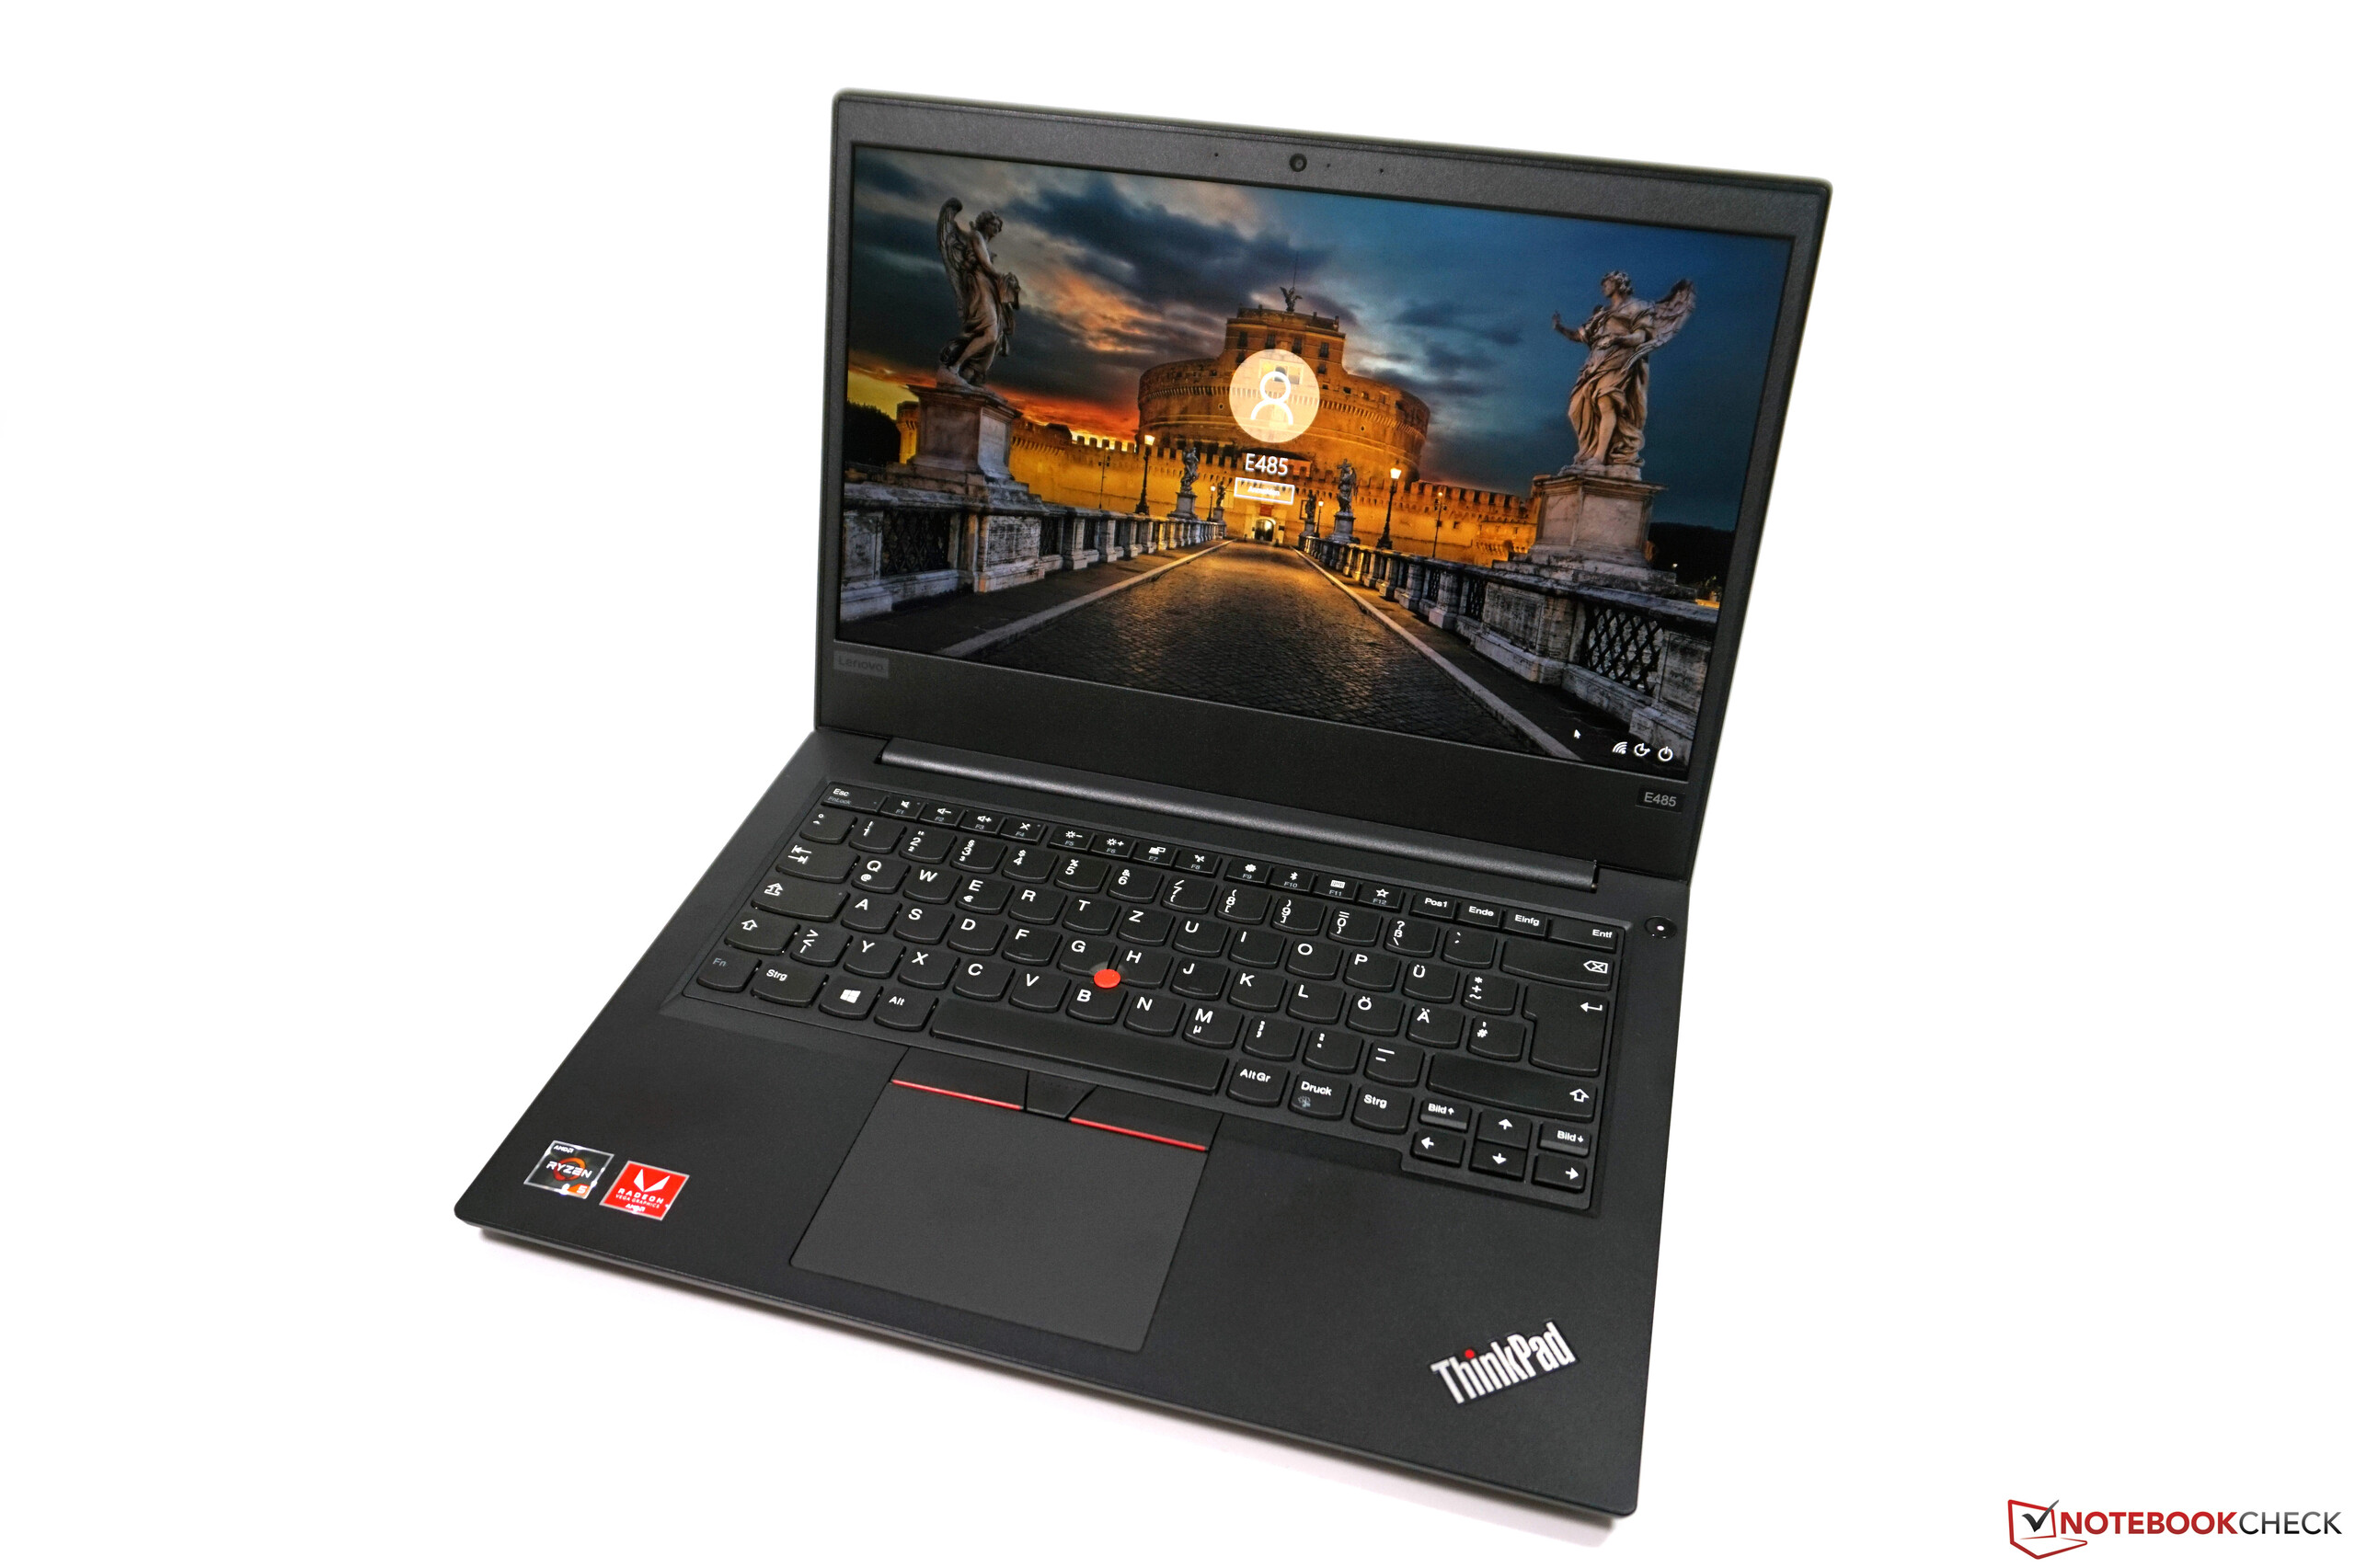
联想ThinkPad E485 (Ryzen 5, Vega 8) 笔记本电脑评测
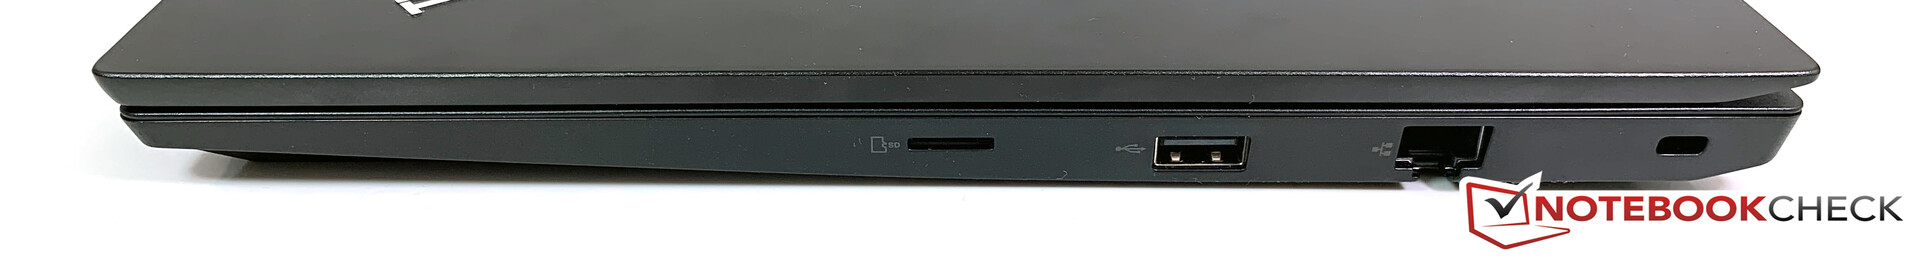
| SD Card Reader | |
| average JPG Copy Test (av. of 3 runs) | |
| HP ProBook 440 G6-5TK01EA (Toshiba Exceria Pro SDXC 64 GB UHS-II) | |
| Lenovo ThinkPad E480-20KNCTO1WW (Toshiba Exceria Pro M501) | |
| Lenovo ThinkPad E485-20KU000NGE (Toshiba Exceria Pro M501) | |
| HP ProBook 645 G4 3UP62EA (Toshiba Exceria Pro M501 microSDXC 64GB) | |
| Average of class Office (19.8 - 198.5, n=21, last 2 years) | |
| Dell Latitude 3490 (Toshiba Exceria Pro SDXC 64 GB UHS-II) | |
| maximum AS SSD Seq Read Test (1GB) | |
| Lenovo ThinkPad E480-20KNCTO1WW (Toshiba Exceria Pro M501) | |
| HP ProBook 645 G4 3UP62EA (Toshiba Exceria Pro M501 microSDXC 64GB) | |
| Lenovo ThinkPad E485-20KU000NGE (Toshiba Exceria Pro M501) | |
| HP ProBook 440 G6-5TK01EA (Toshiba Exceria Pro SDXC 64 GB UHS-II) | |
| Average of class Office (27.4 - 249, n=20, last 2 years) | |
| Dell Latitude 3490 (Toshiba Exceria Pro SDXC 64 GB UHS-II) | |
| Networking | |
| iperf3 transmit AX12 | |
| HP ProBook 440 G6-5TK01EA | |
| HP ProBook 645 G4 3UP62EA | |
| Dell Latitude 3490 | |
| Lenovo ThinkPad E485-20KU000NGE | |
| Lenovo ThinkPad E480-20KNCTO1WW | |
| iperf3 receive AX12 | |
| HP ProBook 645 G4 3UP62EA | |
| HP ProBook 440 G6-5TK01EA | |
| Dell Latitude 3490 | |
| Lenovo ThinkPad E480-20KNCTO1WW | |
| Lenovo ThinkPad E485-20KU000NGE | |
| |||||||||||||||||||||||||
Brightness Distribution: 87 %
Center on Battery: 289 cd/m²
Contrast: 1521:1 (Black: 0.19 cd/m²)
ΔE ColorChecker Calman: 5.6 | ∀{0.5-29.43 Ø4.72}
calibrated: 4.7
ΔE Greyscale Calman: 2.7 | ∀{0.09-98 Ø4.97}
58.5% sRGB (Argyll 1.6.3 3D)
37.2% AdobeRGB 1998 (Argyll 1.6.3 3D)
39.76% AdobeRGB 1998 (Argyll 3D)
57.9% sRGB (Argyll 3D)
38.48% Display P3 (Argyll 3D)
Gamma: 1.96
CCT: 6506 K
| Lenovo ThinkPad E485-20KU000NGE B140HAN04.2, , 1920x1080, 14" | Lenovo ThinkPad E480-20KNCTO1WW Innolux N140HCA-EAC, , 1920x1080, 14" | HP ProBook 645 G4 3UP62EA Innolux N140HCA-EAB, , 1920x1080, 14" | Dell Latitude 3490 LP140WF6 / LGD059D, , 1920x1080, 14" | HP ProBook 440 G6-5TK01EA LG Philips, LGD05F1, , 1920x1080, 14" | |
|---|---|---|---|---|---|
| Display | 6% | 4% | 2% | -3% | |
| Display P3 Coverage (%) | 39.21 38.48 | 41.56 6% | 40.67 4% | 39.81 2% | 38.08 -3% |
| sRGB Coverage (%) | 58.8 57.9 | 62.2 6% | 61.2 4% | 59.6 1% | 57.2 -3% |
| AdobeRGB 1998 Coverage (%) | 40.52 39.76 | 42.96 6% | 42.03 4% | 41.16 2% | 39.37 -3% |
| Response Times | 4% | 25% | 24% | 13% | |
| Response Time Grey 50% / Grey 80% * (ms) | 44.8 ? | 44.8 ? -0% | 33 ? 26% | 36.4 ? 19% | 41.6 ? 7% |
| Response Time Black / White * (ms) | 33.6 ? | 31.2 ? 7% | 26 ? 23% | 24 ? 29% | 27.2 ? 19% |
| PWM Frequency (Hz) | 25000 ? | 100 ? | |||
| Screen | -20% | -27% | -12% | -12% | |
| Brightness middle (cd/m²) | 289 | 262 -9% | 225 -22% | 250 -13% | 256 -11% |
| Brightness (cd/m²) | 271 | 245 -10% | 209 -23% | 241 -11% | 238 -12% |
| Brightness Distribution (%) | 87 | 83 -5% | 89 2% | 81 -7% | 85 -2% |
| Black Level * (cd/m²) | 0.19 | 0.19 -0% | 0.68 -258% | 0.25 -32% | 0.23 -21% |
| Contrast (:1) | 1521 | 1379 -9% | 331 -78% | 1000 -34% | 1113 -27% |
| Colorchecker dE 2000 * | 5.6 | 7 -25% | 4.54 19% | 5.5 2% | 6.2 -11% |
| Colorchecker dE 2000 max. * | 20.8 | 23.6 -13% | 7.2 65% | 23.5 -13% | 18.2 13% |
| Colorchecker dE 2000 calibrated * | 4.7 | 2.87 39% | 4.8 -2% | 5.2 -11% | |
| Greyscale dE 2000 * | 2.7 | 6.4 -137% | 4.14 -53% | 3.5 -30% | 3.8 -41% |
| Gamma | 1.96 112% | 2.14 103% | 2.13 103% | 2.27 97% | 2.5 88% |
| CCT | 6506 100% | 6065 107% | 6624 98% | 7049 92% | 6643 98% |
| Color Space (Percent of AdobeRGB 1998) (%) | 37.2 | 39.5 6% | 39 5% | 37.9 2% | 36.1 -3% |
| Color Space (Percent of sRGB) (%) | 58.5 | 61.9 6% | 61 4% | 59.4 2% | 56.9 -3% |
| Total Average (Program / Settings) | -3% /
-11% | 1% /
-15% | 5% /
-5% | -1% /
-7% |
* ... smaller is better
Display Response Times
| ↔ Response Time Black to White | ||
|---|---|---|
| 33.6 ms ... rise ↗ and fall ↘ combined | ↗ 18 ms rise | 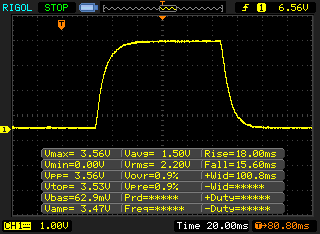 |
| ↘ 15.6 ms fall | ||
| The screen shows slow response rates in our tests and will be unsatisfactory for gamers. In comparison, all tested devices range from 0.1 (minimum) to 240 (maximum) ms. » 90 % of all devices are better. This means that the measured response time is worse than the average of all tested devices (19.8 ms). | ||
| ↔ Response Time 50% Grey to 80% Grey | ||
| 44.8 ms ... rise ↗ and fall ↘ combined | ↗ 20.4 ms rise | 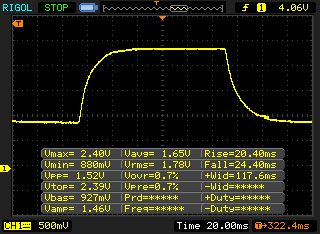 |
| ↘ 24.4 ms fall | ||
| The screen shows slow response rates in our tests and will be unsatisfactory for gamers. In comparison, all tested devices range from 0.165 (minimum) to 636 (maximum) ms. » 76 % of all devices are better. This means that the measured response time is worse than the average of all tested devices (31 ms). | ||
Screen Flickering / PWM (Pulse-Width Modulation)
| Screen flickering / PWM not detected | 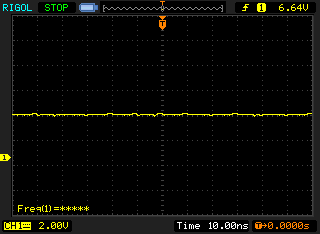 | ||
In comparison: 52 % of all tested devices do not use PWM to dim the display. If PWM was detected, an average of 7753 (minimum: 5 - maximum: 343500) Hz was measured. | |||
| |||||||||||||||||||||||||
Brightness Distribution: 74 %
Center on Battery: 168 cd/m²
Contrast: 1163:1 (Black: 0.19 cd/m²)
ΔE ColorChecker Calman: 4.67 | ∀{0.5-29.43 Ø4.72}
calibrated: 4.3
ΔE Greyscale Calman: 3.81 | ∀{0.09-98 Ø4.97}
62% sRGB (Argyll 1.6.3 3D)
39% AdobeRGB 1998 (Argyll 1.6.3 3D)
Gamma: 2.24
CCT: 6177 K
| Cinebench R15 | |
| CPU Single 64Bit | |
| Average of class Office (99.5 - 312, n=73, last 2 years) | |
| HP ProBook 440 G6-5TK01EA | |
| Lenovo ThinkPad E480-20KNCTO1WW | |
| Dell Latitude 3490 | |
| Lenovo ThinkPad E485-20KU000NGE | |
| HP ProBook 645 G4 3UP62EA | |
| Average AMD Ryzen 5 2500U (124 - 142, n=15) | |
| CPU Multi 64Bit | |
| Average of class Office (250 - 3380, n=73, last 2 years) | |
| Dell Latitude 3490 | |
| Lenovo ThinkPad E485-20KU000NGE | |
| Average AMD Ryzen 5 2500U (510 - 642, n=16) | |
| HP ProBook 440 G6-5TK01EA | |
| HP ProBook 645 G4 3UP62EA | |
| Lenovo ThinkPad E480-20KNCTO1WW | |
| PCMark 8 | |
| Home Score Accelerated v2 | |
| Average of class Office (n=1last 2 years) | |
| Dell Latitude 3490 | |
| HP ProBook 440 G6-5TK01EA | |
| HP ProBook 645 G4 3UP62EA | |
| Lenovo ThinkPad E480-20KNCTO1WW | |
| Lenovo ThinkPad E485-20KU000NGE | |
| Average AMD Ryzen 5 2500U, AMD Radeon RX Vega 8 (Ryzen 2000/3000) (3049 - 3550, n=14) | |
| Work Score Accelerated v2 | |
| Average of class Office (n=1last 2 years) | |
| HP ProBook 440 G6-5TK01EA | |
| Lenovo ThinkPad E485-20KU000NGE | |
| Lenovo ThinkPad E480-20KNCTO1WW | |
| HP ProBook 645 G4 3UP62EA | |
| Average AMD Ryzen 5 2500U, AMD Radeon RX Vega 8 (Ryzen 2000/3000) (3437 - 4870, n=11) | |
| Creative Score Accelerated v2 | |
| HP ProBook 440 G6-5TK01EA | |
| Lenovo ThinkPad E480-20KNCTO1WW | |
| Lenovo ThinkPad E485-20KU000NGE | |
| Average AMD Ryzen 5 2500U, AMD Radeon RX Vega 8 (Ryzen 2000/3000) (3126 - 4249, n=6) | |
| PCMark 8 Home Score Accelerated v2 | 3550 points | |
| PCMark 8 Creative Score Accelerated v2 | 4249 points | |
| PCMark 8 Work Score Accelerated v2 | 4870 points | |
| PCMark 10 Score | 3321 points | |
Help | ||
| Lenovo ThinkPad E485-20KU000NGE Samsung PM961 MZVLW256HEHP | Lenovo ThinkPad E480-20KNCTO1WW Toshiba KBG30ZMT128G | HP ProBook 645 G4 3UP62EA Toshiba XG5 KXG50ZNV256G | Dell Latitude 3490 SK hynix SC311 M.2 | HP ProBook 440 G6-5TK01EA Toshiba XG5 KXG50ZNV512G | Average Samsung PM961 MZVLW256HEHP | |
|---|---|---|---|---|---|---|
| AS SSD | -82% | -47% | -45% | -2% | -59% | |
| Score Total (Points) | 2478 | 638 -74% | 1290 -48% | 1006 -59% | 2040 -18% | 2565 ? 4% |
| Score Write (Points) | 575 | 182 -68% | 323 -44% | 387 -33% | 669 16% | 587 ? 2% |
| Score Read (Points) | 1277 | 324 -75% | 638 -50% | 409 -68% | 954 -25% | 1378 ? 8% |
| Access Time Write * (ms) | 0.059 | 0.235 -298% | 0.063 -7% | 0.052 12% | 0.047 20% | 0.4637 ? -686% |
| Access Time Read * (ms) | 0.054 | 0.106 -96% | 0.144 -167% | 0.097 -80% | 0.067 -24% | 0.06777 ? -25% |
| 4K-64 Write (MB/s) | 371.5 | 92.1 -75% | 216 -42% | 286.1 -23% | 499.5 34% | 419 ? 13% |
| 4K-64 Read (MB/s) | 1035 | 190.9 -82% | 433.3 -58% | 332.7 -68% | 724 -30% | 1112 ? 7% |
| 4K Write (MB/s) | 63.9 | 78.9 23% | 76.8 20% | 68.9 8% | 119.7 87% | 91.6 ? 43% |
| 4K Read (MB/s) | 38.63 | 31.13 -19% | 25.35 -34% | 27.67 -28% | 31.17 -19% | 45.1 ? 17% |
| Seq Write (MB/s) | 1395 | 115.4 -92% | 305.2 -78% | 318.8 -77% | 493.6 -65% | 960 ? -31% |
| Seq Read (MB/s) | 2030 | 1015 -50% | 1797 -11% | 484.7 -76% | 1983 -2% | 2019 ? -1% |
* ... smaller is better

| 3DMark 11 - 1280x720 Performance GPU | |
| Average of class Office (2551 - 18313, n=69, last 2 years) | |
| Lenovo ThinkPad E485-20KU000NGE | |
| Average AMD Radeon RX Vega 8 (Ryzen 2000/3000) (1668 - 4317, n=44) | |
| HP ProBook 645 G4 3UP62EA | |
| Lenovo ThinkPad E485-20KU000NGE | |
| HP ProBook 440 G6-5TK01EA | |
| Dell Latitude 3490 | |
| Lenovo ThinkPad E480-20KNCTO1WW | |
| 3DMark - 1920x1080 Fire Strike Graphics | |
| Average of class Office (736 - 21871, n=72, last 2 years) | |
| Lenovo ThinkPad E485-20KU000NGE | |
| Average AMD Radeon RX Vega 8 (Ryzen 2000/3000) (1095 - 2901, n=41) | |
| HP ProBook 645 G4 3UP62EA | |
| Lenovo ThinkPad E485-20KU000NGE | |
| HP ProBook 440 G6-5TK01EA | |
| Dell Latitude 3490 | |
| Lenovo ThinkPad E480-20KNCTO1WW | |
| 3DMark 11 Performance | 2807 points | |
| 3DMark Cloud Gate Standard Score | 7035 points | |
| 3DMark Fire Strike Score | 1469 points | |
Help | ||
| BioShock Infinite - 1920x1080 Ultra Preset, DX11 (DDOF) | |
| Lenovo ThinkPad E480-20KQS00000 | |
| Lenovo ThinkPad E485-20KU000NGE | |
| Average AMD Radeon RX Vega 8 (Ryzen 2000/3000) (7.6 - 28, n=30) | |
| Lenovo ThinkPad E485-20KU000NGE | |
| HP ProBook 645 G4 3UP62EA | |
| HP ProBook 440 G6-5TK01EA | |
| Dell Latitude 3490 | |
| Lenovo ThinkPad E480-20KNCTO1WW | |
| Rise of the Tomb Raider | |
| 1024x768 Lowest Preset | |
| Lenovo ThinkPad E485-20KU000NGE | |
| Average AMD Radeon RX Vega 8 (Ryzen 2000/3000) (27.7 - 49.3, n=10) | |
| Lenovo ThinkPad E485-20KU000NGE | |
| HP ProBook 645 G4 3UP62EA | |
| HP ProBook 440 G6-5TK01EA | |
| Lenovo ThinkPad E480-20KNCTO1WW | |
| 1920x1080 High Preset AA:FX AF:4x | |
| Lenovo ThinkPad E485-20KU000NGE | |
| Average AMD Radeon RX Vega 8 (Ryzen 2000/3000) (5.9 - 15.4, n=11) | |
| Lenovo ThinkPad E485-20KU000NGE | |
| HP ProBook 645 G4 3UP62EA | |
| HP ProBook 440 G6-5TK01EA | |
| Lenovo ThinkPad E480-20KNCTO1WW | |
| low | med. | high | ultra | |
|---|---|---|---|---|
| BioShock Infinite (2013) | 74.4 | 13.26 | ||
| Rise of the Tomb Raider (2016) | 30.4 | 10.8 | ||
| Doom (2016) | 25.1 | 10.4 | ||
| Civilization 6 (2016) | 56.3 | 12.4 | ||
| Star Wars Battlefront 2 (2017) | 26.5 | 9.1 |
Noise level
| Idle |
| 29.4 / 29.4 / 31.2 dB(A) |
| Load |
| 32.7 / 35.3 dB(A) |
 | ||
30 dB silent 40 dB(A) audible 50 dB(A) loud |
||
min: | ||
| Lenovo ThinkPad E485-20KU000NGE Vega 8, R5 2500U, Samsung PM961 MZVLW256HEHP | Lenovo ThinkPad E480-20KNCTO1WW UHD Graphics 620, i5-8250U, Toshiba KBG30ZMT128G | HP ProBook 645 G4 3UP62EA Vega 8, R5 PRO 2500U, Toshiba XG5 KXG50ZNV256G | Dell Latitude 3490 UHD Graphics 620, i5-8250U, SK hynix SC311 M.2 | HP ProBook 440 G6-5TK01EA UHD Graphics 620, i7-8565U, Toshiba XG5 KXG50ZNV512G | |
|---|---|---|---|---|---|
| Noise | 2% | -4% | -7% | 2% | |
| off / environment * (dB) | 29.4 | 29.1 1% | 30.8 -5% | 29.8 -1% | 29.4 -0% |
| Idle Minimum * (dB) | 29.4 | 29.1 1% | 30.8 -5% | 29.8 -1% | 29.4 -0% |
| Idle Average * (dB) | 29.4 | 29.1 1% | 30.8 -5% | 29.8 -1% | 29.4 -0% |
| Idle Maximum * (dB) | 31.2 | 30.3 3% | 30.8 1% | 29.8 4% | 30.2 3% |
| Load Average * (dB) | 32.7 | 31.8 3% | 34.7 -6% | 39.1 -20% | 31.8 3% |
| Load Maximum * (dB) | 35.3 | 33.8 4% | 36.4 -3% | 44.3 -25% | 33.1 6% |
* ... smaller is better
(±) The maximum temperature on the upper side is 42.3 °C / 108 F, compared to the average of 34.3 °C / 94 F, ranging from 21.2 to 62.5 °C for the class Office.
(-) The bottom heats up to a maximum of 45.2 °C / 113 F, compared to the average of 36.8 °C / 98 F
(+) In idle usage, the average temperature for the upper side is 26.9 °C / 80 F, compared to the device average of 29.5 °C / 85 F.
(+) The palmrests and touchpad are cooler than skin temperature with a maximum of 25.7 °C / 78.3 F and are therefore cool to the touch.
(±) The average temperature of the palmrest area of similar devices was 27.5 °C / 81.5 F (+1.8 °C / 3.2 F).
Lenovo ThinkPad E485-20KU000NGE audio analysis
(-) | not very loud speakers (70.5 dB)
Bass 100 - 315 Hz
(-) | nearly no bass - on average 21.5% lower than median
(±) | linearity of bass is average (12.6% delta to prev. frequency)
Mids 400 - 2000 Hz
(+) | balanced mids - only 4.3% away from median
(±) | linearity of mids is average (8.5% delta to prev. frequency)
Highs 2 - 16 kHz
(+) | balanced highs - only 2.8% away from median
(+) | highs are linear (6.2% delta to prev. frequency)
Overall 100 - 16.000 Hz
(±) | linearity of overall sound is average (26.4% difference to median)
Compared to same class
» 81% of all tested devices in this class were better, 7% similar, 13% worse
» The best had a delta of 7%, average was 21%, worst was 53%
Compared to all devices tested
» 81% of all tested devices were better, 4% similar, 15% worse
» The best had a delta of 4%, average was 23%, worst was 134%
HP ProBook 440 G6-5TK01EA audio analysis
(±) | speaker loudness is average but good (78.1 dB)
Bass 100 - 315 Hz
(-) | nearly no bass - on average 17.2% lower than median
(±) | linearity of bass is average (12.1% delta to prev. frequency)
Mids 400 - 2000 Hz
(+) | balanced mids - only 3.3% away from median
(+) | mids are linear (6.7% delta to prev. frequency)
Highs 2 - 16 kHz
(±) | higher highs - on average 5.7% higher than median
(±) | linearity of highs is average (7.1% delta to prev. frequency)
Overall 100 - 16.000 Hz
(±) | linearity of overall sound is average (20.8% difference to median)
Compared to same class
» 48% of all tested devices in this class were better, 9% similar, 42% worse
» The best had a delta of 7%, average was 21%, worst was 53%
Compared to all devices tested
» 56% of all tested devices were better, 8% similar, 36% worse
» The best had a delta of 4%, average was 23%, worst was 134%
| Off / Standby | |
| Idle | |
| Load |
|
Key:
min: | |
| Lenovo ThinkPad E485-20KU000NGE R5 2500U, Vega 8, Samsung PM961 MZVLW256HEHP, IPS, 1920x1080, 14" | Lenovo ThinkPad E480-20KNCTO1WW i5-8250U, UHD Graphics 620, Toshiba KBG30ZMT128G, IPS LED, 1920x1080, 14" | HP ProBook 645 G4 3UP62EA R5 PRO 2500U, Vega 8, Toshiba XG5 KXG50ZNV256G, IPS, 1920x1080, 14" | Dell Latitude 3490 i5-8250U, UHD Graphics 620, SK hynix SC311 M.2, IPS LED, 1920x1080, 14" | HP ProBook 440 G6-5TK01EA i7-8565U, UHD Graphics 620, Toshiba XG5 KXG50ZNV512G, IPS, 1920x1080, 14" | Average AMD Radeon RX Vega 8 (Ryzen 2000/3000) | Average of class Office | |
|---|---|---|---|---|---|---|---|
| Power Consumption | 29% | -9% | 8% | 24% | -0% | -1% | |
| Idle Minimum * (Watt) | 6.2 | 3.5 44% | 7.2 -16% | 3.2 48% | 2.98 52% | 5.68 ? 8% | 4.3 ? 31% |
| Idle Average * (Watt) | 8.6 | 5.3 38% | 9.7 -13% | 5.5 36% | 5.4 37% | 8.75 ? -2% | 7.33 ? 15% |
| Idle Maximum * (Watt) | 9.7 | 6.1 37% | 10.3 -6% | 8.1 16% | 7.9 19% | 10.1 ? -4% | 8.59 ? 11% |
| Load Average * (Watt) | 37.4 | 30 20% | 42 -12% | 40.8 -9% | 34.5 8% | 37.8 ? -1% | 43.6 ? -17% |
| Load Maximum * (Watt) | 44.8 | 42.3 6% | 44.2 1% | 68.1 -52% | 43.3 3% | 46.2 ? -3% | 64.2 ? -43% |
* ... smaller is better
| Lenovo ThinkPad E485-20KU000NGE R5 2500U, Vega 8, 45 Wh | Lenovo ThinkPad E480-20KNCTO1WW i5-8250U, UHD Graphics 620, 45 Wh | HP ProBook 645 G4 3UP62EA R5 PRO 2500U, Vega 8, 48 Wh | Dell Latitude 3490 i5-8250U, UHD Graphics 620, 56 Wh | HP ProBook 440 G6-5TK01EA i7-8565U, UHD Graphics 620, 45 Wh | Average of class Office | |
|---|---|---|---|---|---|---|
| Battery runtime | 62% | 0% | 115% | 76% | 131% | |
| Reader / Idle (h) | 9.1 | 18.4 102% | 9.3 2% | 17.1 88% | 23.7 ? 160% | |
| H.264 (h) | 5.7 | 7.2 26% | 4.2 -26% | 7.6 33% | 15.1 ? 165% | |
| WiFi v1.3 (h) | 5.4 | 8.3 54% | 4.8 -11% | 11.6 115% | 8.4 56% | 13 ? 141% |
| Load (h) | 1.1 | 1.8 64% | 1.5 36% | 2.5 127% | 1.742 ? 58% |
Pros
Cons
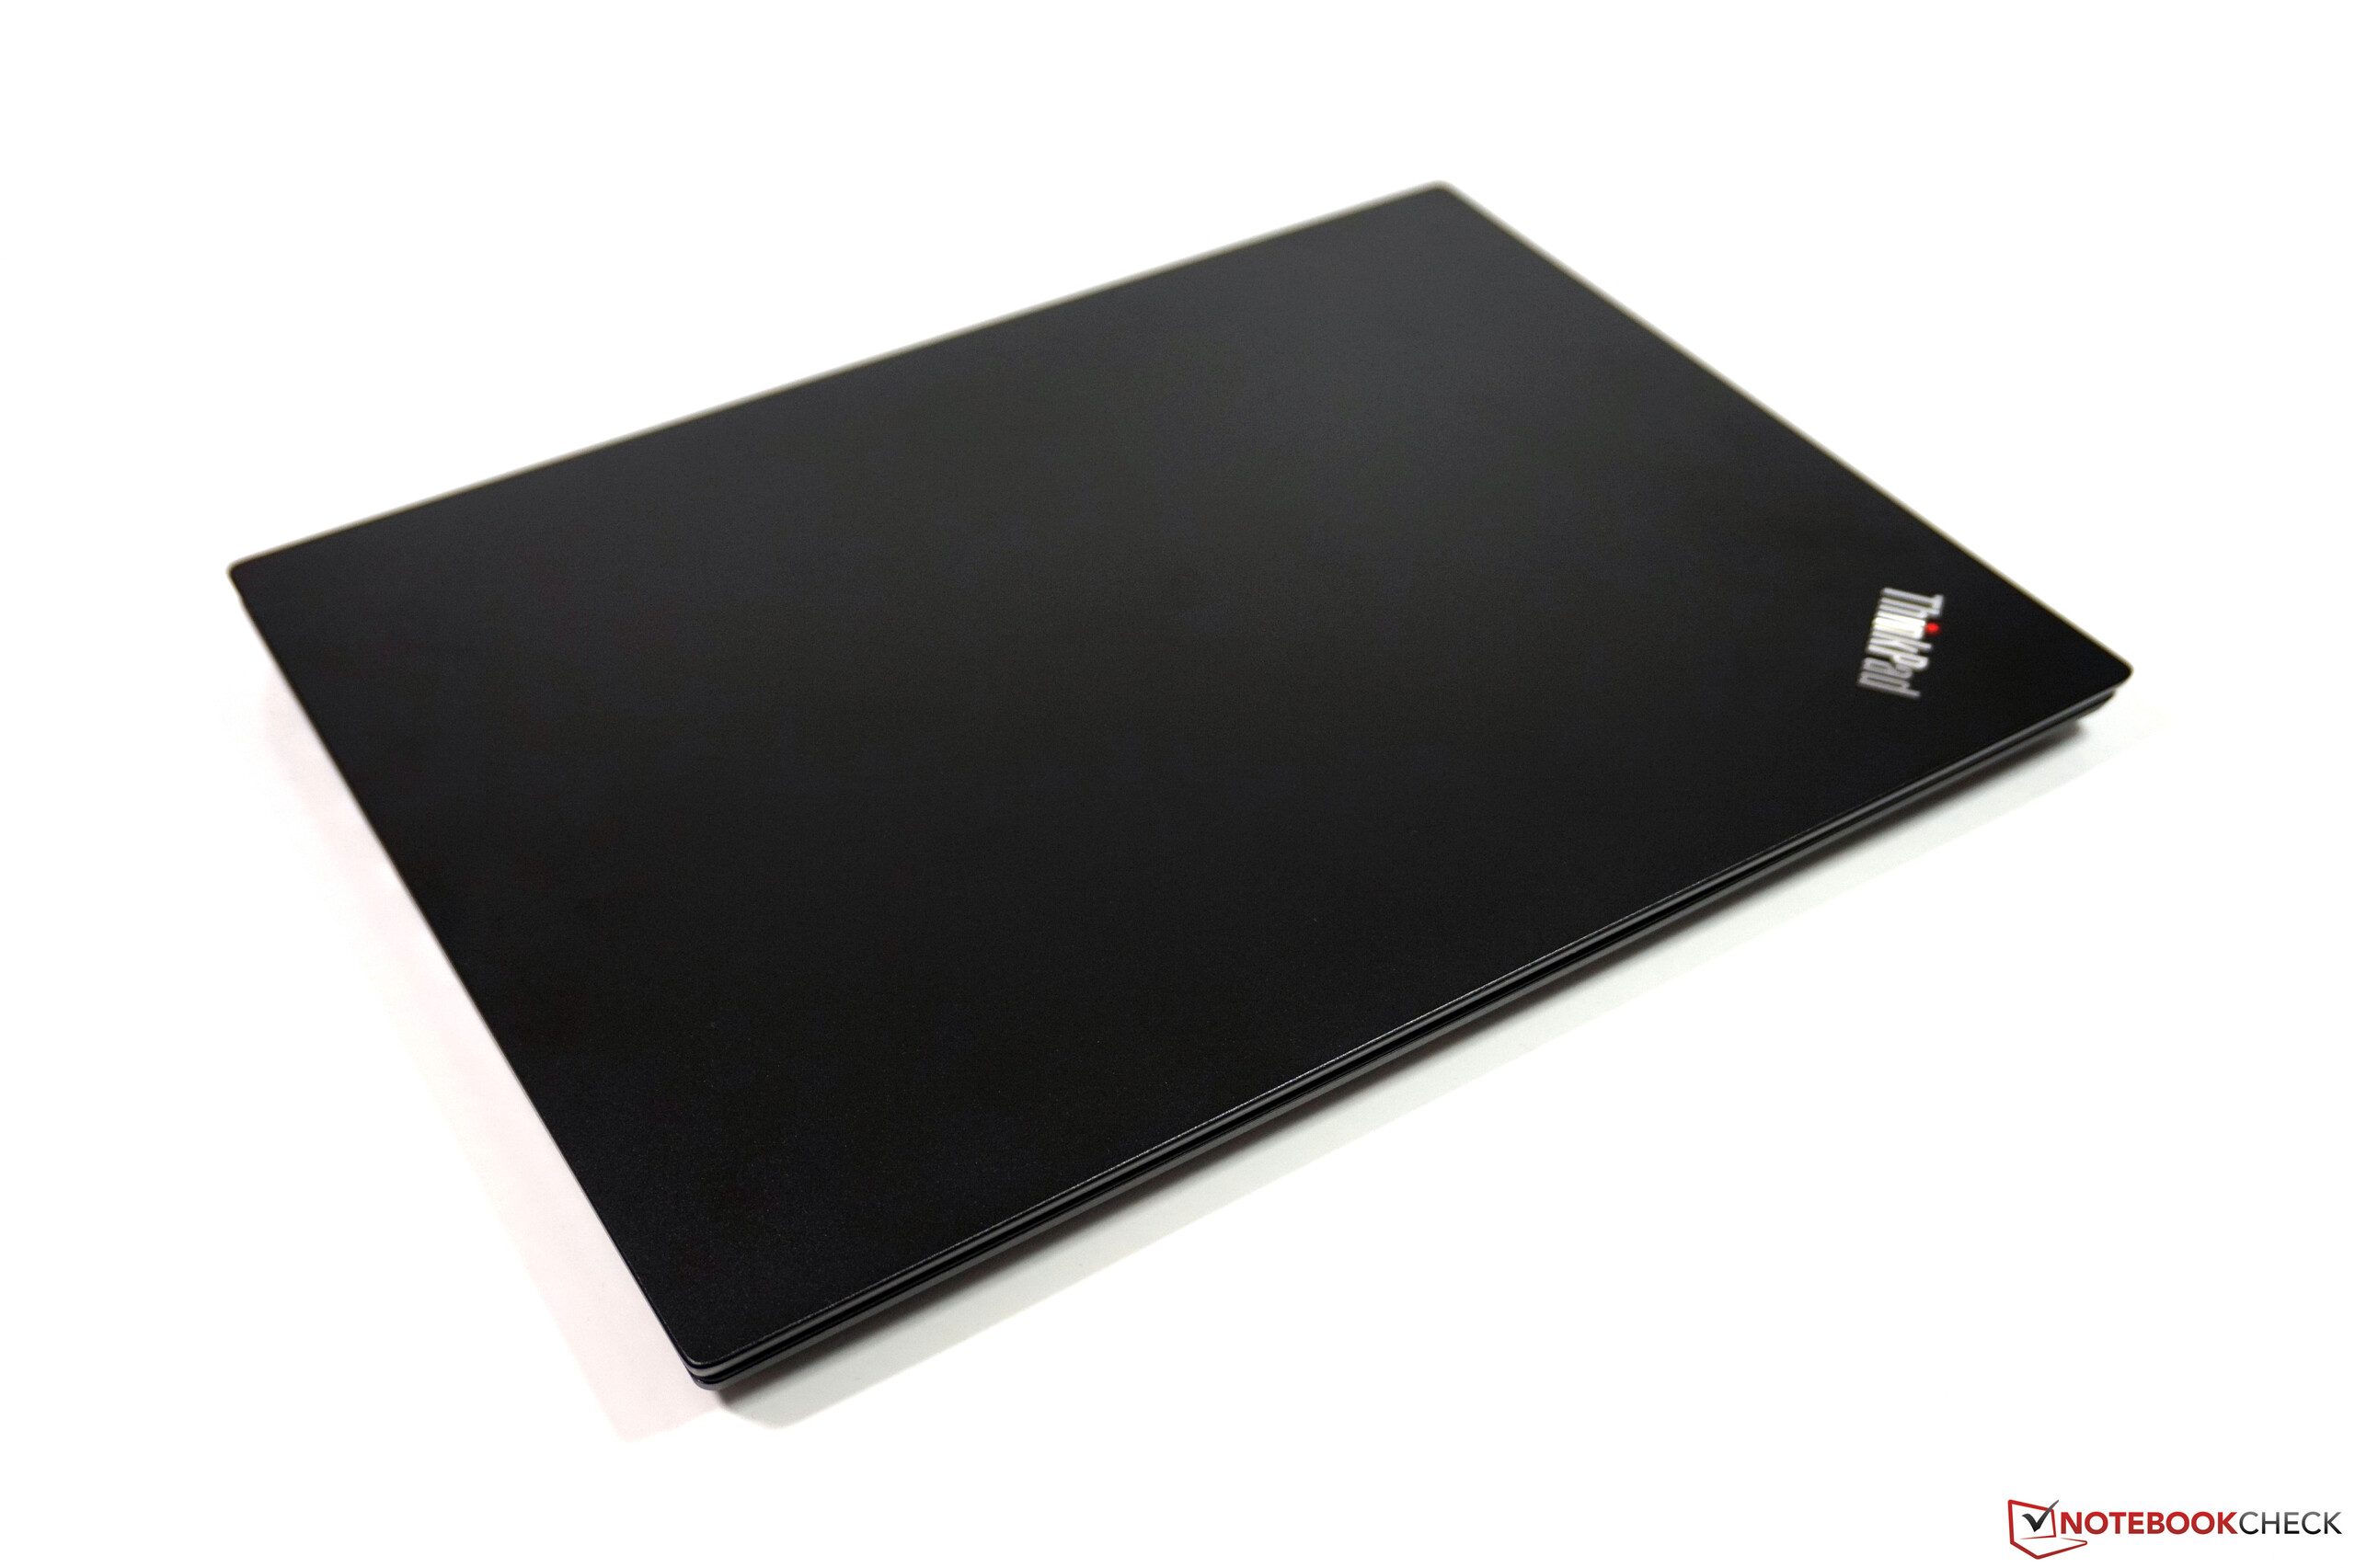
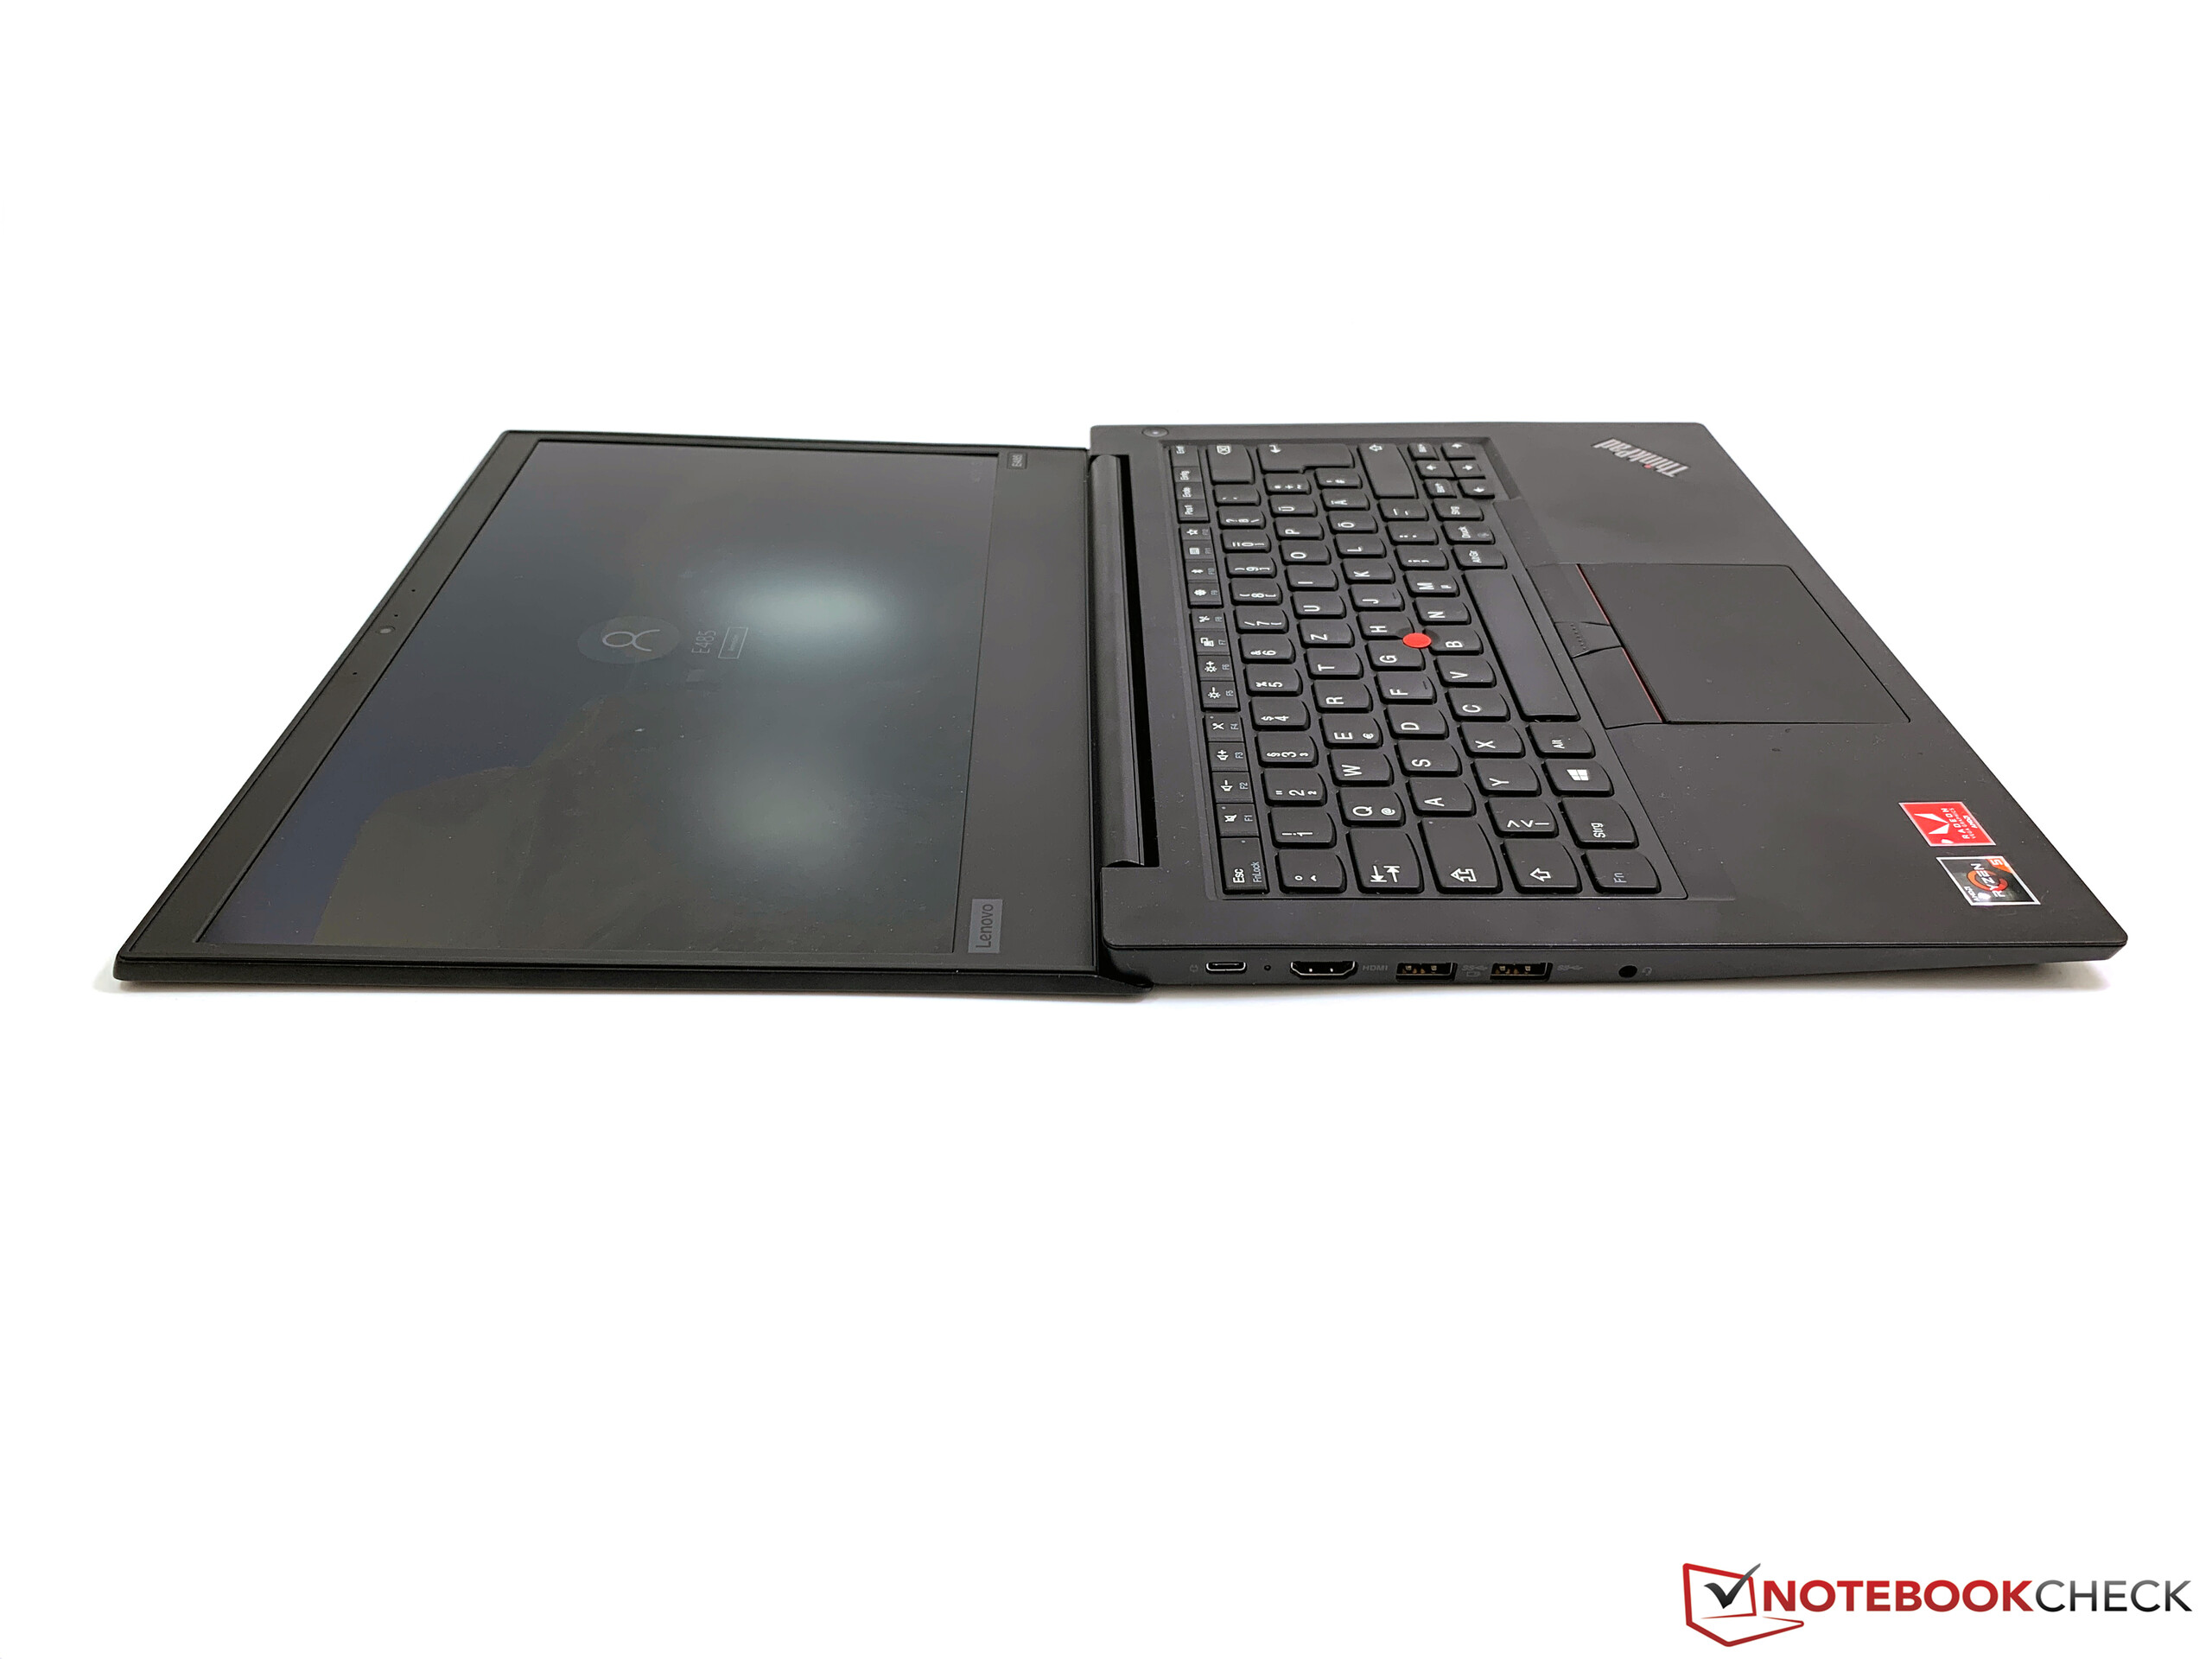
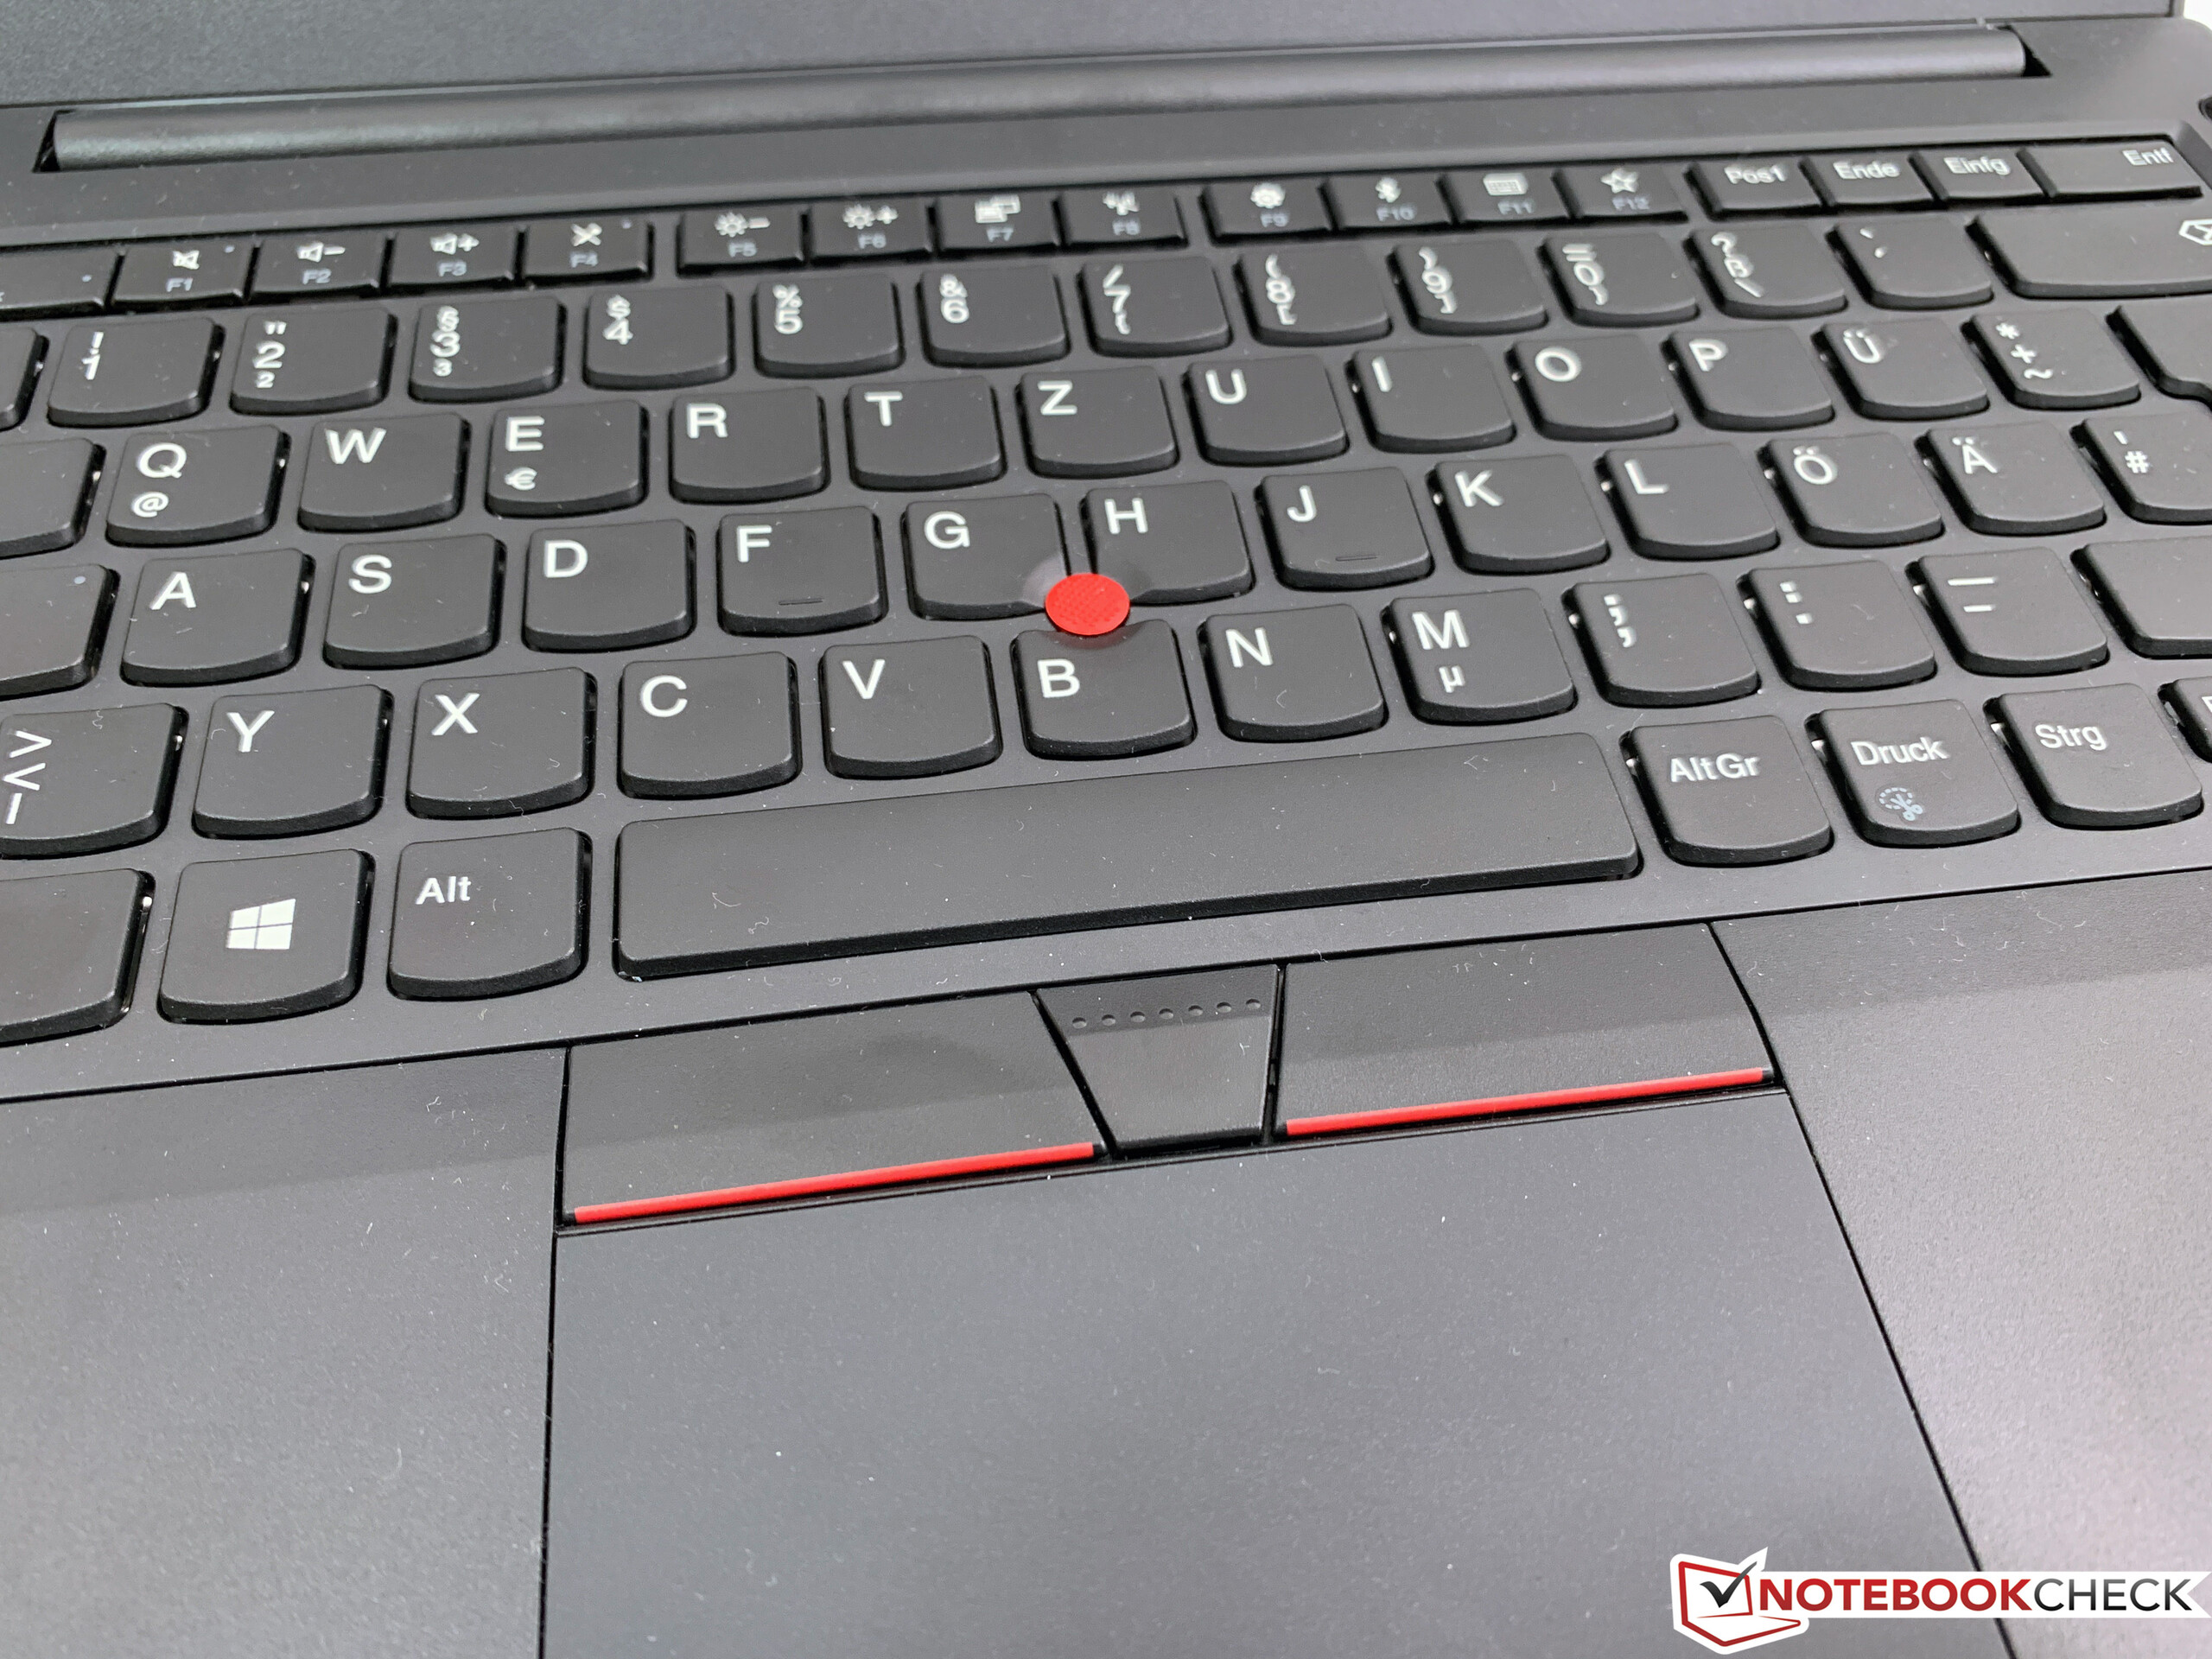
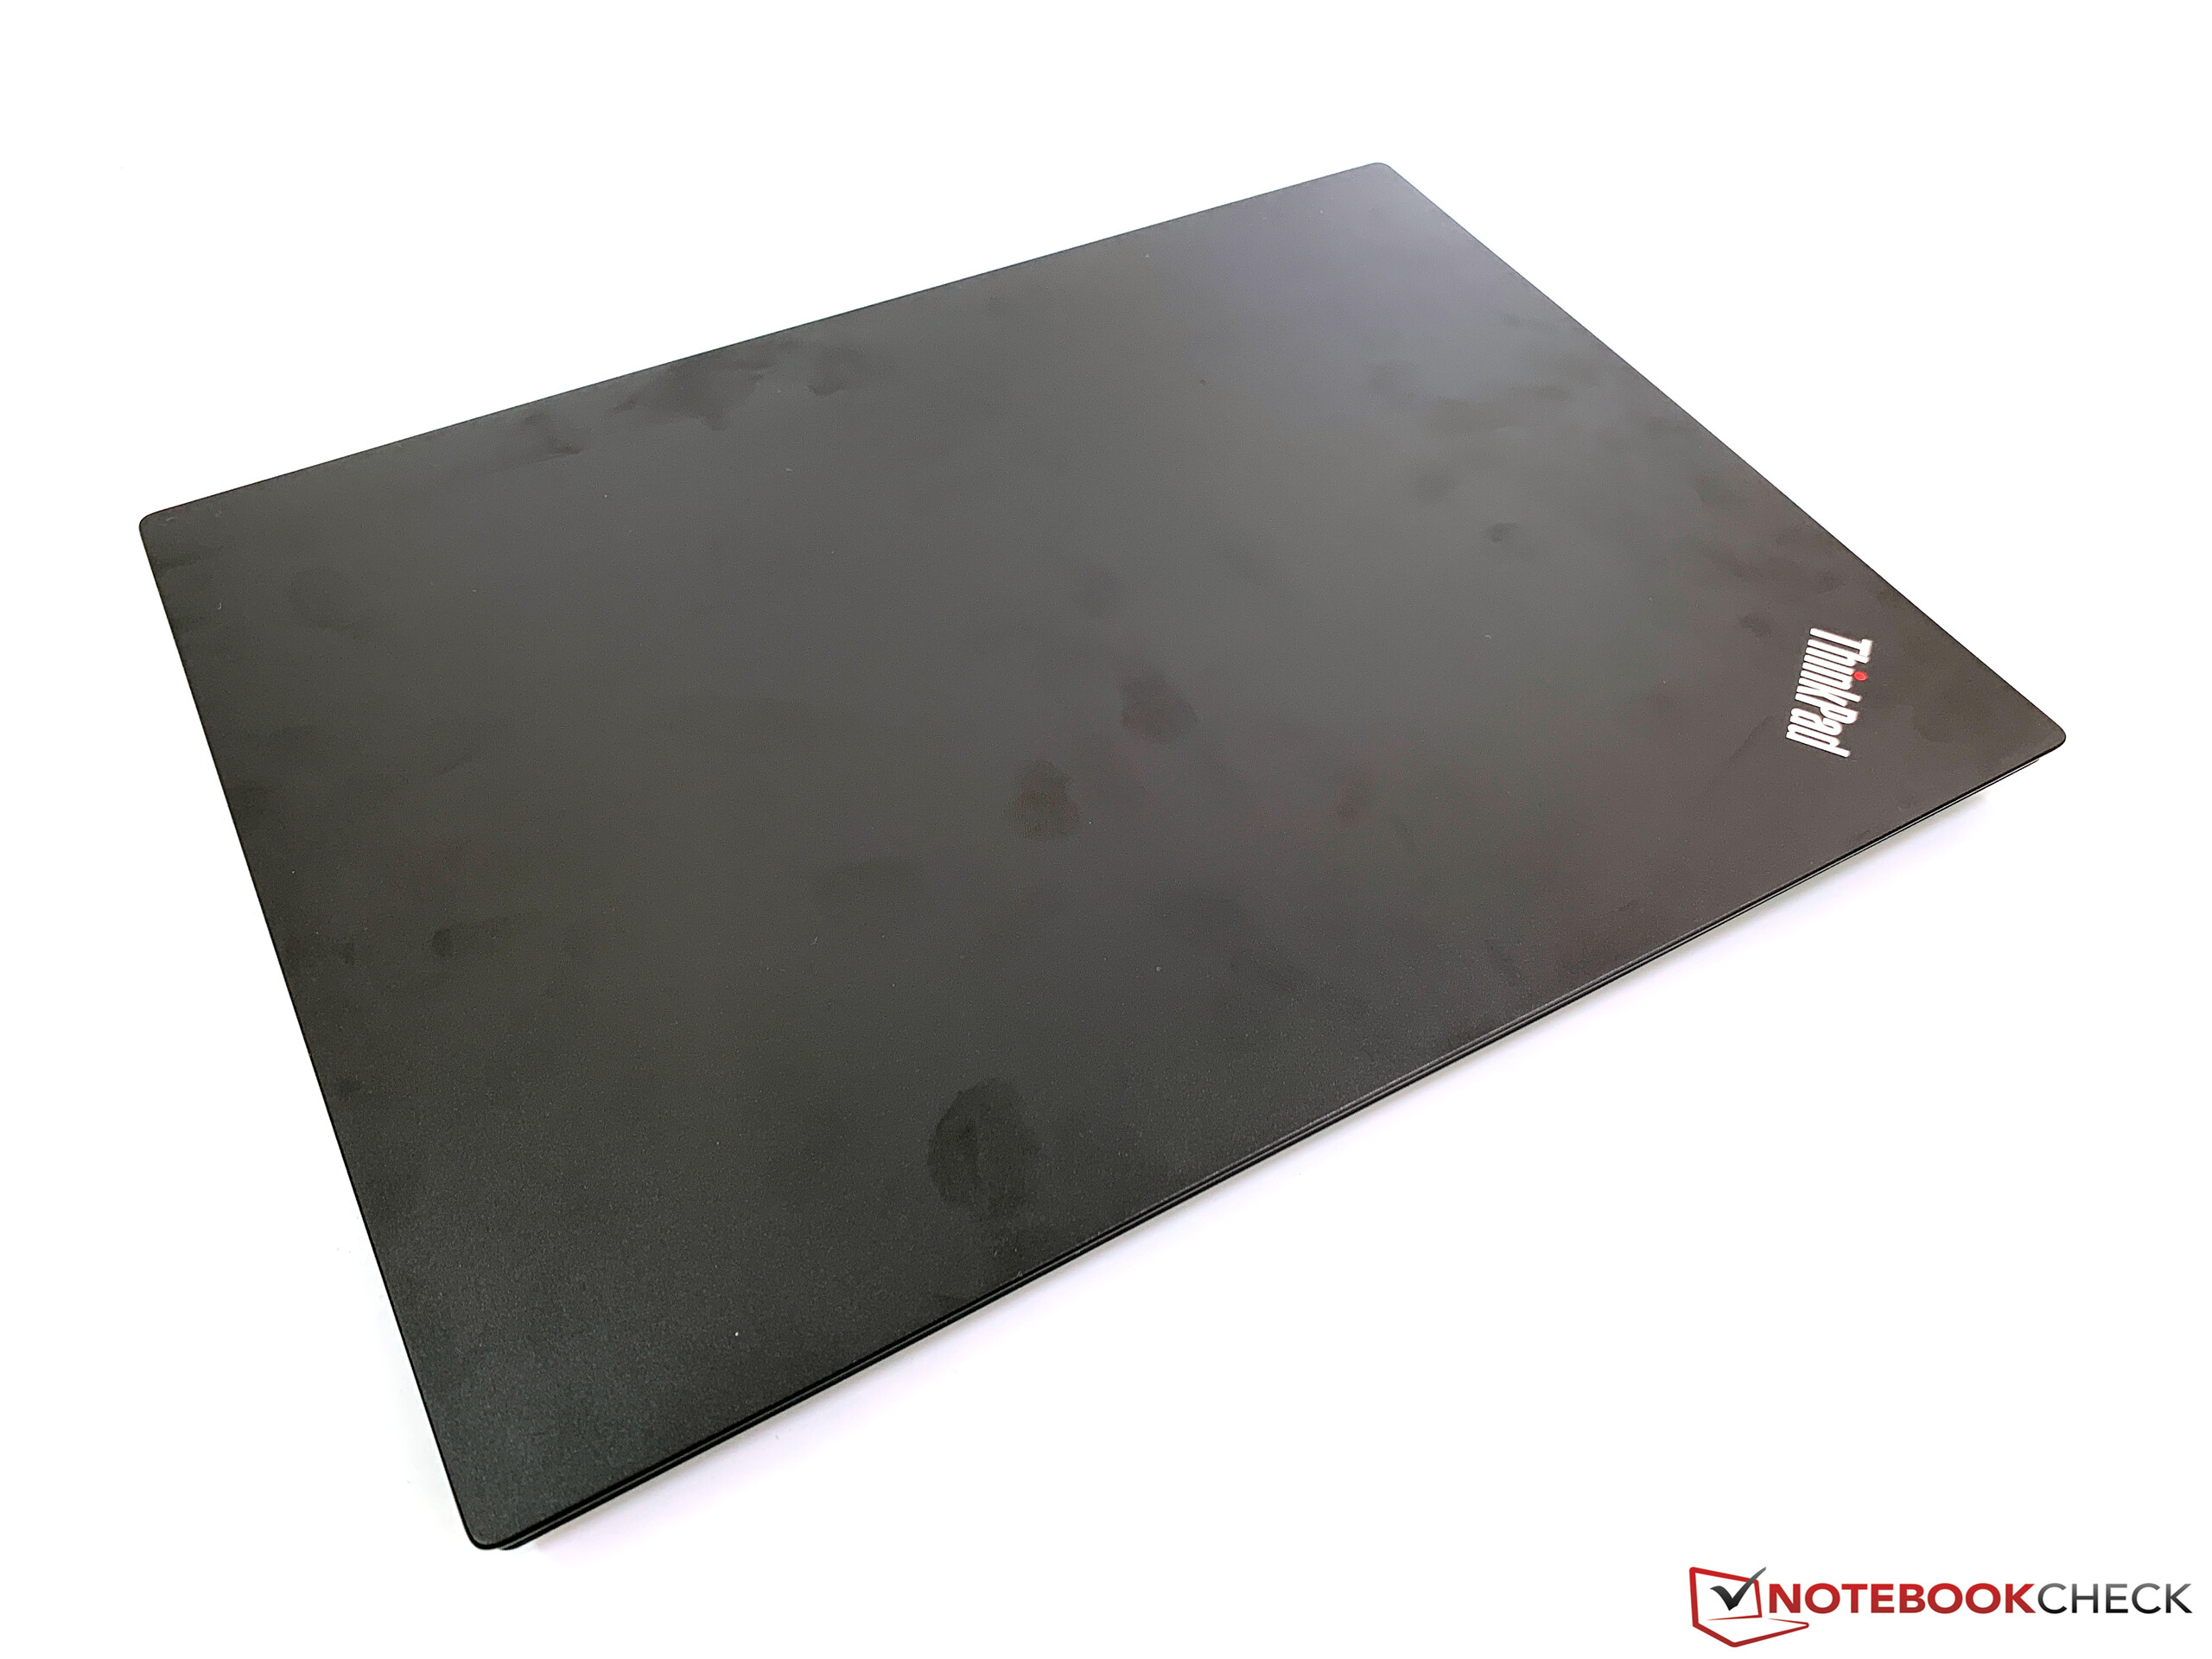
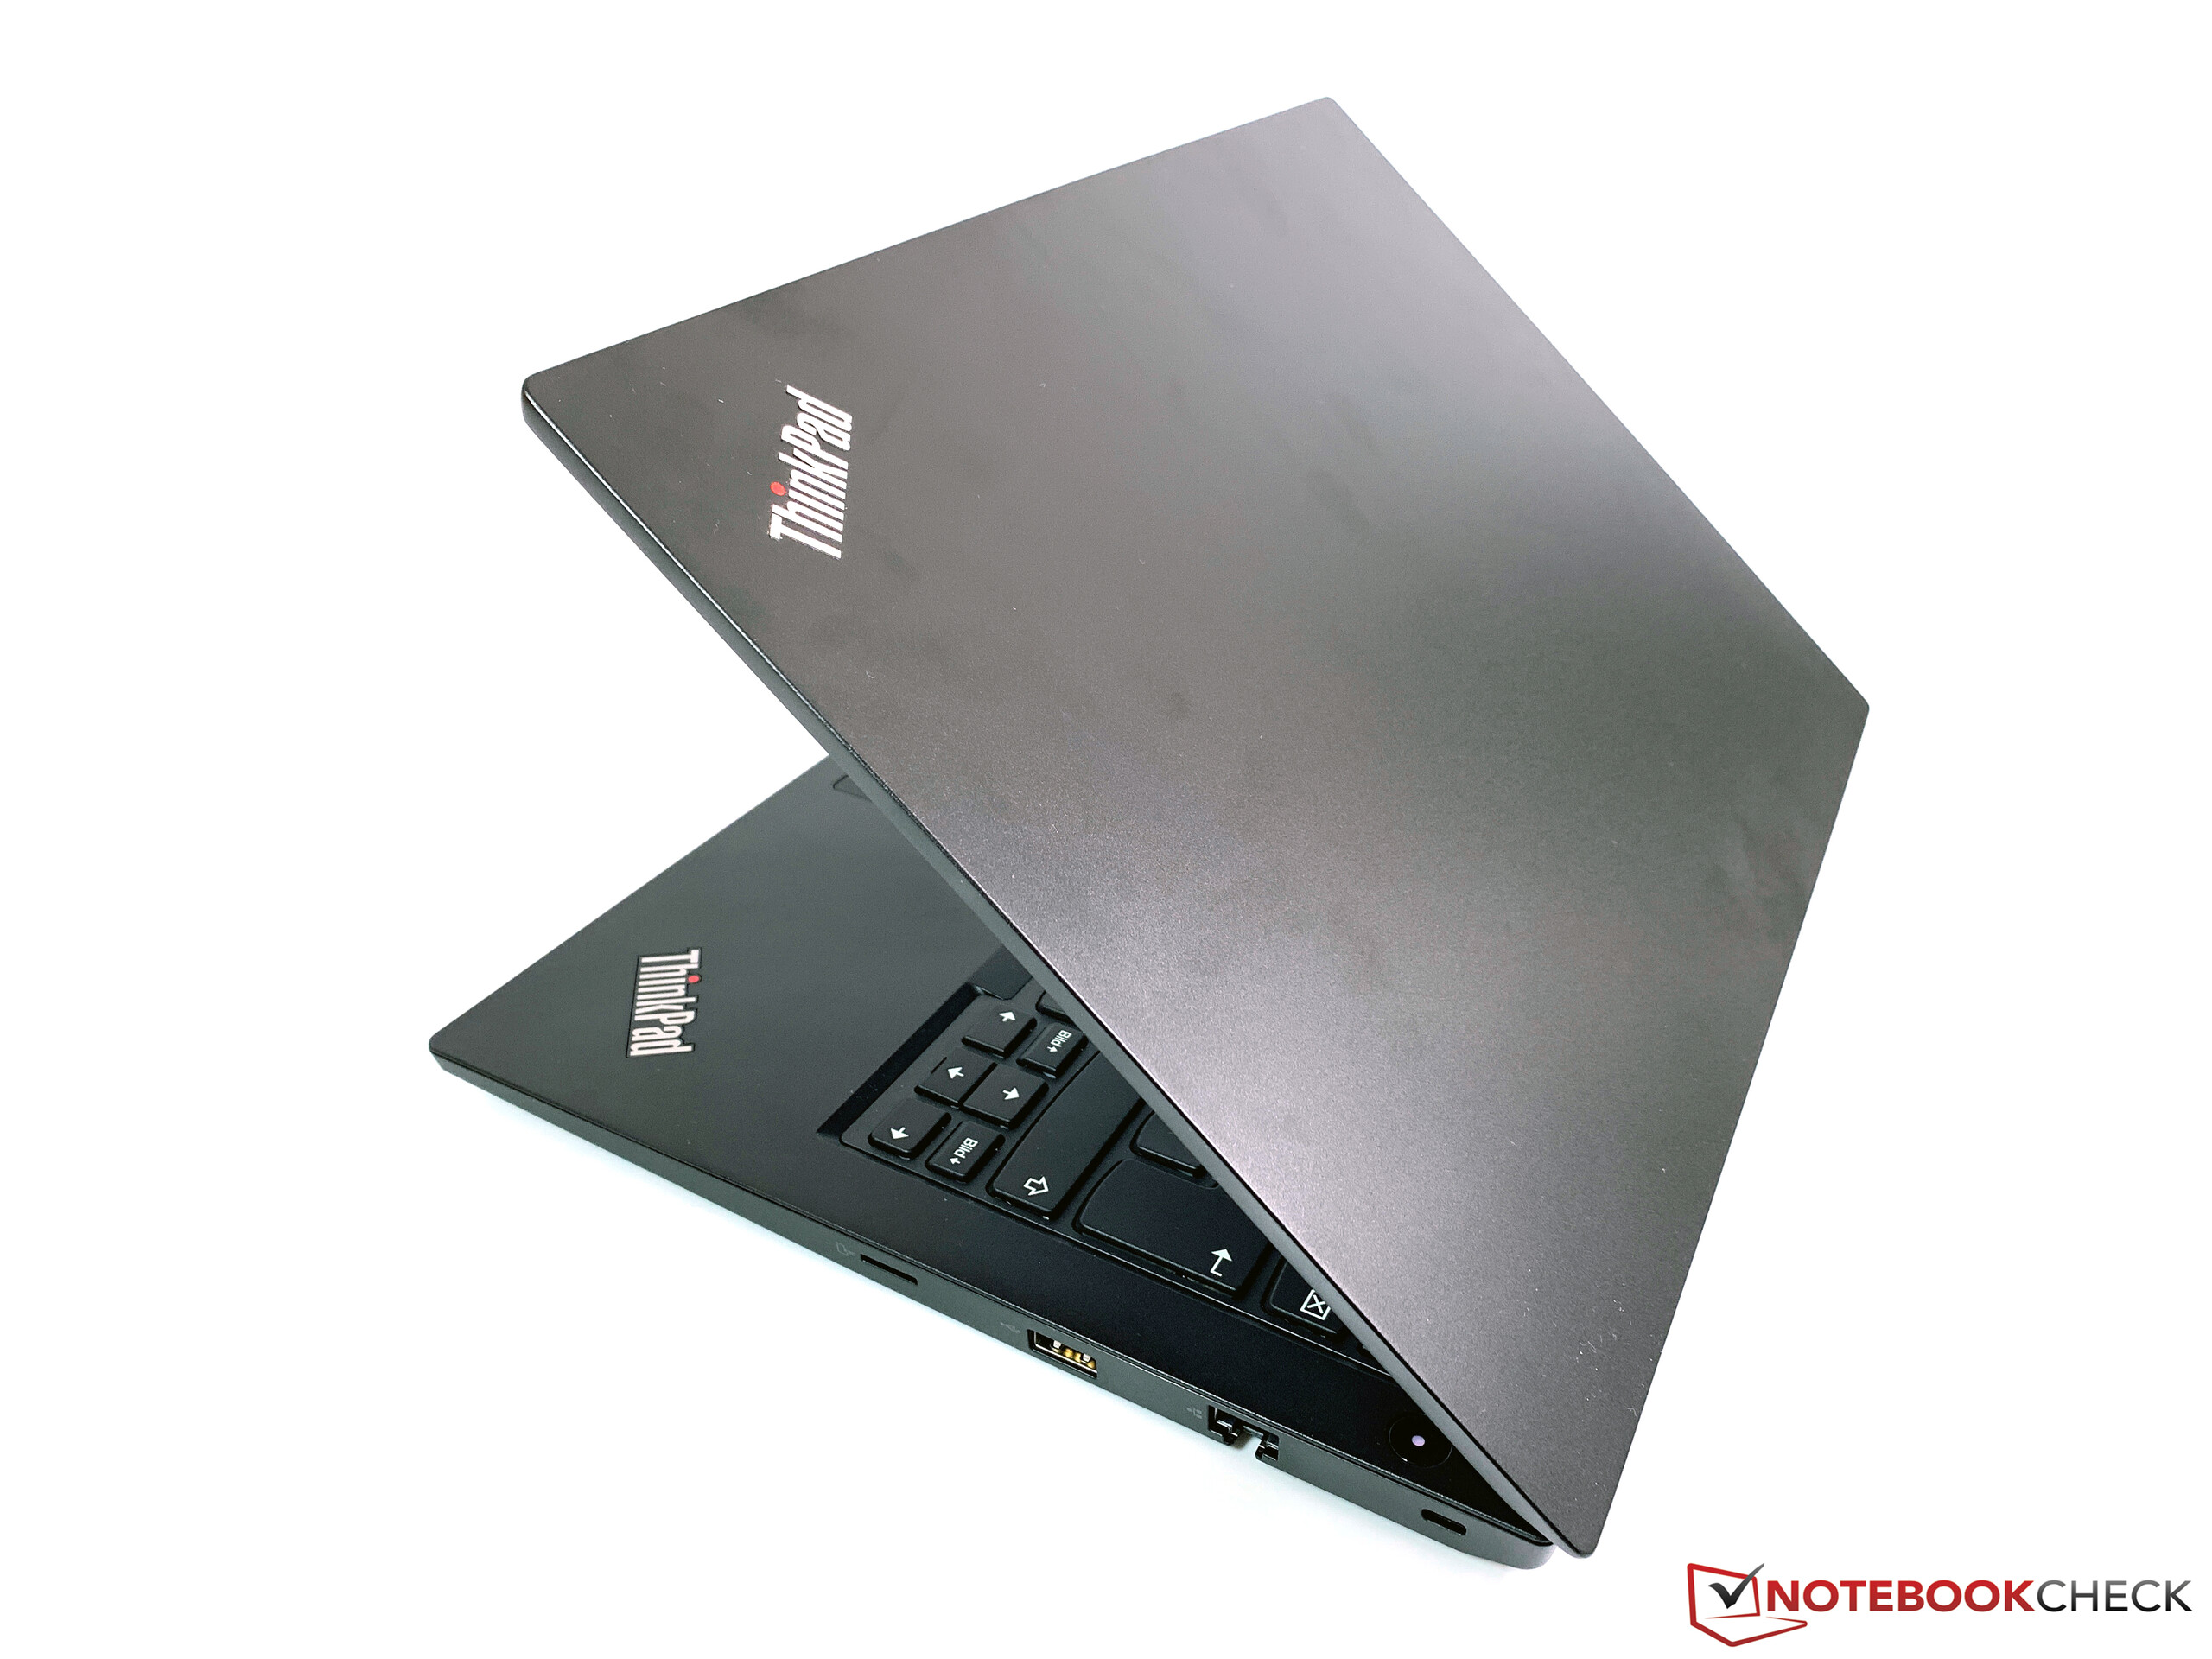
ThinkPad E485给人的印象略显复杂。它本身就是一款坚固的入门级商用笔记本电脑,具有坚固的外壳,漂亮的显示屏和出色的输入设备。但是,如果将它与ThinkPad E480(与Intel处理器相同的型号)进行比较,则存在一些差异。我们主要讲的是缺少键盘背光,甚至不作为选项提供,还有基座单元顶部的塑料材料质量稍差。有时候我们觉得制造商想要人为地将它与英特尔车型保持距离。
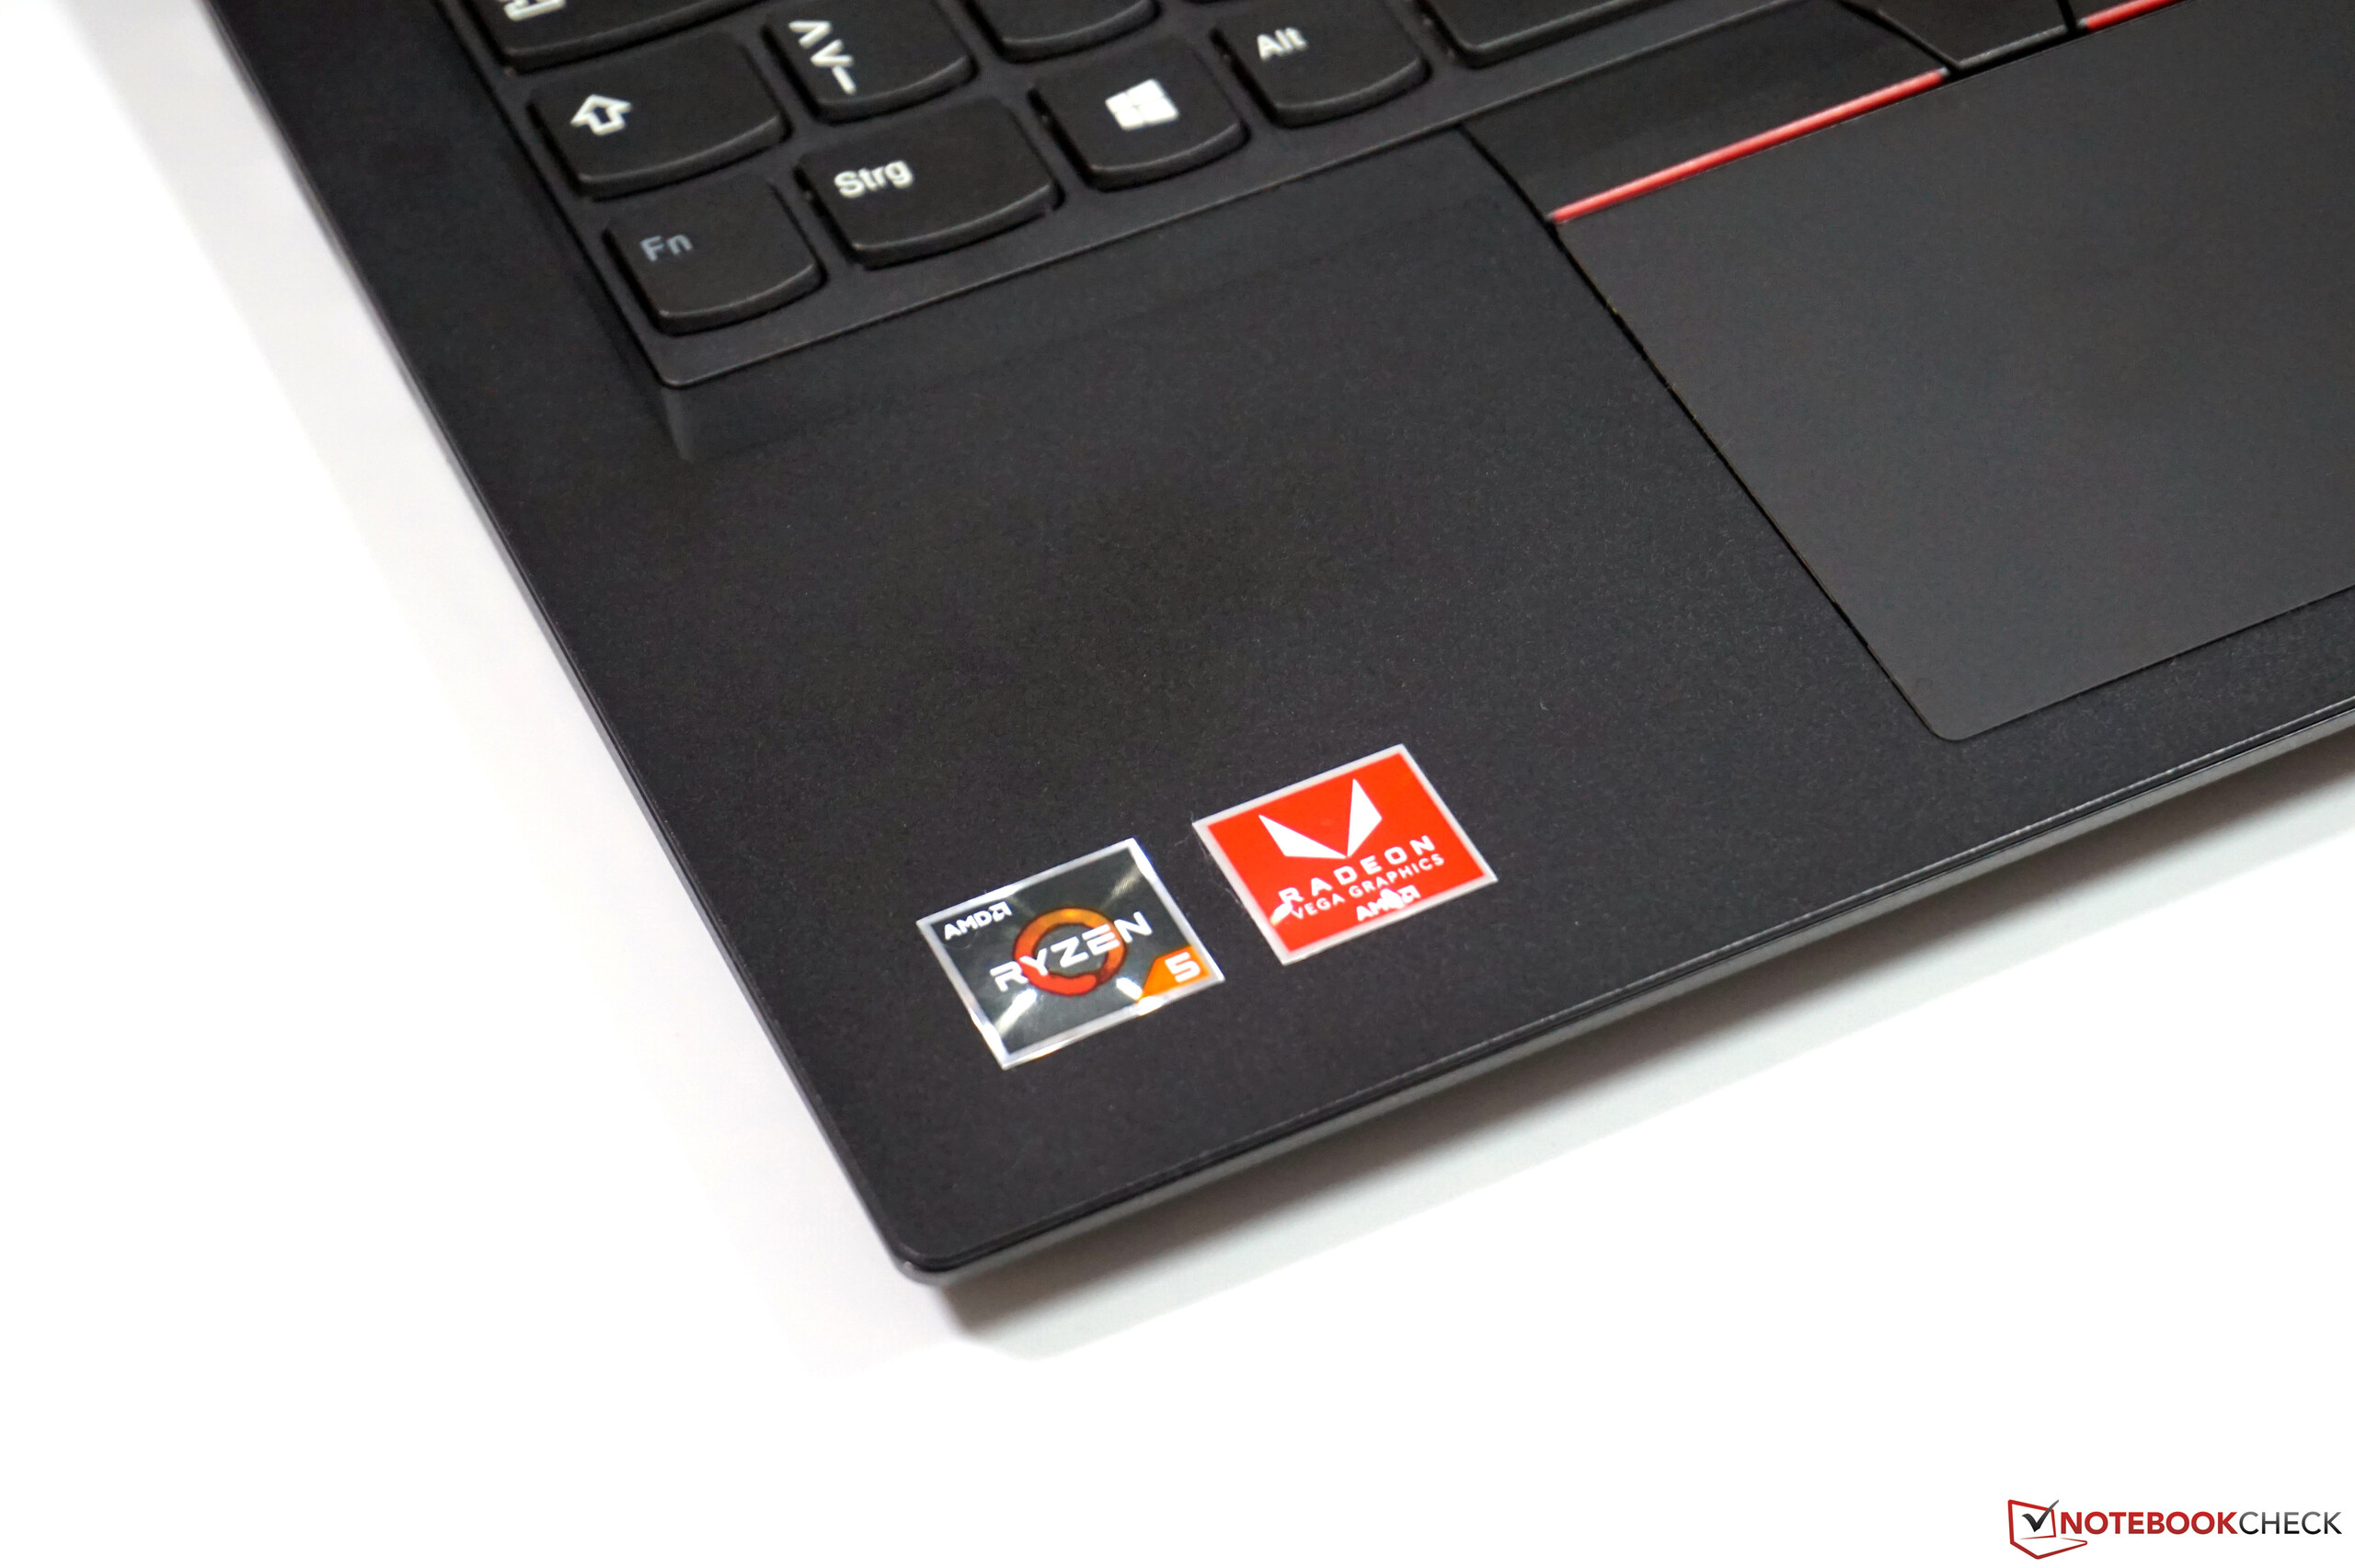
当然ThinkPad E485的价格较低,大多数用户应该能够忍受材料上的差异。另一个问题是稍微差一点的硬件。虽然每个人都知道集成的AMD GPU可以从双通道RAM中得到性能提升,但遗憾的是,所有OEM型号都是单通道。虽然您可以相对容易地升级,但原则上8 GB应该足以满足许多用户的需求,而更多RAM也需要更多预算。如果联想直接内置两个4 GB模块,情况会好一些。但最重要的问题可能是更高的功耗导致电池寿命缩短。这是否仅仅是由于缺乏优化或AMD的功耗更大我们不能确定。
错失的机会:与其英特尔兄弟相比,ThinkPad E485显示出与AMD处理器无关的一些弱点。例如,为什么没有键盘背光这一点我们难以理解。然而,对于任何能够忍受这种情况以及更短的电池续航时间的人,ThinkPad E485是一台性价比和可靠性都很高的入门设备。
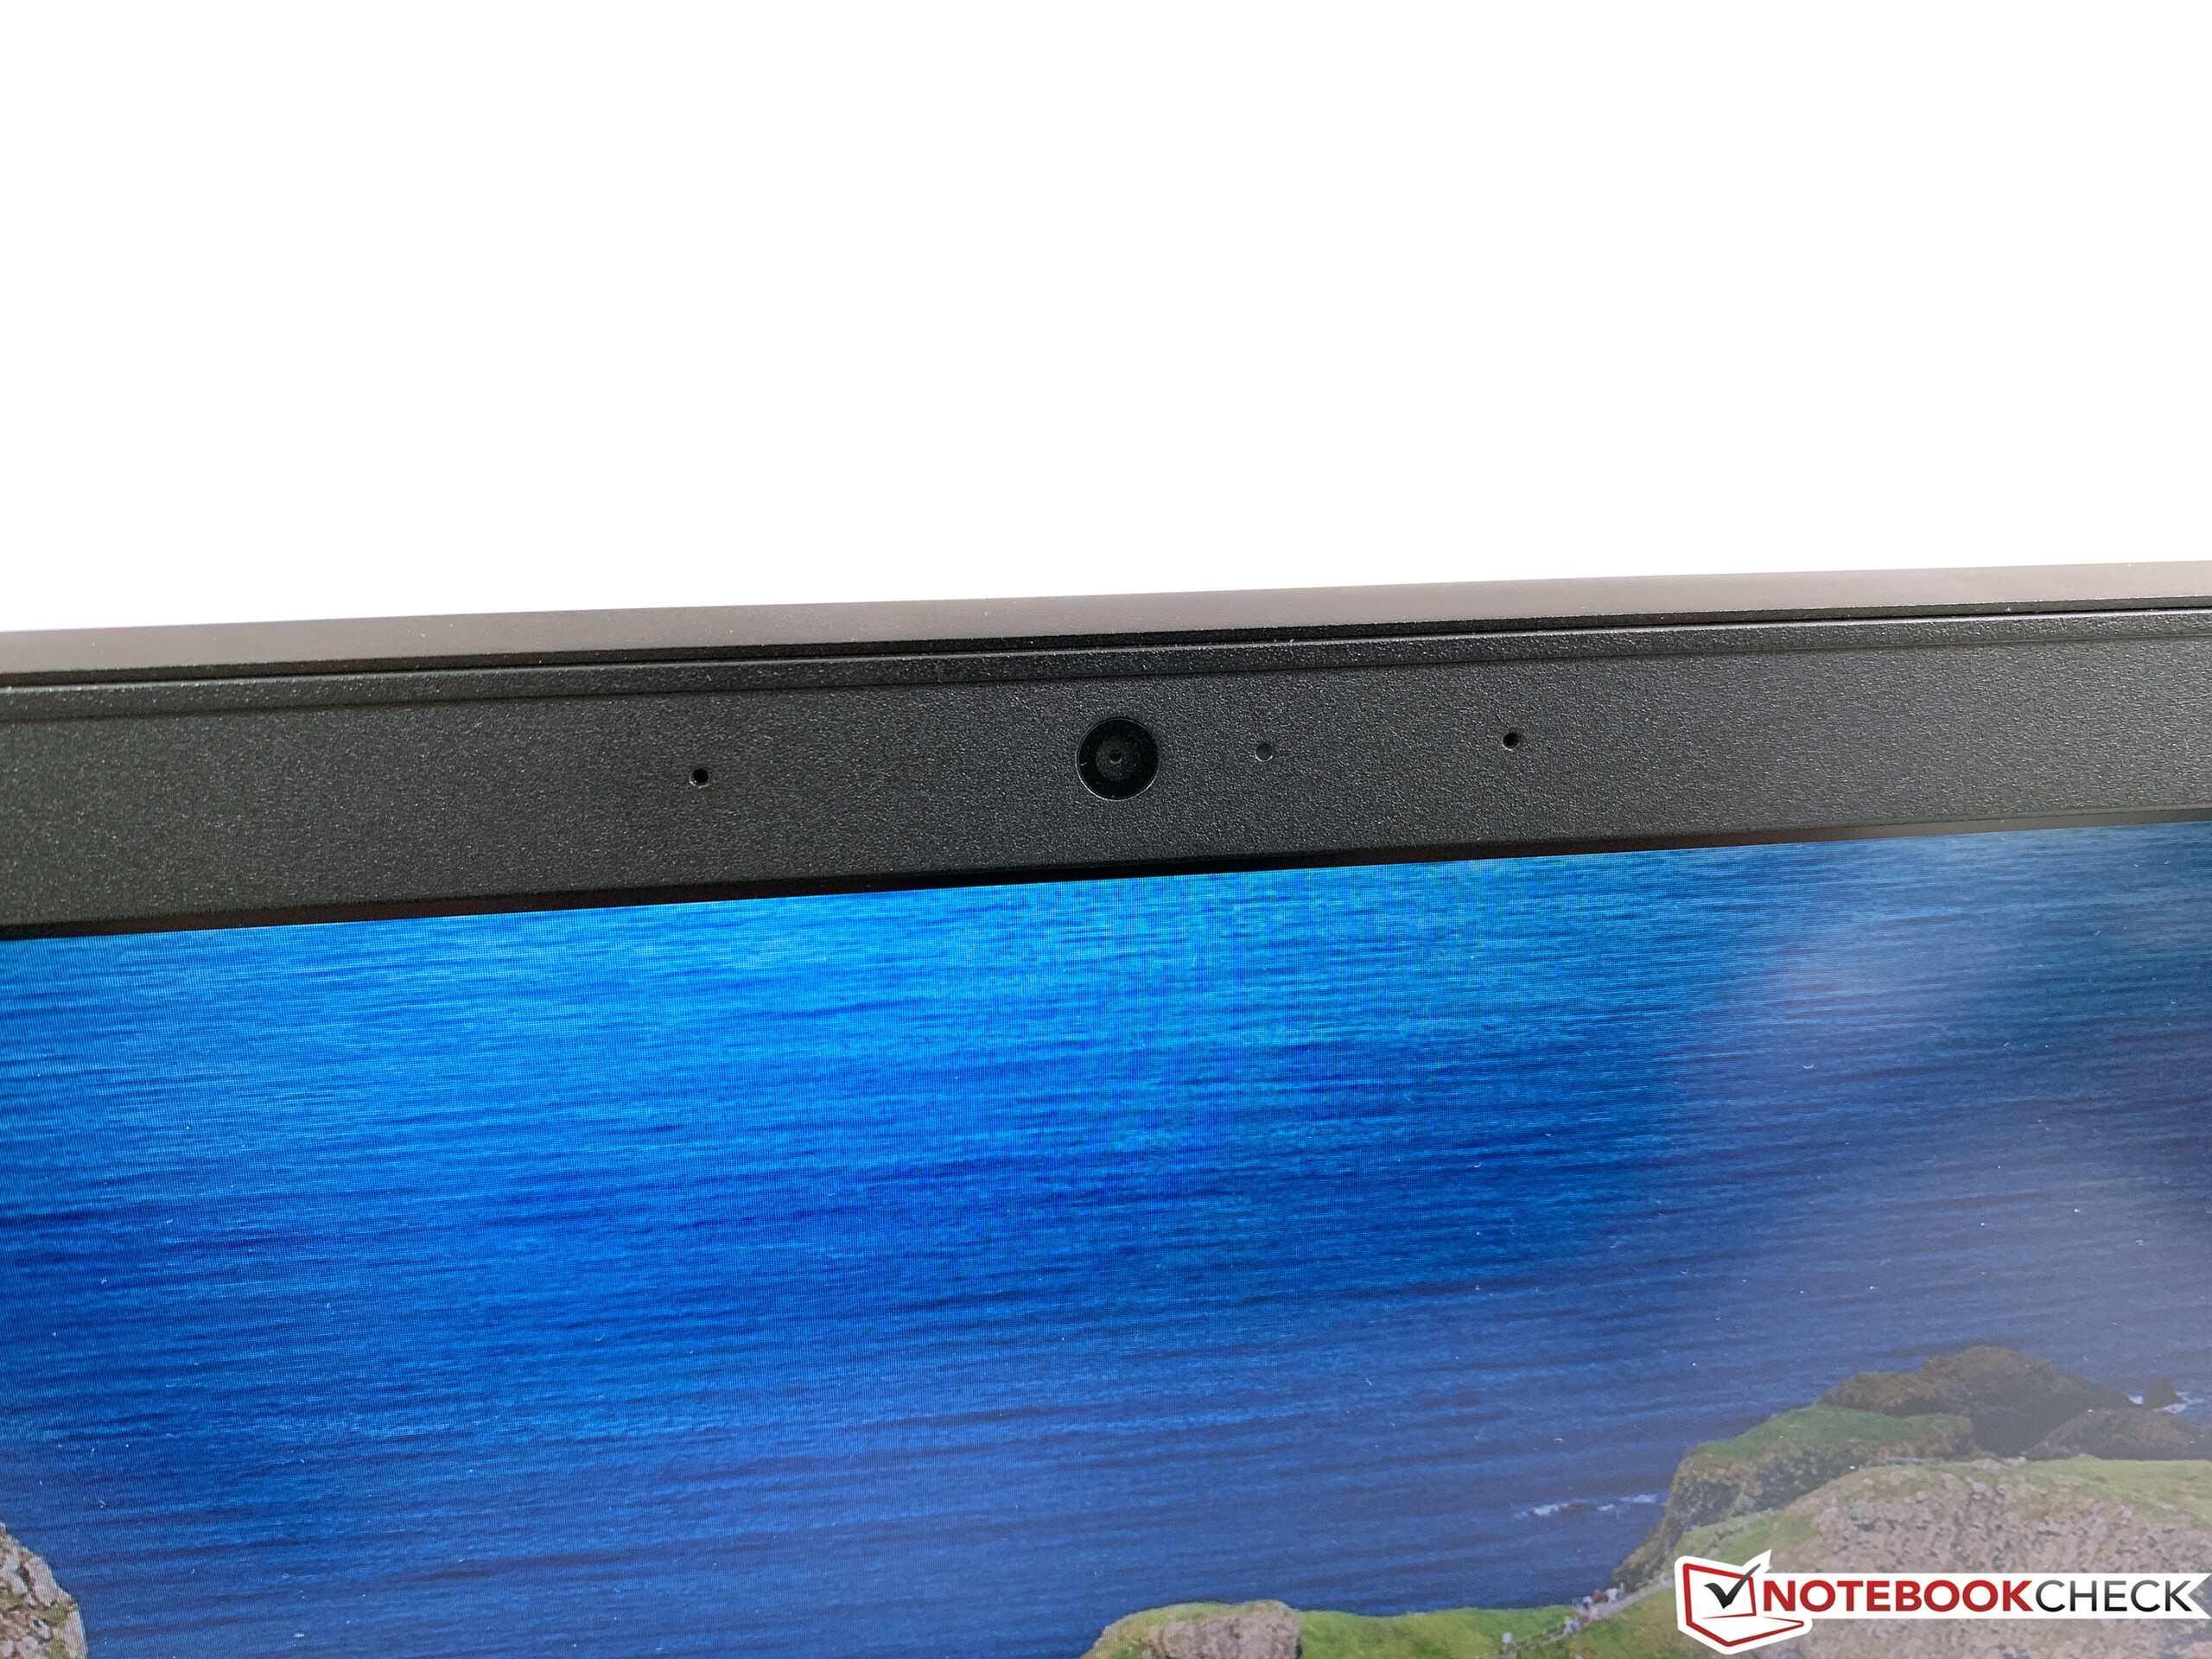
ThinkPad E485还提供了一系列优势,而这个优惠价格在这个价格范围内并不是特定的。该处理器为大多数任务提供了足够的性能,并且由于三星的快速SSD,您可以期待在日常操作中具有快速的响应能力。此外,它还有一个不错的IPS显示屏(但是,根据供应商的不同,可能会有一些小的差异)。基于其较低的售价,我们还是可以推荐E485的。
更新:不幸的是,Innolux屏幕在我们的测试中比AU Optronics的模型更糟糕,特别是在亮度方面。使用Innolux屏幕,整体评估分数将从86.4降至85.8%。不幸的是,您在购买设备时对所使用的屏幕面板没有任何知情权,您需要“抽奖”。
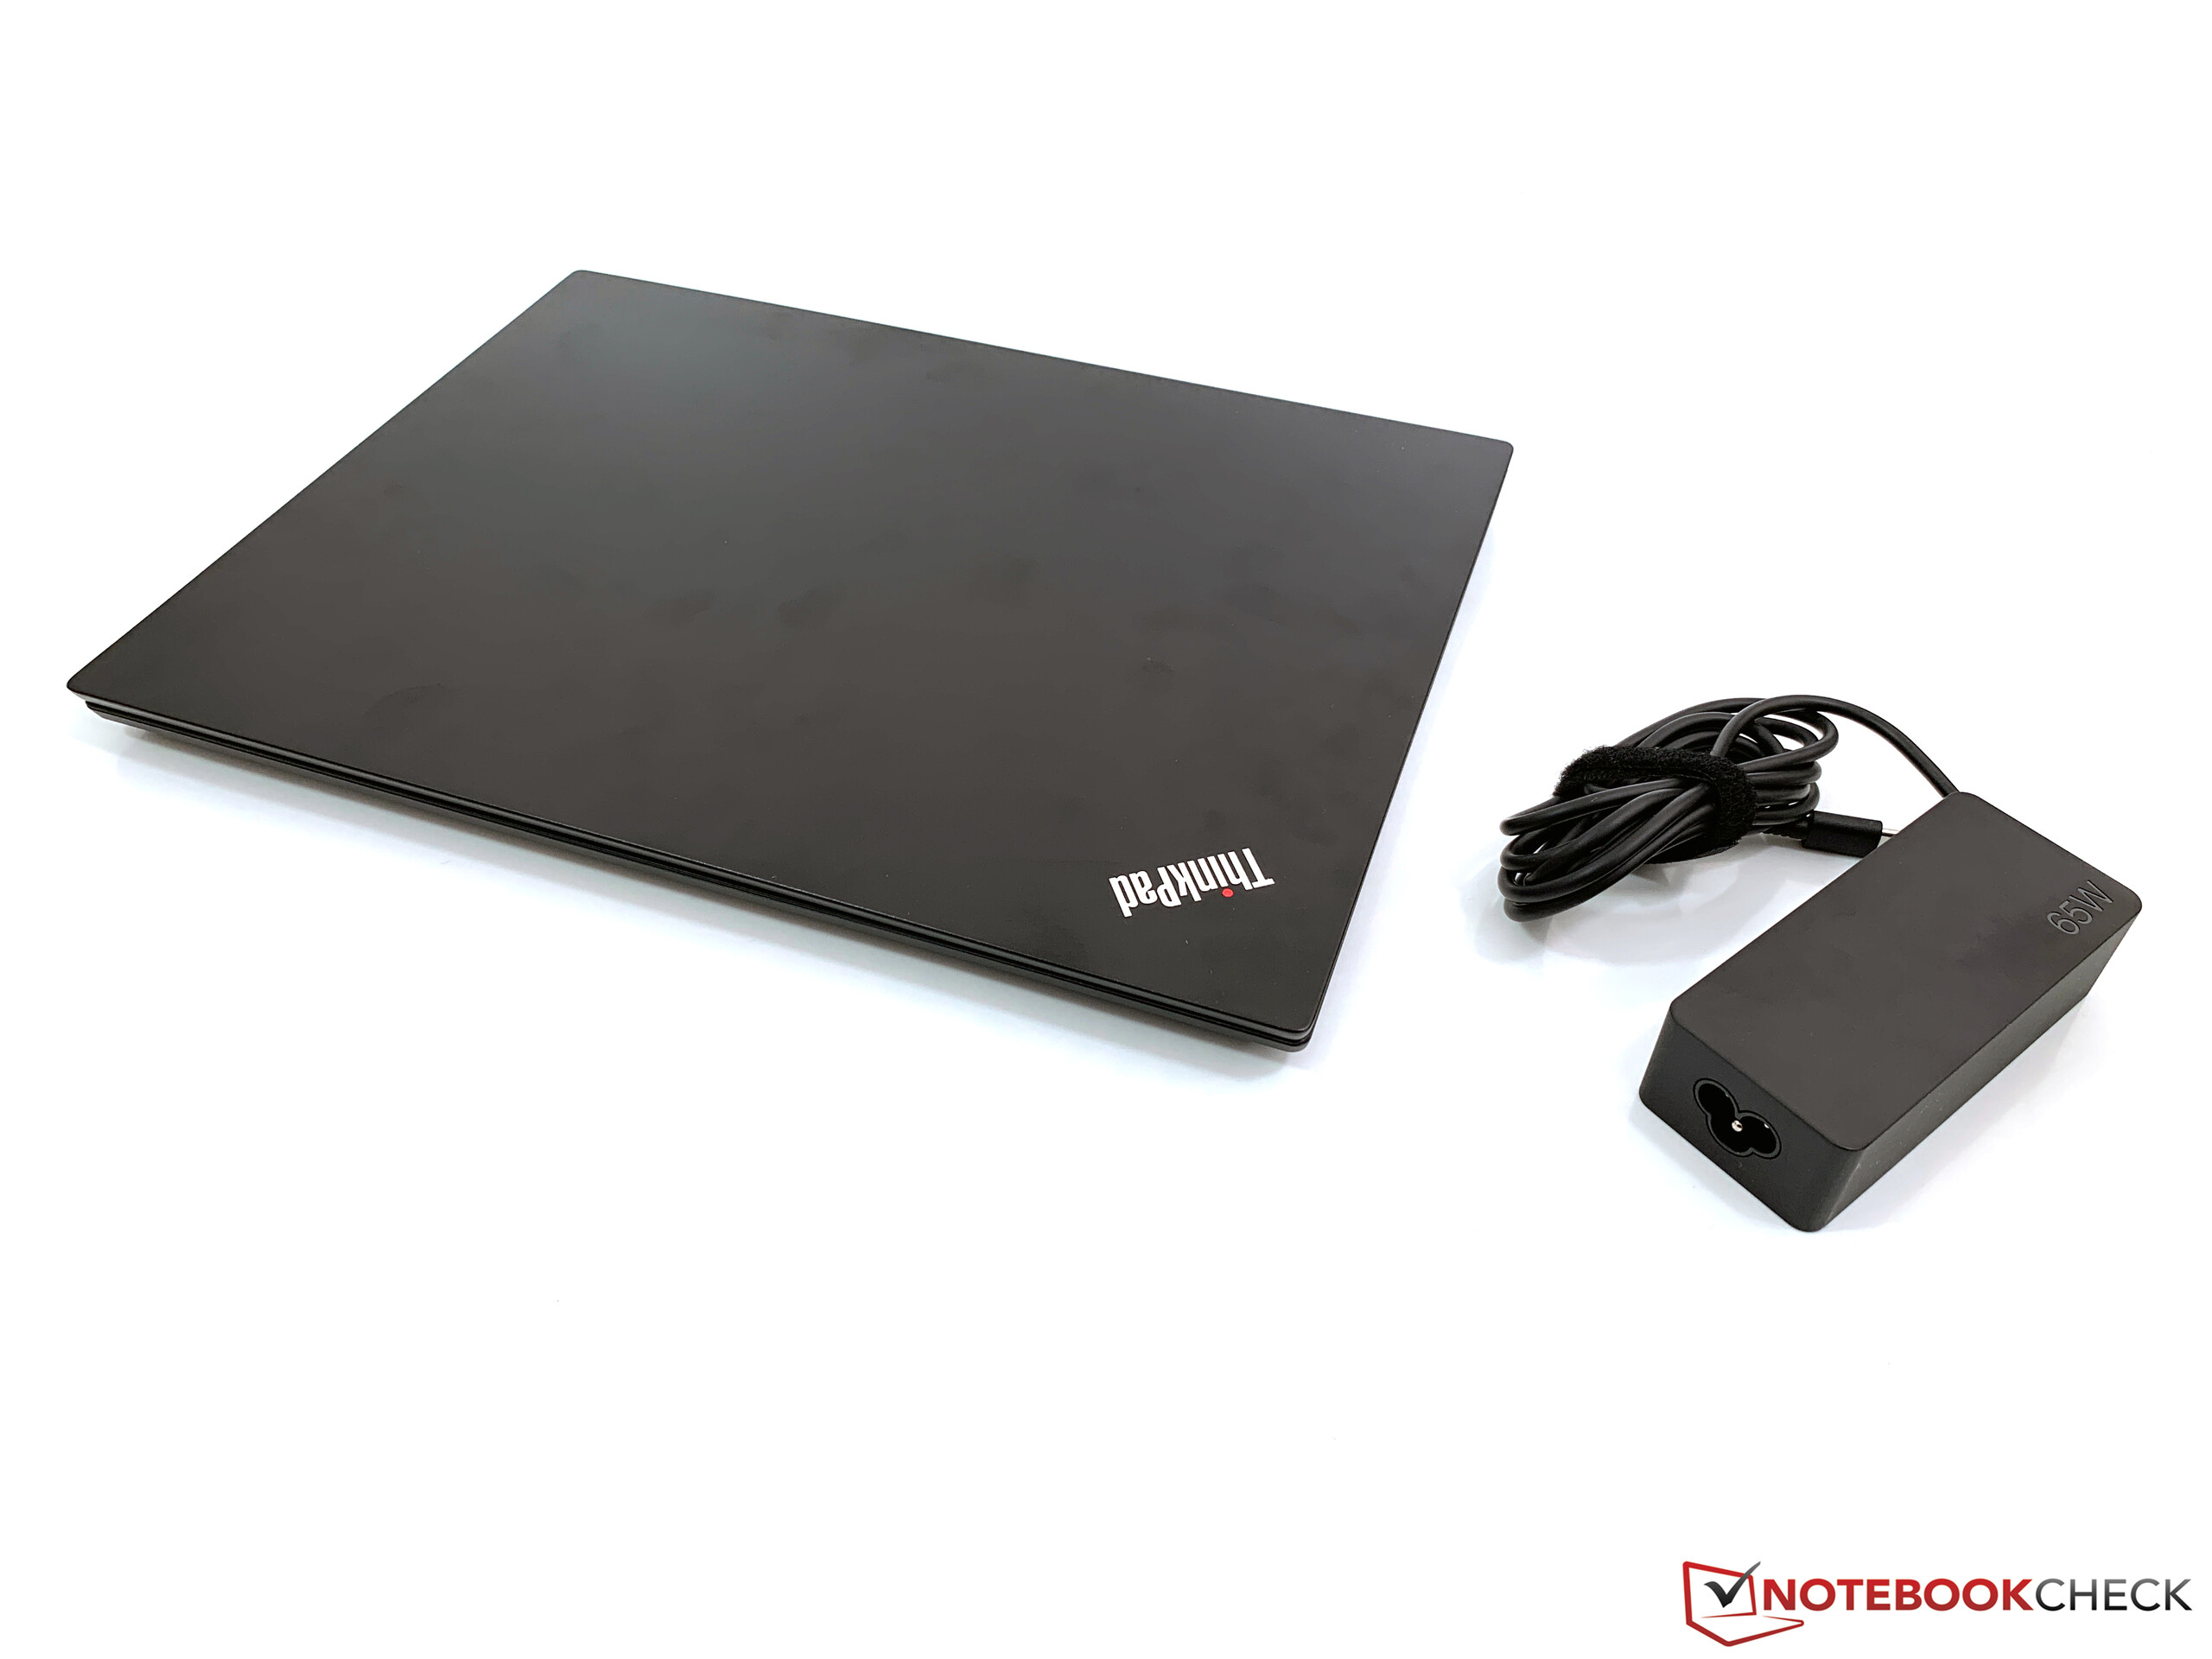
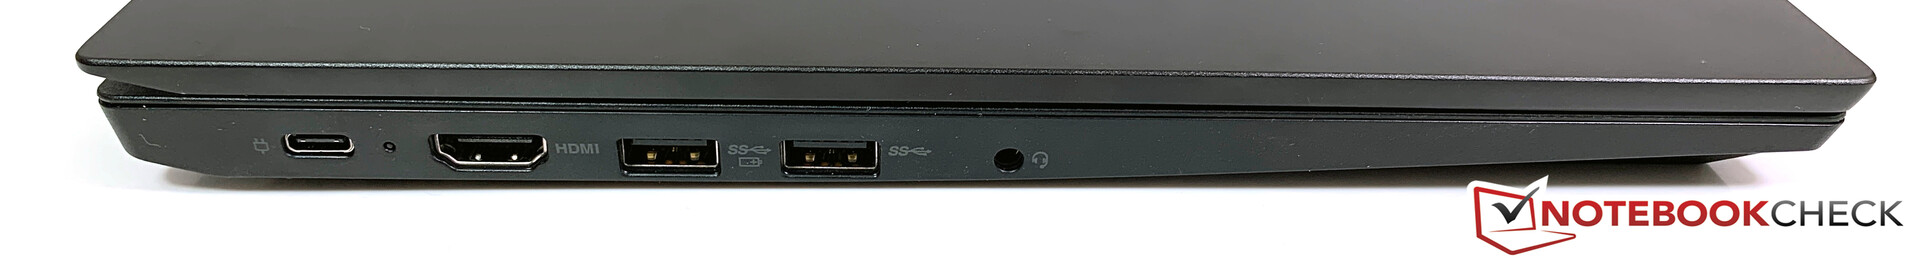
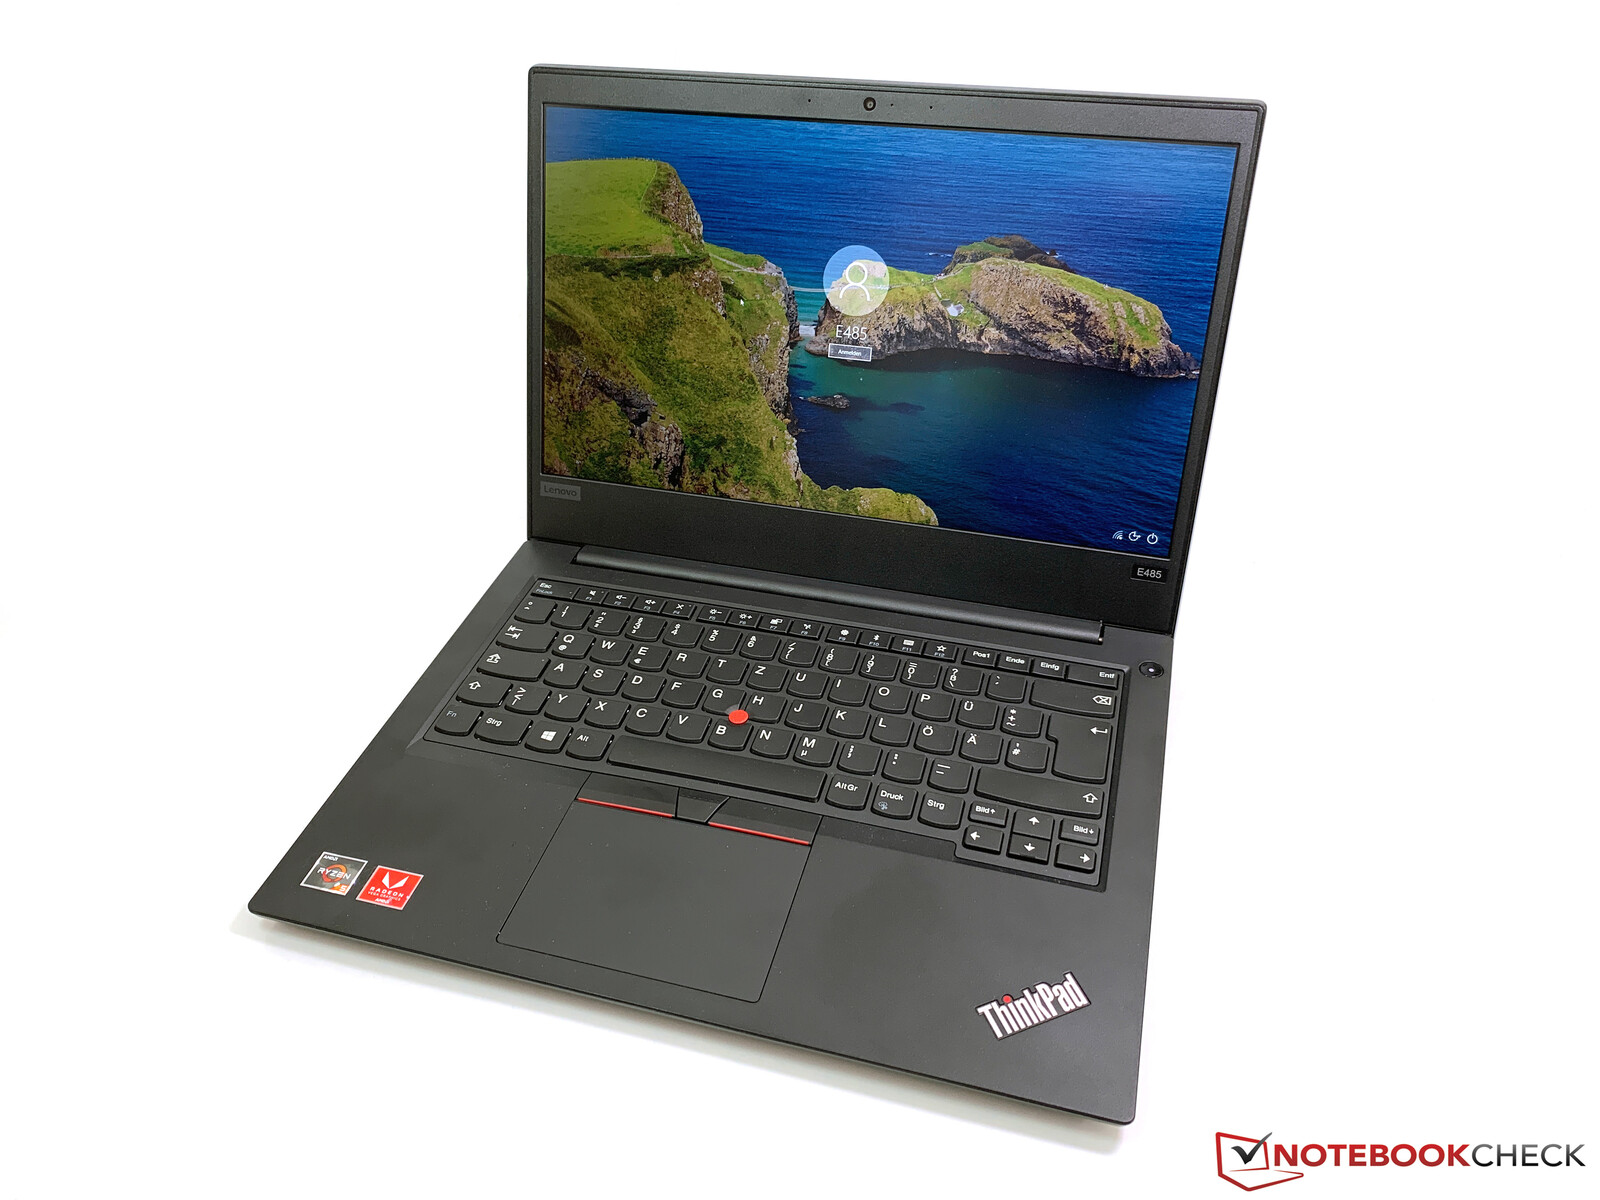
Lenovo ThinkPad E485-20KU000NGE
- 04/05/2019 v6 (old)
Andreas Osthoff
Price comparison

