Oppo Reno3智能手机评测:摄像头多还不贵

Comparison devices
Bewertung | Rating Version | Datum | Modell | Gewicht | Laufwerk | Groesse | Aufloesung | Preis ab |
|---|---|---|---|---|---|---|---|---|
| 80.1 % v7 (old) | v7 (old) | 08 / 2020 | Oppo Reno3 Helio P90, PowerVR GM9446 | 170 g | 128 GB UFS 2.1 Flash | 6.40" | 2400x1080 | |
| 81.2 % v7 (old) | v7 (old) | 10 / 2019 | Oppo Reno2 SD 730G, Adreno 618 | 189 g | 256 GB UFS 2.0 Flash | 6.50" | 2400x1080 | |
| 81.6 % v7 (old) | v7 (old) | 09 / 2019 | Xiaomi Mi 9T SD 730, Adreno 618 | 191 g | 64 GB UFS 2.0 Flash | 6.39" | 2340x1080 | |
| 80.3 % v7 (old) | v7 (old) | 12 / 2019 | Motorola One Hyper SD 675, Adreno 612 | 210 g | 128 GB UFS 2.0 Flash | 6.50" | 2340x1080 |


| Networking | |
| iperf3 transmit AX12 | |
| Oppo Reno2 | |
| Oppo Reno3 | |
| Motorola One Hyper | |
| Xiaomi Mi 9T | |
| iperf3 receive AX12 | |
| Oppo Reno2 | |
| Oppo Reno3 | |
| Motorola One Hyper | |
| Xiaomi Mi 9T | |


| |||||||||||||||||||||||||
Brightness Distribution: 90 %
Center on Battery: 595 cd/m²
Contrast: ∞:1 (Black: 0 cd/m²)
ΔE ColorChecker Calman: 4.96 | ∀{0.5-29.43 Ø4.72}
ΔE Greyscale Calman: 4.2 | ∀{0.09-98 Ø4.97}
100% sRGB (Calman 2D)
Gamma: 2.307
CCT: 7072 K
| Oppo Reno3 AMOLED, 2400x1080, 6.4" | Oppo Reno2 AMOLED, 2400x1080, 6.5" | Xiaomi Mi 9T AMOLED, 2340x1080, 6.4" | Motorola One Hyper IPS, 2340x1080, 6.5" | |
|---|---|---|---|---|
| Response Times | 55% | 52% | -332% | |
| Response Time Grey 50% / Grey 80% * (ms) | 8 ? | 3.6 ? 55% | 4 ? 50% | 44 ? -450% |
| Response Time Black / White * (ms) | 7 ? | 3.2 ? 54% | 3.2 ? 54% | 22 ? -214% |
| PWM Frequency (Hz) | 136 | 260.4 ? | 245.1 ? | 2404 ? |
| Screen | 14% | 27% | -2% | |
| Brightness middle (cd/m²) | 595 | 679 14% | 589 -1% | 455 -24% |
| Brightness (cd/m²) | 598 | 683 14% | 589 -2% | 444 -26% |
| Brightness Distribution (%) | 90 | 98 9% | 96 7% | 78 -13% |
| Black Level * (cd/m²) | 0.53 | |||
| Colorchecker dE 2000 * | 4.96 | 3.5 29% | 2.5 50% | 3.86 22% |
| Colorchecker dE 2000 max. * | 8.54 | 6.8 20% | 4.9 43% | 6.59 23% |
| Greyscale dE 2000 * | 4.2 | 4.2 -0% | 1.6 62% | 4 5% |
| Gamma | 2.307 95% | 2.27 97% | 2.24 98% | 2.3 96% |
| CCT | 7072 92% | 6532 100% | 6544 99% | 7367 88% |
| Contrast (:1) | 858 | |||
| Total Average (Program / Settings) | 35% /
24% | 40% /
33% | -167% /
-85% |
* ... smaller is better
Display Response Times
| ↔ Response Time Black to White | ||
|---|---|---|
| 7 ms ... rise ↗ and fall ↘ combined | ↗ 4 ms rise | 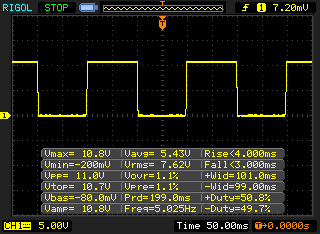 |
| ↘ 3 ms fall | ||
| The screen shows very fast response rates in our tests and should be very well suited for fast-paced gaming. In comparison, all tested devices range from 0.1 (minimum) to 240 (maximum) ms. » 21 % of all devices are better. This means that the measured response time is better than the average of all tested devices (19.8 ms). | ||
| ↔ Response Time 50% Grey to 80% Grey | ||
| 8 ms ... rise ↗ and fall ↘ combined | ↗ 3 ms rise | 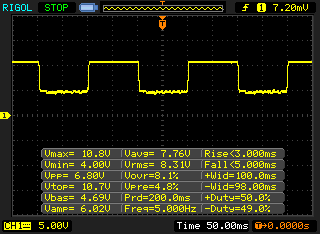 |
| ↘ 5 ms fall | ||
| The screen shows fast response rates in our tests and should be suited for gaming. In comparison, all tested devices range from 0.165 (minimum) to 636 (maximum) ms. » 21 % of all devices are better. This means that the measured response time is better than the average of all tested devices (31 ms). | ||
Screen Flickering / PWM (Pulse-Width Modulation)
| Screen flickering / PWM detected | 136 Hz | 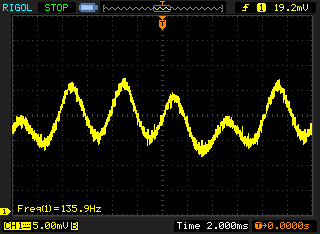 | |
The display backlight flickers at 136 Hz (worst case, e.g., utilizing PWM) . The frequency of 136 Hz is very low, so the flickering may cause eyestrain and headaches after extended use. In comparison: 52 % of all tested devices do not use PWM to dim the display. If PWM was detected, an average of 7769 (minimum: 5 - maximum: 343500) Hz was measured. | |||
| PCMark for Android | |
| Work performance score (sort by value) | |
| Oppo Reno3 | |
| Oppo Reno2 | |
| Xiaomi Mi 9T | |
| Motorola One Hyper | |
| Average Mediatek Helio P90 (8736 - 13156, n=2) | |
| Work 2.0 performance score (sort by value) | |
| Oppo Reno3 | |
| Oppo Reno2 | |
| Xiaomi Mi 9T | |
| Motorola One Hyper | |
| Average Mediatek Helio P90 (7129 - 9654, n=3) | |
| GFXBench | |
| on screen Aztec Ruins Normal Tier Onscreen (sort by value) | |
| Oppo Reno3 | |
| Oppo Reno2 | |
| Xiaomi Mi 9T | |
| Motorola One Hyper | |
| Average Mediatek Helio P90 (6.5 - 9.3, n=3) | |
| Average of class Smartphone (6.2 - 166, n=194, last 2 years) | |
| 1920x1080 Aztec Ruins Normal Tier Offscreen (sort by value) | |
| Oppo Reno3 | |
| Oppo Reno2 | |
| Xiaomi Mi 9T | |
| Motorola One Hyper | |
| Average Mediatek Helio P90 (6.4 - 11, n=3) | |
| Average of class Smartphone (3.4 - 378, n=194, last 2 years) | |
| on screen Aztec Ruins High Tier Onscreen (sort by value) | |
| Oppo Reno3 | |
| Oppo Reno2 | |
| Xiaomi Mi 9T | |
| Motorola One Hyper | |
| Average Mediatek Helio P90 (3.5 - 5.8, n=3) | |
| Average of class Smartphone (3.7 - 144, n=195, last 2 years) | |
| 2560x1440 Aztec Ruins High Tier Offscreen (sort by value) | |
| Oppo Reno3 | |
| Oppo Reno2 | |
| Xiaomi Mi 9T | |
| Motorola One Hyper | |
| Average Mediatek Helio P90 (2.4 - 4.3, n=3) | |
| Average of class Smartphone (1.2 - 151, n=194, last 2 years) | |
| Oppo Reno3 | Oppo Reno2 | Xiaomi Mi 9T | Motorola One Hyper | Average 128 GB UFS 2.1 Flash | Average of class Smartphone | |
|---|---|---|---|---|---|---|
| AndroBench 3-5 | 151% | -12% | 158% | 196% | 349% | |
| Sequential Read 256KB (MB/s) | 504 | 469.3 -7% | 492.7 -2% | 492.2 -2% | 762 ? 51% | 2250 ? 346% |
| Sequential Write 256KB (MB/s) | 227.3 | 201.8 -11% | 179.2 -21% | 190.8 -16% | 300 ? 32% | 1936 ? 752% |
| Random Read 4KB (MB/s) | 127.3 | 144.2 13% | 128.6 1% | 129.4 2% | 154.7 ? 22% | 311 ? 144% |
| Random Write 4KB (MB/s) | 143.9 | 22 -85% | 107.8 -25% | 106.9 -26% | 131.1 ? -9% | 363 ? 152% |
| Sequential Read 256KB SDCard (MB/s) | 13.4 ? | 74.5 ? 456% | 74.3 ? 454% | 76 ? 467% | ||
| Sequential Write 256KB SDCard (MB/s) | 8.4 ? | 53.5 ? 537% | 53.6 ? 538% | 59.6 ? 610% |
(-) The maximum temperature on the upper side is 45.3 °C / 114 F, compared to the average of 35.3 °C / 96 F, ranging from 21.9 to 247 °C for the class Smartphone.
(±) The bottom heats up to a maximum of 43.8 °C / 111 F, compared to the average of 34 °C / 93 F
(+) In idle usage, the average temperature for the upper side is 29.1 °C / 84 F, compared to the device average of 33 °C / 91 F.
Oppo Reno3 audio analysis
(+) | speakers can play relatively loud (82.5 dB)
Bass 100 - 315 Hz
(-) | nearly no bass - on average 65.6% lower than median
(+) | bass is linear (0% delta to prev. frequency)
Mids 400 - 2000 Hz
(-) | nearly no mids - on average 65.6% lower than median
(+) | mids are linear (0% delta to prev. frequency)
Highs 2 - 16 kHz
(-) | nearly no highs - on average 65.6% lower than median
(+) | highs are linear (0% delta to prev. frequency)
Overall 100 - 16.000 Hz
(-) | overall sound is not linear (126.2% difference to median)
Compared to same class
» 96% of all tested devices in this class were better, 3% similar, 1% worse
» The best had a delta of 11%, average was 34%, worst was 134%
Compared to all devices tested
» 99% of all tested devices were better, 1% similar, 0% worse
» The best had a delta of 4%, average was 24%, worst was 134%
Oppo Reno2 audio analysis
(+) | speakers can play relatively loud (87.5 dB)
Bass 100 - 315 Hz
(-) | nearly no bass - on average 26.3% lower than median
(±) | linearity of bass is average (13.2% delta to prev. frequency)
Mids 400 - 2000 Hz
(+) | balanced mids - only 4.7% away from median
(+) | mids are linear (3.7% delta to prev. frequency)
Highs 2 - 16 kHz
(±) | higher highs - on average 7.7% higher than median
(+) | highs are linear (3.2% delta to prev. frequency)
Overall 100 - 16.000 Hz
(±) | linearity of overall sound is average (21.6% difference to median)
Compared to same class
» 43% of all tested devices in this class were better, 8% similar, 49% worse
» The best had a delta of 11%, average was 34%, worst was 134%
Compared to all devices tested
» 61% of all tested devices were better, 7% similar, 32% worse
» The best had a delta of 4%, average was 24%, worst was 134%
| Oppo Reno3 4025 mAh | Oppo Reno2 4000 mAh | Xiaomi Mi 9T 4000 mAh | Motorola One Hyper 4000 mAh | Average of class Smartphone | |
|---|---|---|---|---|---|
| Battery Runtime | |||||
| WiFi Websurfing (h) | 13.4 | 10.3 -23% | 16.5 23% | 12.6 -6% | 20.6 ? 54% |
Pros
Cons
总结——讨喜且耐用
Oppo Reno3已成为了一款不错的中端设备,可以以相对较低的价格买到四摄。 对Reno3有利的是,其前身目前在欧洲的价格甚至更高,因此尽管性能较低,但它仍可以很好地定位于中端。续航时间也比上一代更好,但屏幕亮度却不如以前。
扬声器令人信服,Oppo Reno3也是那些想要轻便的人眼中的好智能手机。您不应该期望众多的LTE频率,而PWM频率低的屏幕可能会成为某些用户的问题。
Oppo Reno3是中端机的不错选择。
尽管如此,Oppo Reno3对于那些想要很多相机和不错的续航并且不想花太多钱的人来说是一个不错的选择。
Oppo Reno3
- 09/03/2022 v7 (old)
Florian Schmitt
Price comparison
