华为Mate 20 X智能手机评测


| |||||||||||||||||||||||||
Brightness Distribution: 96 %
Center on Battery: 421 cd/m²
Contrast: ∞:1 (Black: 0 cd/m²)
ΔE ColorChecker Calman: 1.1 | ∀{0.5-29.43 Ø4.73}
ΔE Greyscale Calman: 1.4 | ∀{0.09-98 Ø4.97}
97.4% sRGB (Calman 2D)
Gamma: 2.23
CCT: 6723 K
| Huawei Mate 20 X OLED, 2244x1080, 7.2" | Xiaomi Mi Max 3 IPS, 2160x1080, 6.9" | Huawei Mate 20 Pro OLED, 3120x1440, 6.3" | Google Pixel 3 XL AMOLED, 2960x1440, 6.3" | Apple iPhone Xs Max OLED, 2688x1242, 6.5" | Samsung Galaxy Note 9 Super AMOLED, 2960x1440, 6.4" | |
|---|---|---|---|---|---|---|
| Screen | -54% | -4% | -60% | 1% | -122% | |
| Brightness middle (cd/m²) | 421 | 508 21% | 576 37% | 410 -3% | 656 56% | 499 19% |
| Brightness (cd/m²) | 418 | 505 21% | 582 39% | 413 -1% | 659 58% | 506 21% |
| Brightness Distribution (%) | 96 | 91 -5% | 90 -6% | 97 1% | 88 -8% | 96 0% |
| Black Level * (cd/m²) | 0.28 | |||||
| Colorchecker dE 2000 * | 1.1 | 2.85 -159% | 1.3 -18% | 3.16 -187% | 1.7 -55% | 4.62 -320% |
| Colorchecker dE 2000 max. * | 2.2 | 6.21 -182% | 3.5 -59% | 5.5 -150% | 2.8 -27% | 10.91 -396% |
| Greyscale dE 2000 * | 1.4 | 1.7 -21% | 1.6 -14% | 1.7 -21% | 1.7 -21% | 2.2 -57% |
| Gamma | 2.23 99% | 2.226 99% | 2.18 101% | 2.219 99% | 1.998 110% | 2.103 105% |
| CCT | 6723 97% | 6860 95% | 6561 99% | 6653 98% | 6487 100% | 6115 106% |
| Contrast (:1) | 1814 |
* ... smaller is better
Screen Flickering / PWM (Pulse-Width Modulation)
| Screen flickering / PWM detected | 242.7 Hz | ≤ 99 % brightness setting | 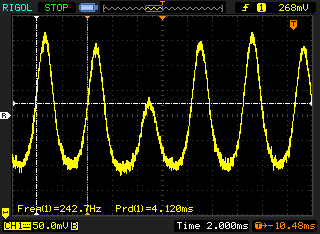 |
The display backlight flickers at 242.7 Hz (worst case, e.g., utilizing PWM) Flickering detected at a brightness setting of 99 % and below. There should be no flickering or PWM above this brightness setting. The frequency of 242.7 Hz is relatively low, so sensitive users will likely notice flickering and experience eyestrain at the stated brightness setting and below. In comparison: 52 % of all tested devices do not use PWM to dim the display. If PWM was detected, an average of 7794 (minimum: 5 - maximum: 343500) Hz was measured. | |||
Display Response Times
| ↔ Response Time Black to White | ||
|---|---|---|
| 3.2 ms ... rise ↗ and fall ↘ combined | ↗ 1.2 ms rise | 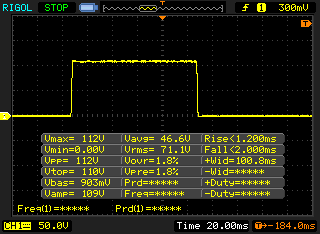 |
| ↘ 2 ms fall | ||
| The screen shows very fast response rates in our tests and should be very well suited for fast-paced gaming. In comparison, all tested devices range from 0.1 (minimum) to 240 (maximum) ms. » 15 % of all devices are better. This means that the measured response time is better than the average of all tested devices (19.9 ms). | ||
| ↔ Response Time 50% Grey to 80% Grey | ||
| 3.6 ms ... rise ↗ and fall ↘ combined | ↗ 2 ms rise | 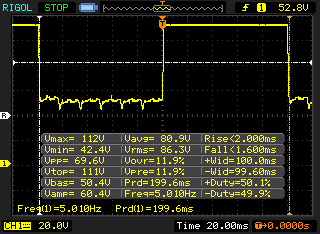 |
| ↘ 1.6 ms fall | ||
| The screen shows very fast response rates in our tests and should be very well suited for fast-paced gaming. In comparison, all tested devices range from 0.165 (minimum) to 636 (maximum) ms. » 14 % of all devices are better. This means that the measured response time is better than the average of all tested devices (31.1 ms). | ||
| PCMark for Android | |
| Work performance score (sort by value) | |
| Huawei Mate 20 X | |
| Xiaomi Mi Max 3 | |
| Huawei Mate 20 Pro | |
| Google Pixel 3 XL | |
| Samsung Galaxy Note 9 | |
| Average HiSilicon Kirin 980 (9728 - 13531, n=10) | |
| Work 2.0 performance score (sort by value) | |
| Huawei Mate 20 X | |
| Xiaomi Mi Max 3 | |
| Huawei Mate 20 Pro | |
| Google Pixel 3 XL | |
| Samsung Galaxy Note 9 | |
| Average HiSilicon Kirin 980 (7567 - 9326, n=10) | |
| AnTuTu v7 - Total Score (sort by value) | |
| Huawei Mate 20 X | |
| Xiaomi Mi Max 3 | |
| Huawei Mate 20 Pro | |
| Google Pixel 3 XL | |
| Apple iPhone Xs Max | |
| Samsung Galaxy Note 9 | |
| Average HiSilicon Kirin 980 (268359 - 322616, n=10) | |
| AnTuTu v6 - Total Score (sort by value) | |
| Huawei Mate 20 X | |
| Xiaomi Mi Max 3 | |
| Huawei Mate 20 Pro | |
| Google Pixel 3 XL | |
| Samsung Galaxy Note 9 | |
| Average HiSilicon Kirin 980 (245662 - 254229, n=9) | |
| JetStream 1.1 - 1.1 Total | |
| Apple iPhone Xs Max (Safari 12) | |
| Huawei Mate 20 Pro (Chrome 69) | |
| Average HiSilicon Kirin 980 (93.2 - 109.9, n=9) | |
| Huawei Mate 20 X (hrome 71) | |
| Google Pixel 3 XL (Chrome 70) | |
| Samsung Galaxy Note 9 (Chrome 68) | |
| Xiaomi Mi Max 3 (Chrome 69) | |
| Octane V2 - Total Score | |
| Average of class Smartphone (2800 - 126661, n=157, last 2 years) | |
| Apple iPhone Xs Max (Safari 12) | |
| Huawei Mate 20 Pro (Chrome 69) | |
| Average HiSilicon Kirin 980 (20618 - 23285, n=10) | |
| Huawei Mate 20 X (hrome 71) | |
| Google Pixel 3 XL (Chrome 70) | |
| Samsung Galaxy Note 9 (Chrome 68) | |
| Xiaomi Mi Max 3 (Chrome 69) | |
| Mozilla Kraken 1.1 - Total | |
| Xiaomi Mi Max 3 (Chrome 69) | |
| Google Pixel 3 XL (Chrome 70) | |
| Samsung Galaxy Note 9 (Chrome 68) | |
| Average HiSilicon Kirin 980 (1948 - 3098, n=10) | |
| Huawei Mate 20 X (hrome 71) | |
| Huawei Mate 20 Pro (Chrome 69) | |
| Average of class Smartphone (257 - 28190, n=135, last 2 years) | |
| Apple iPhone Xs Max (Safari 12) | |
| WebXPRT 3 - Overall | |
| Average of class Smartphone (104 - 380, n=12, last 2 years) | |
| Apple iPhone Xs Max (Safari 12) | |
| Huawei Mate 20 Pro (Chrome 69) | |
| Average HiSilicon Kirin 980 (86 - 124, n=10) | |
| Google Pixel 3 XL (Chrome 70) | |
| Huawei Mate 20 X (hrome 71) | |
| Samsung Galaxy Note 9 (Chrome 68) | |
| WebXPRT 2015 - Overall | |
| Apple iPhone Xs Max (Safari 12) | |
| Huawei Mate 20 Pro (Chrome 69) | |
| Google Pixel 3 XL (Chrome 70) | |
| Average HiSilicon Kirin 980 (228 - 334, n=5) | |
| Huawei Mate 20 X (hrome 71) | |
| Samsung Galaxy Note 9 (Chrome 68) | |
| Xiaomi Mi Max 3 (Chrome 69) | |
* ... smaller is better
| Huawei Mate 20 X | Xiaomi Mi Max 3 | Huawei Mate 20 Pro | Google Pixel 3 XL | Samsung Galaxy Note 9 | Average 128 GB UFS 2.1 Flash | Average of class Smartphone | |
|---|---|---|---|---|---|---|---|
| AndroBench 3-5 | -33% | -4% | -17% | -20% | -3% | 318% | |
| Sequential Read 256KB (MB/s) | 912 | 274.6 -70% | 853 -6% | 633 -31% | 805 -12% | 762 ? -16% | 2251 ? 147% |
| Sequential Write 256KB (MB/s) | 182.7 | 185.4 1% | 196.4 7% | 228.6 25% | 196 7% | 300 ? 64% | 1932 ? 957% |
| Random Read 4KB (MB/s) | 144.4 | 72.9 -50% | 157.4 9% | 120.8 -16% | 134 -7% | 154.7 ? 7% | 310 ? 115% |
| Random Write 4KB (MB/s) | 237.6 | 87.1 -63% | 157.8 -34% | 132.7 -44% | 21 -91% | 131.1 ? -45% | 362 ? 52% |
| Sequential Read 256KB SDCard (MB/s) | 83.1 ? | 83.8 ? 1% | 83.2 ? 0% | 77 ? -7% | 76 ? -9% | ||
| Sequential Write 256KB SDCard (MB/s) | 72 ? | 60.3 ? -16% | 72.4 ? 1% | 66.7 ? -7% | 59.6 ? -17% |
Arena of Valor
Asphalt 9: Legends
(+) The maximum temperature on the upper side is 33.6 °C / 92 F, compared to the average of 35.3 °C / 96 F, ranging from 21.9 to 247 °C for the class Smartphone.
(+) The bottom heats up to a maximum of 34.7 °C / 94 F, compared to the average of 34 °C / 93 F
(+) In idle usage, the average temperature for the upper side is 27.4 °C / 81 F, compared to the device average of 32.9 °C / 91 F.
Huawei Mate 20 X audio analysis
(+) | speakers can play relatively loud (84.1 dB)
Bass 100 - 315 Hz
(-) | nearly no bass - on average 17.3% lower than median
(±) | linearity of bass is average (13.8% delta to prev. frequency)
Mids 400 - 2000 Hz
(±) | higher mids - on average 5.7% higher than median
(+) | mids are linear (4.6% delta to prev. frequency)
Highs 2 - 16 kHz
(±) | higher highs - on average 7.1% higher than median
(+) | highs are linear (5.8% delta to prev. frequency)
Overall 100 - 16.000 Hz
(±) | linearity of overall sound is average (20.2% difference to median)
Compared to same class
» 34% of all tested devices in this class were better, 9% similar, 57% worse
» The best had a delta of 11%, average was 34%, worst was 134%
Compared to all devices tested
» 52% of all tested devices were better, 8% similar, 39% worse
» The best had a delta of 4%, average was 24%, worst was 134%
Samsung Galaxy Note 9 audio analysis
(-) | not very loud speakers (71.6 dB)
Bass 100 - 315 Hz
(-) | nearly no bass - on average 15.6% lower than median
(±) | linearity of bass is average (10.1% delta to prev. frequency)
Mids 400 - 2000 Hz
(+) | balanced mids - only 2.9% away from median
(+) | mids are linear (4.3% delta to prev. frequency)
Highs 2 - 16 kHz
(+) | balanced highs - only 1.6% away from median
(+) | highs are linear (5.7% delta to prev. frequency)
Overall 100 - 16.000 Hz
(±) | linearity of overall sound is average (16.2% difference to median)
Compared to same class
» 6% of all tested devices in this class were better, 5% similar, 89% worse
» The best had a delta of 11%, average was 34%, worst was 134%
Compared to all devices tested
» 26% of all tested devices were better, 6% similar, 68% worse
» The best had a delta of 4%, average was 24%, worst was 134%
| Off / Standby | |
| Idle | |
| Load |
|
Key:
min: | |
| Huawei Mate 20 X 5000 mAh | Xiaomi Mi Max 3 5500 mAh | Huawei Mate 20 Pro 4200 mAh | Google Pixel 3 XL 3430 mAh | Apple iPhone Xs Max 3174 mAh | Samsung Galaxy Note 9 4000 mAh | Average HiSilicon Kirin 980 | Average of class Smartphone | |
|---|---|---|---|---|---|---|---|---|
| Power Consumption | 14% | -2% | 8% | 10% | -20% | -3% | -5% | |
| Idle Minimum * (Watt) | 0.79 | 0.7 11% | 0.95 -20% | 0.7 11% | 1 -27% | 0.9 -14% | 0.802 ? -2% | 0.875 ? -11% |
| Idle Average * (Watt) | 1.72 | 1.5 13% | 2.17 -26% | 1.4 19% | 1.4 19% | 1.9 -10% | 2.07 ? -20% | 1.47 ? 15% |
| Idle Maximum * (Watt) | 1.83 | 2.2 -20% | 2.25 -23% | 2 -9% | 1.7 7% | 3.7 -102% | 2.37 ? -30% | 1.659 ? 9% |
| Load Average * (Watt) | 5.53 | 3.8 31% | 4.47 19% | 4.8 13% | 4.6 17% | 5.3 4% | 4.87 ? 12% | 6.8 ? -23% |
| Load Maximum * (Watt) | 9.85 | 6.5 34% | 6.15 38% | 9.5 4% | 6.7 32% | 7.6 23% | 7.46 ? 24% | 11.3 ? -15% |
* ... smaller is better
| Huawei Mate 20 X 5000 mAh | Xiaomi Mi Max 3 5500 mAh | Huawei Mate 20 Pro 4200 mAh | Google Pixel 3 XL 3430 mAh | Apple iPhone Xs Max 3174 mAh | Samsung Galaxy Note 9 4000 mAh | |
|---|---|---|---|---|---|---|
| Battery runtime | 66% | -8% | -13% | -21% | -1% | |
| Reader / Idle (h) | 33.1 | 29.1 -12% | 28.8 -13% | 21.8 -34% | 28.1 -15% | |
| H.264 (h) | 16.4 | 14.2 -13% | 12.1 -26% | 13.4 -18% | 14.9 -9% | |
| WiFi v1.3 (h) | 13.1 | 21.8 66% | 12.8 -2% | 11.5 -12% | 12.4 -5% | 13.2 1% |
| Load (h) | 5 | 4.7 -6% | 5 0% | 3.7 -26% | 5.9 18% |
Pros
Cons
华为Mate 20 X具有与其他Mate 20型号相同的讨喜品质。这款巨型智能平板手机具有出色的系统和存储性能,其相机则是一流的。此外,OLED屏幕令人印象深刻,LTE和Wi-Fi速度也是如此。
Mate 20 X缺乏Mate 20 Pro的独有功能,如3D面部识别,无线充电和40 W快充,这有些令人失望。屏幕亮度也较低也是另一个缺点。
“华为Mate 20 X是一款出色的旗舰级平板手机,其性能对于这种尺寸的设备而言是独一无二的。”
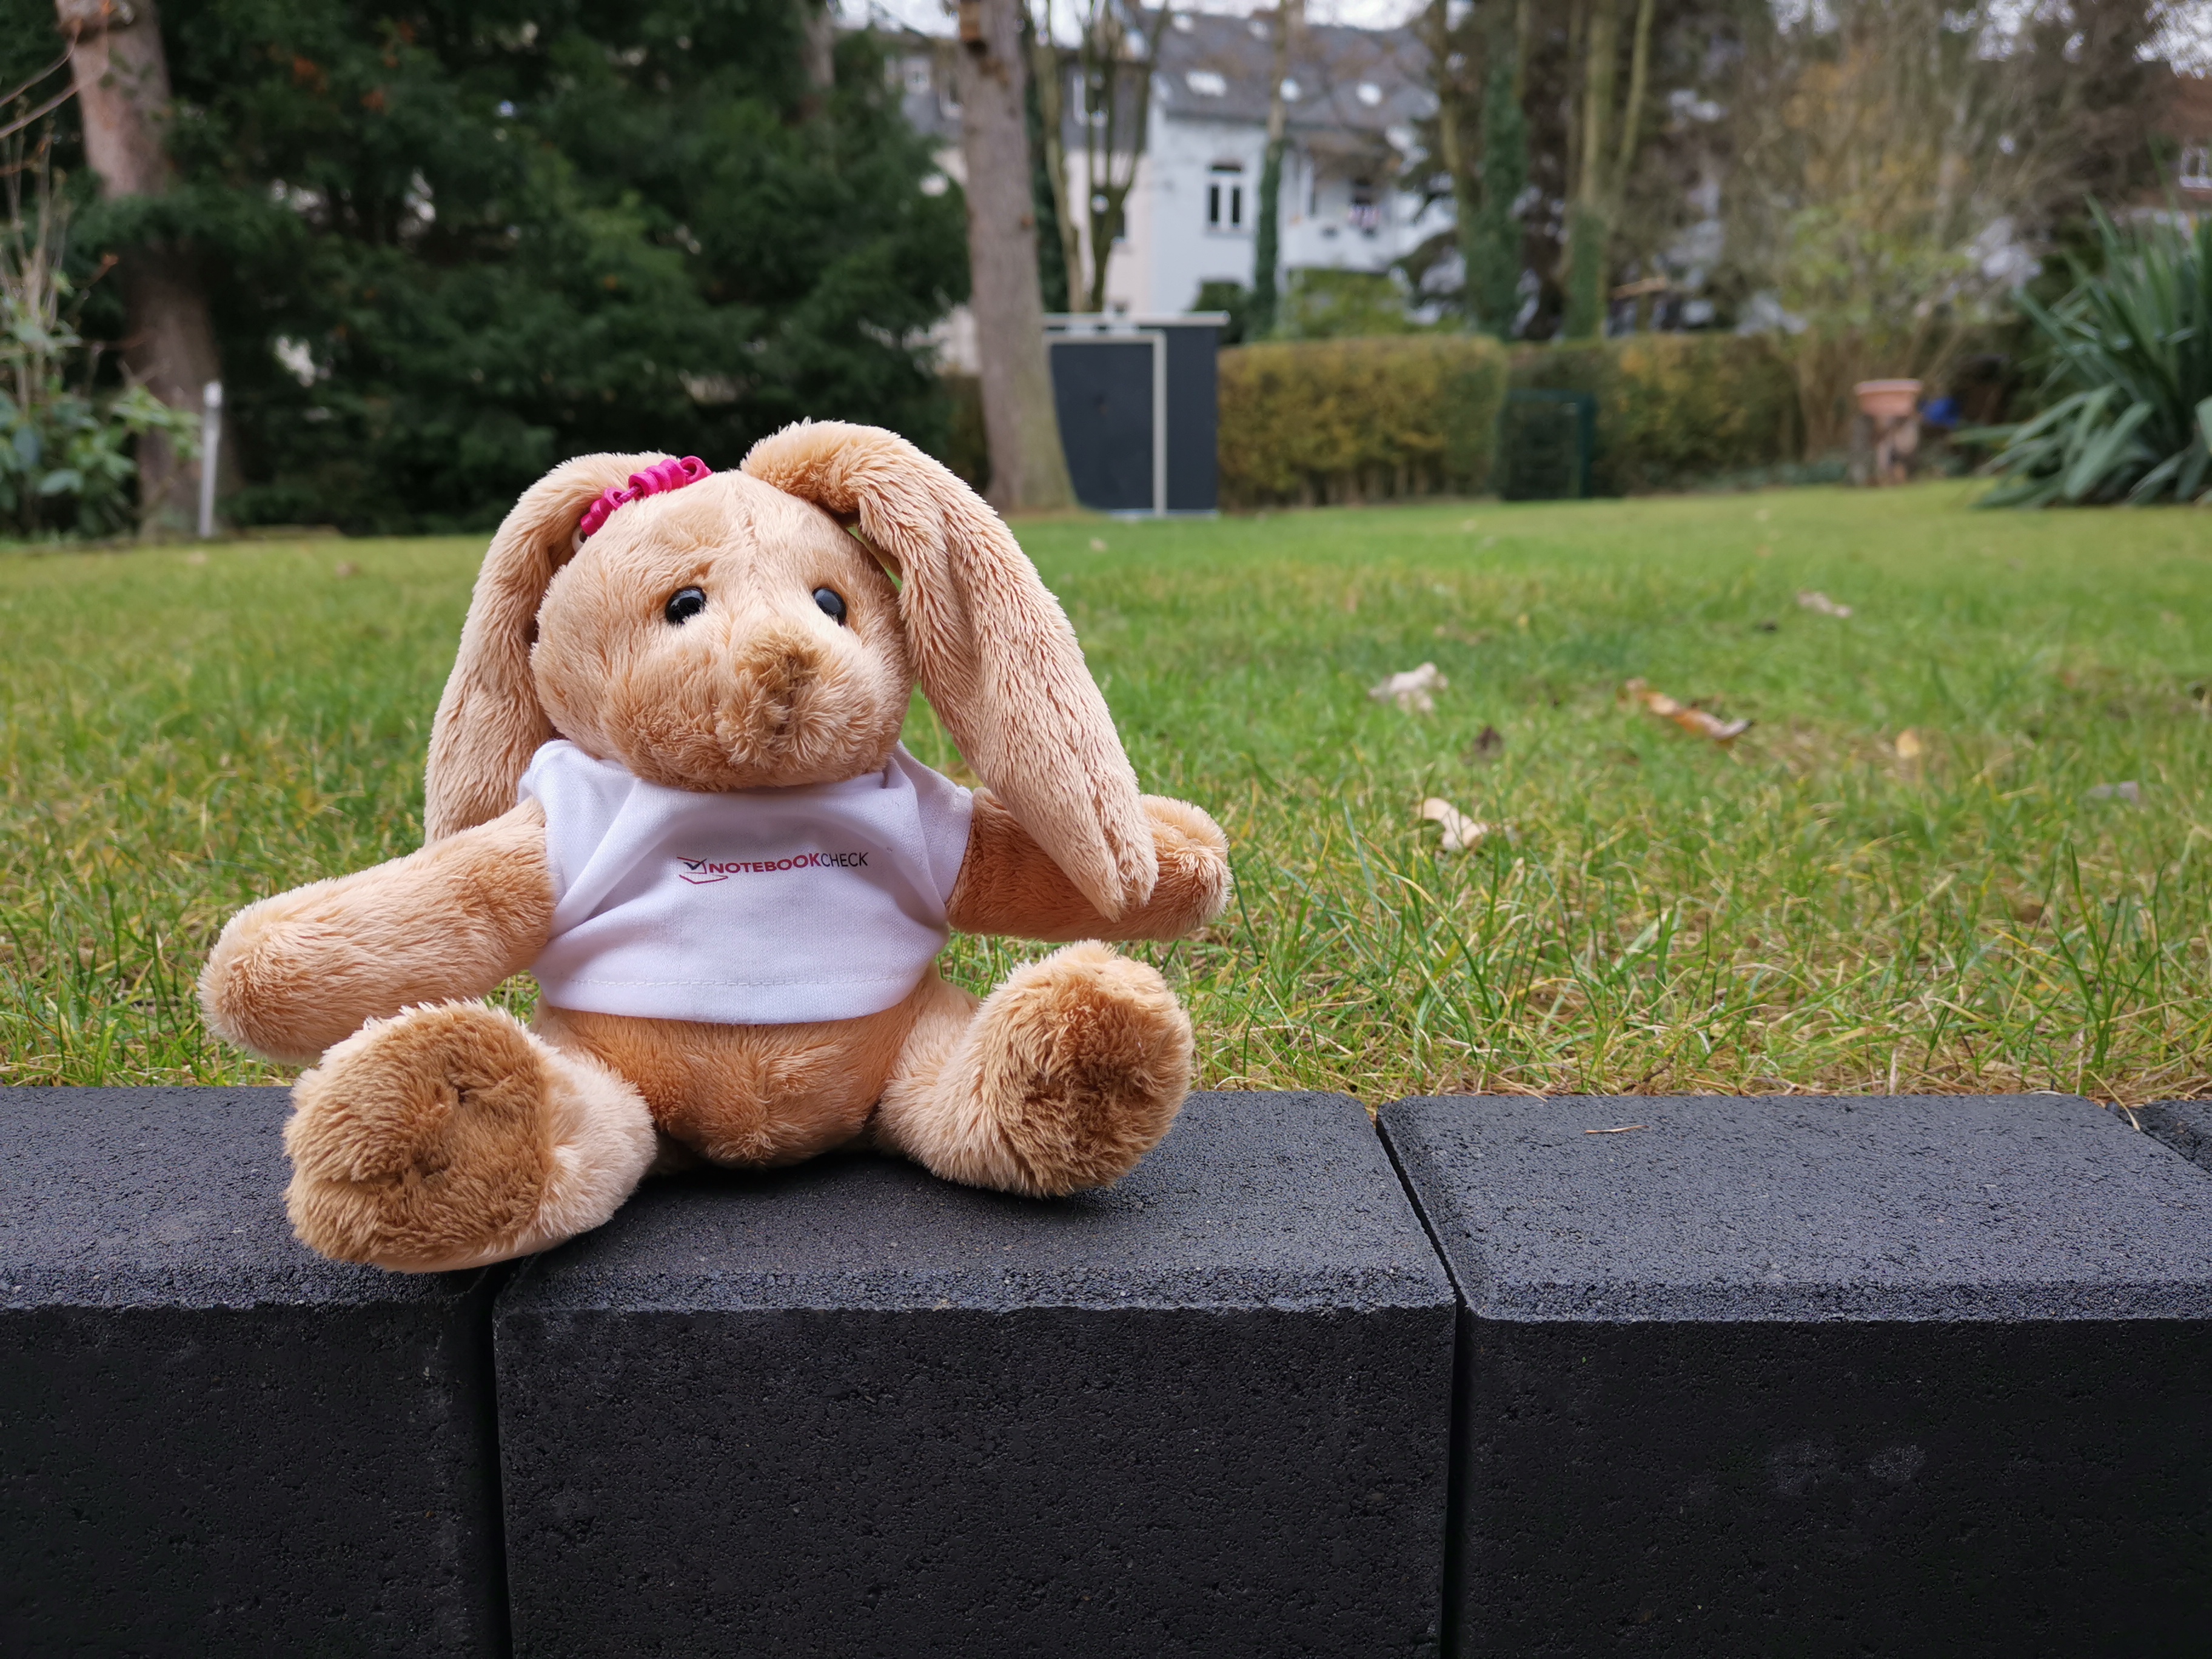
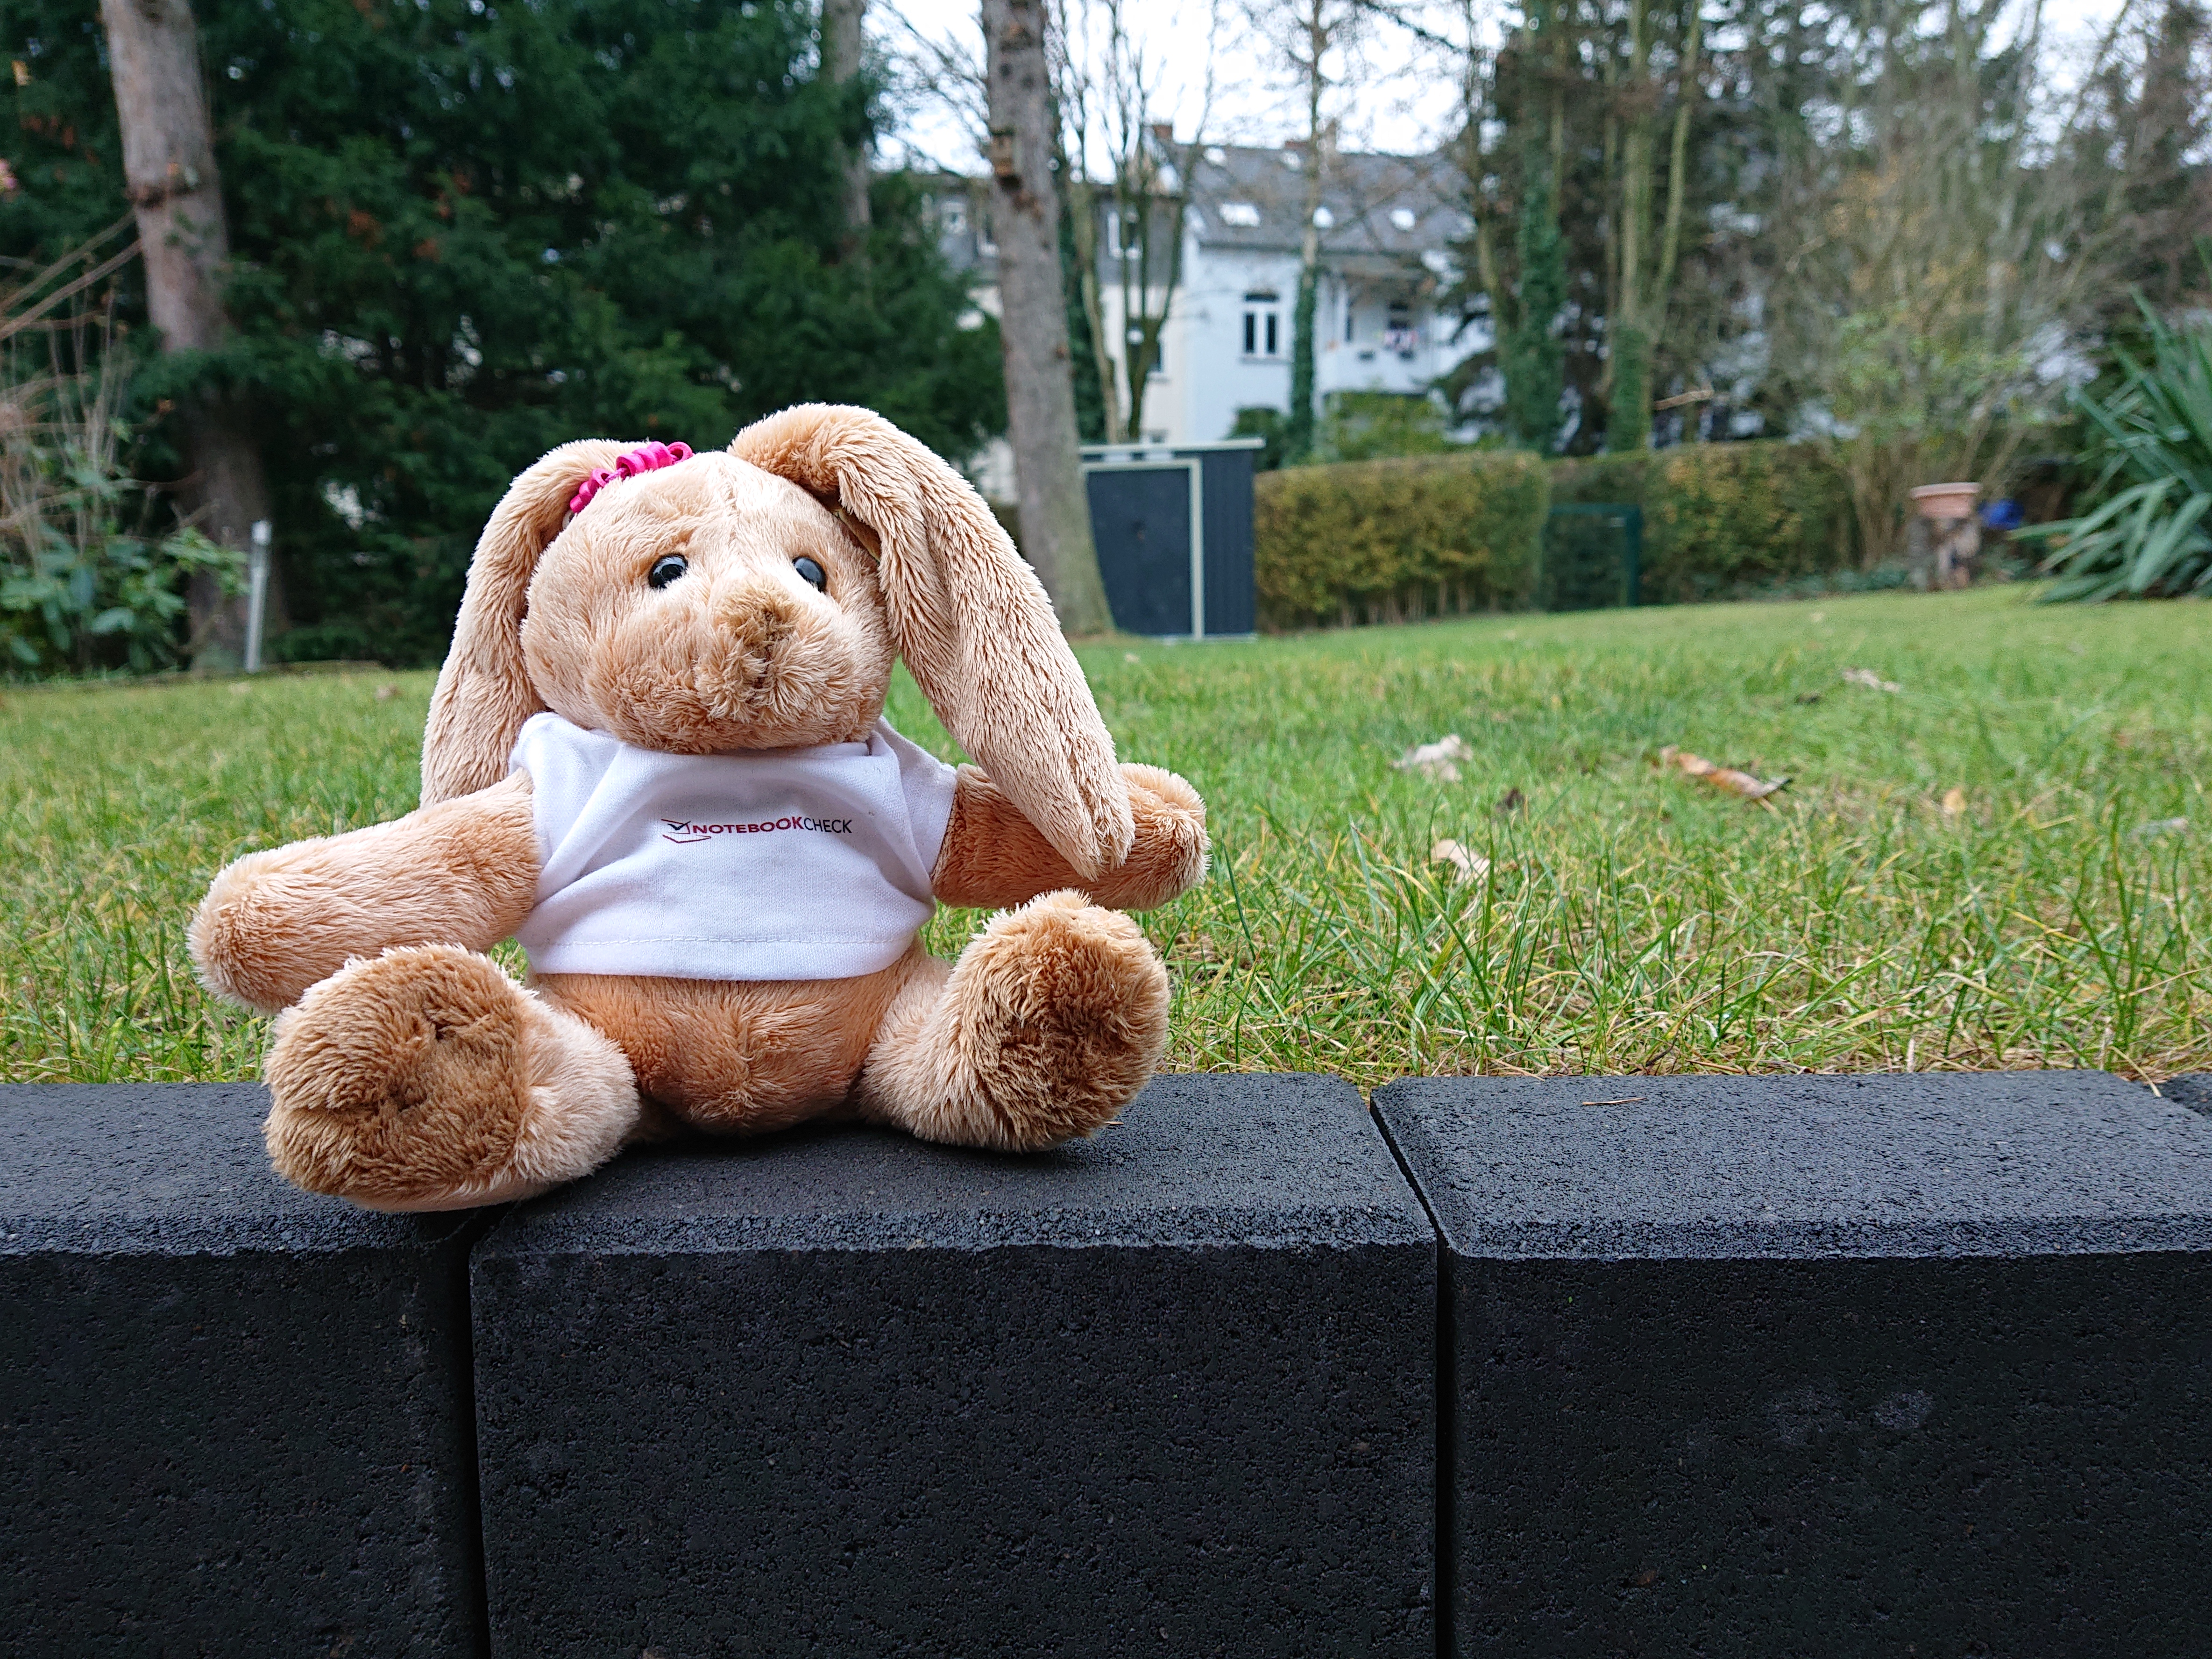
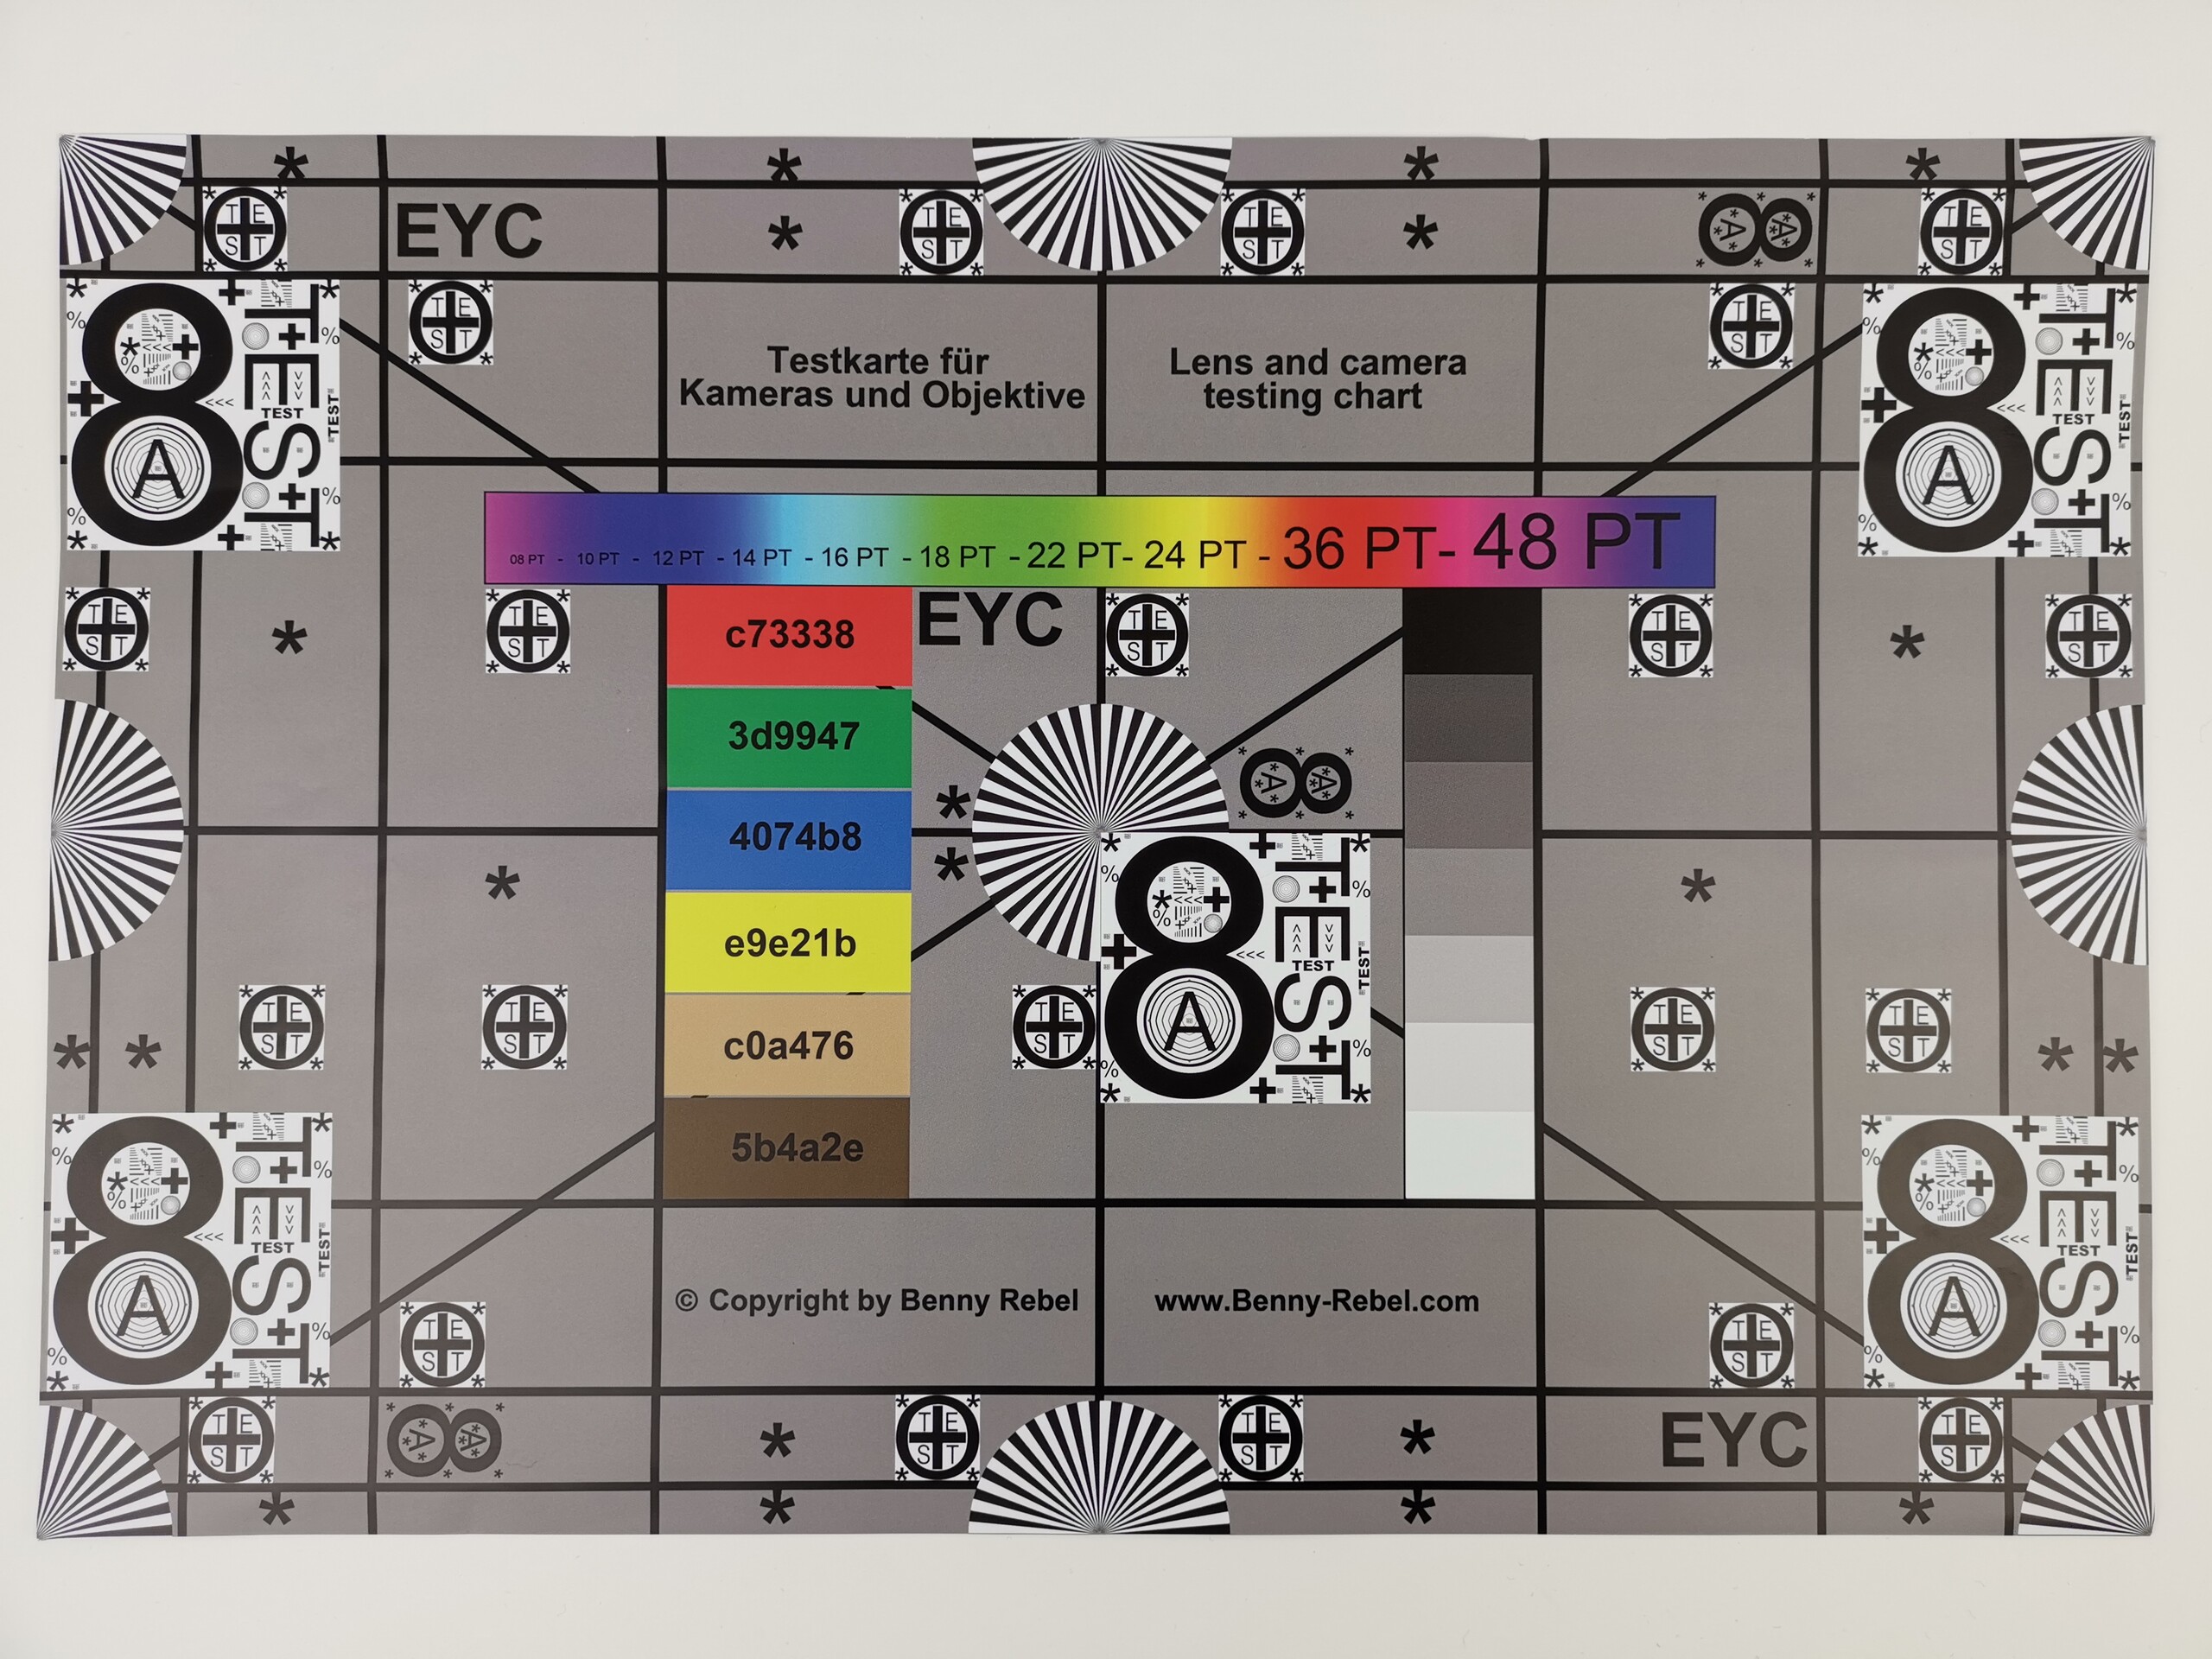
值得一提的是,虽然其他设备在我们的测试中也取得了类似的结果,后置三摄拍摄的图像几乎一样好。 但是,在旗舰级平板手机的市场上,你将找不到比更好的Mate 20 X替代品。
Huawei Mate 20 X
- 09/03/2022 v7 (old)
Mike Wobker
Price comparison

