戴尔 Inspiron 17-5758 笔记本电脑简短评测
Dell Inspiron 17-5758 (Inspiron 17 5000 Series)
Processor
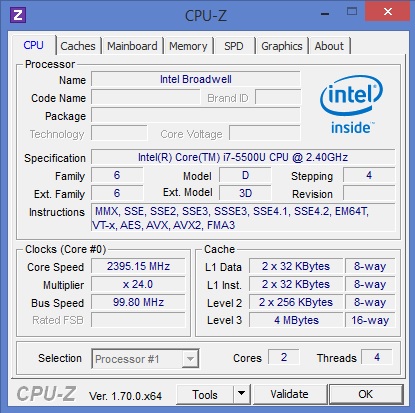
Intel Core i7-5500U 2c/4t 2 x 2.4 - 3 GHz, Broadwell
Graphics adapter
NVIDIA GeForce 920M - 4 GB VRAM, Core: 954 MHz, RAM: 1800 MHz, GameReady 9.18.13.4726, + Intel HD Graphics 5500
Memory
8 GB
, DDR3-1600, 2x 4 GB
Display
17.30 inch 16:9, 1920 x 1080 pixel, IPS, AU Optronics AUO119D, glossy: no
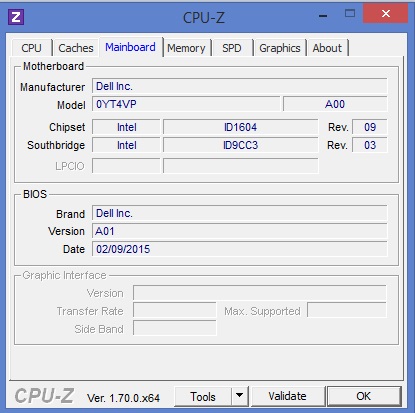
Mainboard
Intel Broadwell-U PCH-LP (Premium)
Storage
WDC Scorpio Blue WD10JPVX-75JC3T0, 1000 GB
, 5400 rpm, 880 GB free
Weight
2.8 kg, Power Supply: 275 g
Price
879 Euro
Note: The manufacturer may use components from different suppliers including display panels, drives or memory sticks with similar specifications.

| |||||||||||||||||||||||||
tested with X-Rite i1Pro 2
Maximum: 276 cd/m² (Nits) Average: 257.7 cd/m²Brightness Distribution: 87 %
Center on Battery: 328 cd/m²
Contrast: 726:1 (Black: 0.38 cd/m²)
ΔE ColorChecker Calman: 9.38 | ∀{0.5-29.43 Ø4.72}
ΔE Greyscale Calman: 11.81 | ∀{0.09-98 Ø4.97}
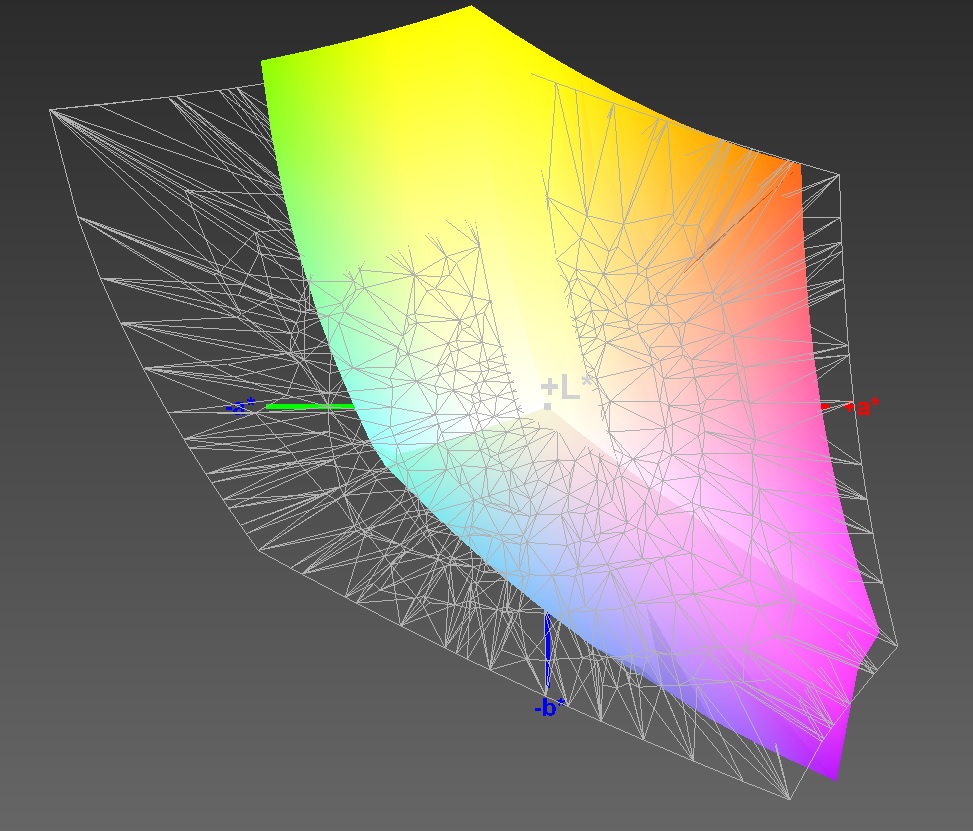
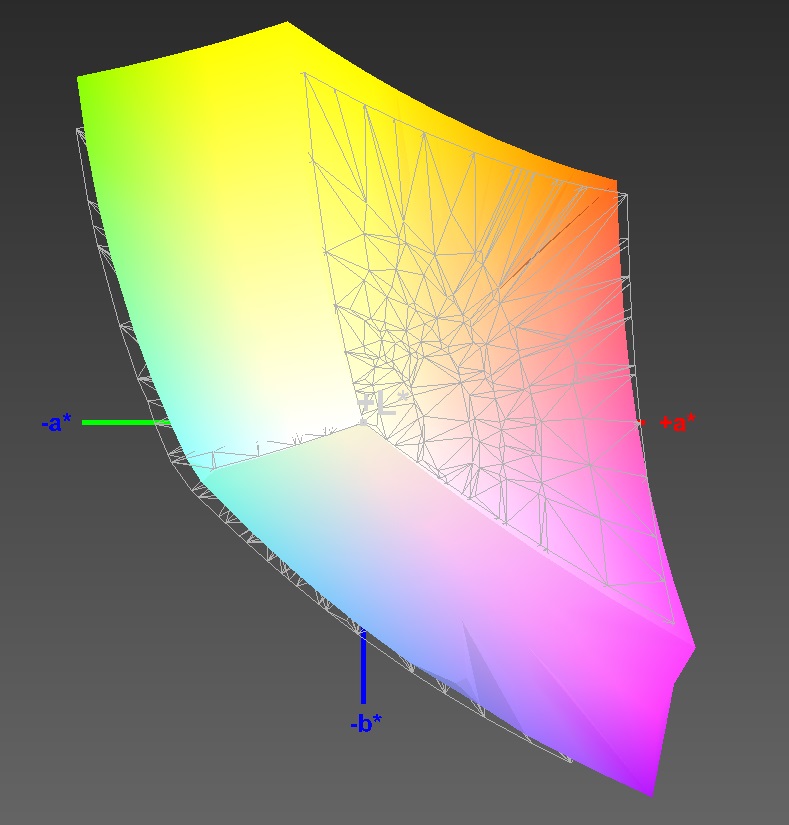
94% sRGB (Argyll 1.6.3 3D)
61% AdobeRGB 1998 (Argyll 1.6.3 3D)
69% AdobeRGB 1998 (Argyll 3D)
94.3% sRGB (Argyll 3D)
69.6% Display P3 (Argyll 3D)
Gamma: 2.03
CCT: 8966 K
| Dell Inspiron 17-5758 GeForce 920M, 5500U, WDC Scorpio Blue WD10JPVX-75JC3T0 | HP Pavilion 17-g013ng GeForce 940M, 5500U, Seagate ST1000LM014 Solid State Hybrid Drive | Asus F751LB-T4030H GeForce 940M, 5500U, Seagate Momentus SpinPoint M8 ST1000LM024 | Acer Travelmate P276-MG-56FU GeForce 840M, 4210U, WDC Scorpio Blue WD10JPVX-22JC3T0 | |
|---|---|---|---|---|
| Screen | 24% | 26% | -2% | |
| Brightness middle (cd/m²) | 276 | 321 16% | 353 28% | 345 25% |
| Brightness (cd/m²) | 258 | 308 19% | 336 30% | 317 23% |
| Brightness Distribution (%) | 87 | 89 2% | 85 -2% | 79 -9% |
| Black Level * (cd/m²) | 0.38 | 0.32 16% | 0.29 24% | 0.55 -45% |
| Contrast (:1) | 726 | 1003 38% | 1217 68% | 627 -14% |
| Colorchecker dE 2000 * | 9.38 | 3.79 60% | 7.03 25% | 10.05 -7% |
| Greyscale dE 2000 * | 11.81 | 4.75 60% | 6.08 49% | 10.18 14% |
| Gamma | 2.03 108% | 2.37 93% | 2.15 102% | 2.72 81% |
| CCT | 8966 72% | 7130 91% | 7457 87% | 12180 53% |
| Color Space (Percent of AdobeRGB 1998) (%) | 61 | 62 2% | 65 7% | 60 -2% |
| Color Space (Percent of sRGB) (%) | 94 | 97 3% | 99 5% |
* ... smaller is better

| Cinebench R10 | |
| Rendering Single CPUs 64Bit (sort by value) | |
| Dell Inspiron 17-5758 | |
| Dell Inspiron 17-5748 | |
| Rendering Multiple CPUs 64Bit (sort by value) | |
| Dell Inspiron 17-5758 | |
| Dell Inspiron 17-5748 | |
| Shading 64Bit (sort by value) | |
| Dell Inspiron 17-5758 | |
| Dell Inspiron 17-5748 | |
| Cinebench R11.5 | |
| CPU Single 64Bit (sort by value) | |
| Dell Inspiron 17-5758 | |
| HP Pavilion 17-g013ng | |
| Asus F751LB-T4030H | |
| Acer Travelmate P276-MG-56FU | |
| Dell Inspiron 17-5748 | |
| CPU Multi 64Bit (sort by value) | |
| Dell Inspiron 17-5758 | |
| HP Pavilion 17-g013ng | |
| Asus F751LB-T4030H | |
| Acer Travelmate P276-MG-56FU | |
| Dell Inspiron 17-5748 | |
| OpenGL 64Bit (sort by value) | |
| Dell Inspiron 17-5758 | |
| HP Pavilion 17-g013ng | |
| Asus F751LB-T4030H | |
| Acer Travelmate P276-MG-56FU | |
| Dell Inspiron 17-5748 | |
| Cinebench R15 | |
| CPU Single 64Bit (sort by value) | |
| Dell Inspiron 17-5758 | |
| HP Pavilion 17-g013ng | |
| Asus F751LB-T4030H | |
| Acer Travelmate P276-MG-56FU | |
| Dell Inspiron 17-5748 | |
| CPU Multi 64Bit (sort by value) | |
| Dell Inspiron 17-5758 | |
| HP Pavilion 17-g013ng | |
| Asus F751LB-T4030H | |
| Acer Travelmate P276-MG-56FU | |
| Dell Inspiron 17-5748 | |
| OpenGL 64Bit (sort by value) | |
| Dell Inspiron 17-5758 | |
| HP Pavilion 17-g013ng | |
| Asus F751LB-T4030H | |
| Acer Travelmate P276-MG-56FU | |
| Dell Inspiron 17-5748 | |
| PCMark 7 Score | 2846 points | |
| PCMark 8 Home Score Accelerated v2 | 3058 points | |
| PCMark 8 Creative Score Accelerated v2 | 3399 points | |
| PCMark 8 Work Score Accelerated v2 | 3912 points | |
Help | ||
| PCMark 7 - Score (sort by value) | |
| Dell Inspiron 17-5758 | |
| HP Pavilion 17-g013ng | |
| Acer Travelmate P276-MG-56FU | |
| Dell Inspiron 17-5748 | |
| PCMark 8 | |
| Work Score Accelerated v2 (sort by value) | |
| Dell Inspiron 17-5758 | |
| HP Pavilion 17-g013ng | |
| Asus F751LB-T4030H | |
| Acer Travelmate P276-MG-56FU | |
| Dell Inspiron 17-5748 | |
| Creative Score Accelerated v2 (sort by value) | |
| Dell Inspiron 17-5758 | |
| HP Pavilion 17-g013ng | |
| Asus F751LB-T4030H | |
| Acer Travelmate P276-MG-56FU | |
| Dell Inspiron 17-5748 | |
| Home Score Accelerated v2 (sort by value) | |
| Dell Inspiron 17-5758 | |
| HP Pavilion 17-g013ng | |
| Asus F751LB-T4030H | |
| Acer Travelmate P276-MG-56FU | |
| Dell Inspiron 17-5748 | |

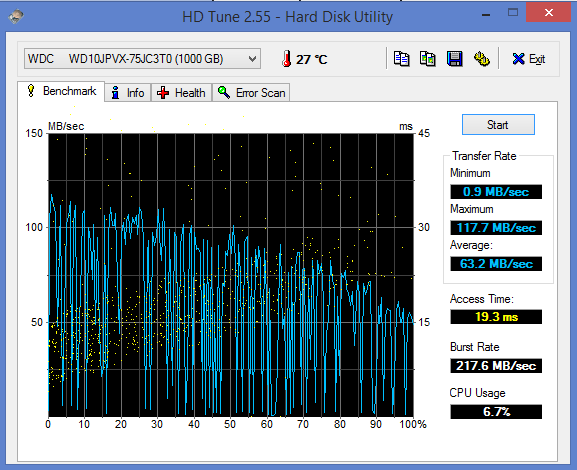
WDC Scorpio Blue WD10JPVX-75JC3T0
Transfer Rate Minimum:
0.9 MB/s
Transfer Rate Maximum:
117.7 MB/s
Transfer Rate Average:
63.2 MB/s
Access Time:
19.3 ms
Burst Rate:
217.6 MB/s
CPU Usage:
6.7 %
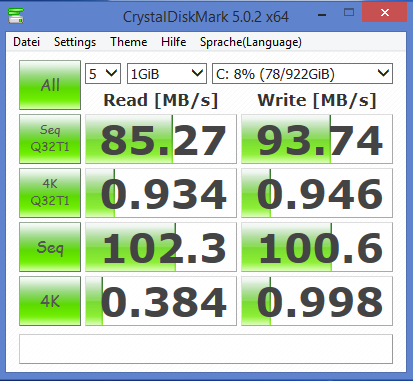
| CrystalDiskMark 3.0 | |
| Read Seq (sort by value) | |
| Dell Inspiron 17-5758 | |
| HP Pavilion 17-g013ng | |
| Asus F751LB-T4030H | |
| Acer Travelmate P276-MG-56FU | |
| Write Seq (sort by value) | |
| Dell Inspiron 17-5758 | |
| HP Pavilion 17-g013ng | |
| Asus F751LB-T4030H | |
| Acer Travelmate P276-MG-56FU | |
| Read 512 (sort by value) | |
| HP Pavilion 17-g013ng | |
| Asus F751LB-T4030H | |
| Acer Travelmate P276-MG-56FU | |
| Write 512 (sort by value) | |
| HP Pavilion 17-g013ng | |
| Asus F751LB-T4030H | |
| Acer Travelmate P276-MG-56FU | |
| Read 4k (sort by value) | |
| HP Pavilion 17-g013ng | |
| Asus F751LB-T4030H | |
| Acer Travelmate P276-MG-56FU | |
| Write 4k (sort by value) | |
| HP Pavilion 17-g013ng | |
| Asus F751LB-T4030H | |
| Acer Travelmate P276-MG-56FU | |
| Read 4k QD32 (sort by value) | |
| HP Pavilion 17-g013ng | |
| Asus F751LB-T4030H | |
| Acer Travelmate P276-MG-56FU | |
| Write 4k QD32 (sort by value) | |
| HP Pavilion 17-g013ng | |
| Asus F751LB-T4030H | |
| Acer Travelmate P276-MG-56FU | |
| 3DMark 11 Performance | 1899 points | |
| 3DMark Ice Storm Standard Score | 41316 points | |
| 3DMark Cloud Gate Standard Score | 5288 points | |
| 3DMark Fire Strike Score | 1028 points | |
Help | ||
| 3DMark 11 | |
| 1280x720 Performance (sort by value) | |
| Dell Inspiron 17-5758 | |
| HP Pavilion 17-g013ng | |
| Asus F751LB-T4030H | |
| Acer Travelmate P276-MG-56FU | |
| Dell Inspiron 17-5748 | |
| 1280x720 Performance GPU (sort by value) | |
| HP Pavilion 17-g013ng | |
| Asus F751LB-T4030H | |
| Acer Travelmate P276-MG-56FU | |
| Dell Inspiron 17-5748 | |
| 1280x720 Performance Physics (sort by value) | |
| HP Pavilion 17-g013ng | |
| Asus F751LB-T4030H | |
| Acer Travelmate P276-MG-56FU | |
| Dell Inspiron 17-5748 | |
| 1280x720 Performance Combined (sort by value) | |
| HP Pavilion 17-g013ng | |
| Asus F751LB-T4030H | |
| Acer Travelmate P276-MG-56FU | |
| Dell Inspiron 17-5748 | |
| low | med. | high | ultra | |
|---|---|---|---|---|
| The Elder Scrolls V: Skyrim (2011) | 55 | 34.2 | 19.8 | 14 |
| Diablo III (2012) | 110.3 | 69.2 | 55.4 | 36.1 |
| StarCraft II: Heart of the Swarm (2013) | 155 | 72.8 | 32.8 | 12.5 |
| Wolfenstein: The New Order (2014) | 37.1 | 31.1 | 14.2 | |
| Sims 4 (2014) | 175.8 | 73 | 29.8 | 22.7 |
| Fifa 15 (2014) | 68.3 | 52.4 | 33.2 | |
| Middle-earth: Shadow of Mordor (2014) | 29.3 | 18.7 | 9.8 | 5.3 |
| Alien: Isolation (2014) | 44 | 28.1 | 12.3 | 7.1 |
| Far Cry 4 (2014) | 33.1 | 20 | 7.2 | 5 |
| Dragon Age: Inquisition (2014) | 31.6 | 27 | 13.5 | 8.9 |
| The Crew (2014) | 27.1 | 21.1 | 12.3 | 7.2 |
| Evolve (2015) | 24.3 | 17.9 | 8.9 | 7.2 |
| Battlefield Hardline (2015) | 42.2 | 30 | 11.4 | 7 |
| GTA V (2015) | 55.9 | 37.2 | 8.7 | 2.3 |
| Dirt Rally (2015) | 134.2 | 31.1 | 15.9 | 12 |
| The Witcher 3 (2015) | 19.2 | 11.1 | 6.5 | 3.6 |
| Batman: Arkham Knight (2015) | 14 | 11 | 7 | 6 |
Noise level
| Idle |
| 31.6 / 31.6 / 32.9 dB(A) |
| HDD |
| 33.1 dB(A) |
| DVD |
| 36.2 / dB(A) |
| Load |
| 45.4 / 45.6 dB(A) |
 | ||
30 dB silent 40 dB(A) audible 50 dB(A) loud |
||
min: | ||
(±) The average temperature for the upper side under maximal load is 34.9 °C / 95 F, compared to the average of 31.3 °C / 88 F for the devices in the class Multimedia.
(-) The maximum temperature on the upper side is 54.1 °C / 129 F, compared to the average of 36.8 °C / 98 F, ranging from 21 to 71 °C for the class Multimedia.
(±) The bottom heats up to a maximum of 43 °C / 109 F, compared to the average of 39.1 °C / 102 F
(+) In idle usage, the average temperature for the upper side is 29.7 °C / 85 F, compared to the device average of 31.3 °C / 88 F.
(+) The palmrests and touchpad are reaching skin temperature as a maximum (33.3 °C / 91.9 F) and are therefore not hot.
(-) The average temperature of the palmrest area of similar devices was 28.7 °C / 83.7 F (-4.6 °C / -8.2 F).
Power Consumption
| Off / Standby | |
| Idle | |
| Load |
|
Key:
min: | |
| Dell Inspiron 17-5758 GeForce 920M, 5500U, WDC Scorpio Blue WD10JPVX-75JC3T0 | HP Pavilion 17-g013ng GeForce 940M, 5500U, Seagate ST1000LM014 Solid State Hybrid Drive | Asus F751LB-T4030H GeForce 940M, 5500U, Seagate Momentus SpinPoint M8 ST1000LM024 | Acer Travelmate P276-MG-56FU GeForce 840M, 4210U, WDC Scorpio Blue WD10JPVX-22JC3T0 | Dell Inspiron 17-5748 HD Graphics 4400, 4510U, Samsung SpinPoint M8 HN-M101MBB | |
|---|---|---|---|---|---|
| Power Consumption | -27% | -18% | -35% | 6% | |
| Idle Minimum * (Watt) | 4 | 5.3 -33% | 3.9 2% | 6.7 -68% | 3.8 5% |
| Idle Average * (Watt) | 9.2 | 10 -9% | 11.6 -26% | 11.8 -28% | 8.6 7% |
| Idle Maximum * (Watt) | 9.4 | 10.8 -15% | 12.2 -30% | 12.3 -31% | 9.8 -4% |
| Load Average * (Watt) | 40.4 | 51.7 -28% | 41.3 -2% | 46.8 -16% | 28.2 30% |
| Load Maximum * (Watt) | 40.8 | 61.6 -51% | 55.6 -36% | 53.5 -31% | 44.1 -8% |
* ... smaller is better
| Dell Inspiron 17-5758 GeForce 920M, 5500U, WDC Scorpio Blue WD10JPVX-75JC3T0 | HP Pavilion 17-g013ng GeForce 940M, 5500U, Seagate ST1000LM014 Solid State Hybrid Drive | Asus F751LB-T4030H GeForce 940M, 5500U, Seagate Momentus SpinPoint M8 ST1000LM024 | Acer Travelmate P276-MG-56FU GeForce 840M, 4210U, WDC Scorpio Blue WD10JPVX-22JC3T0 | Dell Inspiron 17-5748 HD Graphics 4400, 4510U, Samsung SpinPoint M8 HN-M101MBB | |
|---|---|---|---|---|---|
| Battery runtime | 5% | -5% | 12% | -2% | |
| Reader / Idle (h) | 7.5 | 10.3 37% | 9.7 29% | 7.7 3% | |
| WiFi v1.3 (h) | 4.1 | 4.4 7% | 3.9 -5% | ||
| Load (h) | 1.8 | 1.3 -28% | 1.7 -6% | 1.7 -6% | |
| WiFi (h) | 4.6 | 5 |
Pros
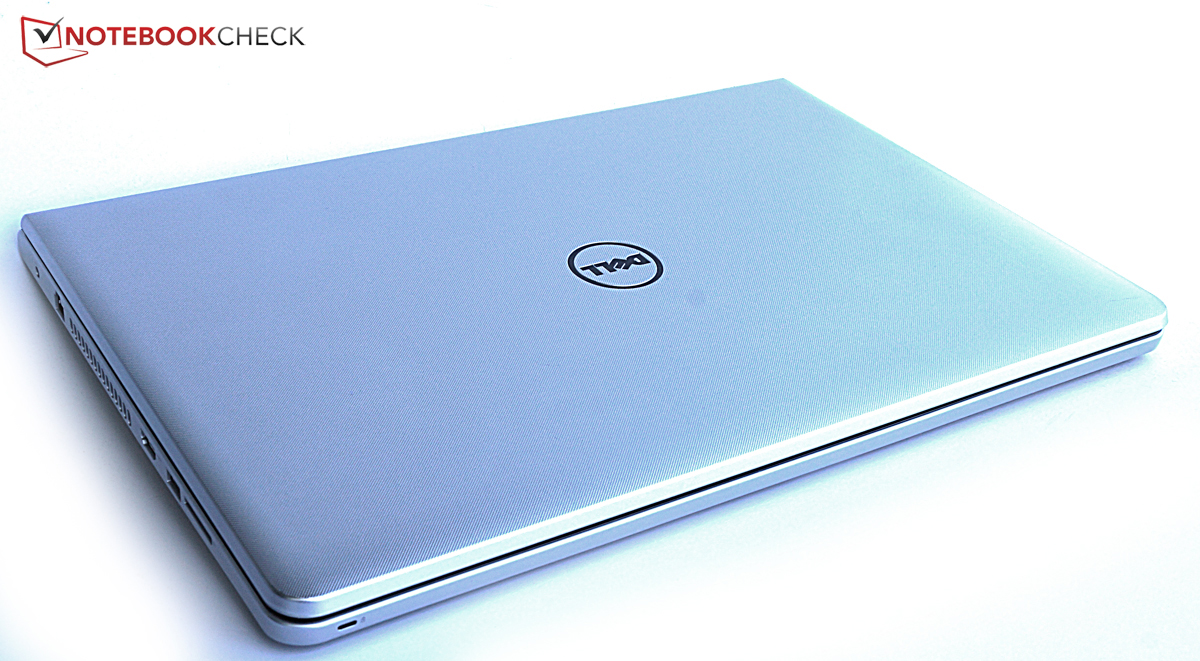
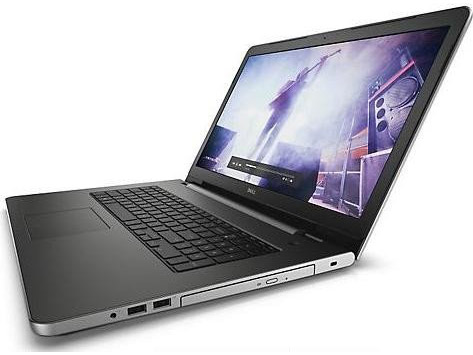
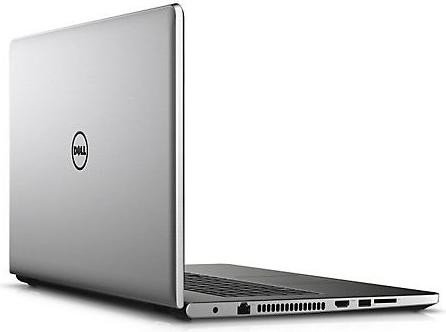
+ 简洁,雅致的设计
+ 优秀的无线信号
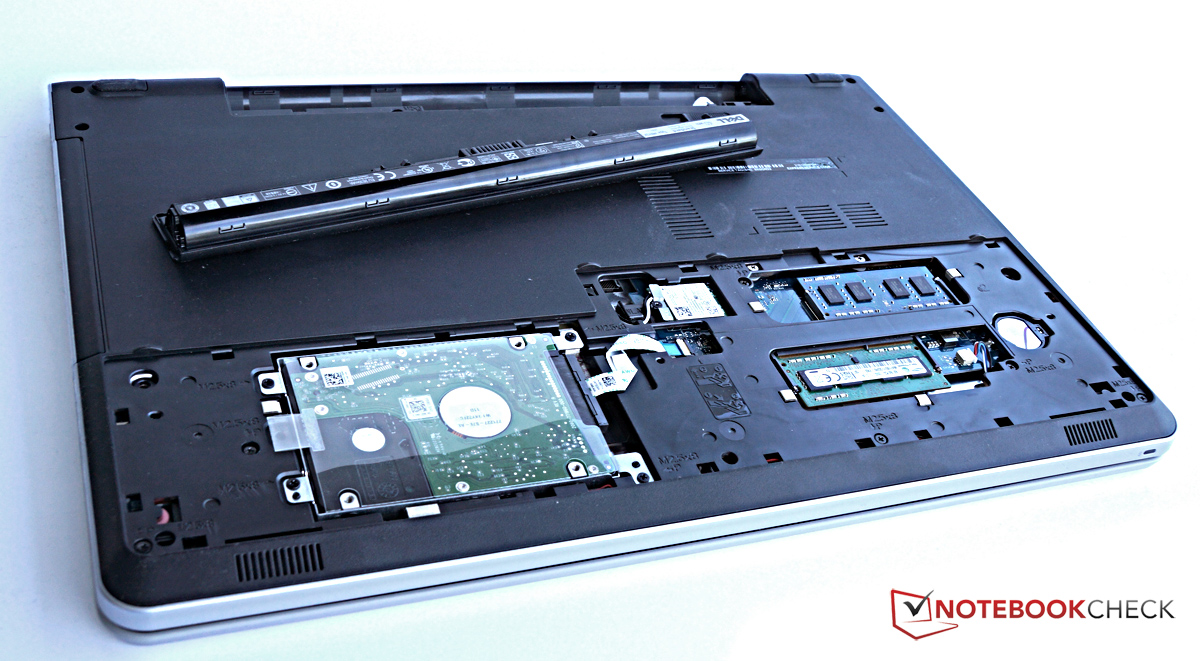
+ 可更换电池
+ 优秀的可维护性
+ 精确的触控板
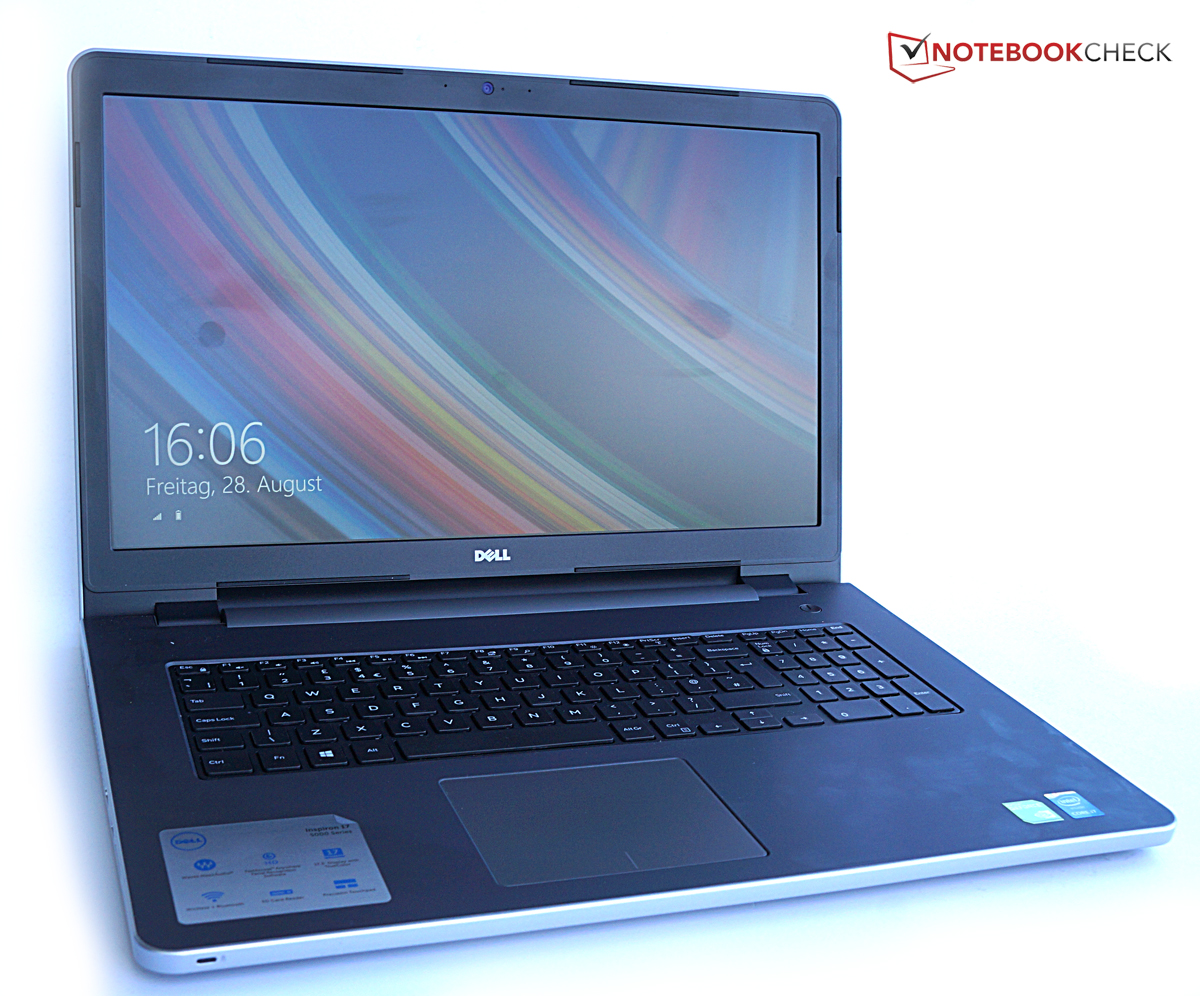
+ 磨砂全高清屏幕
+ 不错的扬声器
Cons
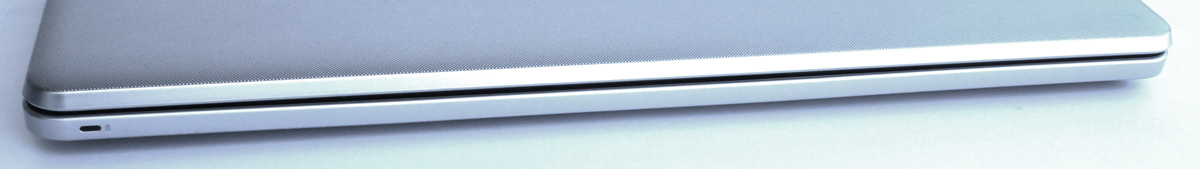
- 机身易弯折
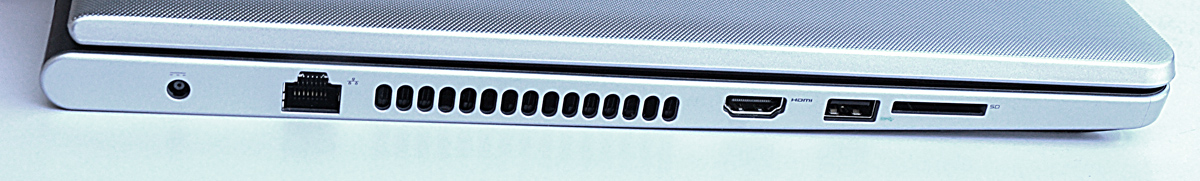
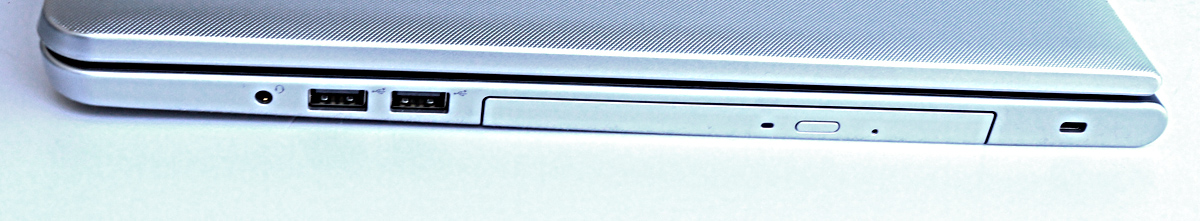
- 接口少
- 无千兆以太网接口
- 仅12个月质保
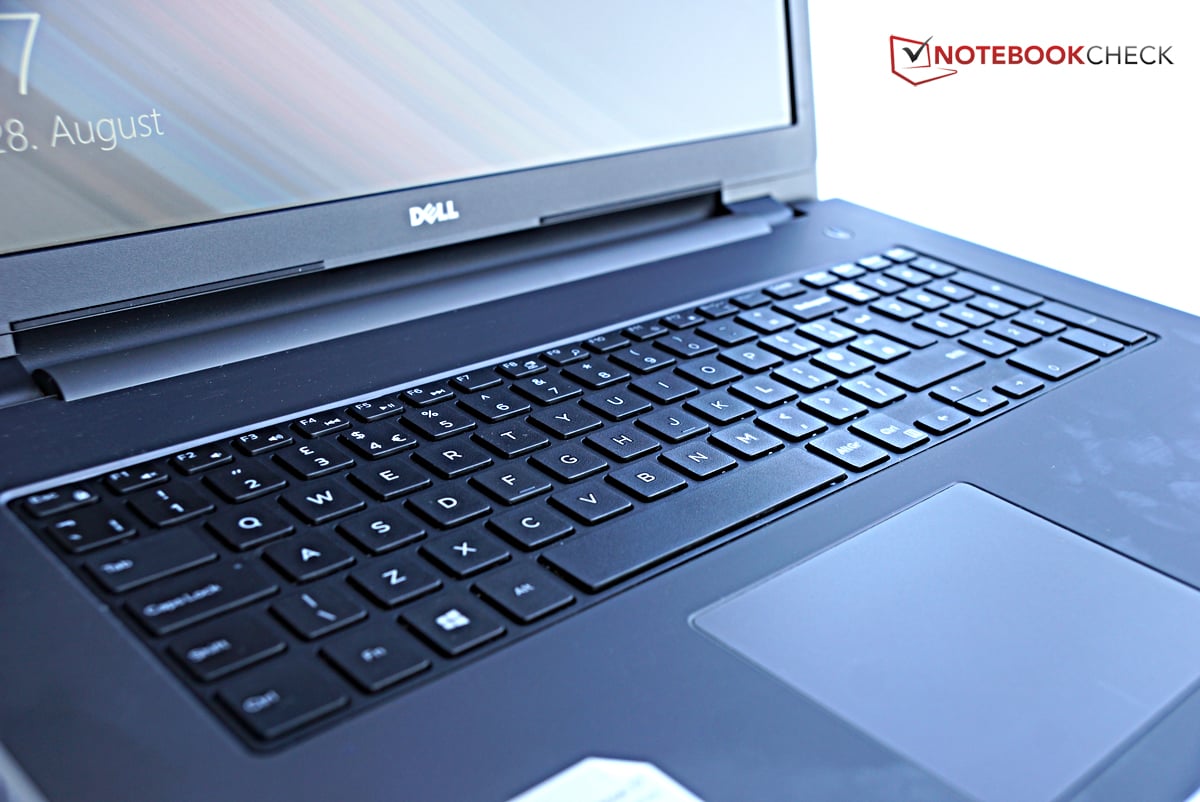
- 键盘噪音大
- 屏幕暗
- 色彩不自然
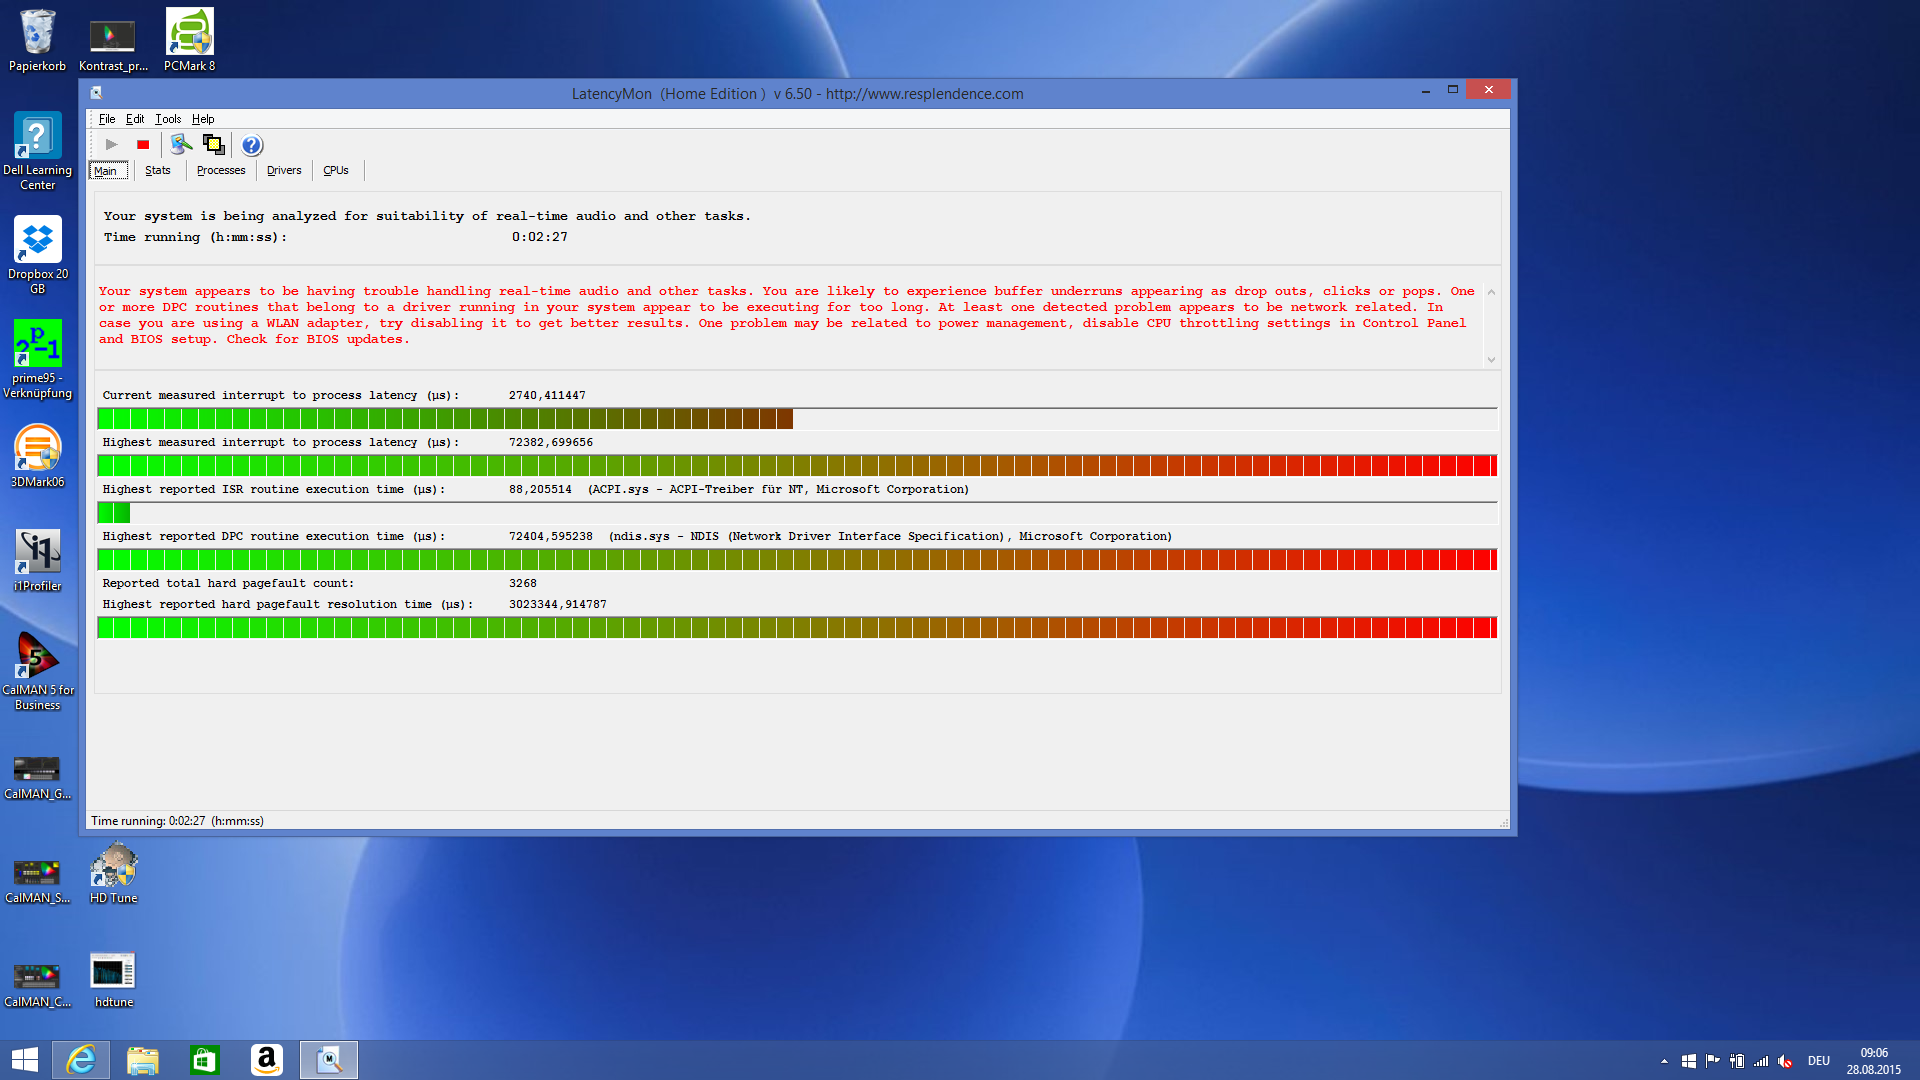
- 处理器降频问题
- 发热量大
- 键盘太吵
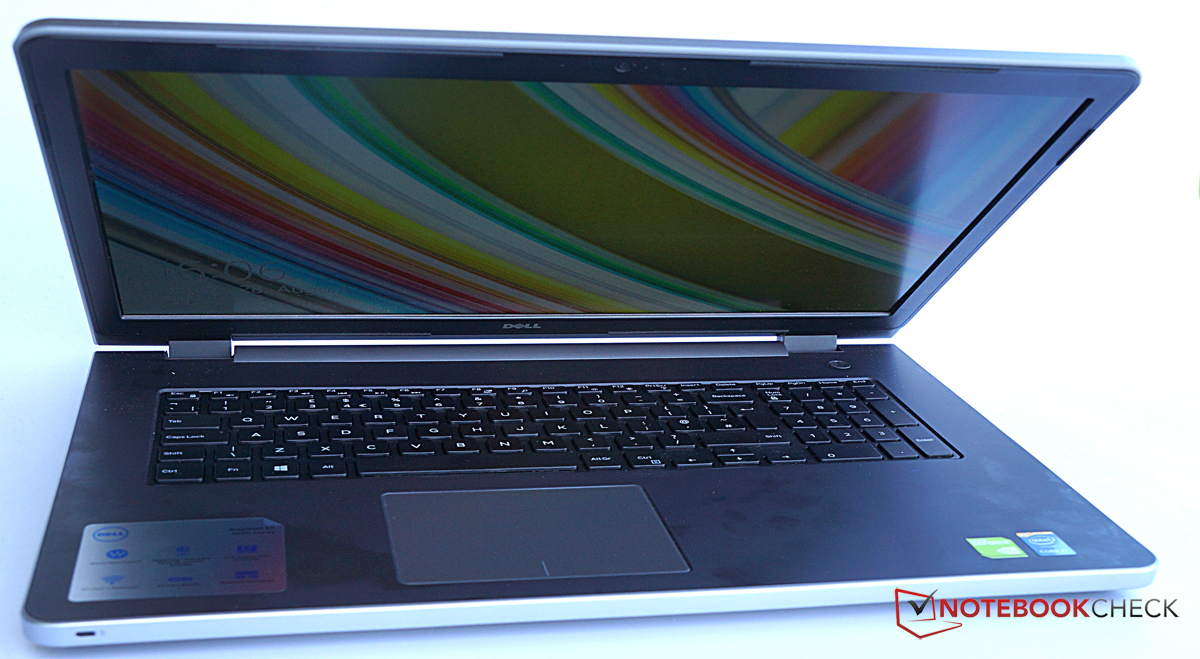
它的前作表现十分优秀。戴尔Inspiron 17-5758只是一个小更新,我们的很多评价依然没变:它的接口数量仍然较少,布局也不够方便,不过至少不像以前那样互相离得过近了。它没有支持千兆以太网,而质保也会在12个月后过期。我们十分怀念前代产品的金属屏幕上盖,它更加美观而且也给机身带来了更好的稳定性。戴尔Inspiron 17-5758的机身只能算一般水平。
这款设备在负载下噪音很大,而它的独立显卡无法满足最新游戏的需要。在全负载下,这款设备的表面变的很热。因此处理器也遇到了过热降频问题。
不过我们十分喜欢它的磨砂IPS屏幕,它如果能有更高的亮度和更准确的色彩就锦上添花了。点击式的触控板十分精确,它的功耗也很低。另外,在这次测试中它的无线网卡表现完美,也提供了对802.11ac标准的支持。GeForce 920M也提供了一些游戏性能。
整体上,戴尔Inspiron 17-5758让人感觉五味杂陈。尽管前代产品有些缺陷,相对却更加全面。其他的同价位多媒体笔记本电脑提供了更好的整体表现。
注:本文是基于完整评测的缩减版本,阅读完整的英文评测,请点击这里。
Dell Inspiron 17-5758
- 08/28/2015 v4 (old)
Florian Wimmer
Multimedia - Weighted Average