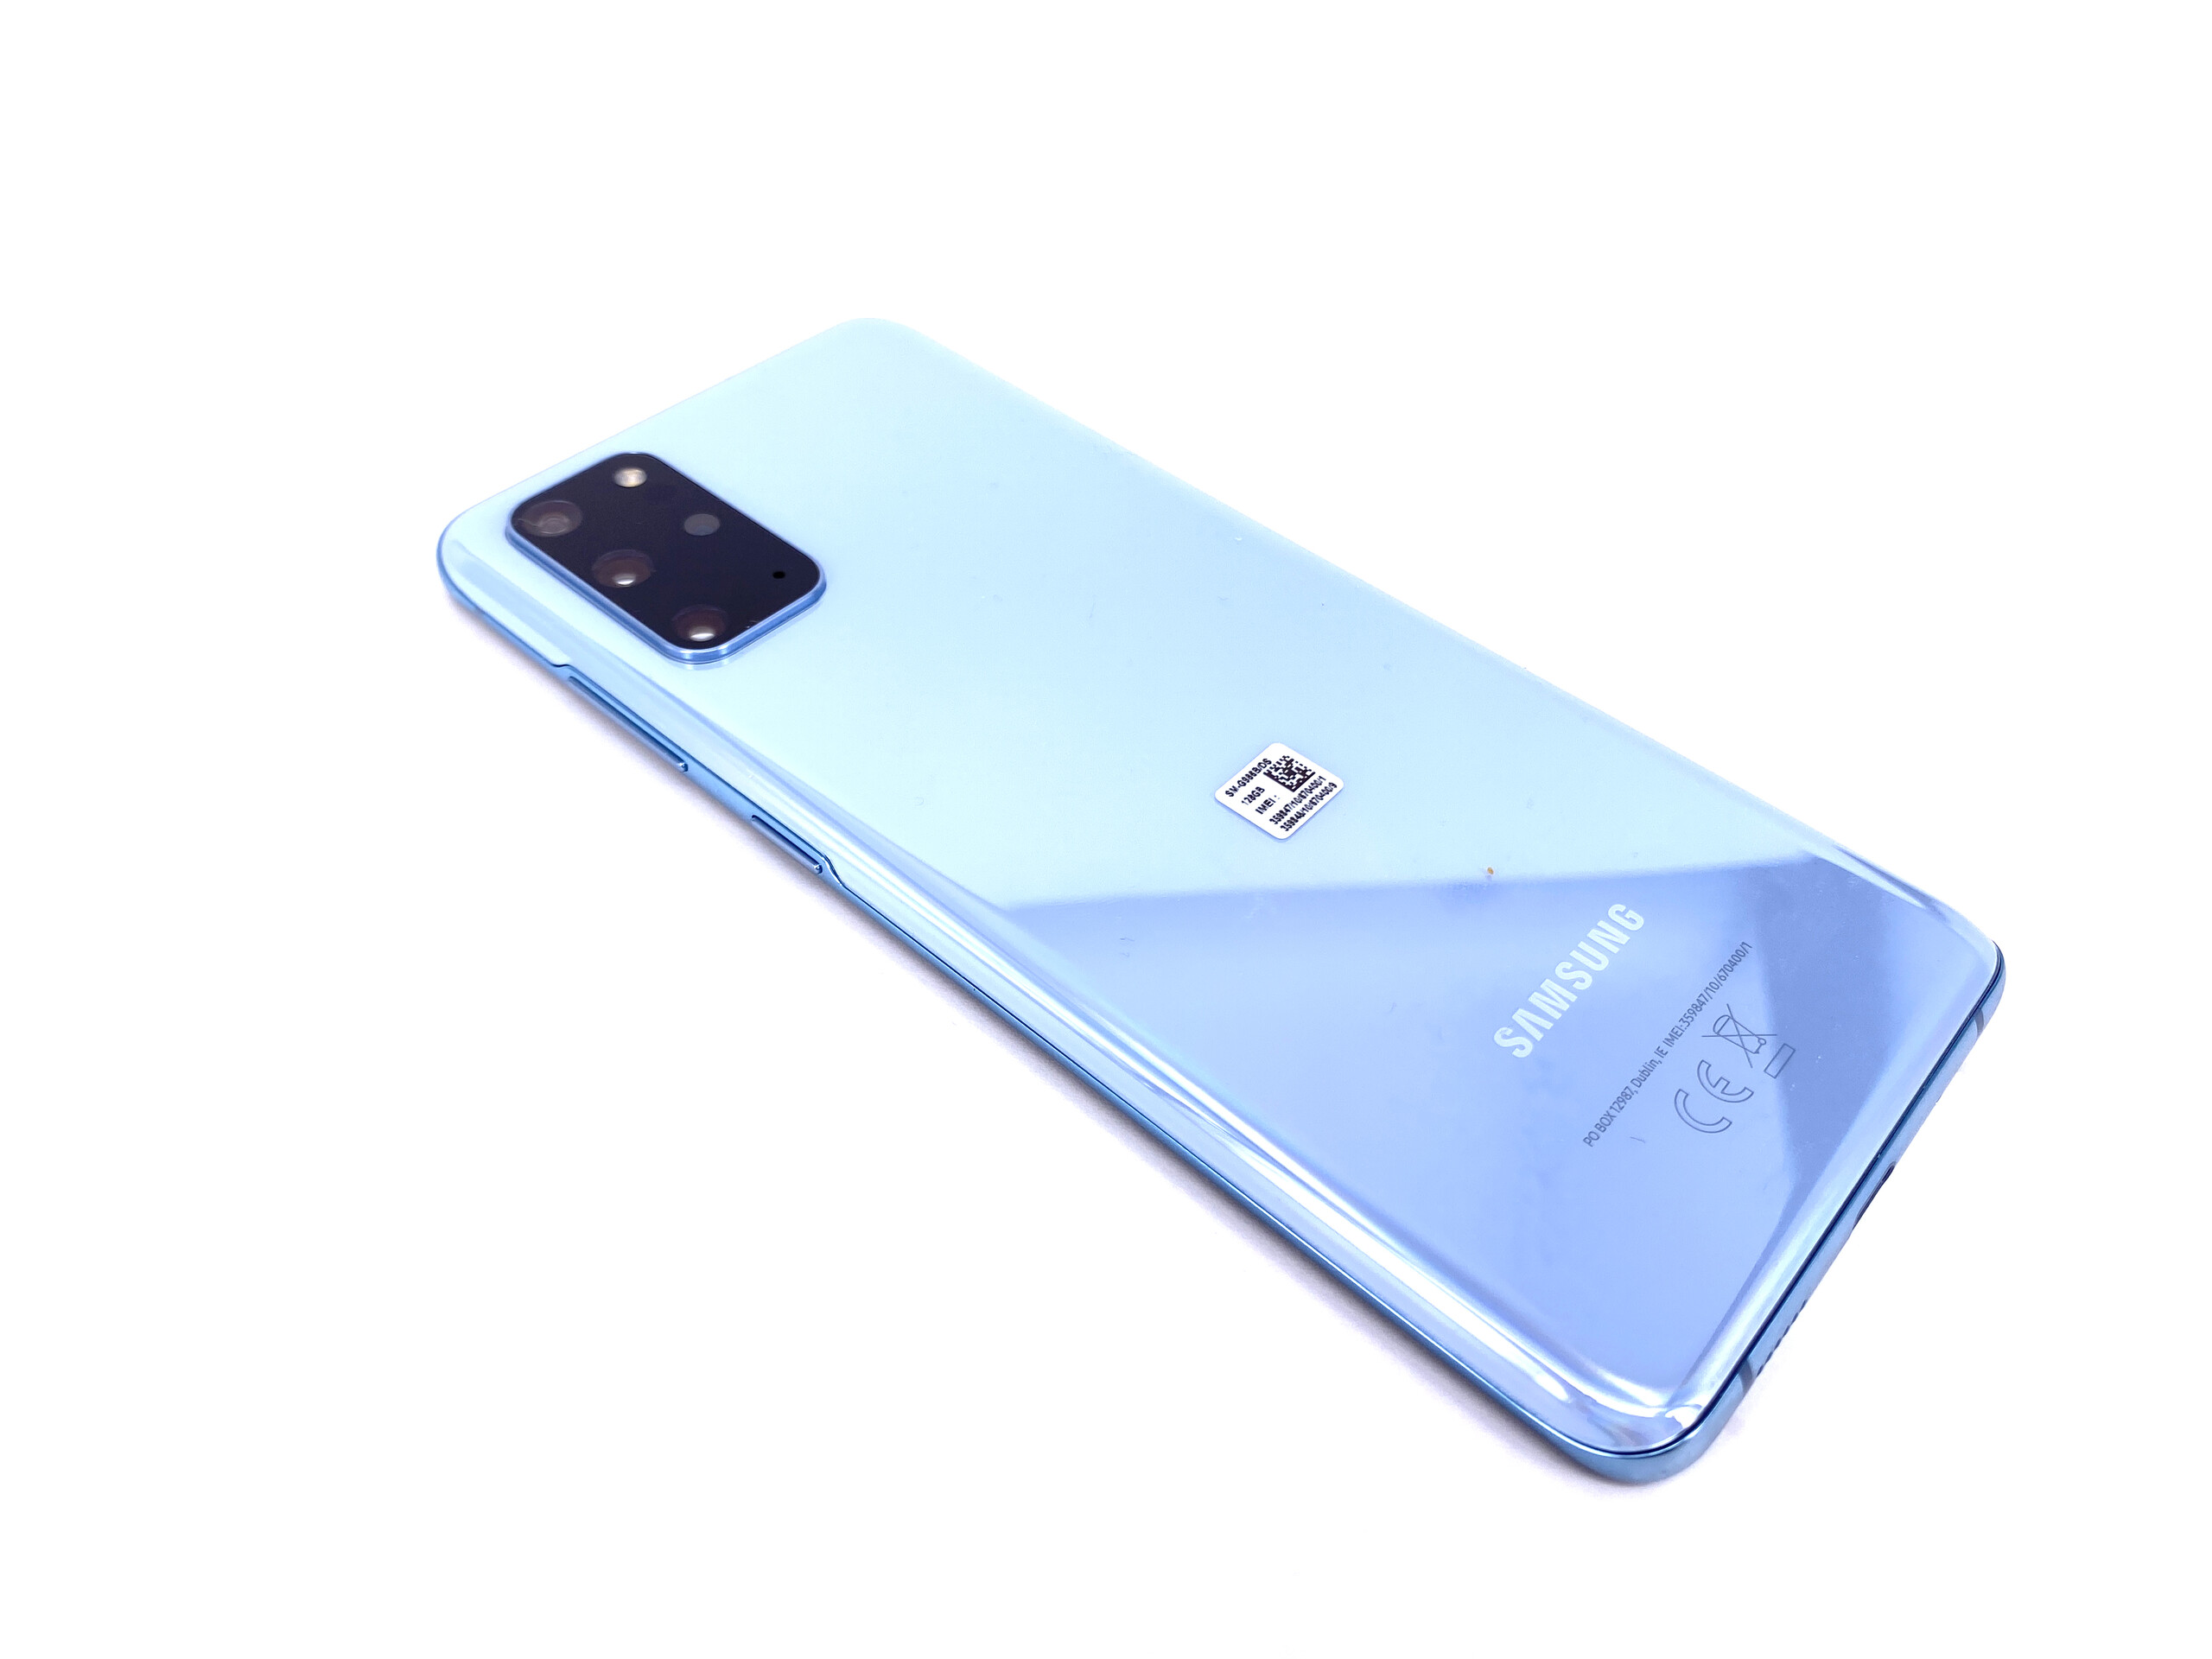
三星Galaxy S20+智能手机评测:有8K视频能力的手持设备
Device comparison
Rating | Date | Model | Weight | Drive | Size | Resolution | Price |
|---|---|---|---|---|---|---|---|
| 87.7 % v7 (old) | 06 / 2020 | Samsung Galaxy S20+ Exynos 990, Mali-G77 MP11 | 188 g | 128 GB UFS 3.0 Flash | 6.70" | 3200x1440 | |
| 87.1 % v7 (old) | 10 / 2019 | Apple iPhone 11 Pro Max A13 Bionic, A13 Bionic GPU | 226 g | 64 GB SSD | 6.50" | 2688x1242 | |
| 89 % v7 (old) | 10 / 2019 | Huawei Mate 30 Pro Kirin 990, Mali-G76 MP16 | 198 g | 256 GB UFS 3.0 Flash | 6.53" | 2400x1176 | |
| 86.9 % v7 (old) | 10 / 2019 | OnePlus 7T Pro SD 855+, Adreno 640 | 206 g | 256 GB UFS 3.0 Flash | 6.67" | 3120x1440 | |
| 84.7 % v7 (old) | 02 / 2025 | Sony Xperia 1 SD 855, Adreno 640 | 178 g | 128 GB UFS 2.1 Flash | 6.50" | 3840x1644 |


| |||||||||||||||||||||||||
Brightness Distribution: 94 %
Center on Battery: 740 cd/m²
Contrast: ∞:1 (Black: 0 cd/m²)
ΔE ColorChecker Calman: 2.6 | ∀{0.5-29.43 Ø4.71}
ΔE Greyscale Calman: 1.5 | ∀{0.09-98 Ø4.96}
99.7% sRGB (Calman 2D)
Gamma: 2.269
CCT: 6284 K
| Samsung Galaxy S20+ AMOLED, 3200x1440, 6.7" | Apple iPhone 11 Pro Max OLED, 2688x1242, 6.5" | Huawei Mate 30 Pro OLED, 2400x1176, 6.5" | OnePlus 7T Pro AMOLED, 3120x1440, 6.7" | Sony Xperia 1 OLED, 3840x1644, 6.5" | |
|---|---|---|---|---|---|
| Screen | 10% | -21% | -21% | 17% | |
| Brightness middle (cd/m²) | 740 | 790 7% | 592 -20% | 606 -18% | 541 -27% |
| Brightness (cd/m²) | 747 | 790 6% | 605 -19% | 611 -18% | 543 -27% |
| Brightness Distribution (%) | 94 | 97 3% | 96 2% | 95 1% | 99 5% |
| Black Level * (cd/m²) | |||||
| Colorchecker dE 2000 * | 2.6 | 1.4 46% | 2.5 4% | 3.46 -33% | 0.8 69% |
| Colorchecker dE 2000 max. * | 4.57 | 3.4 26% | 5.5 -20% | 5.64 -23% | 1.7 63% |
| Greyscale dE 2000 * | 1.5 | 1.9 -27% | 2.6 -73% | 2 -33% | 1.2 20% |
| Gamma | 2.269 97% | 2.23 99% | 2.16 102% | 2.258 97% | 2.2 100% |
| CCT | 6284 103% | 6466 101% | 6173 105% | 6779 96% | 6601 98% |
* ... smaller is better
Screen Flickering / PWM (Pulse-Width Modulation)
| Screen flickering / PWM detected | 214 Hz | 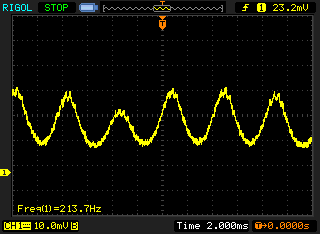 | |
The display backlight flickers at 214 Hz (worst case, e.g., utilizing PWM) . The frequency of 214 Hz is relatively low, so sensitive users will likely notice flickering and experience eyestrain at the stated brightness setting and below. In comparison: 52 % of all tested devices do not use PWM to dim the display. If PWM was detected, an average of 7757 (minimum: 5 - maximum: 343500) Hz was measured. | |||
Display Response Times
| ↔ Response Time Black to White | ||
|---|---|---|
| 8 ms ... rise ↗ and fall ↘ combined | ↗ 5 ms rise | 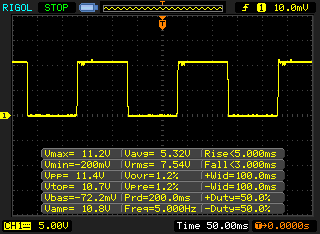 |
| ↘ 3 ms fall | ||
| The screen shows fast response rates in our tests and should be suited for gaming. In comparison, all tested devices range from 0.1 (minimum) to 240 (maximum) ms. » 22 % of all devices are better. This means that the measured response time is better than the average of all tested devices (19.8 ms). | ||
| ↔ Response Time 50% Grey to 80% Grey | ||
| 10 ms ... rise ↗ and fall ↘ combined | ↗ 5 ms rise | 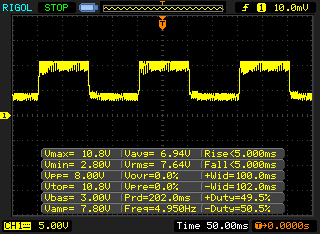 |
| ↘ 5 ms fall | ||
| The screen shows good response rates in our tests, but may be too slow for competitive gamers. In comparison, all tested devices range from 0.165 (minimum) to 636 (maximum) ms. » 23 % of all devices are better. This means that the measured response time is better than the average of all tested devices (31 ms). | ||
| PCMark for Android | |
| Work performance score (sort by value) | |
| Samsung Galaxy S20+ | |
| Huawei Mate 30 Pro | |
| OnePlus 7T Pro | |
| Sony Xperia 1 | |
| Average Samsung Exynos 990 (13627 - 14760, n=5) | |
| Work 2.0 performance score (sort by value) | |
| Samsung Galaxy S20+ | |
| Huawei Mate 30 Pro | |
| OnePlus 7T Pro | |
| Sony Xperia 1 | |
| Average Samsung Exynos 990 (10008 - 11784, n=5) | |
| AnTuTu v8 - Total Score (sort by value) | |
| Samsung Galaxy S20+ | |
| Apple iPhone 11 Pro Max | |
| Huawei Mate 30 Pro | |
| OnePlus 7T Pro | |
| Average Samsung Exynos 990 (296746 - 527820, n=5) | |
| Basemark GPU 1.1 | |
| 1920x1080 Vulkan Medium Offscreen (sort by value) | |
| Samsung Galaxy S20+ | |
| Huawei Mate 30 Pro | |
| OnePlus 7T Pro | |
| Average Samsung Exynos 990 (71.4 - 71.6, n=2) | |
| Vulkan Medium Native (sort by value) | |
| Samsung Galaxy S20+ | |
| Huawei Mate 30 Pro | |
| OnePlus 7T Pro | |
| Average Samsung Exynos 990 (42.3 - 63, n=2) | |
| 1920x1080 OpenGL Medium Offscreen (sort by value) | |
| Samsung Galaxy S20+ | |
| Huawei Mate 30 Pro | |
| OnePlus 7T Pro | |
| Average Samsung Exynos 990 (84.1 - 85.6, n=2) | |
| VRMark - Amber Room (sort by value) | |
| Samsung Galaxy S20+ | |
| Huawei Mate 30 Pro | |
| OnePlus 7T Pro | |
| Average Samsung Exynos 990 (4607 - 4957, n=3) | |
| Jetstream 2 - 2.0 Total | |
| Average of class Smartphone (63.9 - 423, n=121, last 2 years) | |
| Apple iPhone 11 Pro Max (Safari Mobile 13.1) | |
| Huawei Mate 30 Pro (Chrome 78) | |
| OnePlus 7T Pro (Chrome 78) | |
| Sony Xperia 1 (Chrome 75) | |
| Average Samsung Exynos 990 (50.6 - 56.8, n=5) | |
| Samsung Galaxy S20+ (Chrome 80) | |
| JetStream 1.1 - 1.1 Total | |
| Apple iPhone 11 Pro Max (Safari Mobile 13.1) | |
| Huawei Mate 30 Pro (Chrome 78) | |
| OnePlus 7T Pro (Chrome 78) | |
| Sony Xperia 1 | |
| Average Samsung Exynos 990 (89.3 - 96.2, n=5) | |
| Samsung Galaxy S20+ (Chrome 80) | |
| Speedometer 2.0 - Result 2.0 | |
| Average of class Smartphone (49.3 - 733, n=81, last 2 years) | |
| Apple iPhone 11 Pro Max (Safari Mobile 13.1) | |
| Huawei Mate 30 Pro (Chrome 78) | |
| OnePlus 7T Pro (Chome 78) | |
| Sony Xperia 1 (Chrome 75) | |
| Samsung Galaxy S20+ (Chome 80) | |
| Average Samsung Exynos 990 (50.8 - 64.4, n=4) | |
| WebXPRT 3 - Overall | |
| Apple iPhone 11 Pro Max (Safari Mobile 13.1) | |
| Average of class Smartphone (104 - 380, n=12, last 2 years) | |
| Huawei Mate 30 Pro (Chrome 78) | |
| Sony Xperia 1 (Chrome 75) | |
| Average Samsung Exynos 990 (86 - 102, n=5) | |
| OnePlus 7T Pro (Chrome 78) | |
| Samsung Galaxy S20+ (Chrome 80) | |
| Octane V2 - Total Score | |
| Average of class Smartphone (2800 - 126661, n=146, last 2 years) | |
| Apple iPhone 11 Pro Max (Safari Mobile 13.1) | |
| OnePlus 7T Pro (Chrome 78) | |
| Huawei Mate 30 Pro (Chrome 78) | |
| Sony Xperia 1 (Chrome 75) | |
| Average Samsung Exynos 990 (18094 - 20022, n=5) | |
| Samsung Galaxy S20+ (Chrome 80) | |
| Mozilla Kraken 1.1 - Total | |
| Samsung Galaxy S20+ (Chrome 80) | |
| Average Samsung Exynos 990 (2294 - 2511, n=5) | |
| OnePlus 7T Pro (Chrome 78) | |
| Sony Xperia 1 (Chrome 75) | |
| Huawei Mate 30 Pro (Chrome 78) | |
| Average of class Smartphone (257 - 28190, n=124, last 2 years) | |
| Apple iPhone 11 Pro Max (Safari Mobile 13.1) | |
* ... smaller is better
| Samsung Galaxy S20+ | Huawei Mate 30 Pro | OnePlus 7T Pro | Sony Xperia 1 | Average 128 GB UFS 3.0 Flash | Average of class Smartphone | |
|---|---|---|---|---|---|---|
| AndroBench 3-5 | 7% | -38% | -57% | -7% | 80% | |
| Sequential Read 256KB (MB/s) | 1603 | 1781 11% | 1489 -7% | 750 -53% | 1520 ? -5% | 2214 ? 38% |
| Sequential Write 256KB (MB/s) | 694 | 401.8 -42% | 405 -42% | 206.9 -70% | 546 ? -21% | 1894 ? 173% |
| Random Read 4KB (MB/s) | 199.6 | 226.4 13% | 169 -15% | 147.3 -26% | 206 ? 3% | 310 ? 55% |
| Random Write 4KB (MB/s) | 229.8 | 259.2 13% | 26 -89% | 24.16 -89% | 193.9 ? -16% | 356 ? 55% |
| Sequential Read 256KB SDCard (MB/s) | 66.8 ? | 82.5 ? 24% | 31.34 ? -53% | 67.3 ? 1% | ||
| Sequential Write 256KB SDCard (MB/s) | 57.6 ? | 69.2 ? 20% | 27.84 ? -52% | 55.7 ? -3% |
(±) The maximum temperature on the upper side is 44.8 °C / 113 F, compared to the average of 35.3 °C / 96 F, ranging from 21.9 to 247 °C for the class Smartphone.
(±) The bottom heats up to a maximum of 43.6 °C / 110 F, compared to the average of 34 °C / 93 F
(+) In idle usage, the average temperature for the upper side is 31.2 °C / 88 F, compared to the device average of 33 °C / 91 F.
Samsung Galaxy S20+ audio analysis
(+) | speakers can play relatively loud (85.6 dB)
Bass 100 - 315 Hz
(-) | nearly no bass - on average 73.2% lower than median
(+) | bass is linear (0% delta to prev. frequency)
Mids 400 - 2000 Hz
(-) | nearly no mids - on average 73.2% lower than median
(+) | mids are linear (0% delta to prev. frequency)
Highs 2 - 16 kHz
(-) | nearly no highs - on average 73.2% lower than median
(+) | highs are linear (0% delta to prev. frequency)
Overall 100 - 16.000 Hz
(-) | overall sound is not linear (115.8% difference to median)
Compared to same class
» 88% of all tested devices in this class were better, 4% similar, 8% worse
» The best had a delta of 11%, average was 34%, worst was 134%
Compared to all devices tested
» 96% of all tested devices were better, 1% similar, 3% worse
» The best had a delta of 4%, average was 23%, worst was 134%
Apple iPhone 11 Pro Max audio analysis
(+) | speakers can play relatively loud (85.8 dB)
Bass 100 - 315 Hz
(-) | nearly no bass - on average 15.4% lower than median
(±) | linearity of bass is average (10.3% delta to prev. frequency)
Mids 400 - 2000 Hz
(±) | higher mids - on average 5.7% higher than median
(+) | mids are linear (5.9% delta to prev. frequency)
Highs 2 - 16 kHz
(±) | higher highs - on average 8.8% higher than median
(+) | highs are linear (3.5% delta to prev. frequency)
Overall 100 - 16.000 Hz
(±) | linearity of overall sound is average (19.4% difference to median)
Compared to same class
» 28% of all tested devices in this class were better, 9% similar, 64% worse
» The best had a delta of 11%, average was 34%, worst was 134%
Compared to all devices tested
» 48% of all tested devices were better, 7% similar, 45% worse
» The best had a delta of 4%, average was 23%, worst was 134%
| Off / Standby | |
| Idle | |
| Load |
|
Key:
min: | |
| Samsung Galaxy S20+ 4500 mAh | Apple iPhone 11 Pro Max 3969 mAh | Huawei Mate 30 Pro 4500 mAh | OnePlus 7T Pro 4085 mAh | Sony Xperia 1 3330 mAh | Average Samsung Exynos 990 | Average of class Smartphone | |
|---|---|---|---|---|---|---|---|
| Power Consumption | -1% | 22% | -40% | 22% | 13% | 8% | |
| Idle Minimum * (Watt) | 1 | 0.92 8% | 0.87 13% | 2.1 -110% | 1 -0% | 0.846 ? 15% | 0.888 ? 11% |
| Idle Average * (Watt) | 1.7 | 2.9 -71% | 1.75 -3% | 3 -76% | 1.48 13% | 1.534 ? 10% | 1.481 ? 13% |
| Idle Maximum * (Watt) | 2.3 | 2.94 -28% | 1.83 20% | 3.5 -52% | 1.56 32% | 1.858 ? 19% | 1.669 ? 27% |
| Load Average * (Watt) | 5.8 | 3.65 37% | 3.85 34% | 5.3 9% | 3.76 35% | 5.14 ? 11% | 6.73 ? -16% |
| Load Maximum * (Watt) | 11.8 | 6.18 48% | 6.64 44% | 8.3 30% | 8.48 28% | 10.7 ? 9% | 11.2 ? 5% |
* ... smaller is better
| Samsung Galaxy S20+ 4500 mAh | Apple iPhone 11 Pro Max 3969 mAh | Huawei Mate 30 Pro 4500 mAh | OnePlus 7T Pro 4085 mAh | Sony Xperia 1 3330 mAh | |
|---|---|---|---|---|---|
| Battery runtime | 42% | 6% | 11% | -26% | |
| Reader / Idle (h) | 34 | 43.6 28% | 36.2 6% | 33.6 -1% | 17.8 -48% |
| H.264 (h) | 16.3 | 22.4 37% | 18.3 12% | 16 -2% | 11.9 -27% |
| WiFi v1.3 (h) | 13.2 | 15.2 15% | 13.7 4% | 15.2 15% | 7.4 -44% |
| Load (h) | 3.6 | 6.8 89% | 3.7 3% | 4.7 31% | 4.1 14% |
Pros
Cons
Verdict - Camera weaknesses

在三星以7999元推出它之后不久,Galaxy S20 +的价格已经大幅下跌。无疑,这对消费者来说是个好消息,因为他们可以通过花更少的钱来获得相同的智能手机。但是,欧洲客户将收到无法发挥其潜力的Galaxy S20 +。主要原因是三星为该设备配备了Exynos 990,它的内部芯片组在许多领域都没有达到Snapdragon 865的水平。简而言之,与Snapdragon 865相比,欧洲Galaxy S20 +的5G连接更差,在负载下的降频严重,并且CPU性能更差。总体而言,配备高通骁龙865的Galaxy S20 +版本是两款设备中最好的。
至少Exynos SoC的续航现在正在慢慢接近竞争水平。不过,Exynos 990在持续负载下比较耗电。即使是Galaxy S20 +,您都不应该期望三星拥有一流的充电技术,因为三星将其保留给了Galaxy S20 Ultra。总的来说,与S20 Ultra相比,Galaxy S20和Galaxy S20 Plus都感觉像是大幅阉割版。
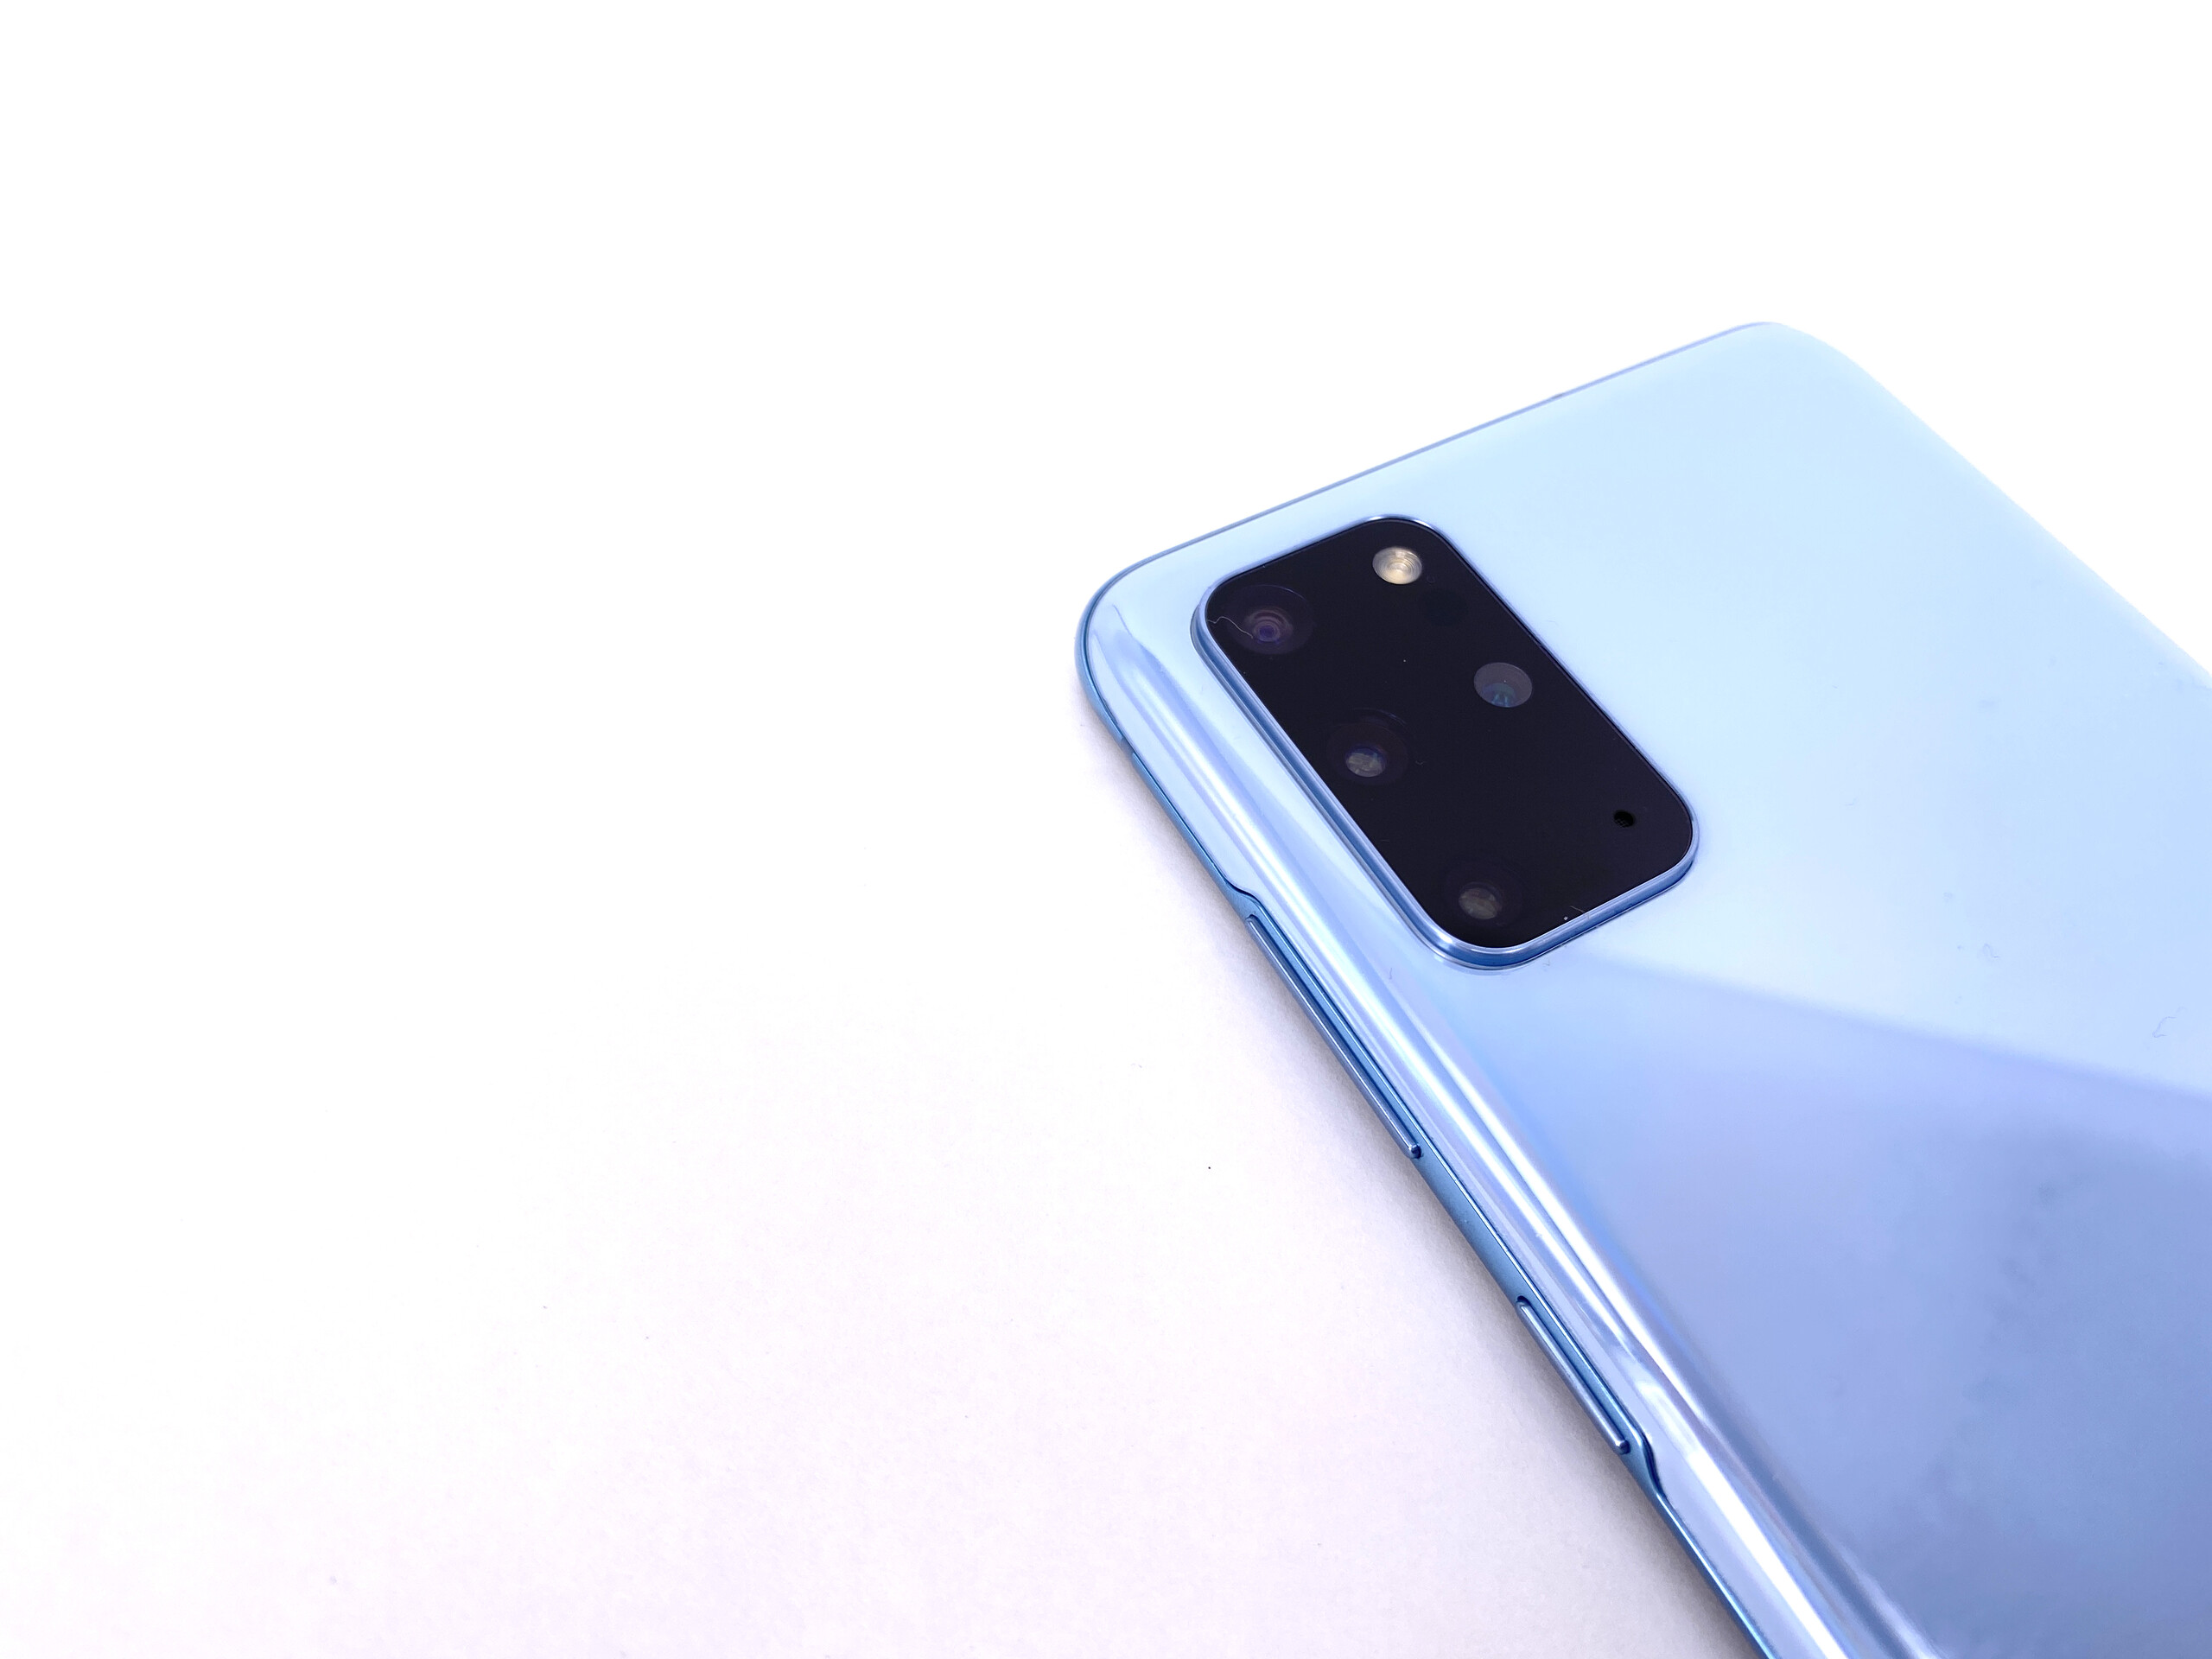
这主要是由于三星提供的相机。如果没有真正的光学变焦,三星似乎会觉得8K视频功能优先于合适的远摄镜头。但是,该公司对8K视频录制施加了许多限制,例如无法缩放或使用自动对焦。同样,三星限制以1080p及以上的分辨率拍摄60帧FPS视频时可以使用哪些选项。
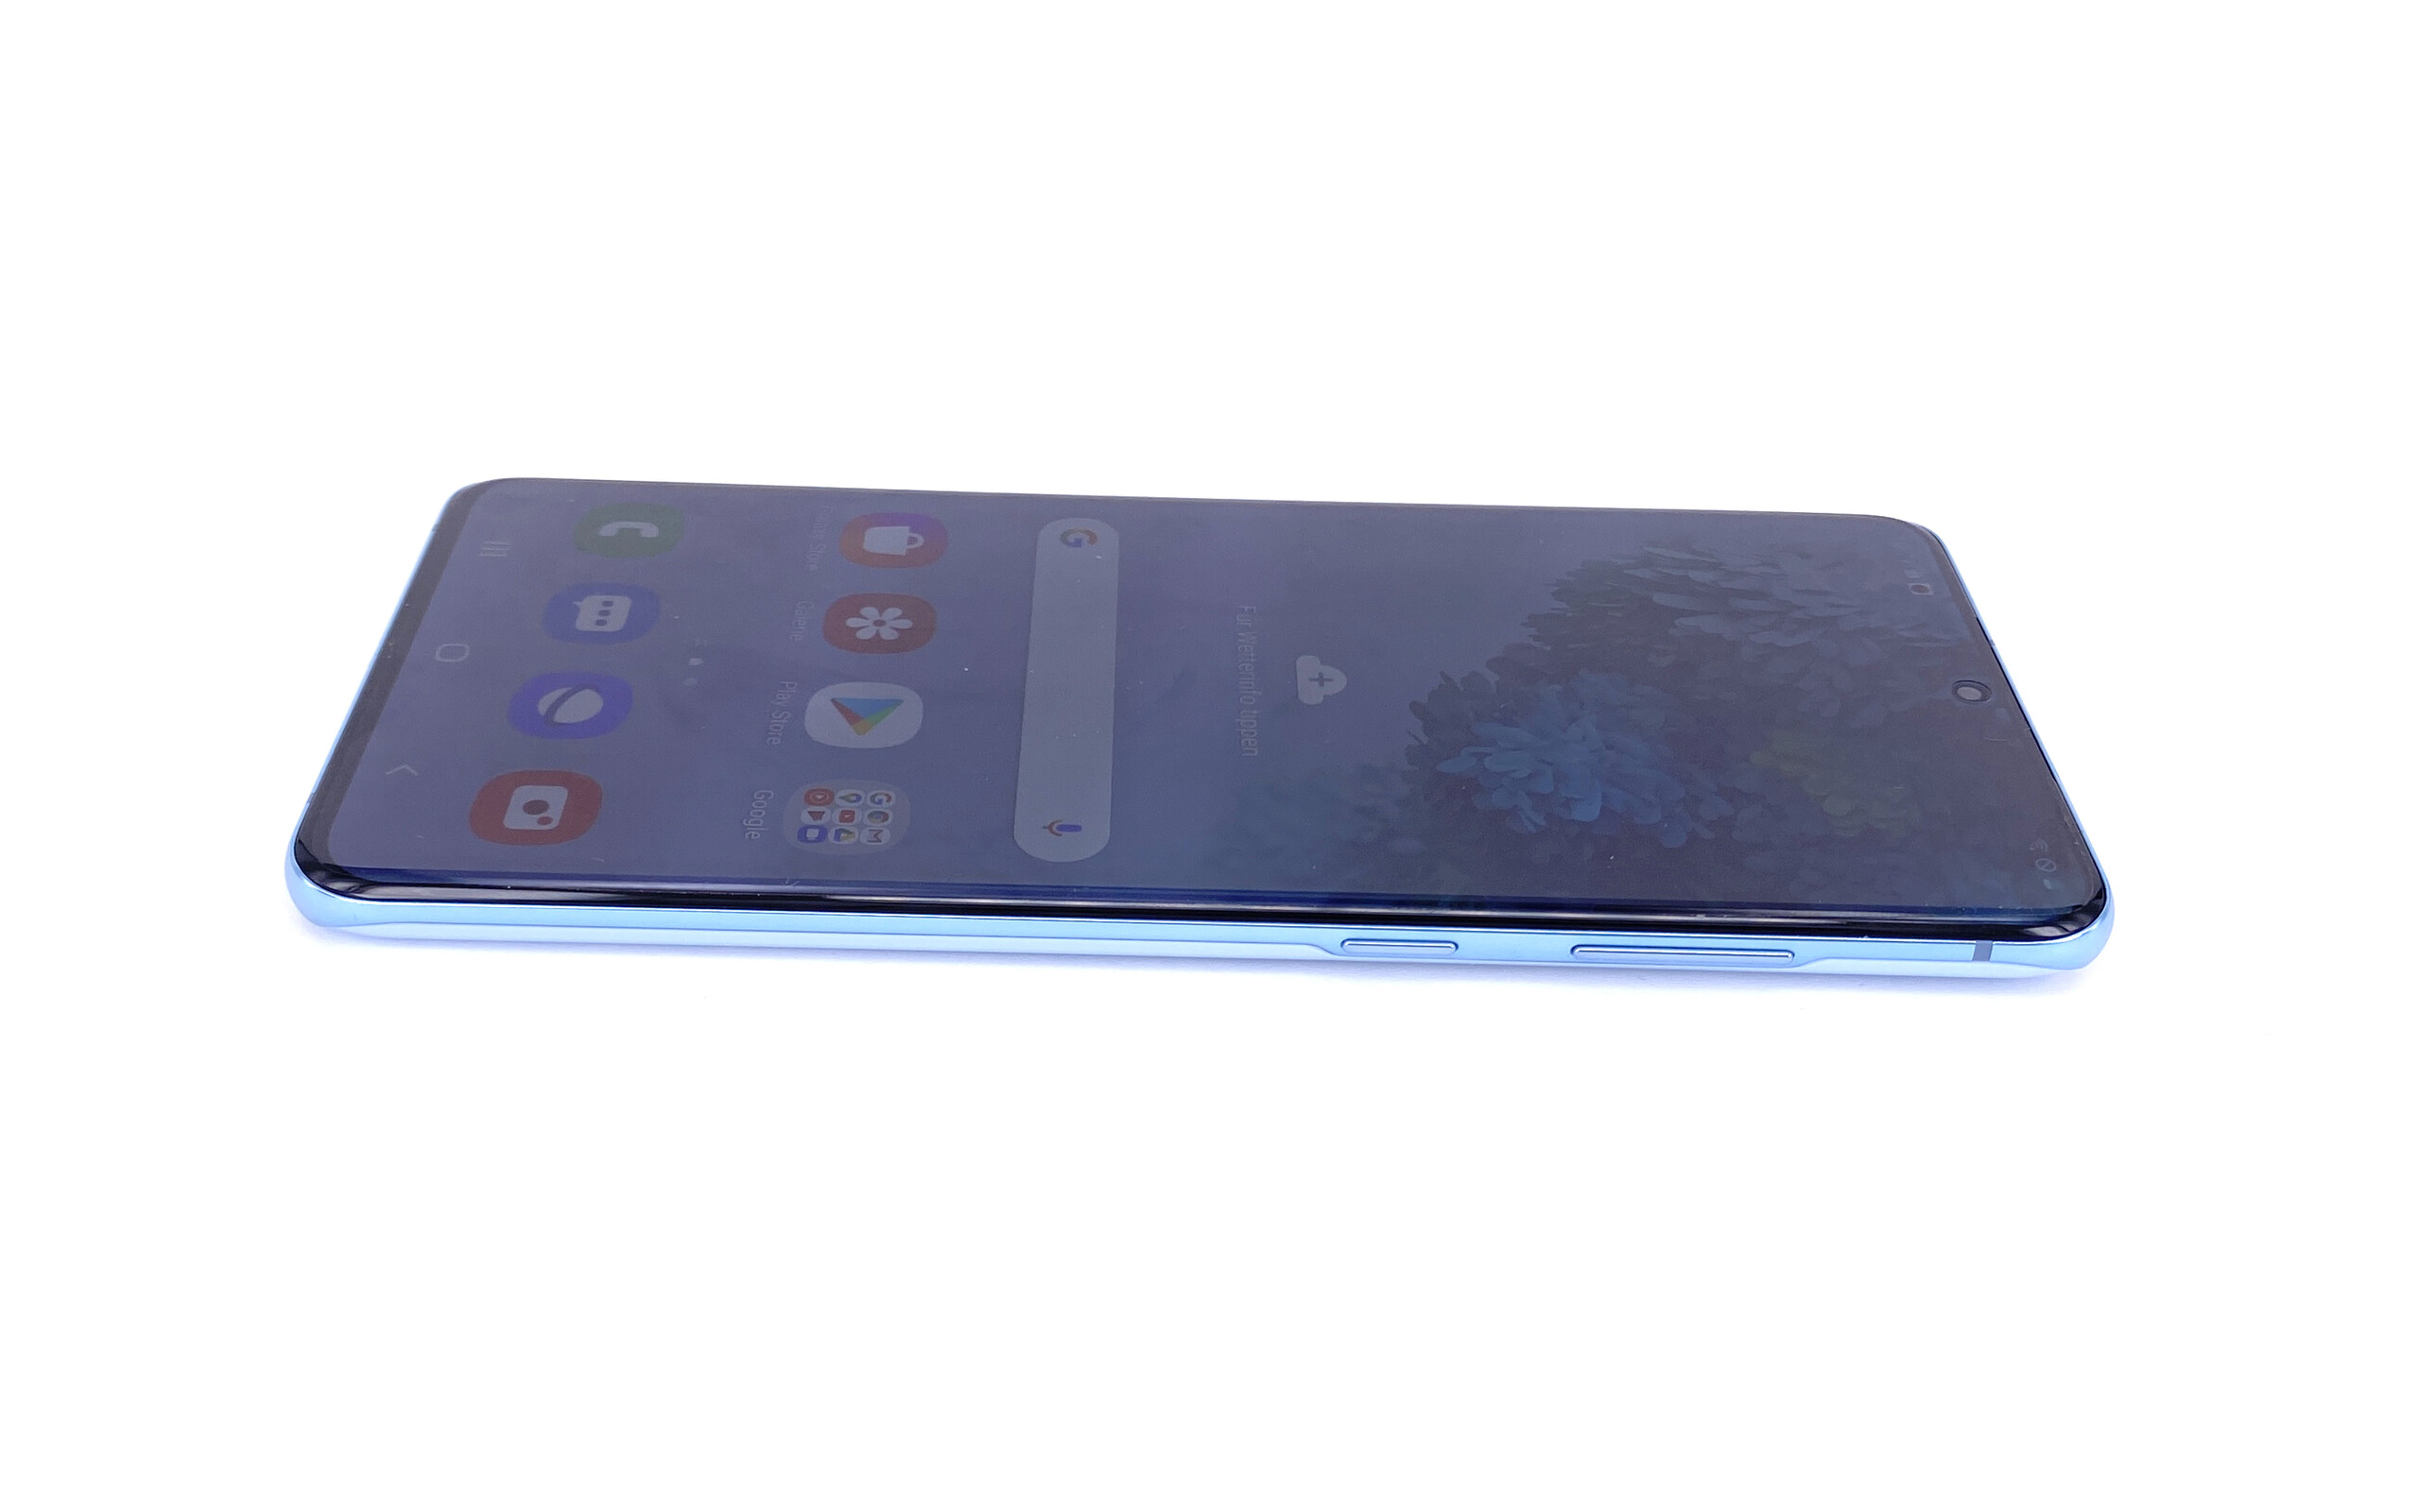
虽然Galaxy S20 +拍照表现还算可以,但相机上的省略仍然令人遗憾。One UI 2.1感觉很现代,并包含最新的安全补丁,而该设备具有明亮且响应迅速的AMOLED屏幕。
三星Galaxy S20 +使用了特殊技巧来隐藏相机的弱点。不过,其出色的屏幕仍然值得一看。
简而言之,如果您想要最好的相机智能手机,应该去看看别家的。三星将为您提供高质量的旗舰产品,该产品可凭借其Wi-Fi,良好的通话质量,出色的GPS精度,令人印象深刻的制造质量和超长的续航来为您提供惊喜。
Samsung Galaxy S20+
- 08/31/2022 v7 (old)
Florian Schmitt
Price comparison

