联想 B50-80 笔记本电脑简短评测
| |||||||||||||||||||||||||
Brightness Distribution: 88 %
Center on Battery: 178 cd/m²
Contrast: 556:1 (Black: 0.39 cd/m²)
ΔE ColorChecker Calman: 11.61 | ∀{0.5-29.43 Ø4.72}
ΔE Greyscale Calman: 12.47 | ∀{0.09-98 Ø4.97}
60% sRGB (Argyll 1.6.3 3D)
38% AdobeRGB 1998 (Argyll 1.6.3 3D)
41.17% AdobeRGB 1998 (Argyll 3D)
59.6% sRGB (Argyll 3D)
39.83% Display P3 (Argyll 3D)
Gamma: 2.41
CCT: 15458 K
| Lenovo B50-80 FHD matt TN | HP 355 G2 HD matt TN | HP Pavilion 15-p151ng FHD matt TN | HP Pavilion 17-g054ng FHD matt TN | Acer Aspire V15 Nitro VN7-571G-574H FHD matt IPS | Acer Aspire E5-571G-520X FHD matt TN | |
|---|---|---|---|---|---|---|
| Display | -12% | 36% | 64% | 46% | 38% | |
| Display P3 Coverage (%) | 39.83 | 35.1 -12% | 54.8 38% | 66.1 66% | 63.2 59% | 55.9 40% |
| sRGB Coverage (%) | 59.6 | 52.9 -11% | 78.8 32% | 96.1 61% | 80.6 35% | 80.7 35% |
| AdobeRGB 1998 Coverage (%) | 41.17 | 36.26 -12% | 56.5 37% | 68.1 65% | 58.9 43% | 57.8 40% |
| Screen | -40% | -8% | 45% | 41% | -9% | |
| Brightness middle (cd/m²) | 217 | 211 -3% | 293 35% | 294 35% | 320 47% | 223 3% |
| Brightness (cd/m²) | 208 | 213 2% | 280 35% | 270 30% | 283 36% | 226 9% |
| Brightness Distribution (%) | 88 | 78 -11% | 83 -6% | 86 -2% | 83 -6% | 91 3% |
| Black Level * (cd/m²) | 0.39 | 1.21 -210% | 0.8 -105% | 0.31 21% | 0.32 18% | 0.77 -97% |
| Contrast (:1) | 556 | 174 -69% | 366 -34% | 948 71% | 1000 80% | 290 -48% |
| Colorchecker dE 2000 * | 11.61 | 13.28 -14% | 13.19 -14% | 3.72 68% | 5.31 54% | 10.13 13% |
| Greyscale dE 2000 * | 12.47 | 13.28 -6% | 13.41 -8% | 5.23 58% | 4.73 62% | 11.68 6% |
| Gamma | 2.41 91% | 2.52 87% | 3.38 65% | 2.4 92% | 2.36 93% | 2.92 75% |
| CCT | 15458 42% | 17759 37% | 13185 49% | 7270 89% | 5980 109% | 12592 52% |
| Color Space (Percent of AdobeRGB 1998) (%) | 38 | 34 -11% | 51 34% | 61.9 63% | 52.9 39% | 52 37% |
| Color Space (Percent of sRGB) (%) | 60 | 95.9 60% | ||||
| Total Average (Program / Settings) | -26% /
-32% | 14% /
4% | 55% /
50% | 44% /
42% | 15% /
4% |
* ... smaller is better
| Cinebench R15 | |
| CPU Single 64Bit (sort by value) | |
| Lenovo B50-80 | |
| HP 355 G2 | |
| HP Pavilion 15-p151ng | |
| HP Pavilion 17-g054ng | |
| Acer Aspire V15 Nitro VN7-571G-574H | |
| Acer Aspire E5-571G-520X | |
| CPU Multi 64Bit (sort by value) | |
| Lenovo B50-80 | |
| HP 355 G2 | |
| HP Pavilion 15-p151ng | |
| HP Pavilion 17-g054ng | |
| Acer Aspire V15 Nitro VN7-571G-574H | |
| Acer Aspire E5-571G-520X | |
| Cinebench R11.5 | |
| CPU Single 64Bit (sort by value) | |
| Lenovo B50-80 | |
| HP 355 G2 | |
| HP Pavilion 15-p151ng | |
| HP Pavilion 17-g054ng | |
| Acer Aspire V15 Nitro VN7-571G-574H | |
| Acer Aspire E5-571G-520X | |
| CPU Multi 64Bit (sort by value) | |
| Lenovo B50-80 | |
| HP 355 G2 | |
| HP Pavilion 15-p151ng | |
| HP Pavilion 17-g054ng | |
| Acer Aspire V15 Nitro VN7-571G-574H | |
| Acer Aspire E5-571G-520X | |
| PCMark 7 | |
| Score (sort by value) | |
| Lenovo B50-80 | |
| HP Pavilion 15-p151ng | |
| HP Pavilion 17-g054ng | |
| Acer Aspire V15 Nitro VN7-571G-574H | |
| Acer Aspire E5-571G-520X | |
| Lightweight (sort by value) | |
| Lenovo B50-80 | |
| HP Pavilion 15-p151ng | |
| Acer Aspire V15 Nitro VN7-571G-574H | |
| Acer Aspire E5-571G-520X | |
| Productivity (sort by value) | |
| Lenovo B50-80 | |
| HP Pavilion 15-p151ng | |
| Acer Aspire V15 Nitro VN7-571G-574H | |
| Acer Aspire E5-571G-520X | |
| Entertainment (sort by value) | |
| Lenovo B50-80 | |
| HP Pavilion 15-p151ng | |
| Acer Aspire V15 Nitro VN7-571G-574H | |
| Acer Aspire E5-571G-520X | |
| Creativity (sort by value) | |
| Lenovo B50-80 | |
| HP Pavilion 15-p151ng | |
| Acer Aspire V15 Nitro VN7-571G-574H | |
| Acer Aspire E5-571G-520X | |
| PCMark 8 | |
| Home Score Accelerated v2 (sort by value) | |
| Lenovo B50-80 | |
| HP 355 G2 | |
| HP Pavilion 15-p151ng | |
| HP Pavilion 17-g054ng | |
| Acer Aspire V15 Nitro VN7-571G-574H | |
| Acer Aspire E5-571G-520X | |
| Work Score Accelerated v2 (sort by value) | |
| Lenovo B50-80 | |
| HP 355 G2 | |
| HP Pavilion 15-p151ng | |
| HP Pavilion 17-g054ng | |
| Acer Aspire V15 Nitro VN7-571G-574H | |
| Acer Aspire E5-571G-520X | |
| PCMark 7 Score | 2643 points | |
| PCMark 8 Home Score Accelerated v2 | 2964 points | |
| PCMark 8 Work Score Accelerated v2 | 3675 points | |
Help | ||
| Lenovo B50-80 Radeon R5 M330, 5200U, Seagate Momentus SpinPoint M8 ST1000LM024 HN-M101MBB | HP 355 G2 Radeon R5 M240, A8-6410, Toshiba MQ01ABF050 | HP Pavilion 15-p151ng Radeon R7 M260, A10-5745M, Seagate ST1000LM014 Solid State Hybrid Drive | HP Pavilion 17-g054ng Radeon R8 M365DX, A10-8700P, Seagate Momentus SpinPoint M8 ST1000LM024 HN-M101MBB | Acer Aspire V15 Nitro VN7-571G-574H GeForce GTX 850M, 5200U, Seagate ST500LM000 Solid State Hybrid Drive | Acer Aspire E5-571G-520X GeForce 840M, 5200U, Toshiba MQ01ABD100 | |
|---|---|---|---|---|---|---|
| CrystalDiskMark 3.0 | 32% | 89% | -9% | 24% | 8% | |
| Read 4k (MB/s) | 0.319 | 0.483 51% | 0.395 24% | 0.306 -4% | 0.448 40% | 0.444 39% |
| Write 4k (MB/s) | 0.824 | 1.175 43% | 4.506 447% | 0.687 -17% | 0.626 -24% | 0.895 9% |
| Read Seq (MB/s) | 103.2 | 108.4 5% | 109.4 6% | 97 -6% | 120.7 17% | 97.6 -5% |
| Write Seq (MB/s) | 102.6 | 104.9 2% | 108.1 5% | 95.6 -7% | 118.6 16% | 91.6 -11% |
| Read 4k QD32 (MB/s) | 0.709 | 0.995 40% | 1.054 49% | 0.666 -6% | 0.85 20% | 0.795 12% |
| Write 4k QD32 (MB/s) | 0.842 | 1.252 49% | 0.863 2% | 0.734 -13% | 1.477 75% | 0.887 5% |

| 3DMark 11 | |
| 1280x720 Performance (sort by value) | |
| Lenovo B50-80 | |
| HP 355 G2 | |
| HP Pavilion 15-p151ng | |
| HP Pavilion 17-g054ng | |
| Acer Aspire V15 Nitro VN7-571G-574H | |
| Acer Aspire E5-571G-520X | |
| 1280x720 Performance GPU (sort by value) | |
| Lenovo B50-80 | |
| HP 355 G2 | |
| HP Pavilion 15-p151ng | |
| HP Pavilion 17-g054ng | |
| Acer Aspire V15 Nitro VN7-571G-574H | |
| Acer Aspire E5-571G-520X | |
| 3DMark | |
| 1280x720 Cloud Gate Standard Score (sort by value) | |
| Lenovo B50-80 | |
| HP 355 G2 | |
| HP Pavilion 15-p151ng | |
| HP Pavilion 17-g054ng | |
| Acer Aspire V15 Nitro VN7-571G-574H | |
| Acer Aspire E5-571G-520X | |
| 1280x720 Cloud Gate Standard Graphics (sort by value) | |
| Lenovo B50-80 | |
| HP 355 G2 | |
| HP Pavilion 15-p151ng | |
| HP Pavilion 17-g054ng | |
| Acer Aspire V15 Nitro VN7-571G-574H | |
| Acer Aspire E5-571G-520X | |
| 1280x720 Cloud Gate Standard Physics (sort by value) | |
| Lenovo B50-80 | |
| HP 355 G2 | |
| HP Pavilion 15-p151ng | |
| HP Pavilion 17-g054ng | |
| Acer Aspire V15 Nitro VN7-571G-574H | |
| Acer Aspire E5-571G-520X | |
| 3DMark 06 Standard Score | 5662 points | |
| 3DMark 11 Performance | 1723 points | |
| 3DMark Ice Storm Standard Score | 28314 points | |
| 3DMark Cloud Gate Standard Score | 4010 points | |
| 3DMark Fire Strike Score | 791 points | |
Help | ||
| Tomb Raider - 1024x768 Low Preset (sort by value) | |
| Lenovo B50-80 | |
| Medion Akoya E7416 | |
| HP 355 G2 | |
| HP Pavilion 15-p151ng | |
| HP Pavilion 17-g054ng | |
| Acer Aspire V15 Nitro VN7-571G-574H | |
| Acer Aspire E5-571G-520X | |
| BioShock Infinite - 1280x720 Very Low Preset (sort by value) | |
| Lenovo B50-80 | |
| Medion Akoya E7416 | |
| HP 355 G2 | |
| HP Pavilion 15-p151ng | |
| HP Pavilion 17-g054ng | |
| Acer Aspire V15 Nitro VN7-571G-574H | |
| Acer Aspire E5-571G-520X | |
| low | med. | high | ultra | |
|---|---|---|---|---|
| Crysis 3 (2013) | 19.1 | 11.9 | 8.4 | |
| Tomb Raider (2013) | 49.1 | 26.2 | 17.1 | 9 |
| BioShock Infinite (2013) | 46.3 | 26 | 21.5 | 8 |
| Battlefield 4 (2013) | 34.3 | 24.2 | 16.1 | 5.8 |
| Thief (2014) | 19.1 | 12.3 | ||
| Sims 4 (2014) | 32.7 | 15.3 | ||
| Fifa 15 (2014) | 33 | 15.6 | ||
| Middle-earth: Shadow of Mordor (2014) | 21.7 | 15.25 | ||
| Alien: Isolation (2014) | 26.2 | 15.1 | 9.5 | |
| F1 2014 (2014) | 72 | 40 | 20 | 16 |
| Call of Duty: Advanced Warfare (2014) | 37.5 | 21.6 | 14.1 | |
| Dragon Age: Inquisition (2014) | 27.1 | 15.9 | 13.2 | |
| Evolve (2015) | 20.1 | 15 | 8.3 | |
| Battlefield Hardline (2015) | 37.5 | 26.4 | 9 | |
| Dirt Rally (2015) | 70 | 18.4 | 12.5 | |
| Metal Gear Solid V (2015) | 40.5 | 26.5 | 9.8 | |
| Mad Max (2015) | 17.4 | 9.6 |
| Lenovo B50-80 Radeon R5 M330, 5200U, Seagate Momentus SpinPoint M8 ST1000LM024 HN-M101MBB | HP 355 G2 Radeon R5 M240, A8-6410, Toshiba MQ01ABF050 | HP Pavilion 15-p151ng Radeon R7 M260, A10-5745M, Seagate ST1000LM014 Solid State Hybrid Drive | HP Pavilion 17-g054ng Radeon R8 M365DX, A10-8700P, Seagate Momentus SpinPoint M8 ST1000LM024 HN-M101MBB | Acer Aspire V15 Nitro VN7-571G-574H GeForce GTX 850M, 5200U, Seagate ST500LM000 Solid State Hybrid Drive | Acer Aspire E5-571G-520X GeForce 840M, 5200U, Toshiba MQ01ABD100 | |
|---|---|---|---|---|---|---|
| Noise | -2% | -5% | 6% | 4% | 7% | |
| Idle Minimum * (dB) | 33.5 | 33.2 1% | 30.8 8% | 31.9 5% | 32.7 2% | |
| Idle Average * (dB) | 33.5 | 33.2 1% | 32.2 4% | 30.8 8% | 31.9 5% | 32.7 2% |
| Idle Maximum * (dB) | 33.6 | 33.8 -1% | 32.2 4% | 31.2 7% | 32.2 4% | 32.7 3% |
| Load Average * (dB) | 40.4 | 42 -4% | 45.3 -12% | 37.8 6% | 37 8% | 34.2 15% |
| Load Maximum * (dB) | 42.9 | 46.5 -8% | 49.4 -15% | 43.4 -1% | 43.3 -1% | 37.8 12% |
* ... smaller is better
Noise level
| Idle |
| 33.5 / 33.5 / 33.6 dB(A) |
| DVD |
| 36 / dB(A) |
| Load |
| 40.4 / 42.9 dB(A) |
 | ||
30 dB silent 40 dB(A) audible 50 dB(A) loud |
||
min: | ||
| Lenovo B50-80 Radeon R5 M330, 5200U, Seagate Momentus SpinPoint M8 ST1000LM024 HN-M101MBB | HP 355 G2 Radeon R5 M240, A8-6410, Toshiba MQ01ABF050 | HP Pavilion 15-p151ng Radeon R7 M260, A10-5745M, Seagate ST1000LM014 Solid State Hybrid Drive | HP Pavilion 17-g054ng Radeon R8 M365DX, A10-8700P, Seagate Momentus SpinPoint M8 ST1000LM024 HN-M101MBB | Acer Aspire V15 Nitro VN7-571G-574H GeForce GTX 850M, 5200U, Seagate ST500LM000 Solid State Hybrid Drive | Acer Aspire E5-571G-520X GeForce 840M, 5200U, Toshiba MQ01ABD100 | |
|---|---|---|---|---|---|---|
| Heat | 9% | -3% | 3% | -1% | 3% | |
| Maximum Upper Side * (°C) | 41.2 | 37.2 10% | 38.7 6% | 38.2 7% | 48.2 -17% | 41.3 -0% |
| Maximum Bottom * (°C) | 42.5 | 36 15% | 46 -8% | 34.2 20% | 39.5 7% | 44 -4% |
| Idle Upper Side * (°C) | 28.4 | 26.5 7% | 29.6 -4% | 30.8 -8% | 28.3 -0% | 26.1 8% |
| Idle Bottom * (°C) | 28.8 | 28 3% | 30.2 -5% | 30.5 -6% | 27 6% | 26.7 7% |
* ... smaller is better
(±) The maximum temperature on the upper side is 41.2 °C / 106 F, compared to the average of 34.3 °C / 94 F, ranging from 21.2 to 62.5 °C for the class Office.
(±) The bottom heats up to a maximum of 42.5 °C / 109 F, compared to the average of 36.8 °C / 98 F
(+) In idle usage, the average temperature for the upper side is 26.9 °C / 80 F, compared to the device average of 29.5 °C / 85 F.
(+) The palmrests and touchpad are reaching skin temperature as a maximum (34.8 °C / 94.6 F) and are therefore not hot.
(-) The average temperature of the palmrest area of similar devices was 27.5 °C / 81.5 F (-7.3 °C / -13.1 F).
| Lenovo B50-80 Radeon R5 M330, 5200U, Seagate Momentus SpinPoint M8 ST1000LM024 HN-M101MBB | HP 355 G2 Radeon R5 M240, A8-6410, Toshiba MQ01ABF050 | HP Pavilion 15-p151ng Radeon R7 M260, A10-5745M, Seagate ST1000LM014 Solid State Hybrid Drive | HP Pavilion 17-g054ng Radeon R8 M365DX, A10-8700P, Seagate Momentus SpinPoint M8 ST1000LM024 HN-M101MBB | Acer Aspire V15 Nitro VN7-571G-574H GeForce GTX 850M, 5200U, Seagate ST500LM000 Solid State Hybrid Drive | Acer Aspire E5-571G-520X GeForce 840M, 5200U, Toshiba MQ01ABD100 | |
|---|---|---|---|---|---|---|
| Power Consumption | 9% | -78% | -30% | -43% | -5% | |
| Idle Minimum * (Watt) | 6.9 | 3.9 43% | 10.3 -49% | 4.1 41% | 5.4 22% | 5.4 22% |
| Idle Average * (Watt) | 8.1 | 6.6 19% | 15.7 -94% | 9.6 -19% | 11.5 -42% | 8.2 -1% |
| Idle Maximum * (Watt) | 9.2 | 7.6 17% | 16.5 -79% | 11 -20% | 12.8 -39% | 10.5 -14% |
| Load Average * (Watt) | 29.7 | 35.7 -20% | 56.7 -91% | 57.6 -94% | 48.6 -64% | 36 -21% |
| Load Maximum * (Watt) | 41.4 | 46.2 -12% | 73.3 -77% | 65.7 -59% | 79.8 -93% | 46.7 -13% |
* ... smaller is better
| Off / Standby | |
| Idle | |
| Load |
|
Key:
min: | |
| Battery runtime | |
| Reader / Idle (sort by value) | |
| Lenovo B50-80 | |
| HP Pavilion 15-p151ng | |
| HP Pavilion 17-g054ng | |
| Acer Aspire V15 Nitro VN7-571G-574H | |
| Acer Aspire E5-571G-520X | |
| WiFi v1.3 (sort by value) | |
| Lenovo B50-80 | |
| HP Pavilion 17-g054ng | |
| Acer Aspire V15 Nitro VN7-571G-574H | |
| Load (sort by value) | |
| Lenovo B50-80 | |
| HP Pavilion 15-p151ng | |
| HP Pavilion 17-g054ng | |
| Acer Aspire V15 Nitro VN7-571G-574H | |
| Acer Aspire E5-571G-520X | |
| WiFi (sort by value) | |
| HP 355 G2 | |
| HP Pavilion 15-p151ng | |
| Acer Aspire E5-571G-520X | |
Pros
Cons
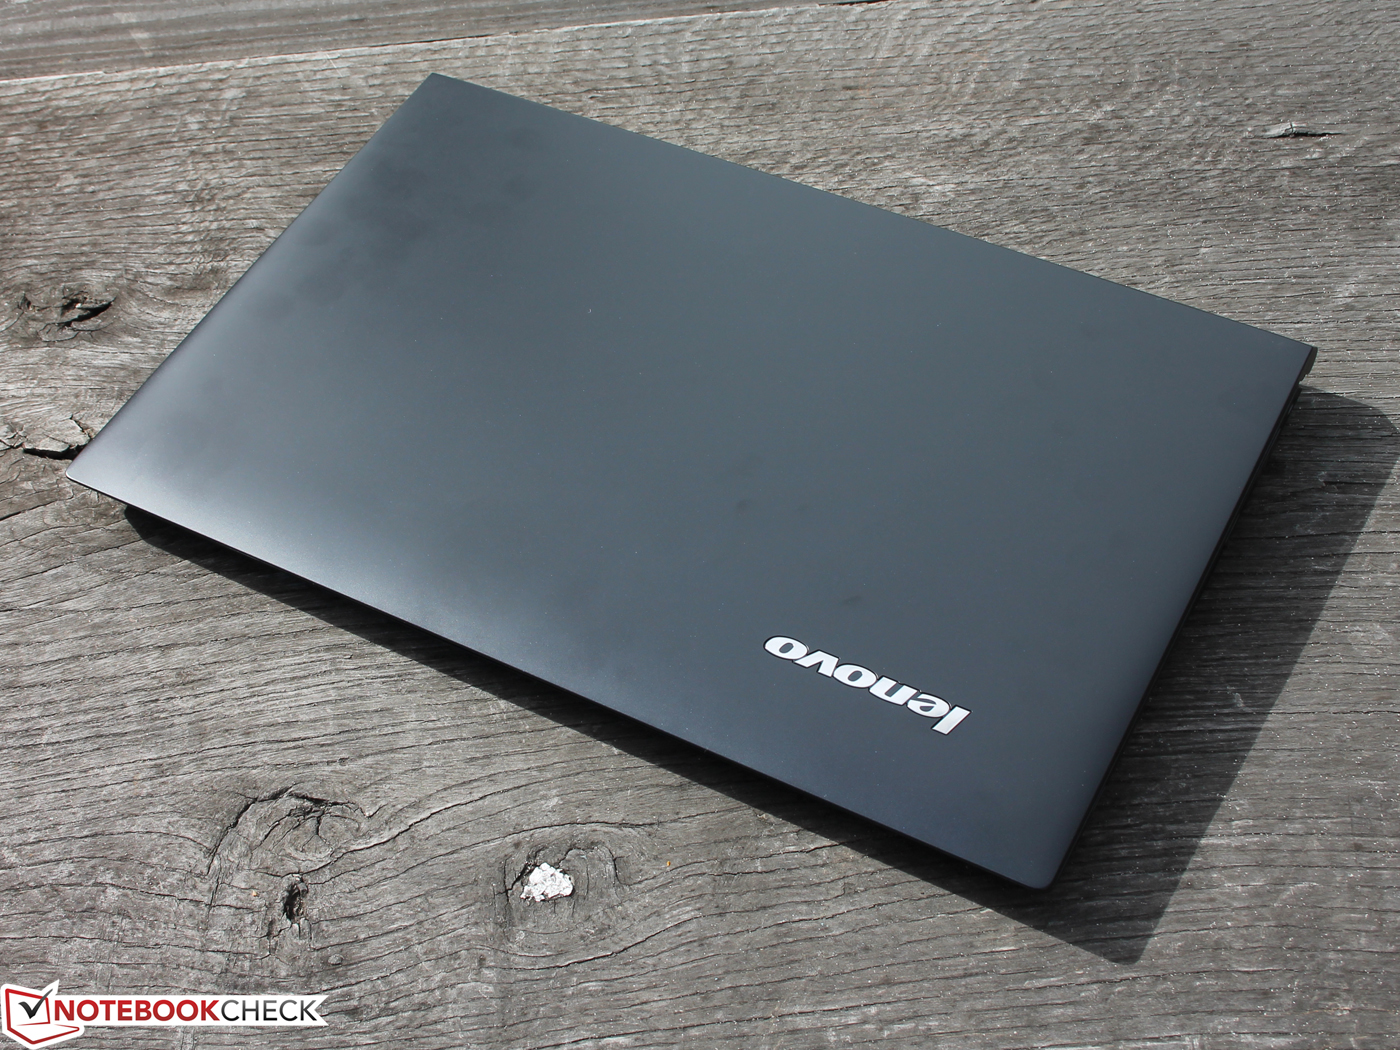
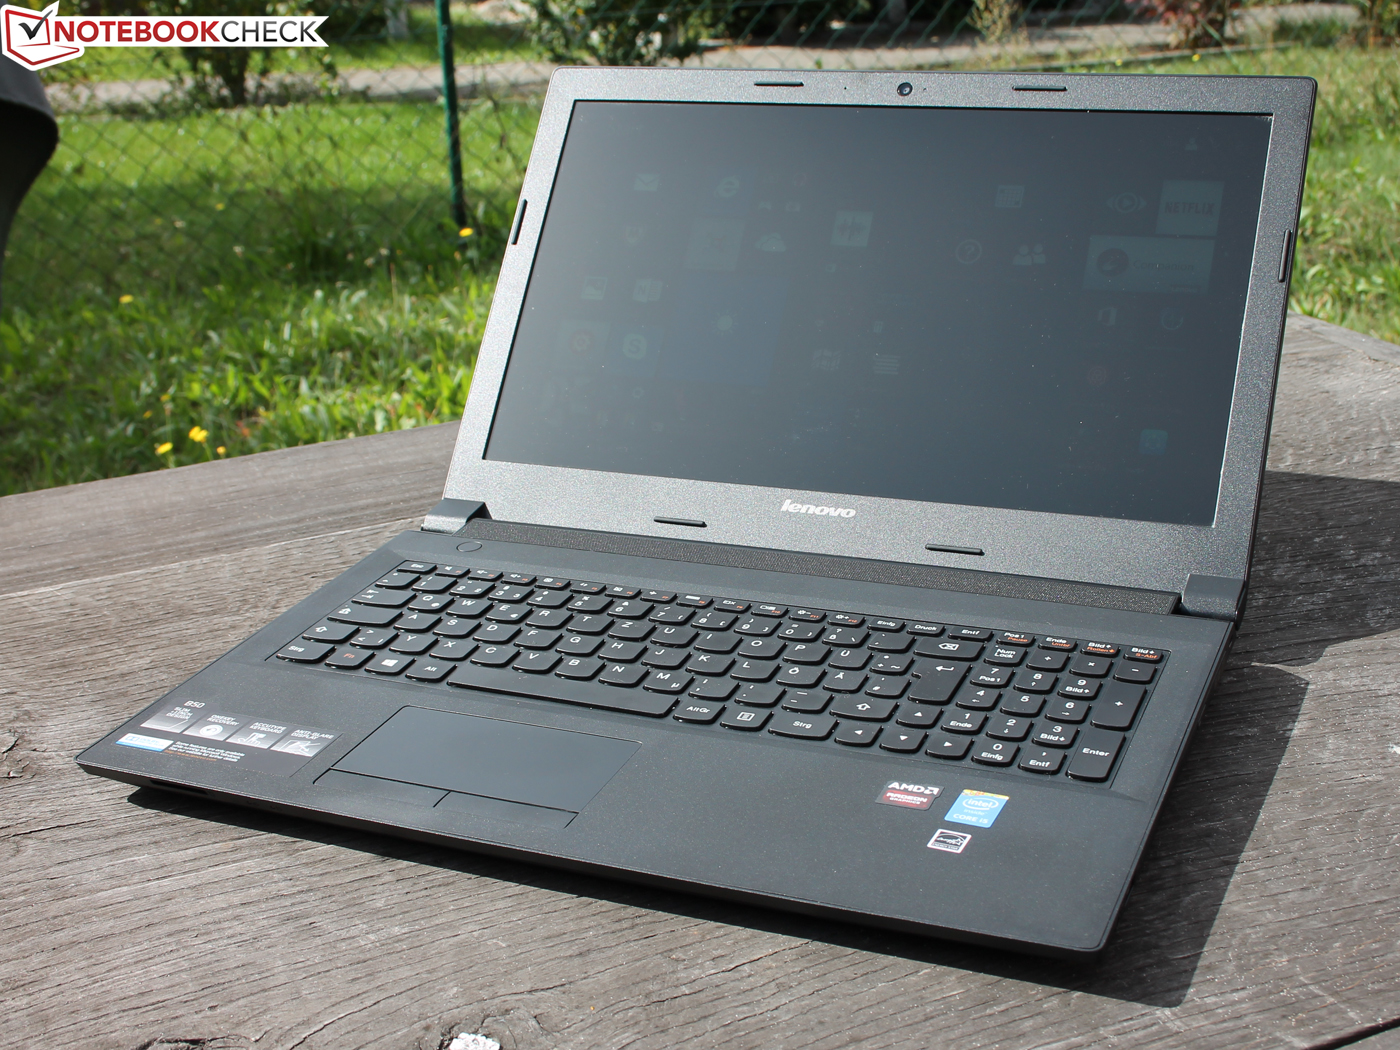
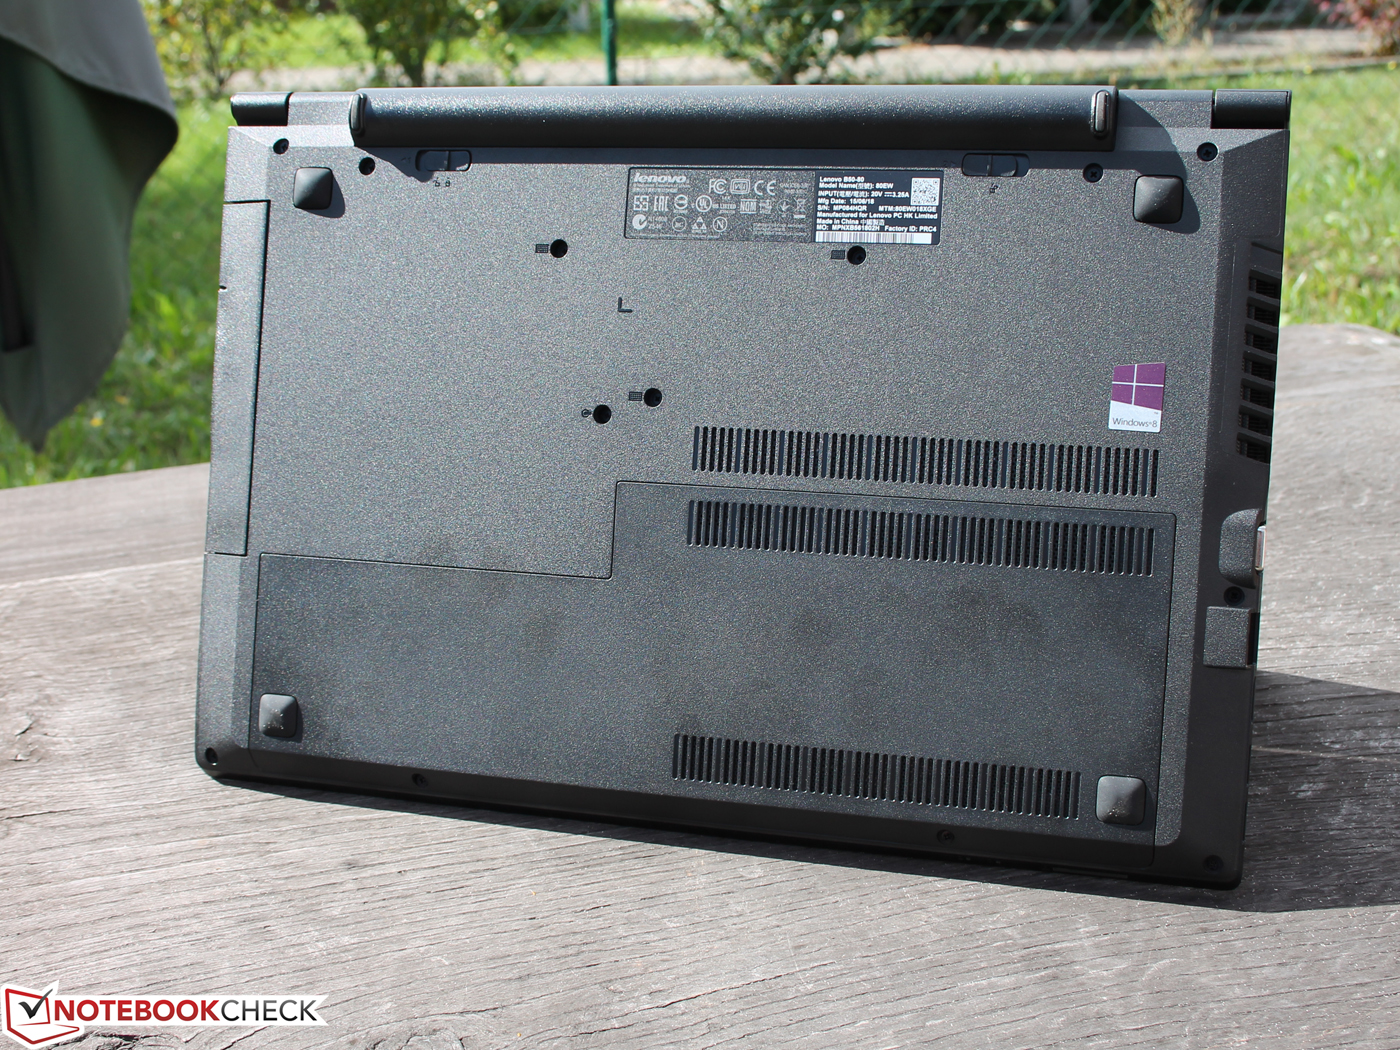
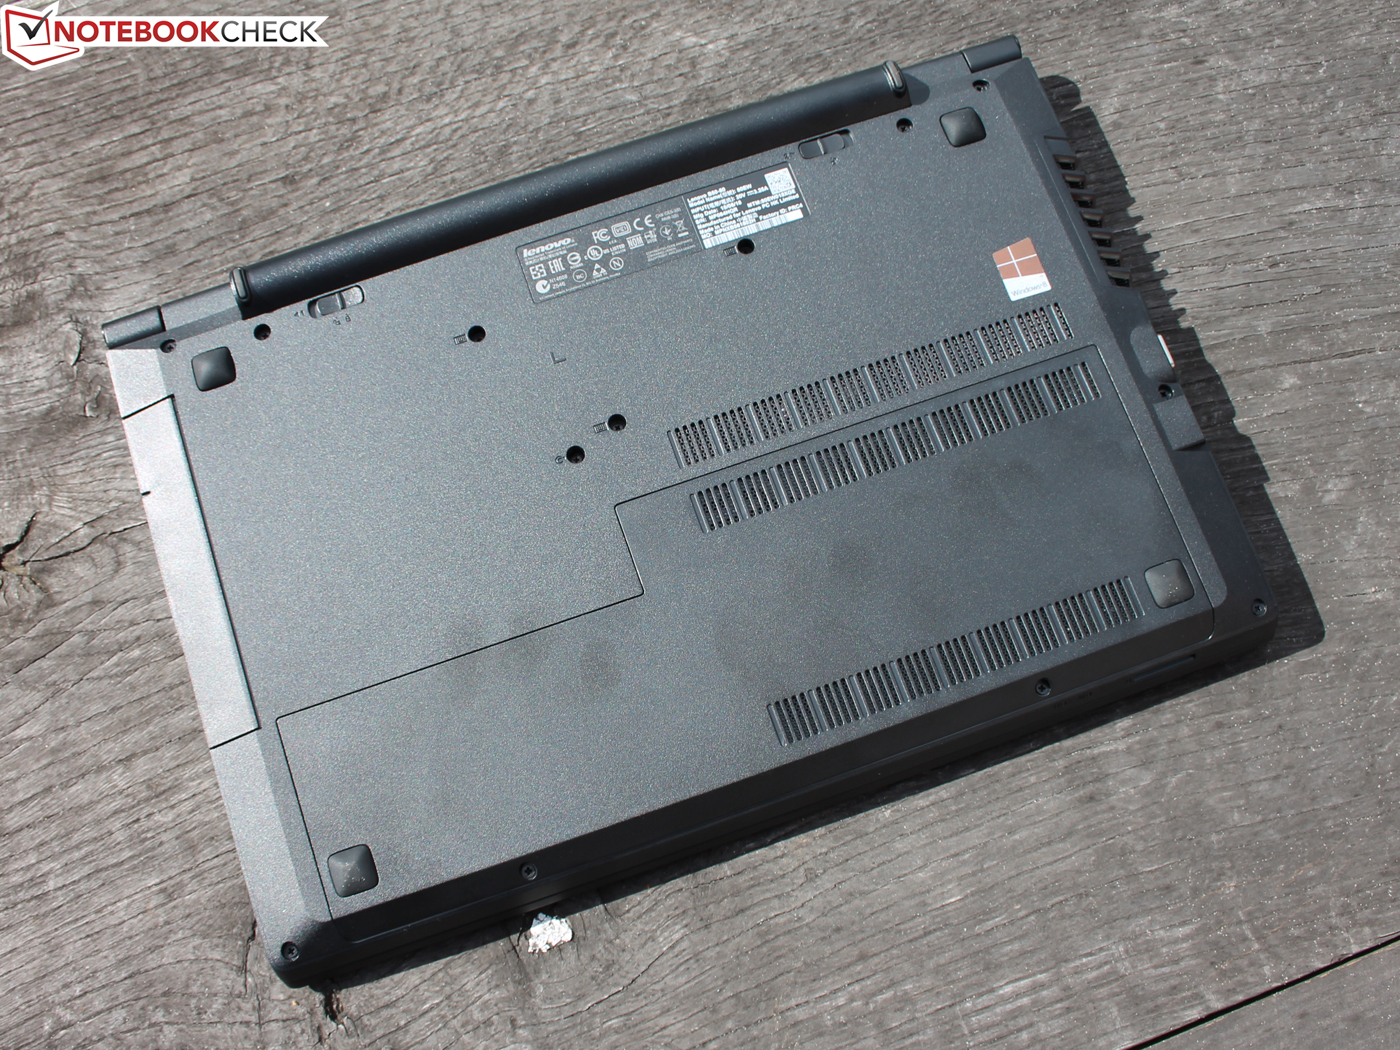
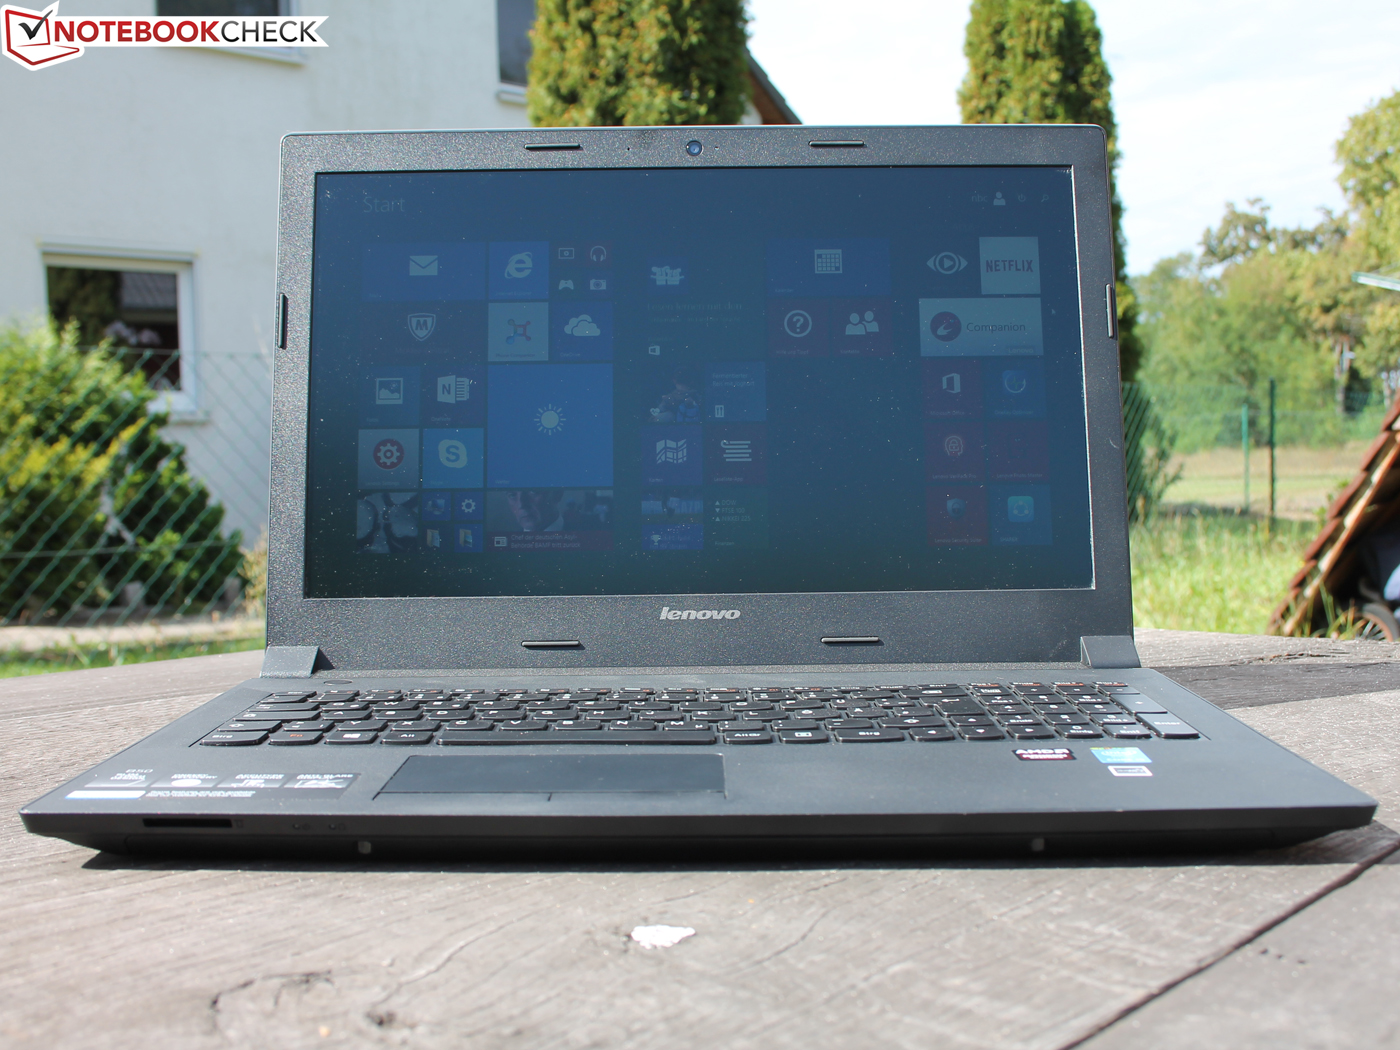
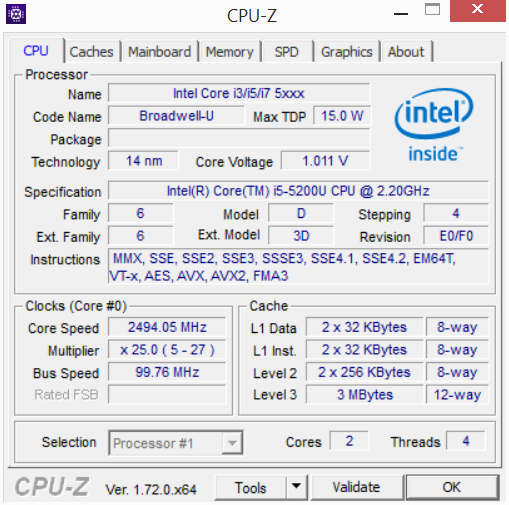
联想推出了一台中规中矩的15寸设备,不过它在任何方面都不算出众。看上去廉价感十足的机身不是很坚固,部件的接缝也不均匀。它可能很难给用户带来自豪感。输入设备方面它也让人十分失望:键盘和触控板都无法让我们满意。尽管键盘的狭小按键可以正常使用,不过它的反馈有些僵硬。质量如此差的键盘在笔记本电脑中十分少见。我们认为它的希捷硬盘表现也十分不佳,在实际使用中它让程序加载时间显得异乎冗长。
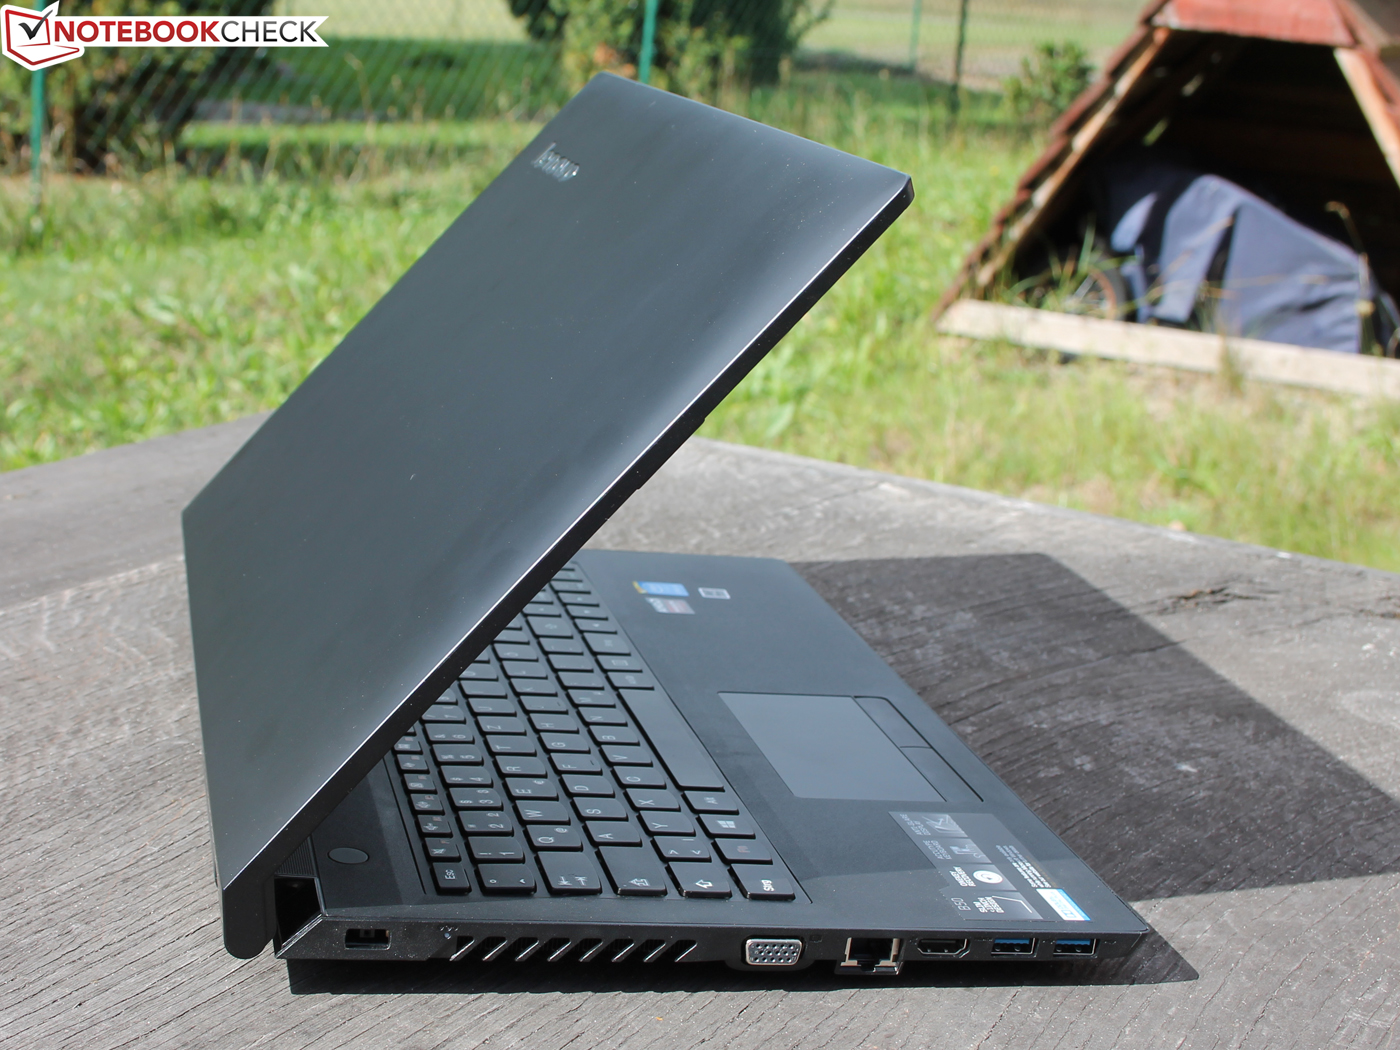
联想在散热控制上做得不错。它的硬件可以在正常性能上工作而不会受到温度的影响(Turbo得到了充分利用)。B50可以一直保持清凉,在压力测试中也不会非常吵人。遗憾的是,风扇在长时间待机时也没有自动停止。
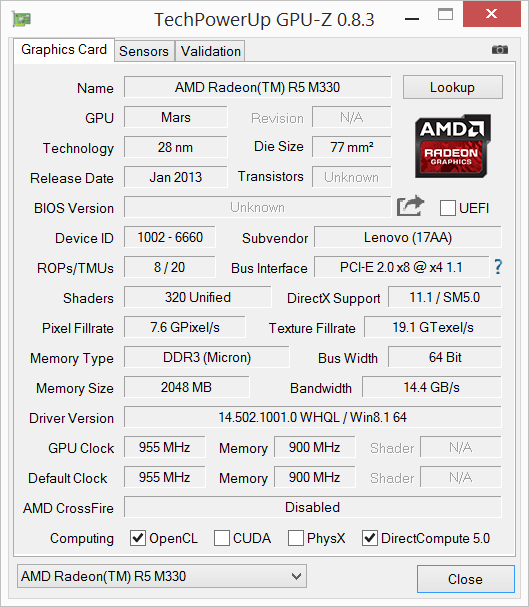
B50搭配的Radeon R5并不适合游戏。最新游戏通常只能在低细节设置下运行。尽管TN面板提供了不错的对比度和均匀的亮度分布,它的全高清磨砂屏幕也很难在游戏中完全得到利用。不过,让人遗憾的事它的色彩有些偏蓝。由于本身亮度过低,加之在电池模式下的进一步降低,这块TFT屏幕在户外几乎无法使用。
因此B50几乎没有任何优势,而略低于680欧元(约4911人民币)的售价也不吸引人。有限的游戏性能和较差的工艺品质(机身,输入设备)在这个价位没有什么吸引力。
而基于同样机身的350欧元(约2527人民币)售价机型则会给人不同的感受。因此,我们认为搭配更优秀输入设备、屏幕和显卡的多媒体机型更加值得考虑。
首先值得考虑的是Acer的Aspire V Nitro VN7-571G(Core i5, GTX 850M)和Aspire E5-571G(Core i5, 840M)。后者售价甚至低于600欧元(约4333人民币)。同样还有惠普的Pavilion 17-g054ng(AMD A-Series A10-8700P),它提供了更强的游戏性能(R8 M365DX)。惠普的355 G2(A-Series A8-6410)没有搭配全高清屏幕,不过采用了几乎相同的(低端)显卡,售价仅350欧元(约2527人民币)。
注:本文是基于完整评测的缩减版本,阅读完整的英文评测,请点击这里。
Lenovo B50-80
- 09/19/2015 v4 (old)
Sebastian Jentsch