Apple iPad mini 5 平板电脑评测
| Networking | |
| iperf3 transmit AX12 | |
| Samsung Galaxy Tab S4 | |
| Xiaomi Mi Pad 4 | |
| Huawei MediaPad M5 8.4 | |
| Apple iPad Mini 5 | |
| iperf3 receive AX12 | |
| Xiaomi Mi Pad 4 | |
| Samsung Galaxy Tab S4 | |
| Apple iPad Mini 5 | |
| Huawei MediaPad M5 8.4 | |


| |||||||||||||||||||||||||
Brightness Distribution: 87 %
Center on Battery: 515 cd/m²
Contrast: 858:1 (Black: 0.6 cd/m²)
ΔE ColorChecker Calman: 0.88 | ∀{0.5-29.43 Ø4.71}
ΔE Greyscale Calman: 1.4 | ∀{0.09-98 Ø4.96}
99.7% sRGB (Calman 2D)
Gamma: 2.183
CCT: 6944 K
| Apple iPad Mini 5 IPS, 2048x1536, 7.9" | Apple iPad Mini 4 IPS, 2048x1536, 7.9" | Samsung Galaxy Tab S4 Super AMOLED, 2560x1600, 10.5" | Huawei MediaPad M5 8.4 IPS, 2560x1600, 8.4" | Xiaomi Mi Pad 4 IPS LCD, 1920x1200, 8" | |
|---|---|---|---|---|---|
| Screen | -40% | -69% | -176% | -138% | |
| Brightness middle (cd/m²) | 515 | 411 -20% | 474 -8% | 405 -21% | 454 -12% |
| Brightness (cd/m²) | 495 | 421 -15% | 477 -4% | 392 -21% | 411 -17% |
| Brightness Distribution (%) | 87 | 91 5% | 91 5% | 92 6% | 83 -5% |
| Black Level * (cd/m²) | 0.6 | 0.58 3% | 0.67 -12% | 0.73 -22% | |
| Contrast (:1) | 858 | 709 -17% | 604 -30% | 622 -28% | |
| Colorchecker dE 2000 * | 0.88 | 2.15 -144% | 2.5 -184% | 5.78 -557% | 5.2 -491% |
| Colorchecker dE 2000 max. * | 2.15 | 5.8 -170% | 9.82 -357% | 8.36 -289% | |
| Greyscale dE 2000 * | 1.4 | 2.72 -94% | 2.1 -50% | 7.2 -414% | 4.7 -236% |
| Gamma | 2.183 101% | 2.29 96% | 2.08 106% | 2.278 97% | 2.271 97% |
| CCT | 6944 94% | 7012 93% | 6281 103% | 8405 77% | 7361 88% |
* ... smaller is better
Screen Flickering / PWM (Pulse-Width Modulation)
| Screen flickering / PWM detected | 5556 Hz | ≤ 25 % brightness setting | 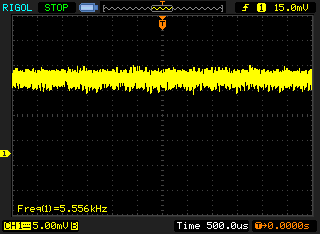 |
The display backlight flickers at 5556 Hz (worst case, e.g., utilizing PWM) Flickering detected at a brightness setting of 25 % and below. There should be no flickering or PWM above this brightness setting. The frequency of 5556 Hz is quite high, so most users sensitive to PWM should not notice any flickering. In comparison: 52 % of all tested devices do not use PWM to dim the display. If PWM was detected, an average of 7744 (minimum: 5 - maximum: 343500) Hz was measured. | |||
Display Response Times
| ↔ Response Time Black to White | ||
|---|---|---|
| 20 ms ... rise ↗ and fall ↘ combined | ↗ 7 ms rise | 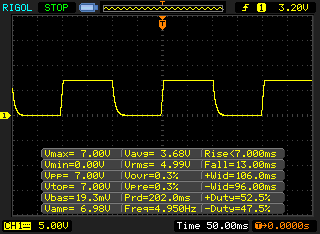 |
| ↘ 13 ms fall | ||
| The screen shows good response rates in our tests, but may be too slow for competitive gamers. In comparison, all tested devices range from 0.1 (minimum) to 240 (maximum) ms. » 44 % of all devices are better. This means that the measured response time is similar to the average of all tested devices (19.8 ms). | ||
| ↔ Response Time 50% Grey to 80% Grey | ||
| 30 ms ... rise ↗ and fall ↘ combined | ↗ 5 ms rise | 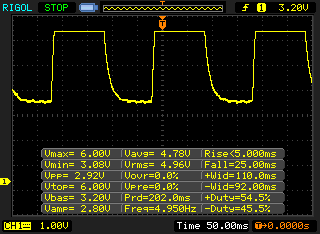 |
| ↘ 25 ms fall | ||
| The screen shows slow response rates in our tests and will be unsatisfactory for gamers. In comparison, all tested devices range from 0.165 (minimum) to 636 (maximum) ms. » 40 % of all devices are better. This means that the measured response time is similar to the average of all tested devices (30.9 ms). | ||
| GFXBench 3.0 | |
| on screen Manhattan Onscreen OGL | |
| Average of class Tablet (14 - 165, n=57, last 2 years) | |
| Average Apple A12 Bionic (58 - 60, n=6) | |
| Apple iPad Mini 5 | |
| Samsung Galaxy Tab S4 | |
| Huawei MediaPad M5 8.4 | |
| Xiaomi Mi Pad 4 | |
| Apple iPad Mini 4 | |
| 1920x1080 1080p Manhattan Offscreen | |
| Average of class Tablet (15 - 532, n=57, last 2 years) | |
| Average Apple A12 Bionic (107 - 139, n=6) | |
| Apple iPad Mini 5 | |
| Samsung Galaxy Tab S4 | |
| Huawei MediaPad M5 8.4 | |
| Xiaomi Mi Pad 4 | |
| Apple iPad Mini 4 | |
| AnTuTu v7 - Total Score | |
| Apple iPad Mini 5 | |
| Average Apple A12 Bionic (302955 - 370545, n=4) | |
| Samsung Galaxy Tab S4 | |
| Huawei MediaPad M5 8.4 | |
| Xiaomi Mi Pad 4 | |
| Basemark ES 3.1 / Metal - offscreen Overall Score | |
| Average of class Tablet (255 - 5784, n=6, last 2 years) | |
| Apple iPad Mini 5 | |
| Average Apple A12 Bionic (2407 - 2873, n=6) | |
| Apple iPad Mini 4 | |
| Octane V2 - Total Score | |
| Average of class Tablet (1633 - 138481, n=71, last 2 years) | |
| Average Apple A12 Bionic (41367 - 43280, n=6) | |
| Apple iPad Mini 5 (Safari 12.1) | |
| Samsung Galaxy Tab S4 (Samsung Browser 8.0) | |
| Huawei MediaPad M5 8.4 (Chrome 66) | |
| Xiaomi Mi Pad 4 (Chrome 68) | |
| Apple iPad Mini 4 (Safari iOS 9) | |
| Mozilla Kraken 1.1 - Total | |
| Xiaomi Mi Pad 4 (Chrome 68) | |
| Huawei MediaPad M5 8.4 (Chrome 66) | |
| Samsung Galaxy Tab S4 (Samsung Browser 8.0) | |
| Apple iPad Mini 4 (Safari iOS 9) | |
| Average of class Tablet (243 - 16233, n=65, last 2 years) | |
| Apple iPad Mini 5 (Safari 12.1) | |
| Average Apple A12 Bionic (603 - 653, n=6) | |
| WebXPRT 3 - Overall | |
| Average of class Tablet (168 - 520, n=10, last 2 years) | |
| Apple iPad Mini 5 (Safari 12.1) | |
| Average Apple A12 Bionic (155 - 166, n=6) | |
| Samsung Galaxy Tab S4 (Samsung Browser 8.0) | |
| Huawei MediaPad M5 8.4 (Chrome 66) | |
| Speedometer 2.0 - Result 2.0 | |
| Average of class Tablet (6.8 - 790, n=33, last 2 years) | |
| Average Apple A12 Bionic (123 - 139, n=4) | |
| Apple iPad Mini 5 (Safari 12.1) | |
| Jetstream 2 - 2.0 Total | |
| Average of class Tablet (35.8 - 420, n=55, last 2 years) | |
| Average Apple A12 Bionic (108.4 - 123.8, n=4) | |
| Apple iPad Mini 5 (Safari 12.1) | |
* ... smaller is better
Arena of Valor
PUBG Compare
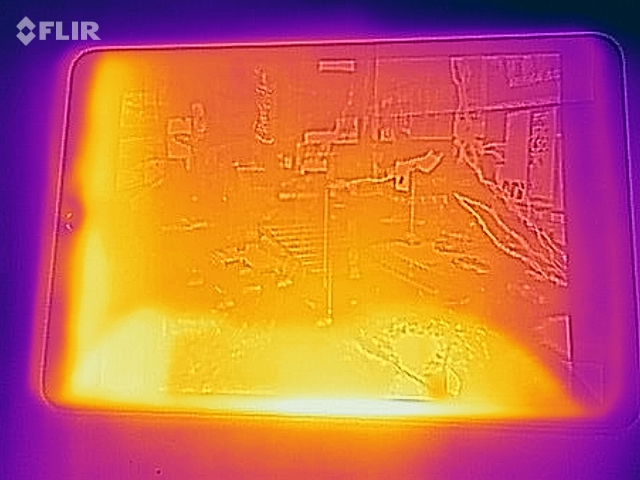
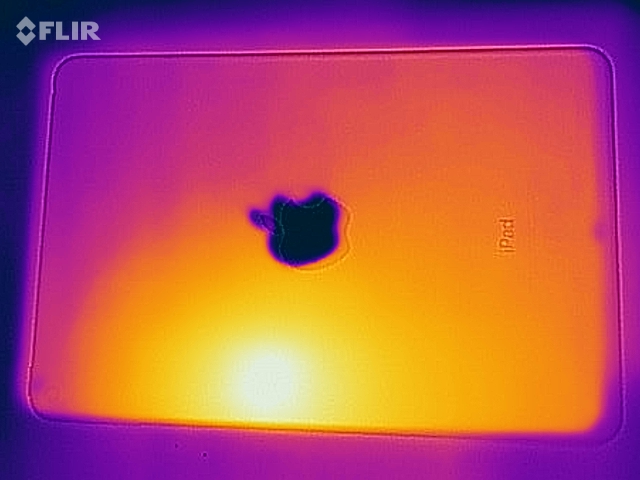
(+) The maximum temperature on the upper side is 38.3 °C / 101 F, compared to the average of 33.7 °C / 93 F, ranging from 20.7 to 53.2 °C for the class Tablet.
(+) The bottom heats up to a maximum of 37.4 °C / 99 F, compared to the average of 33.2 °C / 92 F
(+) In idle usage, the average temperature for the upper side is 24.8 °C / 77 F, compared to the device average of 30 °C / 86 F.
Apple iPad Mini 5 audio analysis
(+) | speakers can play relatively loud (83.6 dB)
Bass 100 - 315 Hz
(-) | nearly no bass - on average 72% lower than median
(+) | bass is linear (0% delta to prev. frequency)
Mids 400 - 2000 Hz
(-) | nearly no mids - on average 72% lower than median
(+) | mids are linear (0% delta to prev. frequency)
Highs 2 - 16 kHz
(-) | nearly no highs - on average 72% lower than median
(+) | highs are linear (0% delta to prev. frequency)
Overall 100 - 16.000 Hz
(-) | overall sound is not linear (129.2% difference to median)
Compared to same class
» 100% of all tested devices in this class were better, 0% similar, 0% worse
» The best had a delta of 7%, average was 20%, worst was 129%
Compared to all devices tested
» 99% of all tested devices were better, 1% similar, 0% worse
» The best had a delta of 4%, average was 23%, worst was 134%
Huawei MediaPad M5 8.4 audio analysis
(+) | speakers can play relatively loud (85 dB)
Bass 100 - 315 Hz
(-) | nearly no bass - on average 19.2% lower than median
(±) | linearity of bass is average (12.5% delta to prev. frequency)
Mids 400 - 2000 Hz
(+) | balanced mids - only 3.6% away from median
(+) | mids are linear (2.7% delta to prev. frequency)
Highs 2 - 16 kHz
(+) | balanced highs - only 4.2% away from median
(+) | highs are linear (3.5% delta to prev. frequency)
Overall 100 - 16.000 Hz
(±) | linearity of overall sound is average (15.9% difference to median)
Compared to same class
» 36% of all tested devices in this class were better, 6% similar, 58% worse
» The best had a delta of 7%, average was 20%, worst was 129%
Compared to all devices tested
» 25% of all tested devices were better, 5% similar, 70% worse
» The best had a delta of 4%, average was 23%, worst was 134%
| Off / Standby | |
| Idle | |
| Load |
|
Key:
min: | |
| Apple iPad Mini 5 5124 mAh | Apple iPad Mini 4 mAh | Samsung Galaxy Tab S4 7300 mAh | Huawei MediaPad M5 8.4 5100 mAh | Xiaomi Mi Pad 4 6000 mAh | |
|---|---|---|---|---|---|
| Power Consumption | 15% | -2% | -10% | 10% | |
| Idle Minimum * (Watt) | 1.3 | 0.8 38% | 1.76 -35% | 2.1 -62% | 1.2 8% |
| Idle Average * (Watt) | 2.2 | 3.6 -64% | 4.22 -92% | 3.74 -70% | 2.2 -0% |
| Idle Maximum * (Watt) | 5.3 | 3.9 26% | 4.25 20% | 4.33 18% | 4.1 23% |
| Load Average * (Watt) | 9.8 | 6.1 38% | 4.52 54% | 6.32 36% | 8.2 16% |
| Load Maximum * (Watt) | 12.5 | 8 36% | 7.35 41% | 9.13 27% | 12.2 2% |
* ... smaller is better
| Apple iPad Mini 5 5124 mAh | Apple iPad Mini 4 mAh | Samsung Galaxy Tab S4 7300 mAh | Huawei MediaPad M5 8.4 5100 mAh | Xiaomi Mi Pad 4 6000 mAh | |
|---|---|---|---|---|---|
| Battery runtime | -5% | -6% | 4% | 7% | |
| Reader / Idle (h) | 28.9 | 24.8 -14% | 20.5 -29% | 19.2 -34% | 22.7 -21% |
| H.264 (h) | 14.9 | 10.7 -28% | 12.3 -17% | 11.7 -21% | 15.2 2% |
| WiFi v1.3 (h) | 13.2 | 9 -32% | 8.3 -37% | 10.5 -20% | 13.8 5% |
| Load (h) | 2.6 | 4 54% | 4.1 58% | 5 92% | 3.7 42% |
Pros
Cons
Apple决定不改变第五代iPad mini的设计,而是去针对所有那些想在老机子里面装新硬件的人设计了一台平板电脑。而这正是iPad mini 5所提供的。 Apple A12 Bionic提供卓越的性能,新的前置FaceTime相机是一个非常不错的升级,视频通话肯定会因此受益。 iOS 12.2是最新的,除非Apple突然更改其更新策略,否则将定期接收安全更新。
iPad mini 5在我们熟知的机身中提供全新的硬件。虽然也有可能是因为Apple无法想出一个新的但没必要的设计。
希望升级现有Apple设备的用户可以毫不犹豫买这台平板。那些还未被说服的人应该了解iPad mini的局限性。首先,由于缺少microSD卡插槽,内部存储无法扩展,因此唯一的选择仍然是云存储。苹果公司对LTE连接的溢价相当奇特,在竞争的Android设备上,它往往远低于120美元。仅支持Wi-Fi的版本也缺少GPS模块,在iPad和PC之间传输数据比预期的要复杂得多。然而,iPad mini 5以其令人印象深刻的性能推动了销售额。
Apple iPad Mini 5
- 09/16/2019 v7 (old)
Mike Wobker
Price comparison

