 Deutsch
 English
 Español
 Français
 Italiano
 Nederlands
 Polski
 Português
 Русский
 Türkçe
 Svenska
 Chinese
 Magyar
微星 GT72VR 7RE Dominator Pro 笔记本电脑简短评测


| SD Card Reader | |
| average JPG Copy Test (av. of 3 runs) | |
| MSI GT72VR 6RE-015US | |
| MSI GT72VR 7RE-433 | |
| Gigabyte P57X v6 | |
| HP Omen 17-w110ng | |
| Asus GL702VM-GC102D | |
| maximum AS SSD Seq Read Test (1GB) | |
| MSI GT72VR 7RE-433 | |
| MSI GT72VR 6RE-015US | |
| Gigabyte P57X v6 | |
| HP Omen 17-w110ng | |
| Asus GL702VM-GC102D | |
| Networking | |
| iperf3 transmit AX12 | |
| MSI GT72VR 7RE-433 | |
| HP Omen 17-w110ng | |
| iperf3 receive AX12 | |
| HP Omen 17-w110ng | |
| MSI GT72VR 7RE-433 | |
| |||||||||||||||||||||||||
Brightness Distribution: 87 %
Center on Battery: 299 cd/m²
Contrast: 1107:1 (Black: 0.27 cd/m²)
ΔE Color 9.65 | 0.5-29.43 Ø5
ΔE Greyscale 9.68 | 0.57-98 Ø5.3
100% sRGB (Argyll 1.6.3 3D)
75% AdobeRGB 1998 (Argyll 1.6.3 3D)
63.4% AdobeRGB 1998 (Argyll 2.2.0 3D)
86.7% sRGB (Argyll 2.2.0 3D)
68.3% Display P3 (Argyll 2.2.0 3D)
Gamma: 1.89
| MSI GT72VR 7RE-433 Chi Mei N173HHE-G32 (CMN1747), 1920x1080 | MSI GT72VR 6RE-015US LG Philips LGD046E, 1920x1080 | Asus GL702VM-GC102D LG Philips LP173WF4-SPF3, 1920x1080 | HP Omen 17-w110ng LG Philips LGD046E, 1920x1080 | Gigabyte P57X v6 LGD0469, 1920x1080 | |
|---|---|---|---|---|---|
| Display | 0% | -4% | -3% | 1% | |
| Display P3 Coverage | 68.3 | 68.3 0% | 65.1 -5% | 66.6 -2% | 68 0% |
| sRGB Coverage | 86.7 | 86.7 0% | 83.5 -4% | 84.1 -3% | 87.5 1% |
| AdobeRGB 1998 Coverage | 63.4 | 63.4 0% | 61.1 -4% | 61.5 -3% | 64 1% |
| Response Times | -140% | -130% | -136% | -141% | |
| Response Time Grey 50% / Grey 80% * | 29 ? | 34.4 ? -19% | 38 ? -31% | 37 ? -28% | 33.6 ? -16% |
| Response Time Black / White * | 7 ? | 25.2 ? -260% | 23 ? -229% | 24 ? -243% | 25.6 ? -266% |
| PWM Frequency | |||||
| Screen | 16% | -6% | 15% | 11% | |
| Brightness middle | 299 | 348.7 17% | 326 9% | 362 21% | 329.2 10% |
| Brightness | 277 | 327 18% | 312 13% | 342 23% | 321 16% |
| Brightness Distribution | 87 | 89 2% | 91 5% | 87 0% | 93 7% |
| Black Level * | 0.27 | 0.323 -20% | 0.5 -85% | 0.31 -15% | 0.267 1% |
| Contrast | 1107 | 1080 -2% | 652 -41% | 1168 6% | 1233 11% |
| Colorchecker dE 2000 * | 9.65 | 4.09 58% | 6.3 35% | 4.5 53% | 5.93 39% |
| Colorchecker dE 2000 max. * | 15.43 | 9.02 42% | 11.69 24% | 9.31 40% | 11.07 28% |
| Greyscale dE 2000 * | 9.68 | 2.14 78% | 7.37 24% | 3.48 64% | 6.72 31% |
| Gamma | 1.89 116% | 2.25 98% | 2.37 93% | 2.23 99% | 2.12 104% |
| CCT | 11652 56% | 6885 94% | 7116 91% | 6144 106% | 7611 85% |
| Color Space (Percent of AdobeRGB 1998) | 75 | 56.9 -24% | 55 -27% | 55 -27% | 57 -24% |
| Color Space (Percent of sRGB) | 100 | 86.5 -13% | 83 -17% | 84 -16% | 87 -13% |
| Total Average (Program / Settings) | -41% /
-8% | -47% /
-22% | -41% /
-9% | -43% /
-12% |
* ... smaller is better
Screen Flickering / PWM (Pulse-Width Modulation)
| Screen flickering / PWM not detected |  | ||
In comparison: 53 % of all tested devices do not use PWM to dim the display. If PWM was detected, an average of 17903 (minimum: 5 - maximum: 3846000) Hz was measured. | |||
Display Response Times
| ↔ Response Time Black to White | ||
|---|---|---|
| 7 ms ... rise ↗ and fall ↘ combined | ↗ 4 ms rise | 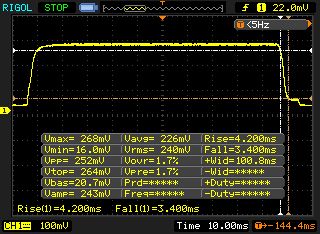 |
| ↘ 3 ms fall | ||
| The screen shows very fast response rates in our tests and should be very well suited for fast-paced gaming. In comparison, all tested devices range from 0.1 (minimum) to 240 (maximum) ms. » 16 % of all devices are better. This means that the measured response time is better than the average of all tested devices (21.5 ms). | ||
| ↔ Response Time 50% Grey to 80% Grey | ||
| 29 ms ... rise ↗ and fall ↘ combined | ↗ 13 ms rise | 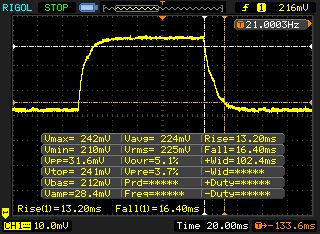 |
| ↘ 16 ms fall | ||
| The screen shows relatively slow response rates in our tests and may be too slow for gamers. In comparison, all tested devices range from 0.2 (minimum) to 636 (maximum) ms. » 33 % of all devices are better. This means that the measured response time is better than the average of all tested devices (33.7 ms). | ||

| Cinebench R15 | |
| CPU Single 64Bit | |
| MSI GT72VR 7RE-433 | |
| HP Omen 17-w110ng | |
| Gigabyte P57X v6 | |
| Asus GL702VM-GC102D | |
| MSI GT72VR 6RE-015US | |
| CPU Multi 64Bit | |
| MSI GT72VR 7RE-433 | |
| HP Omen 17-w110ng | |
| Asus GL702VM-GC102D | |
| MSI GT72VR 6RE-015US | |
| Gigabyte P57X v6 | |
| Cinebench R11.5 | |
| CPU Multi 64Bit | |
| MSI GT72VR 7RE-433 | |
| HP Omen 17-w110ng | |
| Asus GL702VM-GC102D | |
| Gigabyte P57X v6 | |
| MSI GT72VR 6RE-015US | |
| CPU Single 64Bit | |
| MSI GT72VR 7RE-433 | |
| HP Omen 17-w110ng | |
| MSI GT72VR 6RE-015US | |
| Gigabyte P57X v6 | |
| Asus GL702VM-GC102D | |
| Cinebench R10 | |
| Rendering Multiple CPUs 32Bit | |
| MSI GT72VR 7RE-433 | |
| HP Omen 17-w110ng | |
| Asus GL702VM-GC102D | |
| MSI GT72VR 6RE-015US | |
| Rendering Single 32Bit | |
| MSI GT72VR 7RE-433 | |
| HP Omen 17-w110ng | |
| Asus GL702VM-GC102D | |
| MSI GT72VR 6RE-015US | |
| Geekbench 3 | |
| 32 Bit Single-Core Score | |
| MSI GT72VR 7RE-433 | |
| Asus GL702VM-GC102D | |
| 32 Bit Multi-Core Score | |
| MSI GT72VR 7RE-433 | |
| Asus GL702VM-GC102D | |
| Geekbench 4.0 | |
| 64 Bit Single-Core Score | |
| MSI GT72VR 7RE-433 | |
| Asus GL702VM-GC102D | |
| 64 Bit Multi-Core Score | |
| MSI GT72VR 7RE-433 | |
| Asus GL702VM-GC102D | |
| JetStream 1.1 - Total Score | |
| HP Omen 17-w110ng | |
| MSI GT72VR 7RE-433 | |
| Gigabyte P57X v6 | |
| MSI GT72VR 6RE-015US | |
| Asus GL702VM-GC102D | |
| Octane V2 - Total Score | |
| MSI GT72VR 7RE-433 | |
| HP Omen 17-w110ng | |
| Asus GL702VM-GC102D | |
| MSI GT72VR 6RE-015US | |
| Mozilla Kraken 1.1 - Total | |
| Gigabyte P57X v6 | |
| Asus GL702VM-GC102D | |
| HP Omen 17-w110ng | |
| MSI GT72VR 7RE-433 | |
* ... smaller is better
| PCMark 7 Score | 6618 points | |
| PCMark 8 Home Score Accelerated v2 | 5009 points | |
| PCMark 8 Creative Score Accelerated v2 | 7765 points | |
| PCMark 8 Work Score Accelerated v2 | 5404 points | |
Help | ||
| PCMark 8 | |
| Home Score Accelerated v2 | |
| MSI GT72VR 7RE-433 | |
| HP Omen 17-w110ng | |
| Asus GL702VM-GC102D | |
| MSI GT72VR 6RE-015US | |
| Gigabyte P57X v6 | |
| Work Score Accelerated v2 | |
| MSI GT72VR 7RE-433 | |
| HP Omen 17-w110ng | |
| MSI GT72VR 6RE-015US | |
| Gigabyte P57X v6 | |
| Asus GL702VM-GC102D | |

| MSI GT72VR 7RE-433 Kingston RBU-SNS8152S3256GG5 | MSI GT72VR 6RE-015US SanDisk SD8SNAT256G1122 | Asus GL702VM-GC102D HGST Travelstar 7K1000 HTS721010A9E630 | HP Omen 17-w110ng Samsung PM951 NVMe MZVLV256 | Gigabyte P57X v6 Transcend MTS800 256GB M.2 (TS256GMTS800) | |
|---|---|---|---|---|---|
| CrystalDiskMark 3.0 | -18% | -87% | 37% | -14% | |
| Read Seq | 521 | 529 2% | 134.6 -74% | 1156 122% | 481.7 -8% |
| Write Seq | 311.8 | 338.5 9% | 130.6 -58% | 294.9 -5% | 315.4 1% |
| Read 512 | 403.1 | 288.9 -28% | 44.85 -89% | 616 53% | 303.1 -25% |
| Write 512 | 332.3 | 319.2 -4% | 63.3 -81% | 294.7 -11% | 314.4 -5% |
| Read 4k | 33.35 | 23.1 -31% | 0.602 -98% | 42.7 28% | 25.93 -22% |
| Write 4k | 111.1 | 99.4 -11% | 1.146 -99% | 153.3 38% | 84.6 -24% |
| Read 4k QD32 | 331.1 | 147.5 -55% | 1.106 -100% | 600 81% | 273.9 -17% |
| Write 4k QD32 | 318.3 | 236.9 -26% | 1.186 -100% | 295.3 -7% | 274.9 -14% |
| 3DMark 06 Standard Score | 30145 points | |
| 3DMark 11 Performance | 15575 points | |
| 3DMark Ice Storm Standard Score | 133525 points | |
| 3DMark Cloud Gate Standard Score | 26904 points | |
| 3DMark Fire Strike Score | 13685 points | |
| 3DMark Fire Strike Extreme Score | 7506 points | |
| 3DMark Time Spy Score | 5097 points | |
Help | ||
| 3DMark | |
| 1280x720 Cloud Gate Standard Graphics | |
| MSI GT72VR 7RE-433 | |
| MSI GT72VR 6RE-015US | |
| HP Omen 17-w110ng | |
| Gigabyte P57X v6 | |
| Asus GL702VM-GC102D | |
| 1920x1080 Fire Strike Graphics | |
| MSI GT72VR 7RE-433 | |
| MSI GT72VR 6RE-015US | |
| HP Omen 17-w110ng | |
| Asus GL702VM-GC102D | |
| 3DMark 11 - 1280x720 Performance GPU | |
| Gigabyte P57X v6 | |
| MSI GT72VR 7RE-433 | |
| HP Omen 17-w110ng | |
| Asus GL702VM-GC102D | |
| MSI GT72VR 6RE-015US | |
| low | med. | high | ultra | |
| Tomb Raider (2013) | 437.3 | 411.1 | 392.1 | 207.4 |
| BioShock Infinite (2013) | 219.2 | 188.7 | 182.5 | 133.2 |
| Battlefield 4 (2013) | 195.7 | 186.9 | 185.7 | 144.8 |
| Ashes of the Singularity (2016) | 60.2 | 59.1 | 55.3 | |
| Deus Ex Mankind Divided (2016) | 99.9 | 93.3 | 76.3 | 43.7 |
| Battlefield 1 (2016) | 147.3 | 129.5 | 114.7 | 106 |
| Civilization VI (2016) | 72 | 58.7 | 51.7 | 52.1 |
| Titanfall 2 (2016) | 144 | 144 | 130.6 | 121.5 |
| BioShock Infinite - 1920x1080 Ultra Preset, DX11 (DDOF) | |
| MSI GT72VR 7RE-433 | |
| MSI GT72VR 6RE-015US | |
| Gigabyte P57X v6 | |
| HP Omen 17-w110ng | |
| Asus GL702VM-GC102D | |
| Battlefield 4 - 1920x1080 Ultra Preset AA:4x MS | |
| MSI GT72VR 7RE-433 | |
| Asus GL702VM-GC102D | |
Noise Level
| Idle |
| 34 / 35 / 37 dB(A) |
| Load |
| 37 / 44 dB(A) |
 | ||
30 dB silent 40 dB(A) audible 50 dB(A) loud |
||
min: | ||
| MSI GT72VR 7RE-433 i7-7700HQ, GeForce GTX 1070 Mobile | MSI GT72VR 6RE-015US 6700HQ, GeForce GTX 1070 Mobile | Asus GL702VM-GC102D 6700HQ, GeForce GTX 1060 Mobile | HP Omen 17-w110ng 6700HQ, GeForce GTX 1070 Mobile | Gigabyte P57X v6 6700HQ, GeForce GTX 1070 Mobile | |
|---|---|---|---|---|---|
| Noise | 1% | 3% | -4% | -4% | |
| off / environment * | 31 | 28.9 7% | 30.5 2% | 30 3% | 29.7 4% |
| Idle Minimum * | 34 | 32.4 5% | 31.4 8% | 33 3% | 33.2 2% |
| Idle Average * | 35 | 32.4 7% | 31.4 10% | 34 3% | 33.2 5% |
| Idle Maximum * | 37 | 32.4 12% | 31.5 15% | 35 5% | 33.2 10% |
| Load Average * | 37 | 39.4 -6% | 40.9 -11% | 45 -22% | 47.5 -28% |
| Load Maximum * | 44 | 52 -18% | 46.2 -5% | 52 -18% | 52.5 -19% |
* ... smaller is better
(±) The maximum temperature on the upper side is 41.5 °C / 107 F, compared to the average of 40.4 °C / 105 F, ranging from 21.2 to 68.8 °C for the class Gaming.
(-) The bottom heats up to a maximum of 50.6 °C / 123 F, compared to the average of 43.2 °C / 110 F
(+) In idle usage, the average temperature for the upper side is 24.3 °C / 76 F, compared to the device average of 33.8 °C / 93 F.
(+) The palmrests and touchpad are cooler than skin temperature with a maximum of 27 °C / 80.6 F and are therefore cool to the touch.
(±) The average temperature of the palmrest area of similar devices was 28.9 °C / 84 F (+1.9 °C / 3.4 F).
| MSI GT72VR 7RE-433 i7-7700HQ, GeForce GTX 1070 Mobile | MSI GT72VR 6RE-015US 6700HQ, GeForce GTX 1070 Mobile | Asus GL702VM-GC102D 6700HQ, GeForce GTX 1060 Mobile | HP Omen 17-w110ng 6700HQ, GeForce GTX 1070 Mobile | Gigabyte P57X v6 6700HQ, GeForce GTX 1070 Mobile | |
|---|---|---|---|---|---|
| Heat | -8% | -18% | -10% | -30% | |
| Maximum Upper Side * | 41.5 | 40.6 2% | 53.1 -28% | 45 -8% | 59 -42% |
| Maximum Bottom * | 50.6 | 59.4 -17% | 44.9 11% | 54.3 -7% | 66 -30% |
| Idle Upper Side * | 26.4 | 28.2 -7% | 32.9 -25% | 29.6 -12% | 33.2 -26% |
| Idle Bottom * | 25.4 | 27.8 -9% | 33.4 -31% | 28.6 -13% | 30.6 -20% |
* ... smaller is better
MSI GT72VR 7RE-433 audio analysis
(+) | speakers can play relatively loud (87 dB)
Bass 100 - 315 Hz
(±) | reduced bass - on average 5.4% lower than median
(±) | linearity of bass is average (11.3% delta to prev. frequency)
Mids 400 - 2000 Hz
(±) | higher mids - on average 5% higher than median
(+) | mids are linear (4.1% delta to prev. frequency)
Highs 2 - 16 kHz
(+) | balanced highs - only 4.7% away from median
(+) | highs are linear (5.7% delta to prev. frequency)
Overall 100 - 16.000 Hz
(+) | overall sound is linear (11.7% difference to median)
Compared to same class
» 10% of all tested devices in this class were better, 3% similar, 87% worse
» The best had a delta of 6%, average was 18%, worst was 132%
Compared to all devices tested
» 6% of all tested devices were better, 2% similar, 92% worse
» The best had a delta of 4%, average was 25%, worst was 134%
Asus G752VS-XB78K audio analysis
(±) | speaker loudness is average but good (76 dB)
Bass 100 - 315 Hz
(±) | reduced bass - on average 9.6% lower than median
(±) | linearity of bass is average (10.7% delta to prev. frequency)
Mids 400 - 2000 Hz
(+) | balanced mids - only 4.7% away from median
(±) | linearity of mids is average (10.3% delta to prev. frequency)
Highs 2 - 16 kHz
(±) | reduced highs - on average 8.3% lower than median
(±) | linearity of highs is average (9.7% delta to prev. frequency)
Overall 100 - 16.000 Hz
(±) | linearity of overall sound is average (22.4% difference to median)
Compared to same class
» 77% of all tested devices in this class were better, 6% similar, 16% worse
» The best had a delta of 6%, average was 18%, worst was 132%
Compared to all devices tested
» 60% of all tested devices were better, 6% similar, 33% worse
» The best had a delta of 4%, average was 25%, worst was 134%
| Off / Standby | |
| Idle | |
| Load |
|
| MSI GT72VR 7RE-433 i7-7700HQ, GeForce GTX 1070 Mobile | MSI GT72VR 6RE-015US 6700HQ, GeForce GTX 1070 Mobile | Asus GL702VM-GC102D 6700HQ, GeForce GTX 1060 Mobile | HP Omen 17-w110ng 6700HQ, GeForce GTX 1070 Mobile | Gigabyte P57X v6 6700HQ, GeForce GTX 1070 Mobile | |
|---|---|---|---|---|---|
| Power Consumption | -20% | 19% | 0% | -16% | |
| Idle Minimum * | 20 | 22.3 -12% | 15.6 22% | 19 5% | 18.4 8% |
| Idle Average * | 27 | 27.3 -1% | 20.2 25% | 25 7% | 22.8 16% |
| Idle Maximum * | 31 | 30 3% | 21.4 31% | 31 -0% | 24 23% |
| Load Average * | 86 | 152.2 -77% | 90 -5% | 90 -5% | 175.5 -104% |
| Load Maximum * | 184 | 204.2 -11% | 147 20% | 193 -5% | 229.5 -25% |
* ... smaller is better
| MSI GT72VR 7RE-433 i7-7700HQ, GeForce GTX 1070 Mobile, 83 Wh | MSI GT72VR 6RE-015US 6700HQ, GeForce GTX 1070 Mobile, 83 Wh | Asus GL702VM-GC102D 6700HQ, GeForce GTX 1060 Mobile, 76 Wh | HP Omen 17-w110ng 6700HQ, GeForce GTX 1070 Mobile, 95 Wh | Gigabyte P57X v6 6700HQ, GeForce GTX 1070 Mobile, 75.81 Wh | |
|---|---|---|---|---|---|
| Battery Runtime | -2% | 8% | 18% | 11% | |
| Reader / Idle | 316 | 322 2% | 353 12% | 432 37% | 418 32% |
| H.264 | 228 | 262 15% | 233 2% | ||
| WiFi v1.3 | 230 | 224 -3% | 250 9% | 247 7% | 201 -13% |
| Load | 91 | 86 -5% | 87 -4% | 115 26% | 103 13% |
Pros
Cons
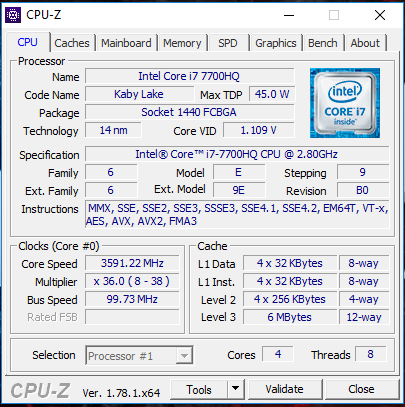
GT72VR 7RE的强大硬件可以在全高清分辨率下最高设置流畅运行所有最新游戏。英伟达的G-Sync技术可以帮助120赫兹屏幕提供顺畅的视频输出。最新的Kaby Lake架构酷睿 i7-7700HQ四核处理器给我们带来了不错的印象。它在基准测试中比前代型号(酷睿 i7-6700HQ)稍快,但领先的优势并不大。
微星GT72VR Dominator Pro是一台成功的游戏设备。
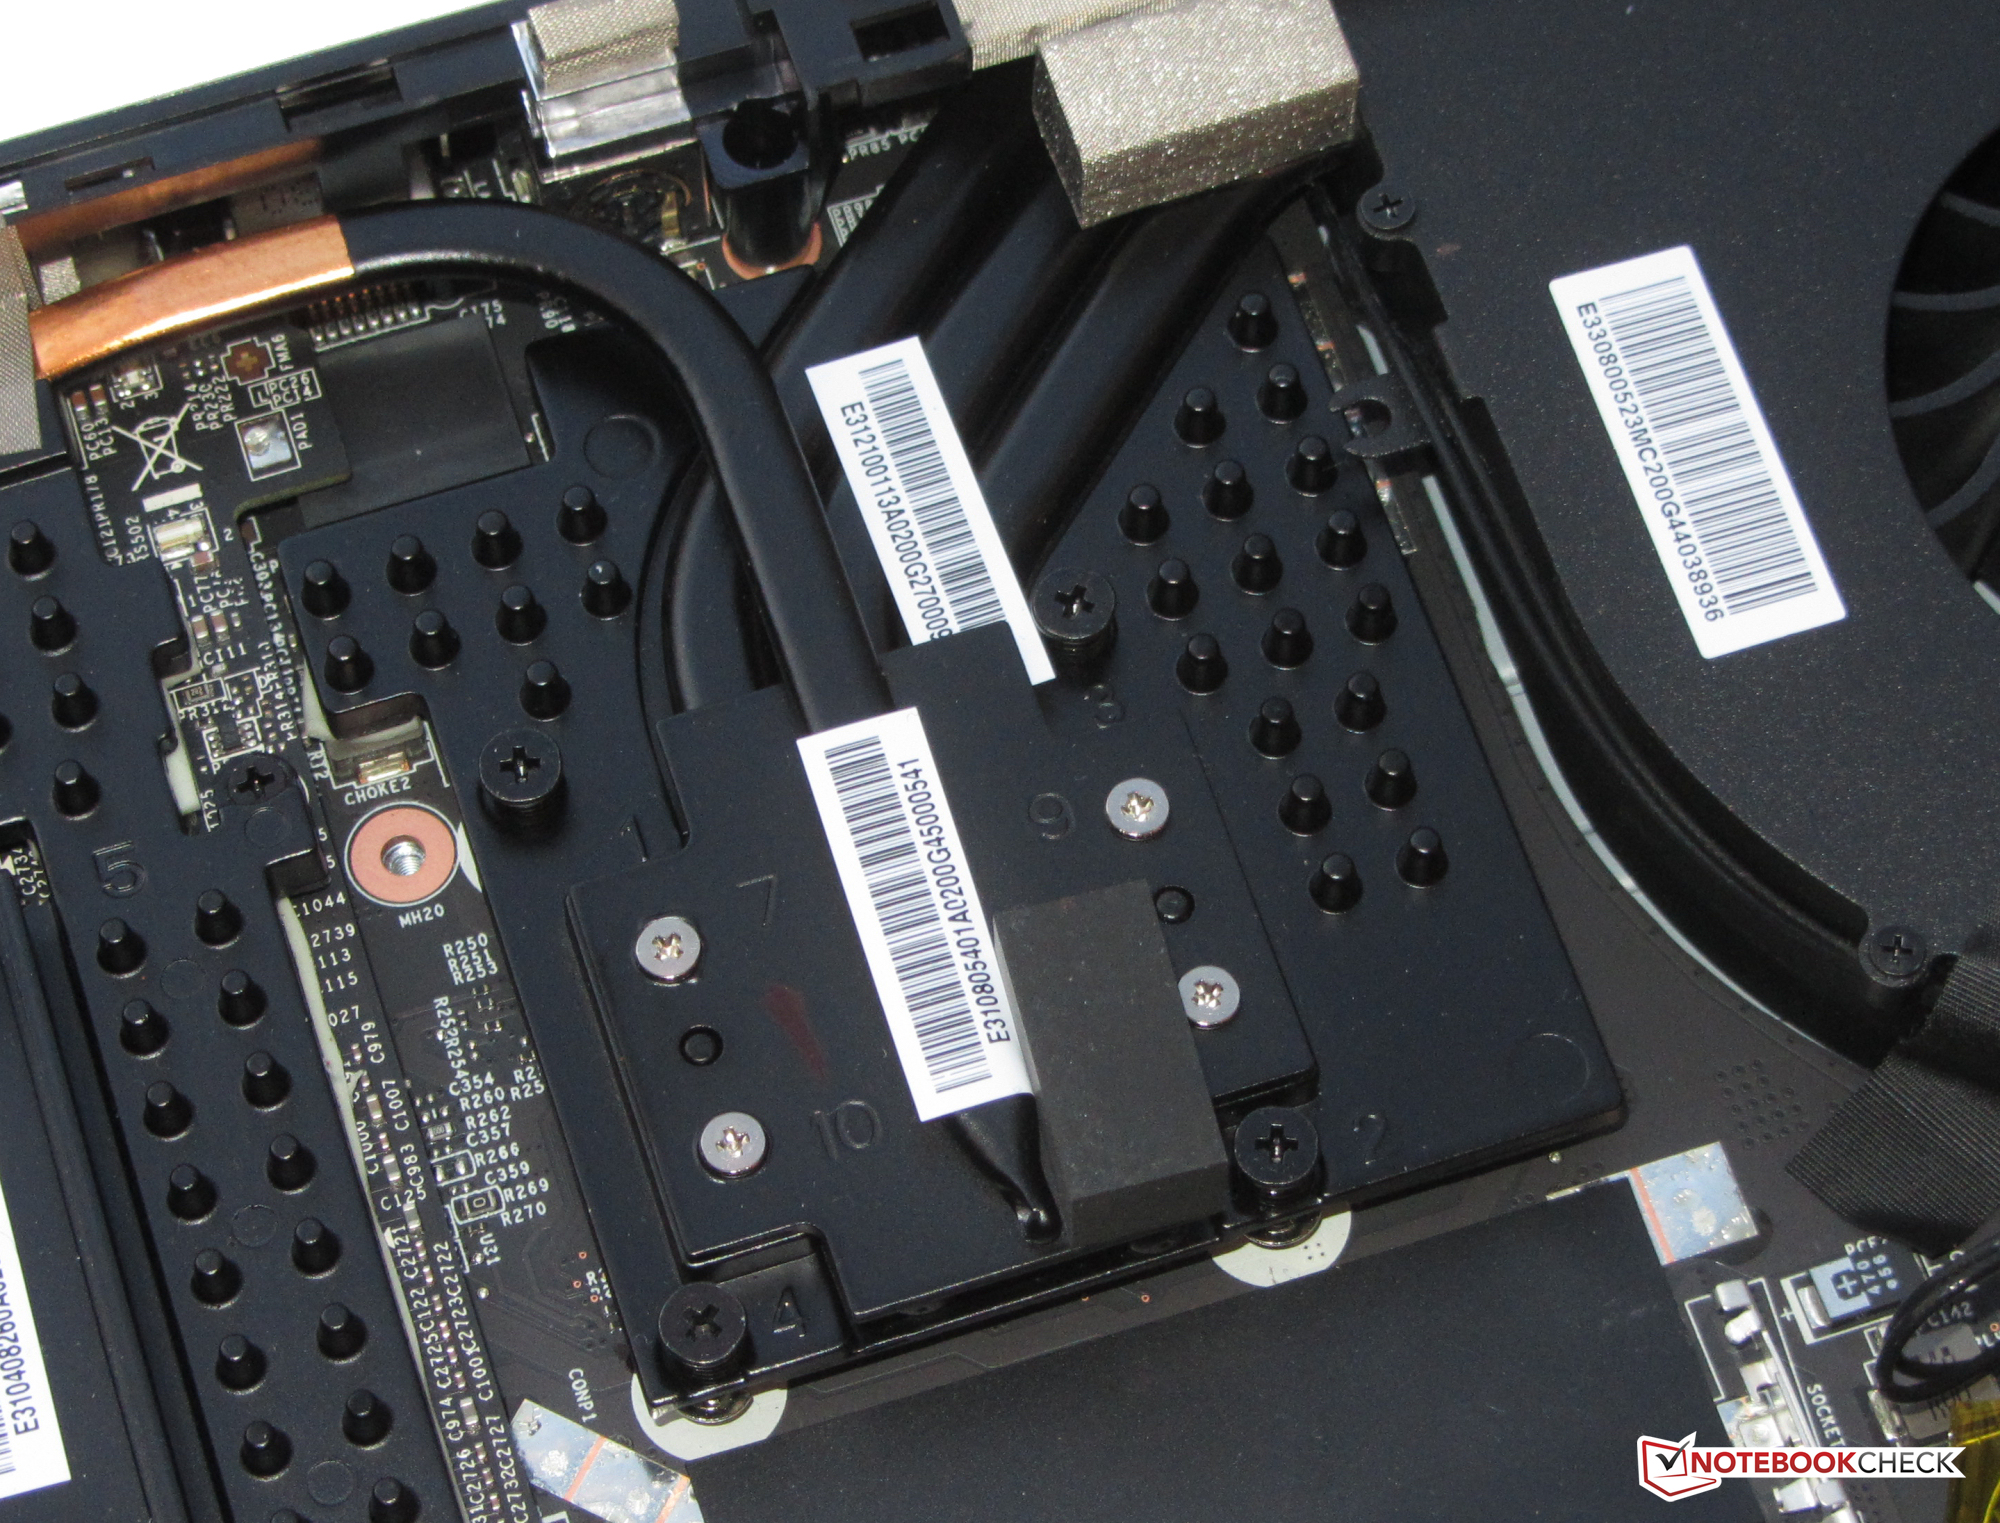
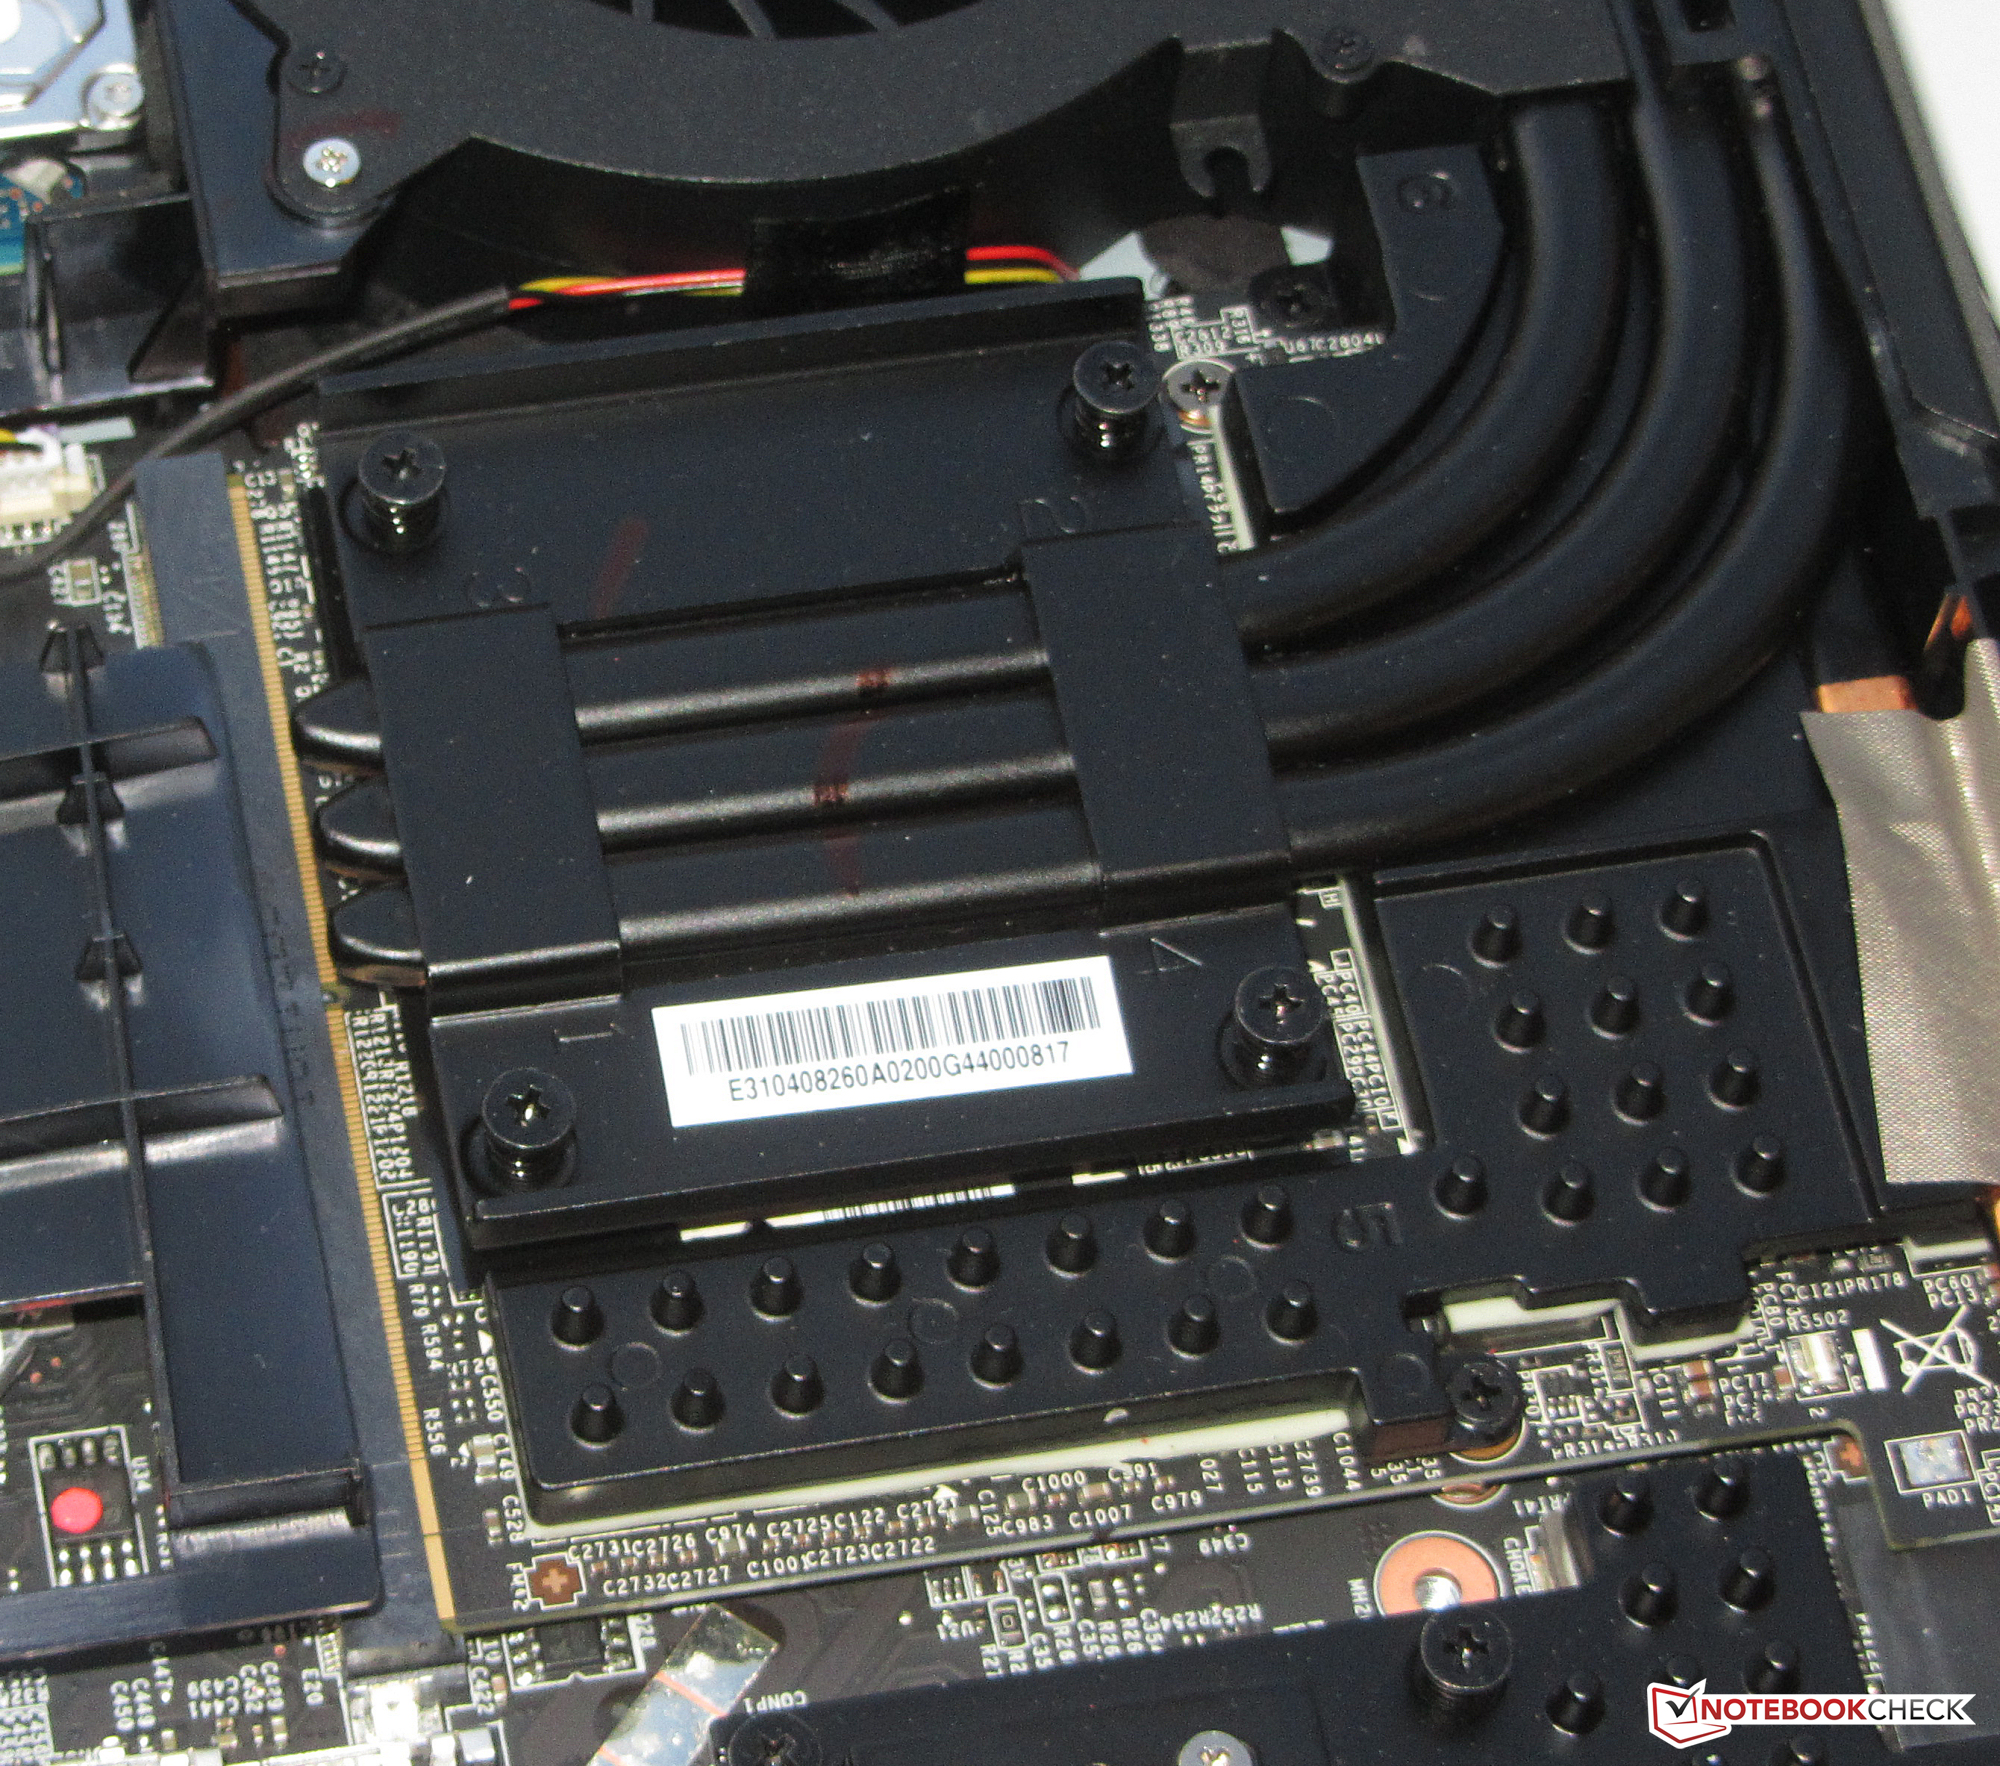
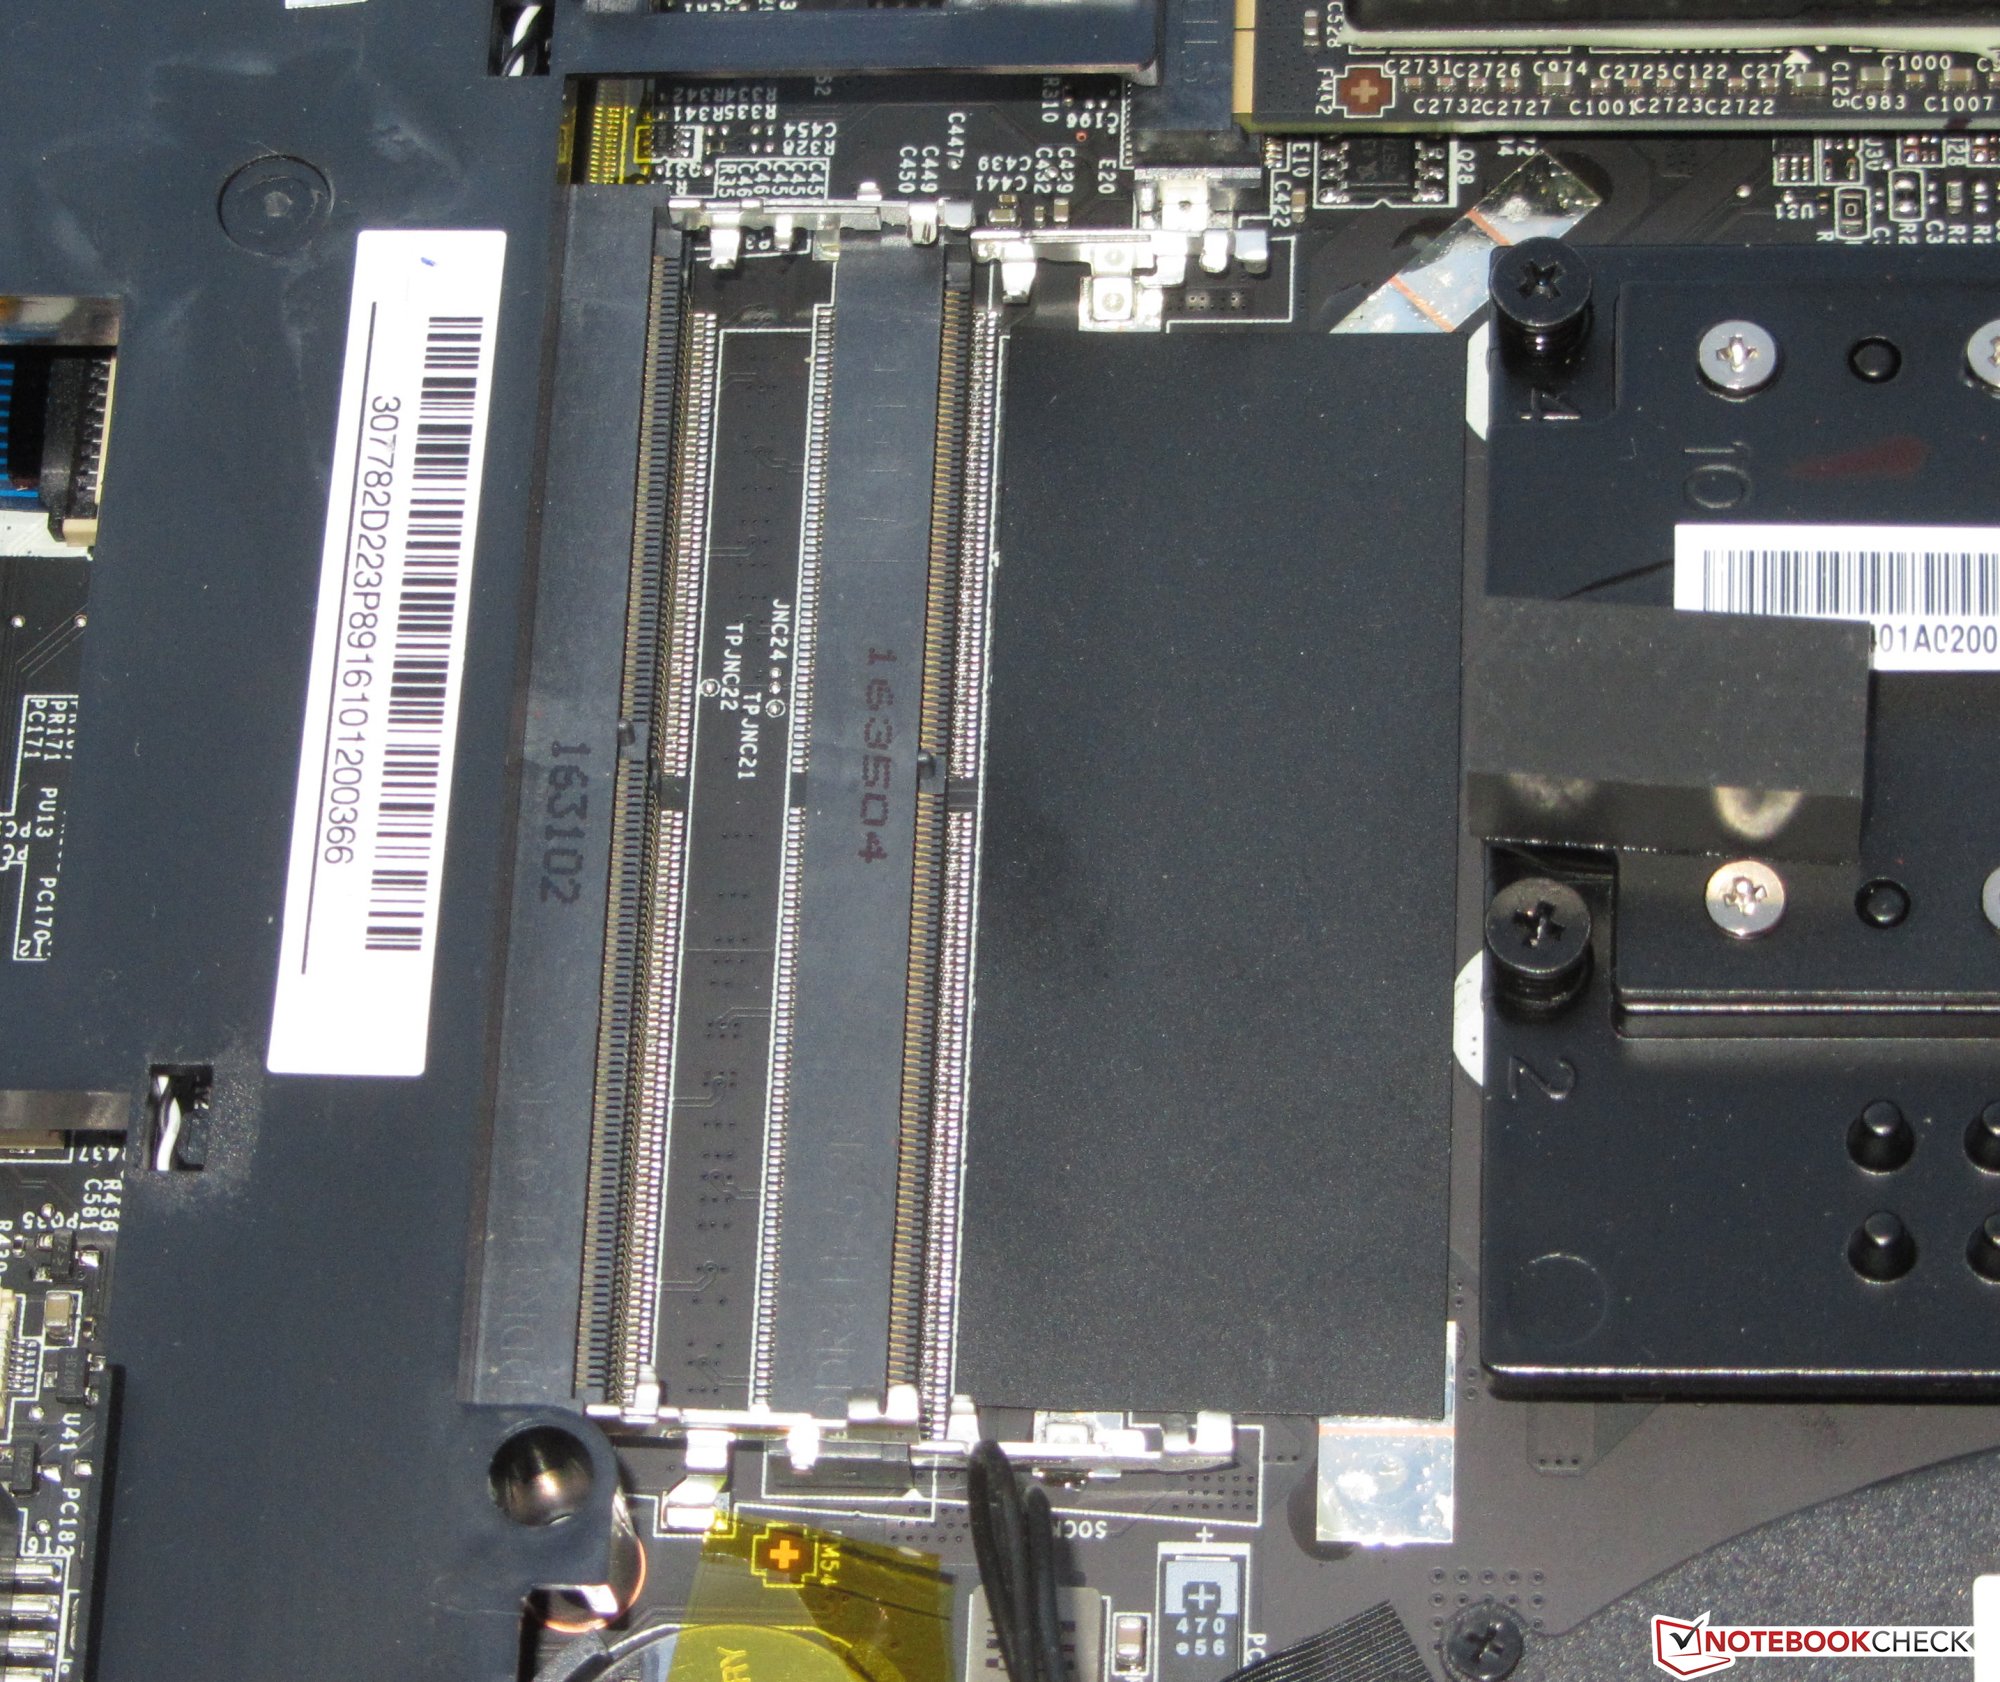
一块高速SATA-III固态硬盘保证了系统迅捷的响应,同时如果需要的话用户也可以自行升级速度更高的PCIe/NVMe硬盘。游戏文件所需的硬盘空间由另一块2.5寸机械硬盘提供。用户可以从1TB升级到更大的容量。这些升级只需打开底盖就可以实现,操作并不困难。
它的磨砂全高清屏幕刷新率为120赫兹。它亮度不错,对比度也十分优秀。不过由于没有并非IPS面板,它的可视角度略窄,但仍然优于常见的TN面板。
注:本文是基于完整评测的缩减版本,阅读完整的英文评测,请点击这里。
MSI GT72VR 7RE-433
-
01/05/2017 v6(old)
Sascha Mölck
Pricecompare
