 Deutsch
 English
 Español
 Français
 Italiano
 Nederlands
 Polski
 Português
 Русский
 Türkçe
 Svenska
 Chinese
 Magyar
雷蛇 Blade Stealth (i7-7500U) 笔记本电脑简短评测
| Networking | |
| iperf Server (receive) TCP 1 m | |
| Dell XPS 13 2016 9350 (FHD, i7-6560U) | |
| Apple MacBook 12 (Early 2016) 1.1 GHz | |
| Razer Blade Stealth QHD i7-7500U (sim) | |
| Medion Akoya S3409-MD60234 (jseb) | |
| Acer Aspire S 13 S5-371-71QZ | |
| iperf Client (transmit) TCP 1 m | |
| Dell XPS 13 2016 9350 (FHD, i7-6560U) | |
| Medion Akoya S3409-MD60234 (jseb) | |
| Razer Blade Stealth QHD i7-7500U (sim) | |
| Apple MacBook 12 (Early 2016) 1.1 GHz | |
| Acer Aspire S 13 S5-371-71QZ | |
| |||||||||||||||||||||||||
Brightness Distribution: 88 %
Contrast: 893:1 (Black: 0.45 cd/m²)
ΔE Color 3.6 | 0.5-29.43 Ø5
ΔE Greyscale 4.3 | 0.57-98 Ø5.3
95.7% sRGB (Argyll 1.6.3 3D)
62.3% AdobeRGB 1998 (Argyll 1.6.3 3D)
69.9% AdobeRGB 1998 (Argyll 2.2.0 3D)
95.8% sRGB (Argyll 2.2.0 3D)
68.7% Display P3 (Argyll 2.2.0 3D)
Gamma: 2.1
| Razer Blade Stealth QHD i7-7500U 2560x1440, 12.50 | Razer Blade Stealth UHD i7-6500U 3840x2160, 12.50 | Dell XPS 13 9360 QHD+ i5 3200x1800, 13.30 | Lenovo IdeaPad 710S-13ISK 1920x1080, 13.30 | Asus Zenbook UX305UA-FC040T 1920x1080, 13.30 | Acer Aspire S 13 S5-371-71QZ 1920x1080, 13.30 | |
|---|---|---|---|---|---|---|
| Display | 22% | -5% | -1% | -4% | ||
| Display P3 Coverage | 68.7 | 83.7 22% | 64.6 -6% | 66.4 -3% | 65.1 -5% | |
| sRGB Coverage | 95.8 | 99.2 4% | 91.6 -4% | 97.5 2% | 92.8 -3% | |
| AdobeRGB 1998 Coverage | 69.9 | 97.2 39% | 66.5 -5% | 68.4 -2% | 66.3 -5% | |
| Response Times | -43% | 12% | -1% | -9% | -12% | |
| Response Time Grey 50% / Grey 80% * | 37 ? | 63.2 ? -71% | 31 ? 16% | 52.4 ? -42% | 25 ? 32% | 50 ? -35% |
| Response Time Black / White * | 33.4 ? | 38 ? -14% | 31.2 ? 7% | 23.6 ? 29% | 28 ? 16% | 29.6 ? 11% |
| PWM Frequency | 200 ? | 220 ? 10% | 50 ? -75% | |||
| Screen | 16% | 10% | -13% | -24% | -5% | |
| Brightness middle | 402 | 415 3% | 444 10% | 344 -14% | 358 -11% | 375 -7% |
| Brightness | 382 | 399 4% | 393 3% | 326 -15% | 351 -8% | 358 -6% |
| Brightness Distribution | 88 | 93 6% | 82 -7% | 87 -1% | 86 -2% | 87 -1% |
| Black Level * | 0.45 | 0.309 31% | 0.33 27% | 0.36 20% | 0.4 11% | 0.39 13% |
| Contrast | 893 | 1343 50% | 1345 51% | 956 7% | 895 0% | 962 8% |
| Colorchecker dE 2000 * | 3.6 | 3.78 -5% | 4 -11% | 6.09 -69% | 5.96 -66% | 4.6 -28% |
| Colorchecker dE 2000 max. * | 7.5 | 7.2 4% | 7.7 -3% | 10 -33% | 10.99 -47% | 8.8 -17% |
| Greyscale dE 2000 * | 4.3 | 3.38 21% | 2.83 34% | 5.36 -25% | 8.93 -108% | 4 7% |
| Gamma | 2.1 105% | 2.23 99% | 2.05 107% | 2.01 109% | 2.28 96% | 2.34 94% |
| CCT | 6572 99% | 7329 89% | 6963 93% | 7230 90% | 6548 99% | 7304 89% |
| Color Space (Percent of AdobeRGB 1998) | 62.3 | 85.1 37% | 59.3 -5% | 62.25 0% | 60 -4% | 57.9 -7% |
| Color Space (Percent of sRGB) | 95.7 | 99.3 4% | 91.4 -4% | 97.54 2% | 93 -3% | 88.7 -7% |
| Total Average (Program / Settings) | -2% /
9% | 6% /
7% | -5% /
-8% | -12% /
-17% | -9% /
-6% |
* ... smaller is better
Display Response Times
| ↔ Response Time Black to White | ||
|---|---|---|
| 33.4 ms ... rise ↗ and fall ↘ combined | ↗ 13.2 ms rise | 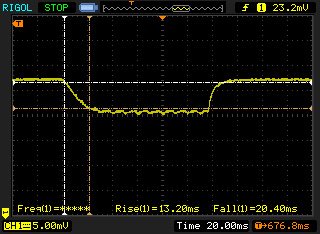 |
| ↘ 20.2 ms fall | ||
| The screen shows slow response rates in our tests and will be unsatisfactory for gamers. In comparison, all tested devices range from 0.1 (minimum) to 240 (maximum) ms. » 89 % of all devices are better. This means that the measured response time is worse than the average of all tested devices (21.5 ms). | ||
| ↔ Response Time 50% Grey to 80% Grey | ||
| 37 ms ... rise ↗ and fall ↘ combined | ↗ 19 ms rise | 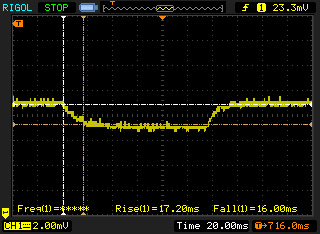 |
| ↘ 18 ms fall | ||
| The screen shows slow response rates in our tests and will be unsatisfactory for gamers. In comparison, all tested devices range from 0.2 (minimum) to 636 (maximum) ms. » 47 % of all devices are better. This means that the measured response time is similar to the average of all tested devices (33.7 ms). | ||
Screen Flickering / PWM (Pulse-Width Modulation)
| Screen flickering / PWM detected | 200 Hz | ≤ 30 % brightness setting | 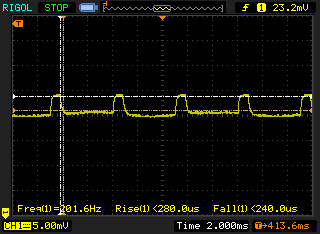 |
The display backlight flickers at 200 Hz (worst case, e.g., utilizing PWM) Flickering detected at a brightness setting of 30 % and below. There should be no flickering or PWM above this brightness setting. The frequency of 200 Hz is relatively low, so sensitive users will likely notice flickering and experience eyestrain at the stated brightness setting and below. In comparison: 53 % of all tested devices do not use PWM to dim the display. If PWM was detected, an average of 17903 (minimum: 5 - maximum: 3846000) Hz was measured. | |||
| PCMark 8 - Home Score Accelerated v2 | |
| Lenovo IdeaPad 710S-13ISK | |
| Dell XPS 13 2016 9350 (FHD, i7-6560U) | |
| Acer Aspire S 13 S5-371-71QZ | |
| Razer Blade Stealth QHD i7-7500U | |
| Asus Zenbook UX305UA-FC040T | |
| Medion Akoya S3409-MD60234 | |
| Razer Blade Stealth UHD i7-6500U | |
| Dell XPS 13 9360 QHD+ i5 | |
| Apple MacBook 12 (Early 2016) 1.1 GHz | |
| PCMark 8 Home Score Accelerated v2 | 3362 points | |
Help | ||
| Razer Blade Stealth QHD i7-7500U Samsung PM951 NVMe MZVLV256 | Dell XPS 13 2016 9350 (FHD, i7-6560U) Samsung PM951 NVMe MZ-VLV256D | Asus Zenbook UX305UA-FC040T SK Hynix Canvas SC300 512GB M.2 (HFS512G39MND) | Acer Aspire S 13 S5-371-71QZ LiteOn CV1-8B512 | Lenovo IdeaPad 710S-13ISK Samsung PM951 NVMe MZVLV256 | Dell XPS 13 2016 9350 (FHD, i7-6560U) Samsung SSD SM951 512 GB MZHPV512HDGL | |
|---|---|---|---|---|---|---|
| CrystalDiskMark 3.0 | -9% | -27% | -23% | -1% | 115% | |
| Read Seq | 1178 | 1131 -4% | 469.1 -60% | 502 -57% | 1193 1% | 1502 28% |
| Write Seq | 305.4 | 311.4 2% | 412.1 35% | 418.9 37% | 309.6 1% | 1547 407% |
| Read 512 | 638 | 685 7% | 301.6 -53% | 341.3 -47% | 613 -4% | 1020 60% |
| Write 512 | 305.7 | 276.3 -10% | 327.1 7% | 389.7 27% | 311 2% | 1480 384% |
| Read 4k | 38.54 | 39.63 3% | 28.08 -27% | 29.69 -23% | 42.43 10% | 52 35% |
| Write 4k | 153.4 | 133.9 -13% | 71.9 -53% | 86.8 -43% | 144.9 -6% | 139.5 -9% |
| Read 4k QD32 | 614 | 399.7 -35% | 262 -57% | 301.3 -51% | 549 -11% | 467.1 -24% |
| Write 4k QD32 | 302.7 | 245.6 -19% | 274.7 -9% | 211.2 -30% | 311.3 3% | 409.5 35% |

| 3DMark 11 Performance | 1801 points | |
| 3DMark Cloud Gate Standard Score | 6538 points | |
| 3DMark Fire Strike Score | 918 points | |
Help | ||
| low | med. | high | ultra | |
| Sims 4 (2014) | 182 | 56.4 | 27.6 | 18.3 |
| The Witcher 3 (2015) | 13.92 | |||
| World of Warships (2015) | 72.9 | 47.78 | 23.63 | |
| Rise of the Tomb Raider (2016) | 20.2 | 12.7 |
Noise Level
| Idle |
| 31 / 31 / 31 dB(A) |
| Load |
| 35 / 40.5 dB(A) |
 | ||
30 dB silent 40 dB(A) audible 50 dB(A) loud |
||
min: | ||
Razer Blade Stealth QHD i7-7500U audio analysis
(-) | not very loud speakers (40.5 dB)
Analysis not possible as maximum curve is missing or too high
(-) The maximum temperature on the upper side is 46.7 °C / 116 F, compared to the average of 34.2 °C / 94 F, ranging from 21.2 to 62.5 °C for the class Office.
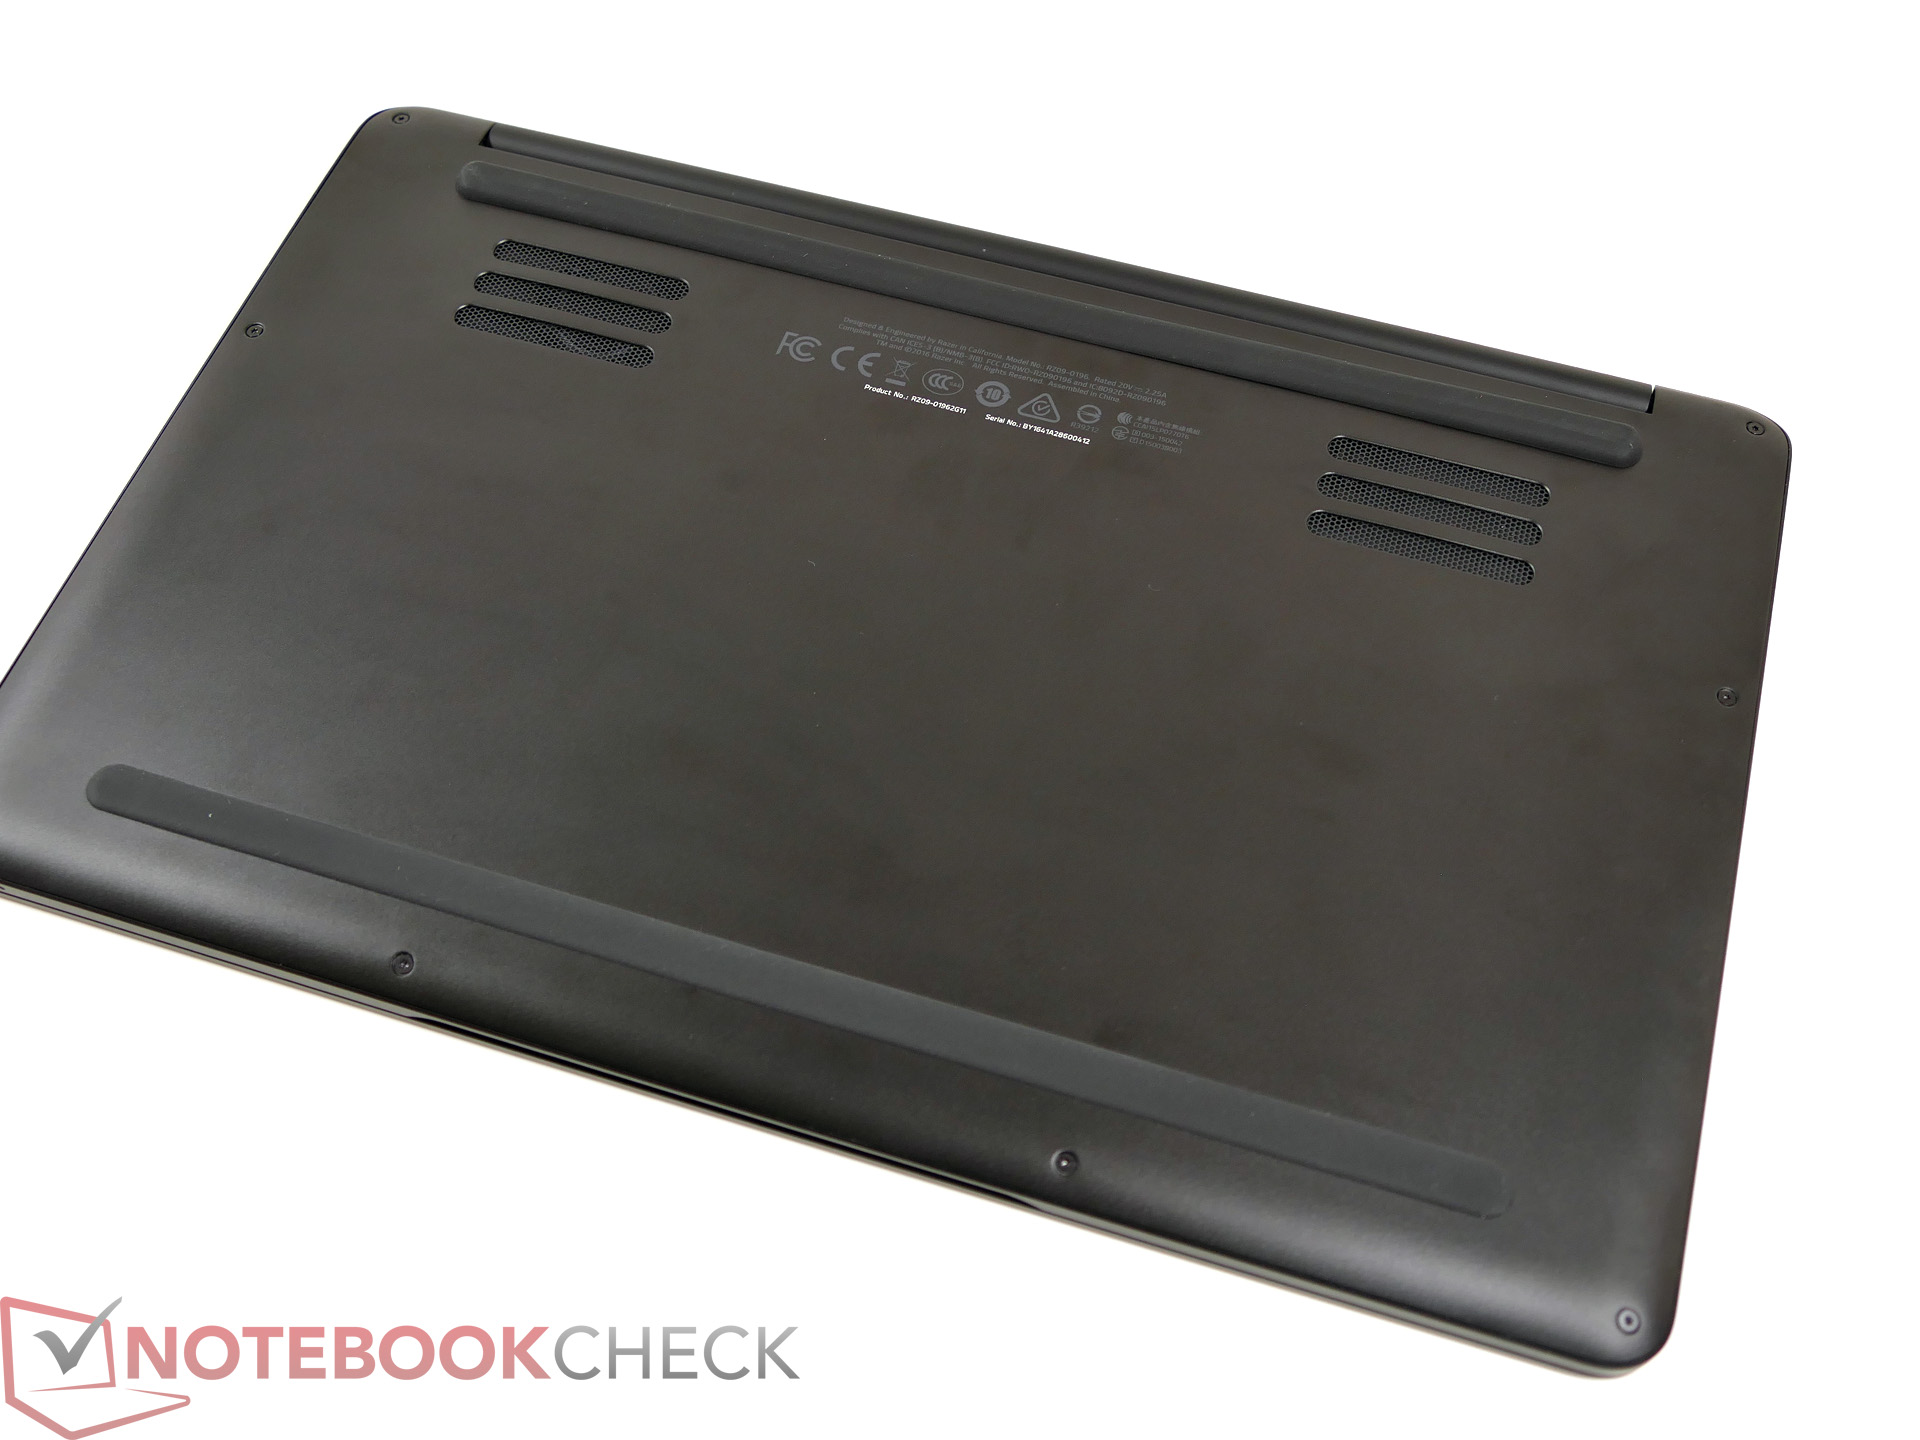
(-) The bottom heats up to a maximum of 51.3 °C / 124 F, compared to the average of 36.7 °C / 98 F
(+) In idle usage, the average temperature for the upper side is 29.5 °C / 85 F, compared to the device average of 29.5 °C / 85 F.
(+) The palmrests and touchpad are reaching skin temperature as a maximum (33.4 °C / 92.1 F) and are therefore not hot.
(-) The average temperature of the palmrest area of similar devices was 27.7 °C / 81.9 F (-5.7 °C / -10.2 F).
Razer Blade Stealth QHD i7-7500U audio analysis
(±) | speaker loudness is average but good (80.6 dB)
Bass 100 - 315 Hz
(±) | reduced bass - on average 8% lower than median
(±) | linearity of bass is average (13.9% delta to prev. frequency)
Mids 400 - 2000 Hz
(±) | higher mids - on average 5.4% higher than median
(±) | linearity of mids is average (7.5% delta to prev. frequency)
Highs 2 - 16 kHz
(+) | balanced highs - only 3.6% away from median
(+) | highs are linear (5.7% delta to prev. frequency)
Overall 100 - 16.000 Hz
(+) | overall sound is linear (14% difference to median)
Compared to same class
» 6% of all tested devices in this class were better, 4% similar, 91% worse
» The best had a delta of 7%, average was 22%, worst was 53%
Compared to all devices tested
» 13% of all tested devices were better, 3% similar, 84% worse
» The best had a delta of 4%, average was 25%, worst was 134%
Apple MacBook 12 (Early 2016) 1.1 GHz audio analysis
(+) | speakers can play relatively loud (83.6 dB)
Bass 100 - 315 Hz
(±) | reduced bass - on average 11.3% lower than median
(±) | linearity of bass is average (14.2% delta to prev. frequency)
Mids 400 - 2000 Hz
(+) | balanced mids - only 2.4% away from median
(+) | mids are linear (5.5% delta to prev. frequency)
Highs 2 - 16 kHz
(+) | balanced highs - only 2% away from median
(+) | highs are linear (4.5% delta to prev. frequency)
Overall 100 - 16.000 Hz
(+) | overall sound is linear (10.2% difference to median)
Compared to same class
» 5% of all tested devices in this class were better, 2% similar, 93% worse
» The best had a delta of 5%, average was 19%, worst was 53%
Compared to all devices tested
» 3% of all tested devices were better, 1% similar, 96% worse
» The best had a delta of 4%, average was 25%, worst was 134%
| Off / Standby | |
| Idle | |
| Load |
|
| Razer Blade Stealth QHD i7-7500U i7-7500U, HD Graphics 620, Samsung PM951 NVMe MZVLV256, , 2560x1440, 12.50 | Razer Blade Stealth UHD i7-6500U 6500U, HD Graphics 520, Samsung PM951 NVMe MZ-VLV256D, IPS IGZO, 3840x2160, 12.50 | Dell XPS 13 9360 QHD+ i5 i5-7200U, HD Graphics 620, Toshiba NVMe THNSN5256GPUK, , 3200x1800, 13.30 | Lenovo IdeaPad 710S-13ISK 6560U, Iris Graphics 540, Samsung PM951 NVMe MZVLV256, IPS, 1920x1080, 13.30 | Asus Zenbook UX305UA-FC040T 6500U, HD Graphics 520, SK Hynix Canvas SC300 512GB M.2 (HFS512G39MND), IPS, 1920x1080, 13.30 | Acer Aspire S 13 S5-371-71QZ 6500U, HD Graphics 520, LiteOn CV1-8B512, IPS, 1920x1080, 13.30 | |
|---|---|---|---|---|---|---|
| Power Consumption | -60% | 18% | 3% | 18% | 10% | |
| Idle Minimum * | 4.4 | 9 -105% | 3.7 16% | 3.3 25% | 3.2 27% | 4.1 7% |
| Idle Average * | 5.8 | 12.8 -121% | 6.1 -5% | 7.4 -28% | 6.5 -12% | 6.7 -16% |
| Idle Maximum * | 8.6 | 16.8 -95% | 6.5 24% | 8.2 5% | 6.7 22% | 7.4 14% |
| Load Average * | 35.2 | 35.7 -1% | 29.5 16% | 36.5 -4% | 30.6 13% | 32.4 8% |
| Load Maximum * | 52 | 39.3 24% | 33 37% | 43.7 16% | 31 40% | 32.4 38% |
* ... smaller is better
| Razer Blade Stealth QHD i7-7500U i7-7500U, HD Graphics 620, 53.6 Wh | Razer Blade Stealth UHD i7-6500U 6500U, HD Graphics 520, 45 Wh | Dell XPS 13 9360 QHD+ i5 i5-7200U, HD Graphics 620, 60 Wh | Lenovo IdeaPad 710S-13ISK 6560U, Iris Graphics 540, 46 Wh | Asus Zenbook UX305UA-FC040T 6500U, HD Graphics 520, 56 Wh | Acer Aspire S 13 S5-371-71QZ 6500U, HD Graphics 520, 45 Wh | Medion Akoya S3409-MD60234 i7-7500U, HD Graphics 620, 45 Wh | Dell XPS 13 2016 9350 (FHD, i7-6560U) 6560U, Iris Graphics 540, 56 Wh | |
|---|---|---|---|---|---|---|---|---|
| Battery Runtime | -43% | 18% | -11% | 33% | 5% | -22% | 13% | |
| Reader / Idle | 817 | 437 -47% | 810 -1% | 1427 75% | 1028 26% | 722 -12% | 944 16% | |
| WiFi v1.3 | 498 | 228 -54% | 526 6% | 418 -16% | 561 13% | 472 -5% | 278 -44% | 436 -12% |
| Load | 105 | 76 -28% | 137 30% | 89 -15% | 118 12% | 99 -6% | 96 -9% | 141 34% |
| H.264 | 547 | 486 | 545 | 243 |
Pros
Cons

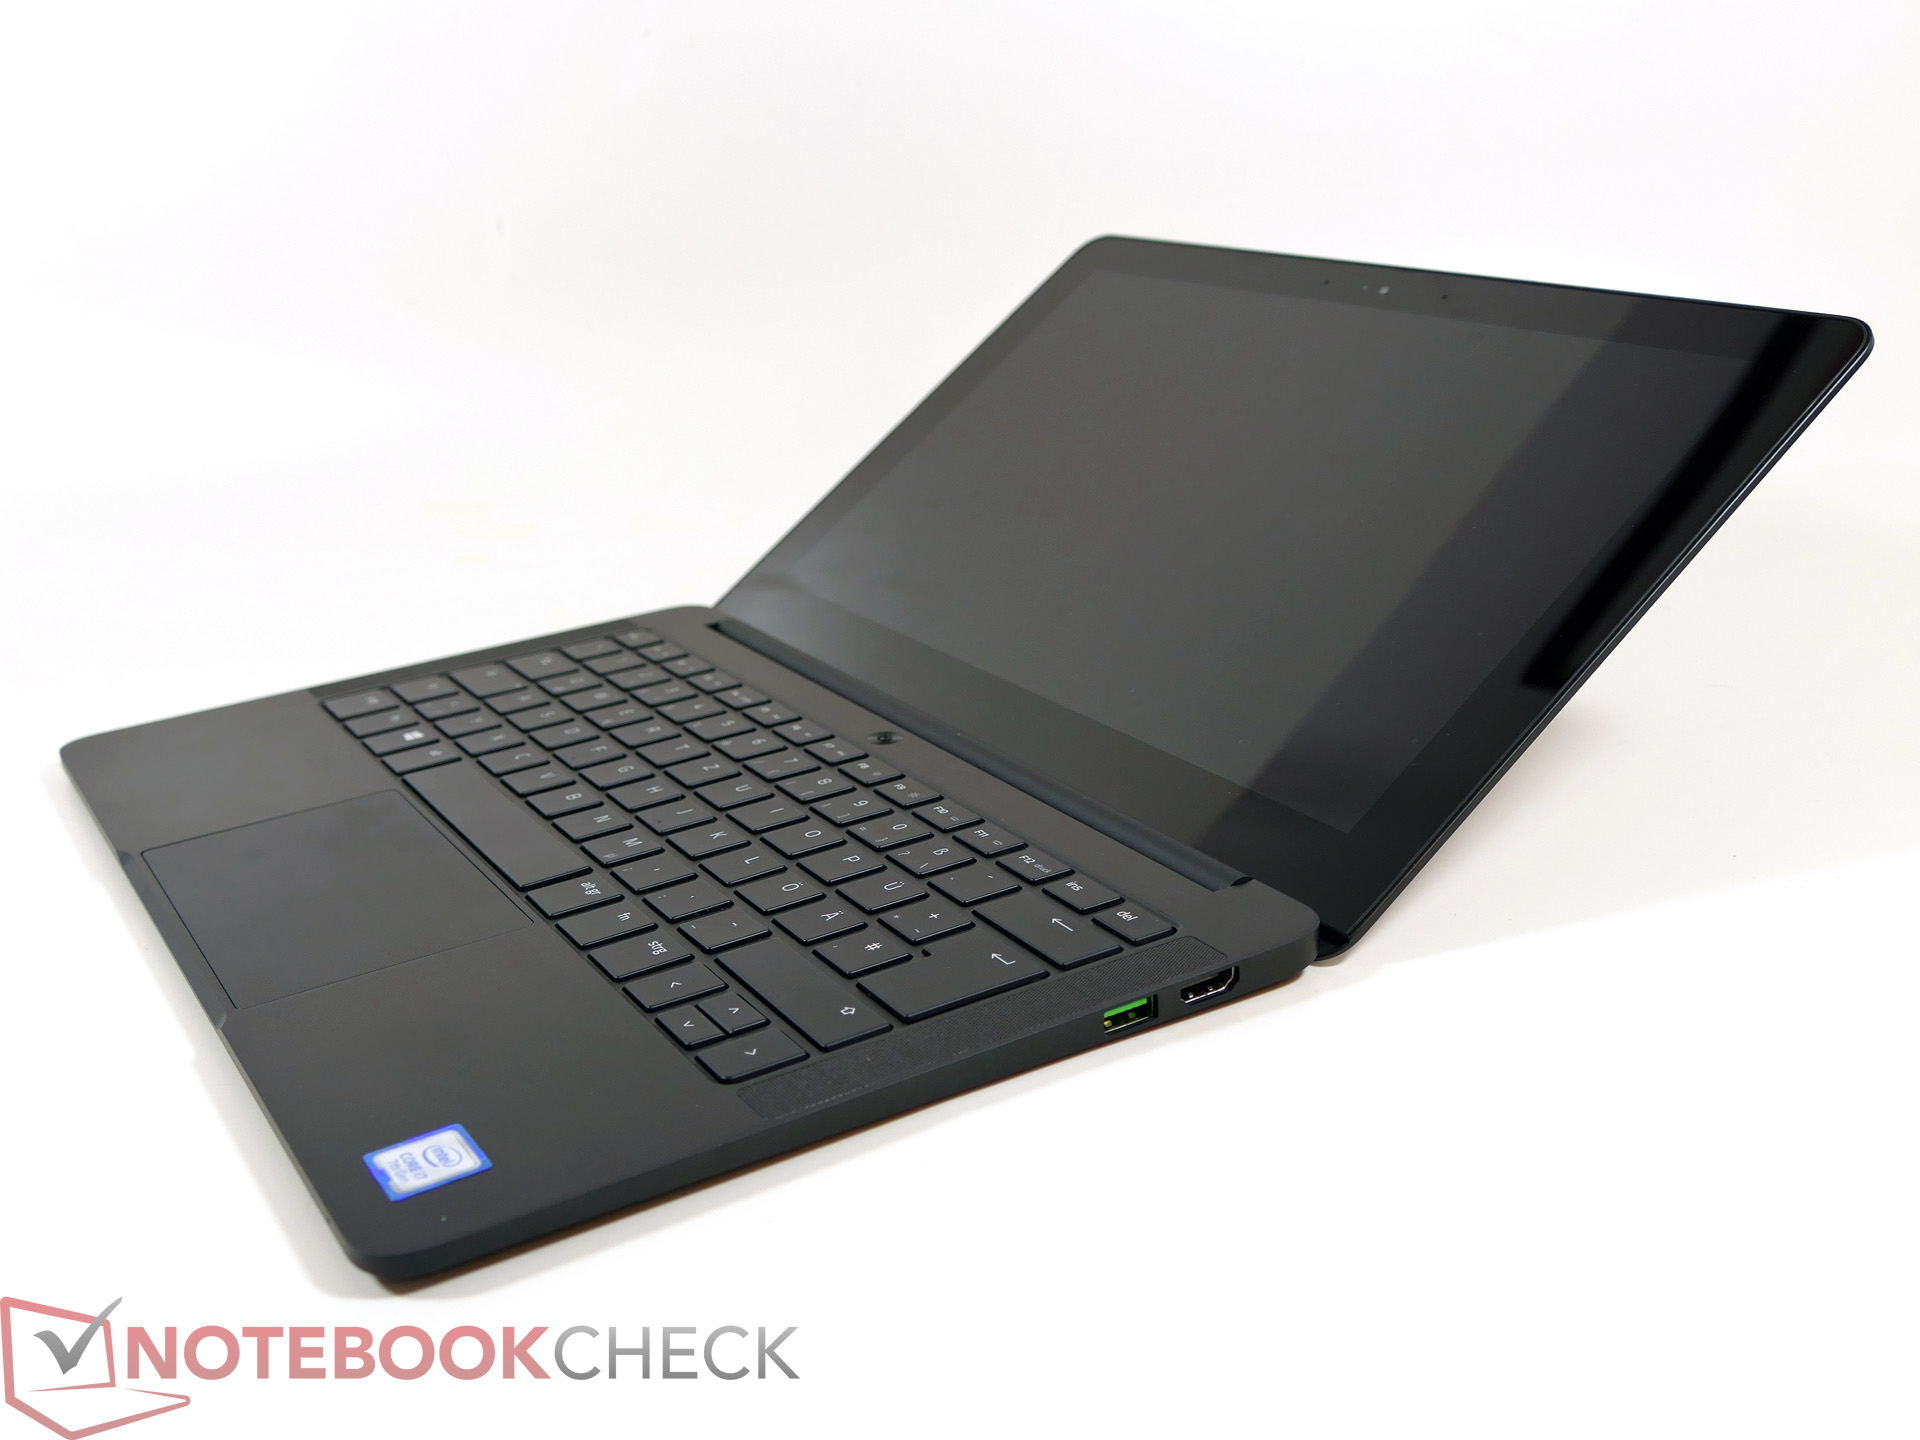
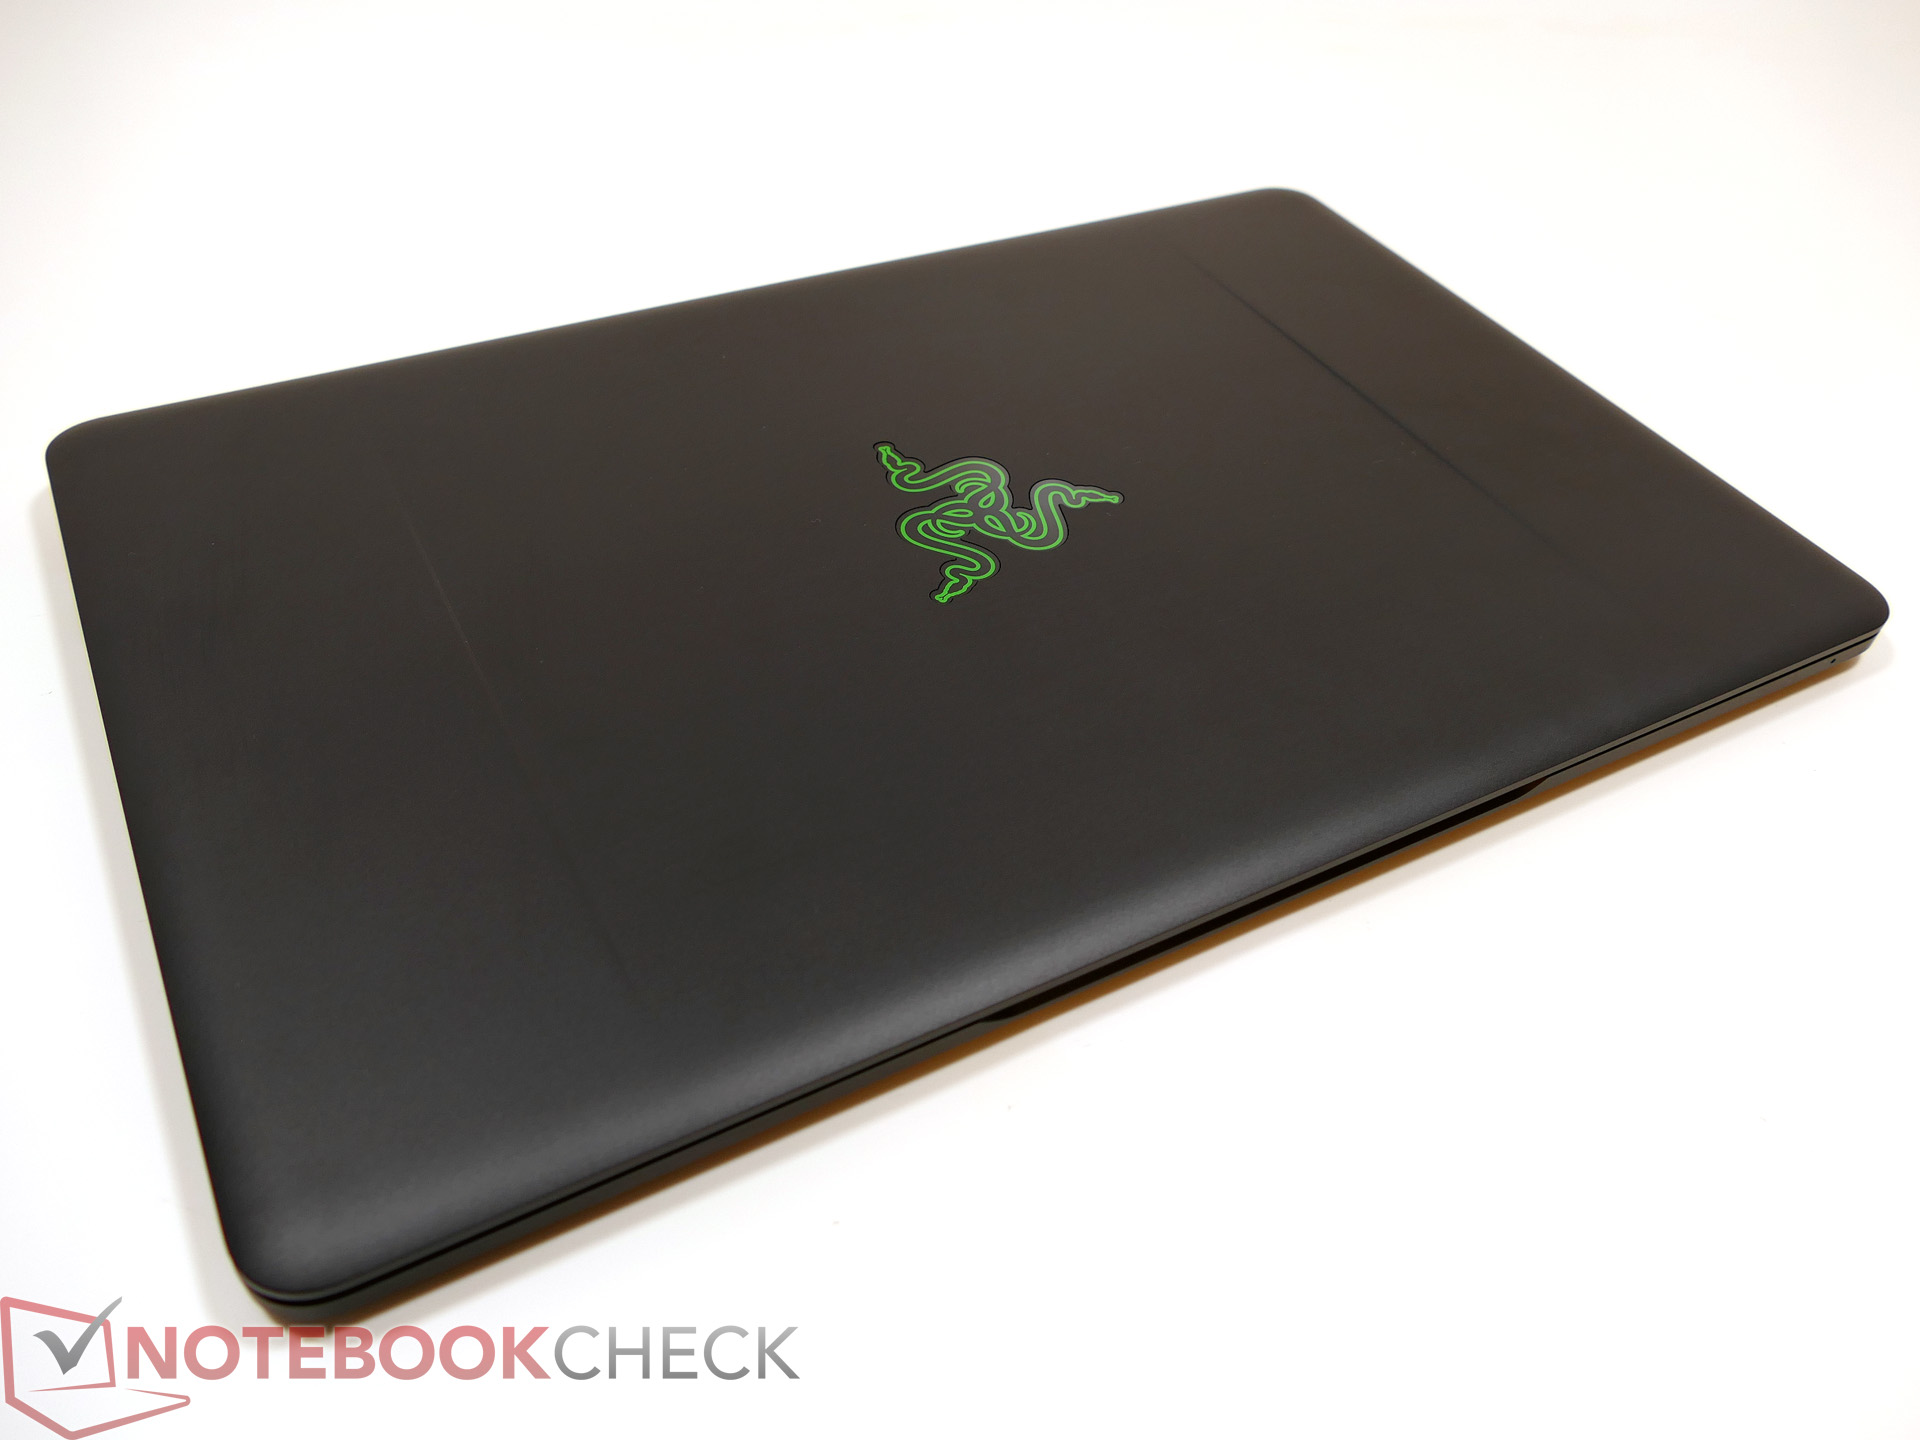
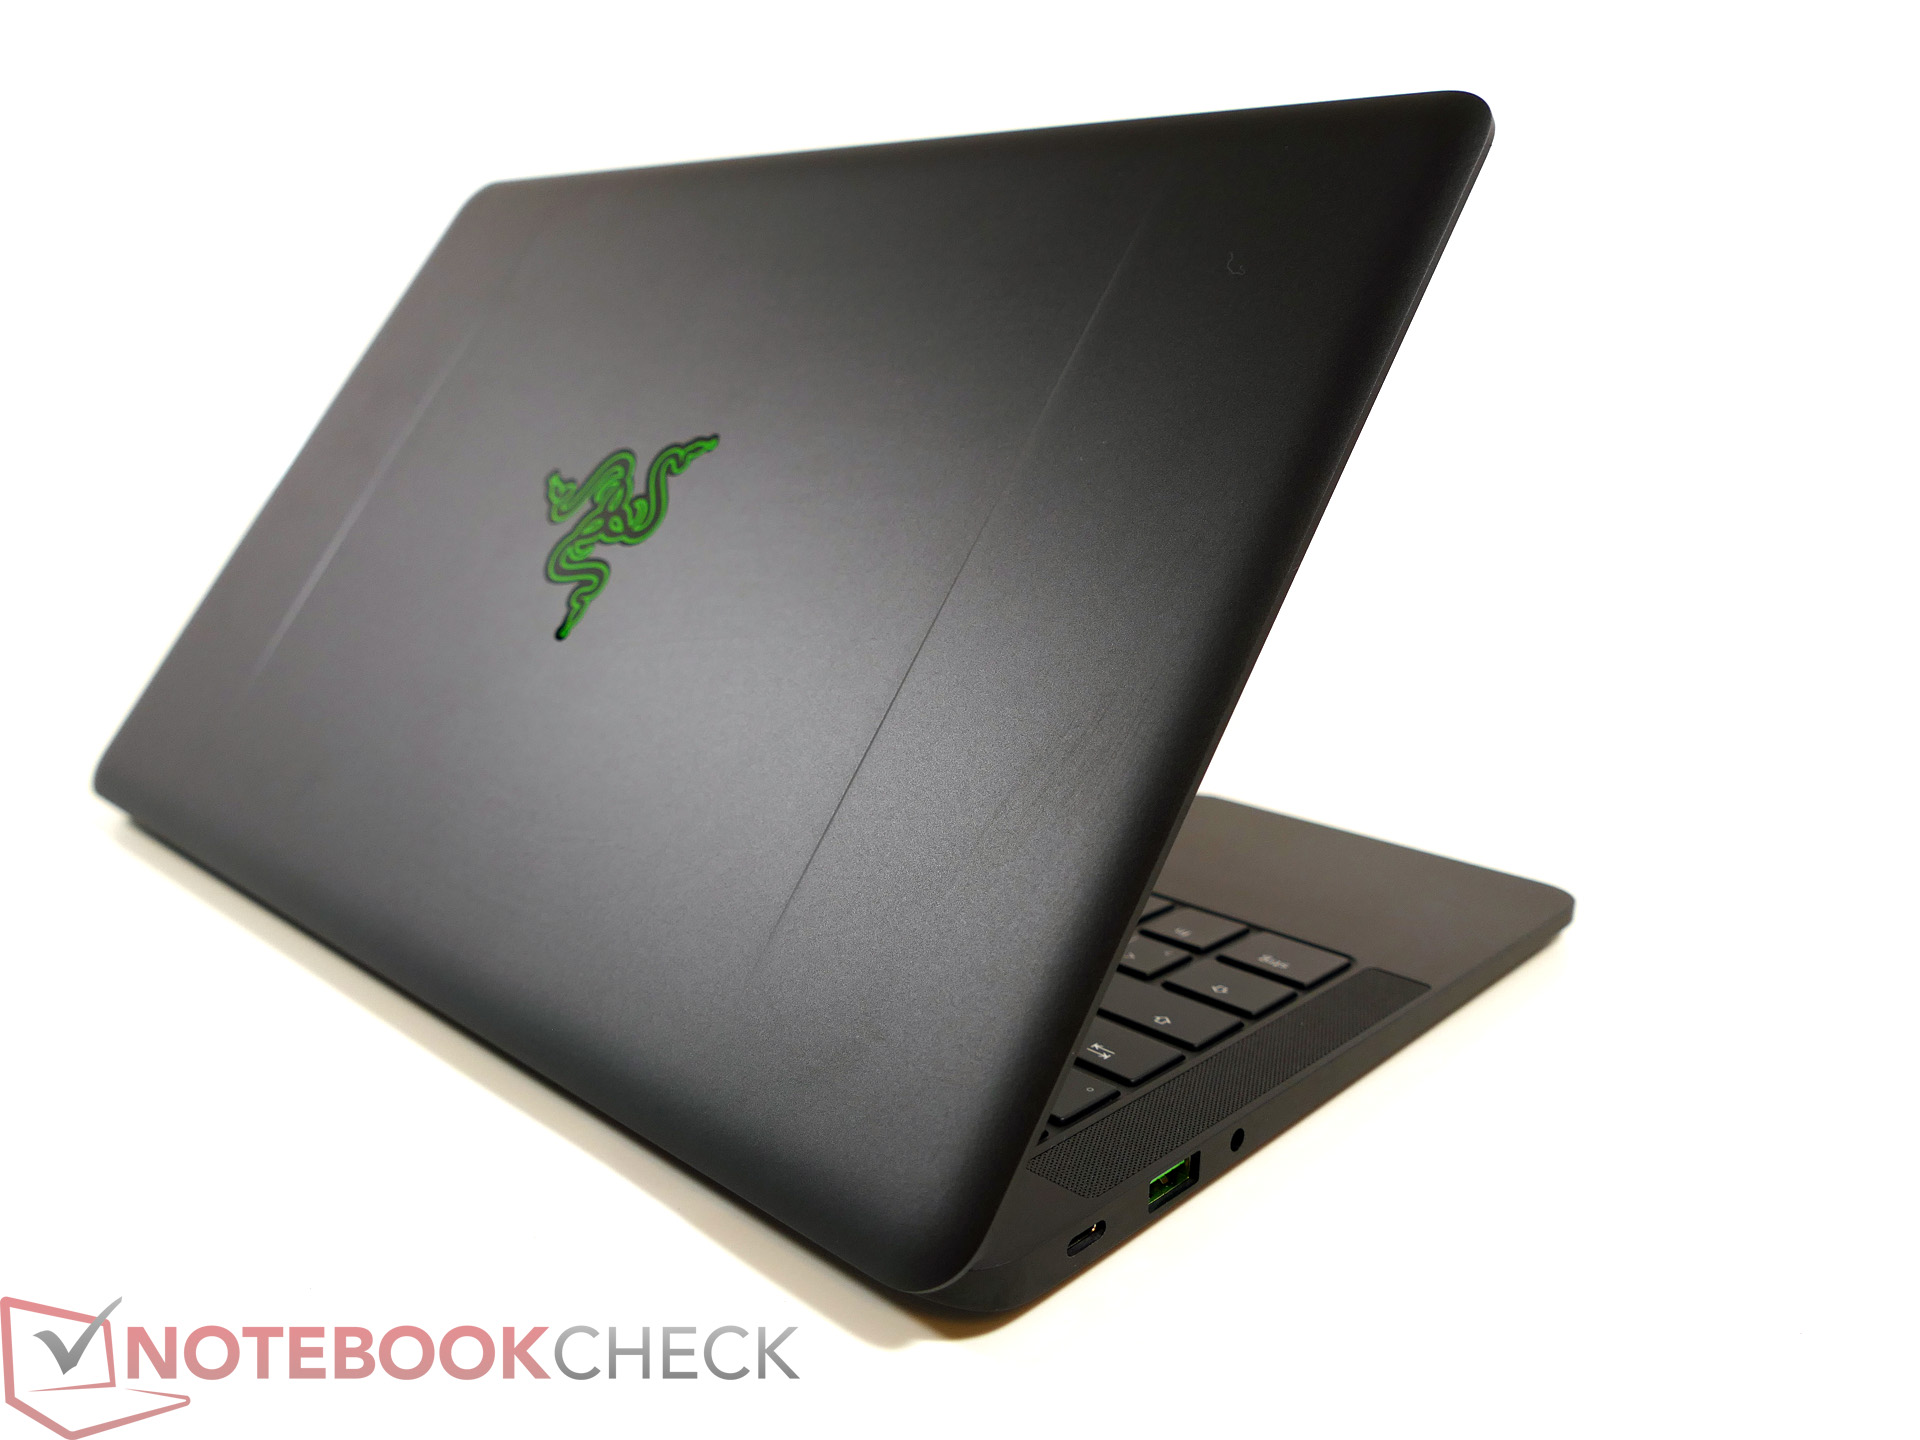
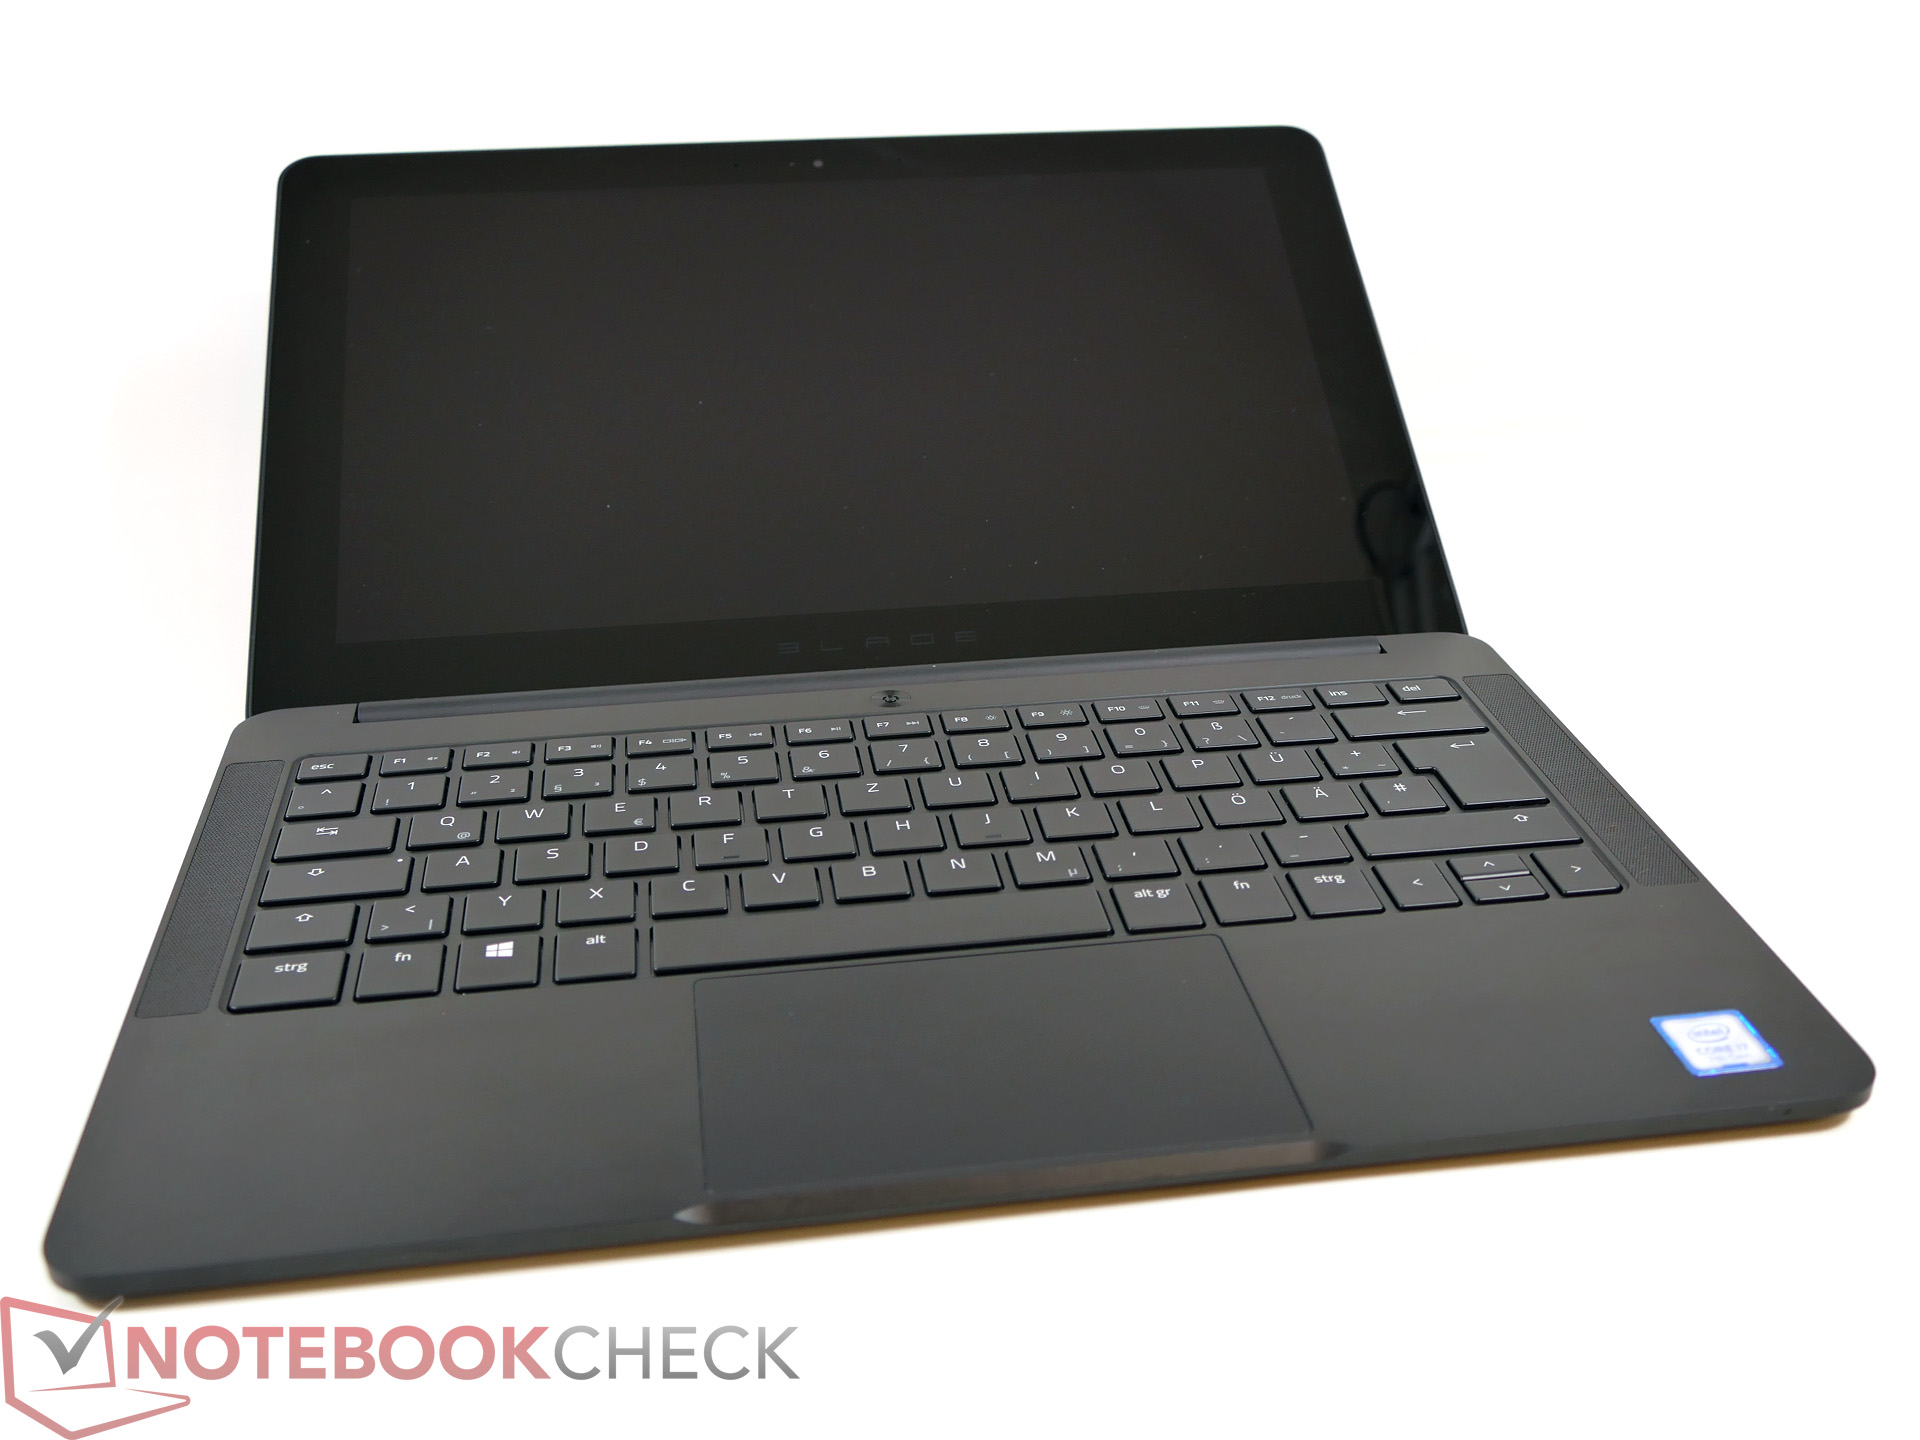
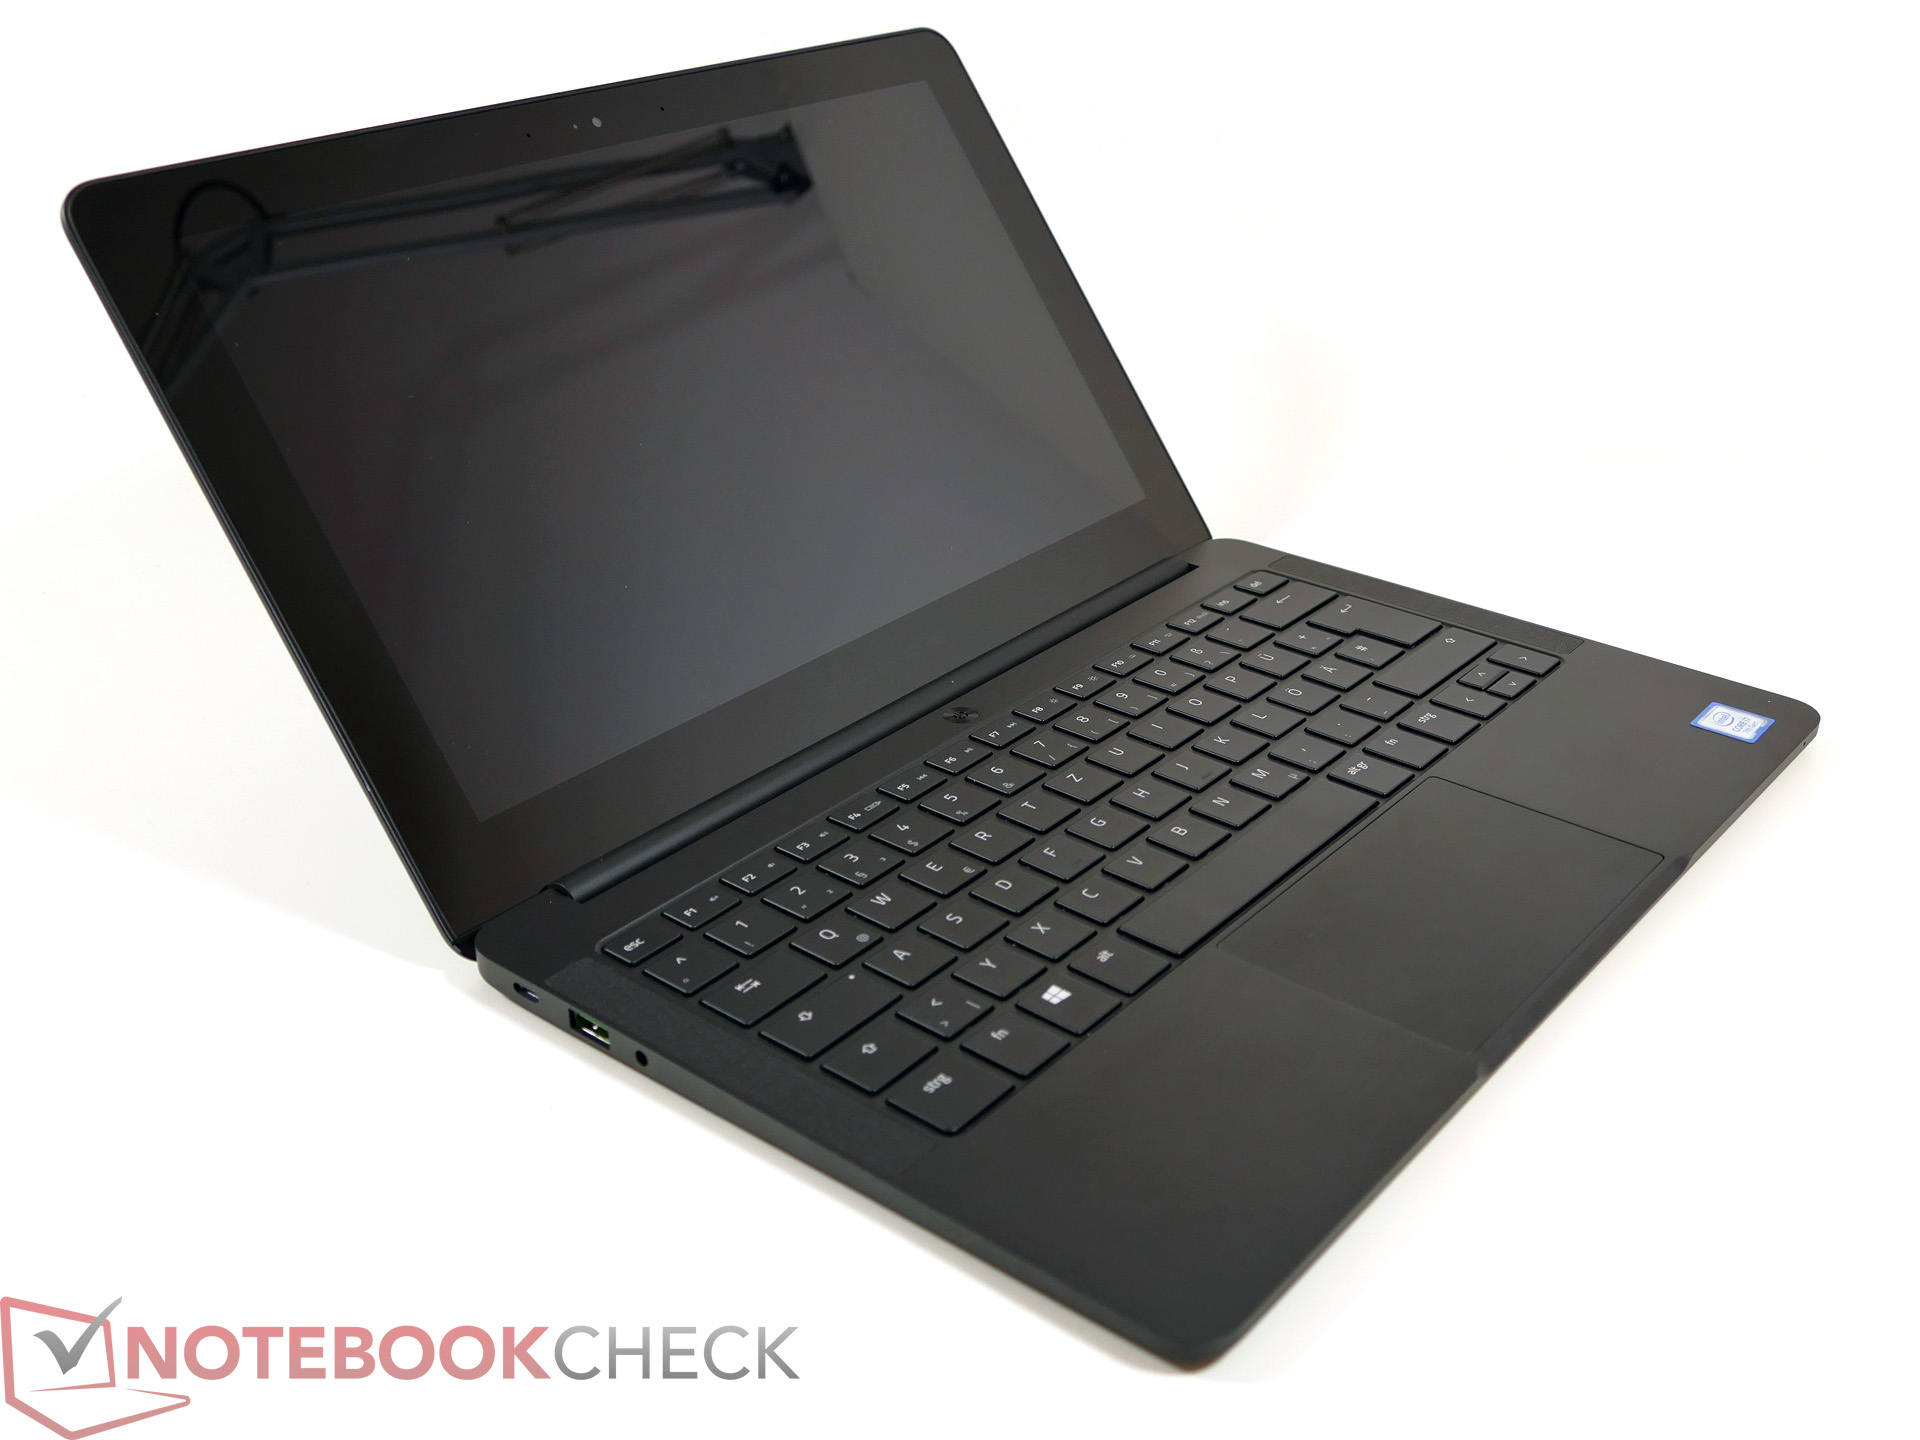
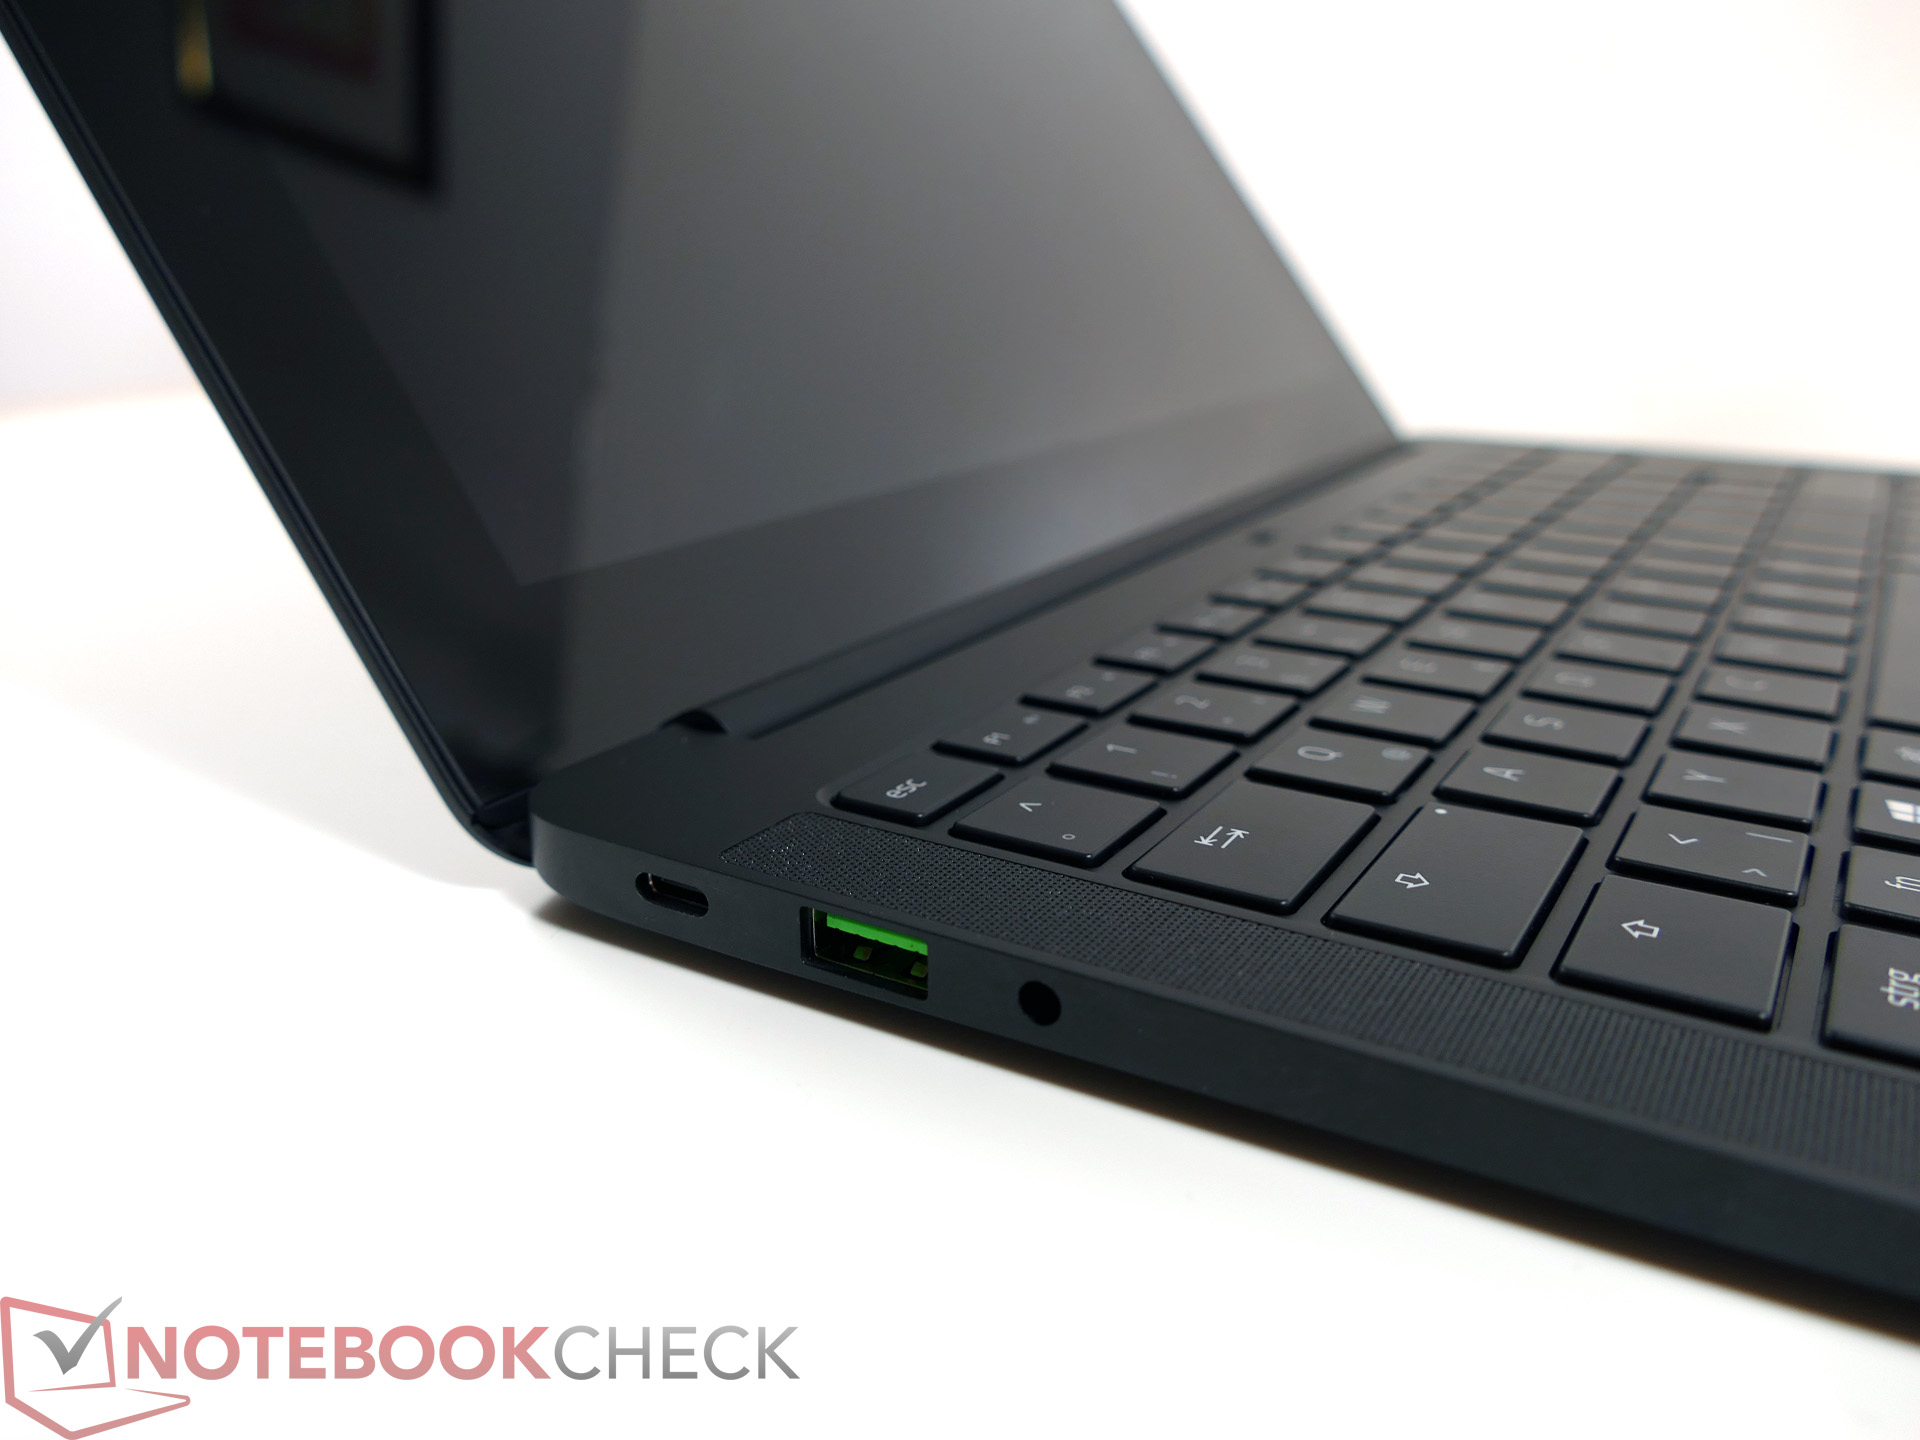
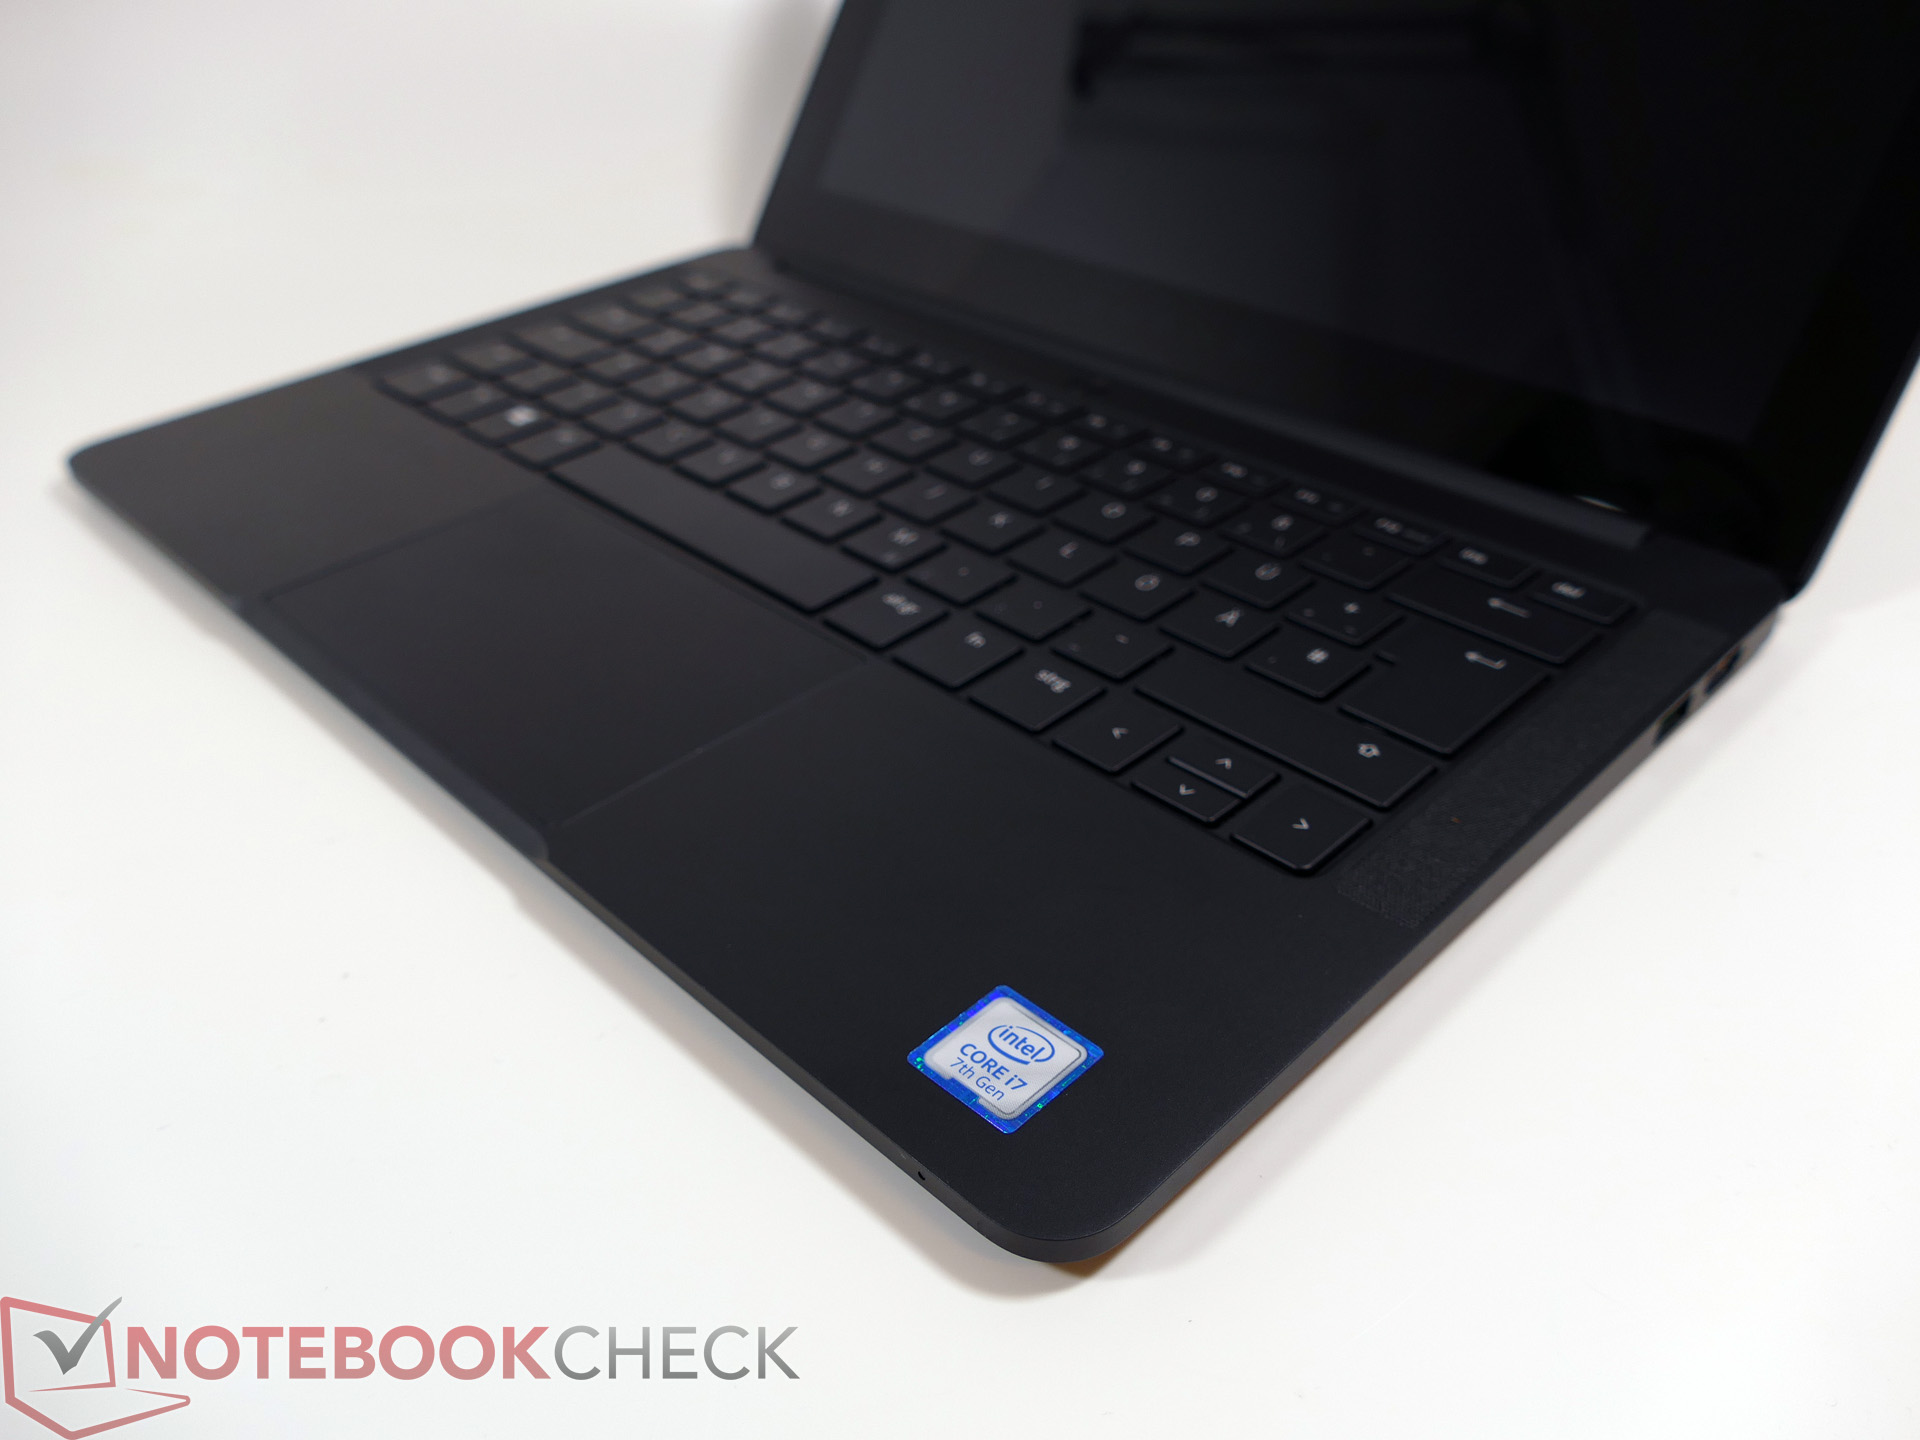
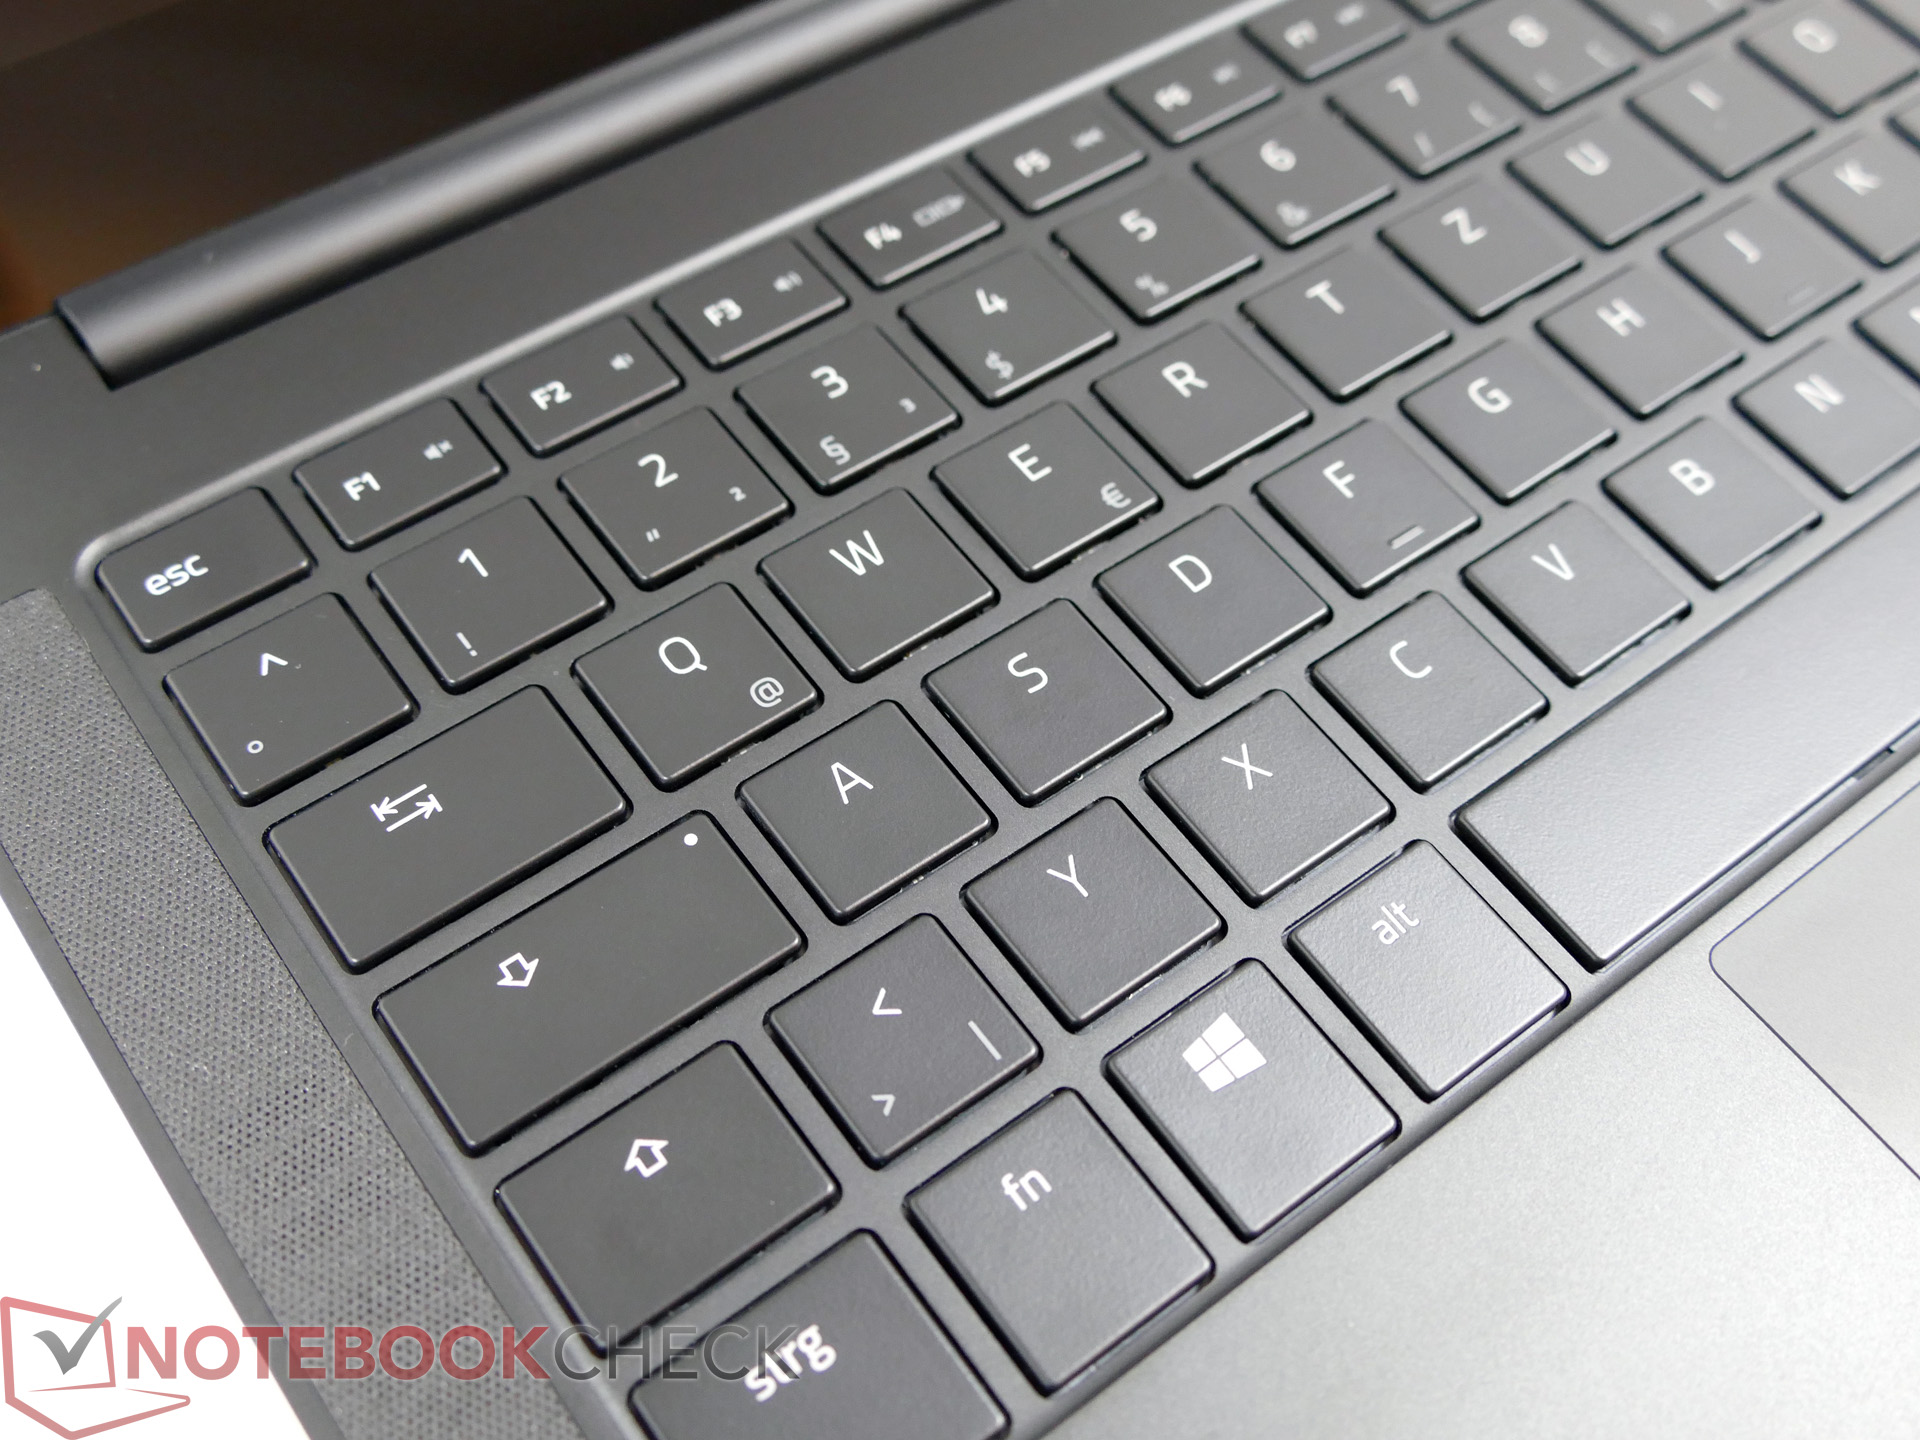
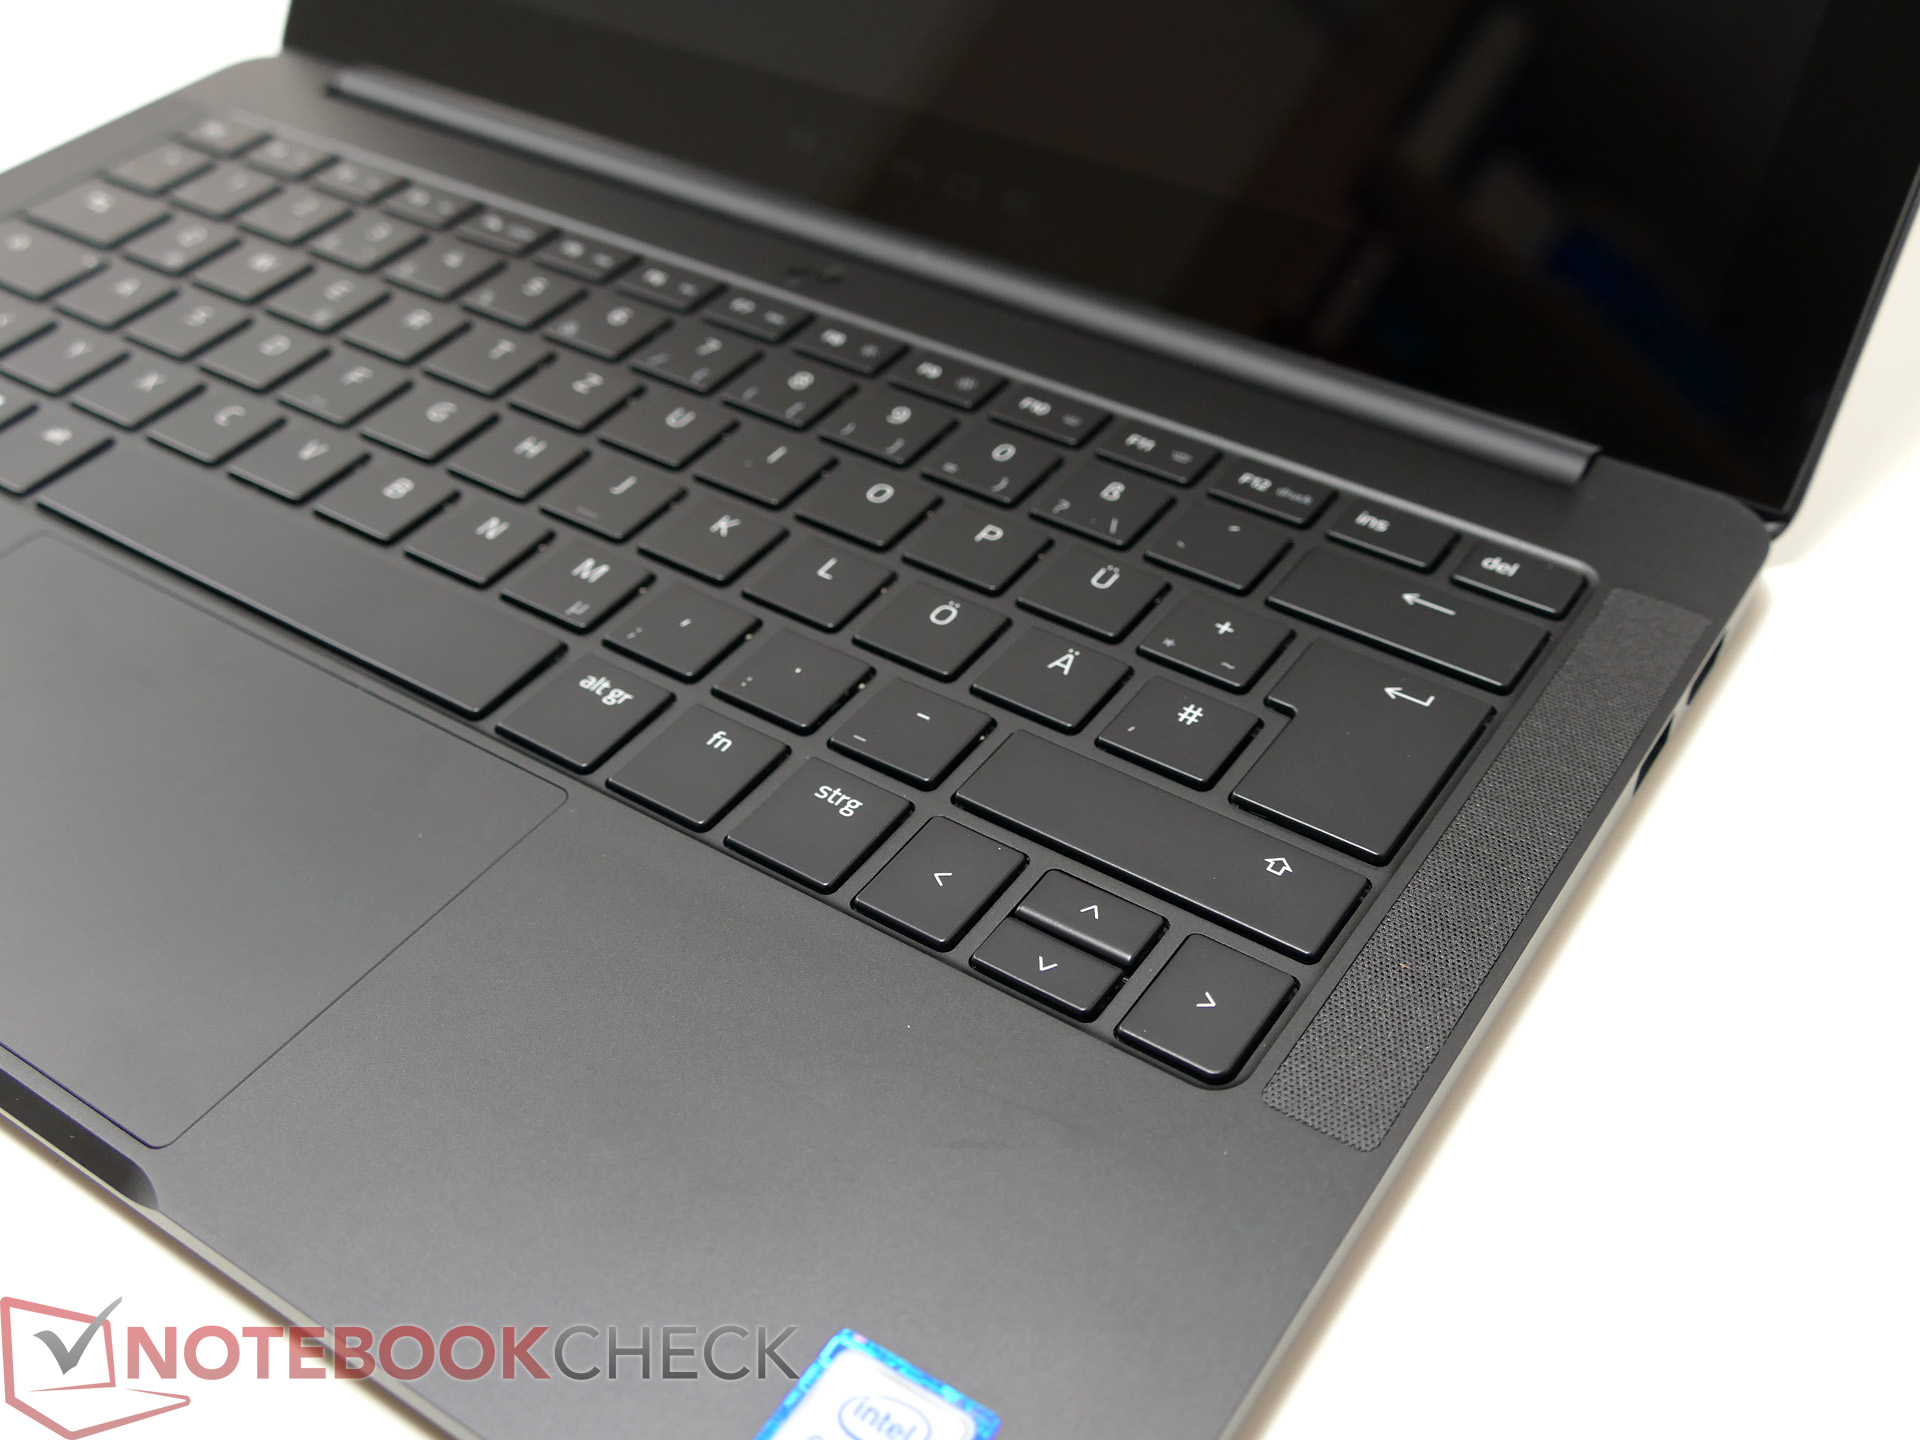
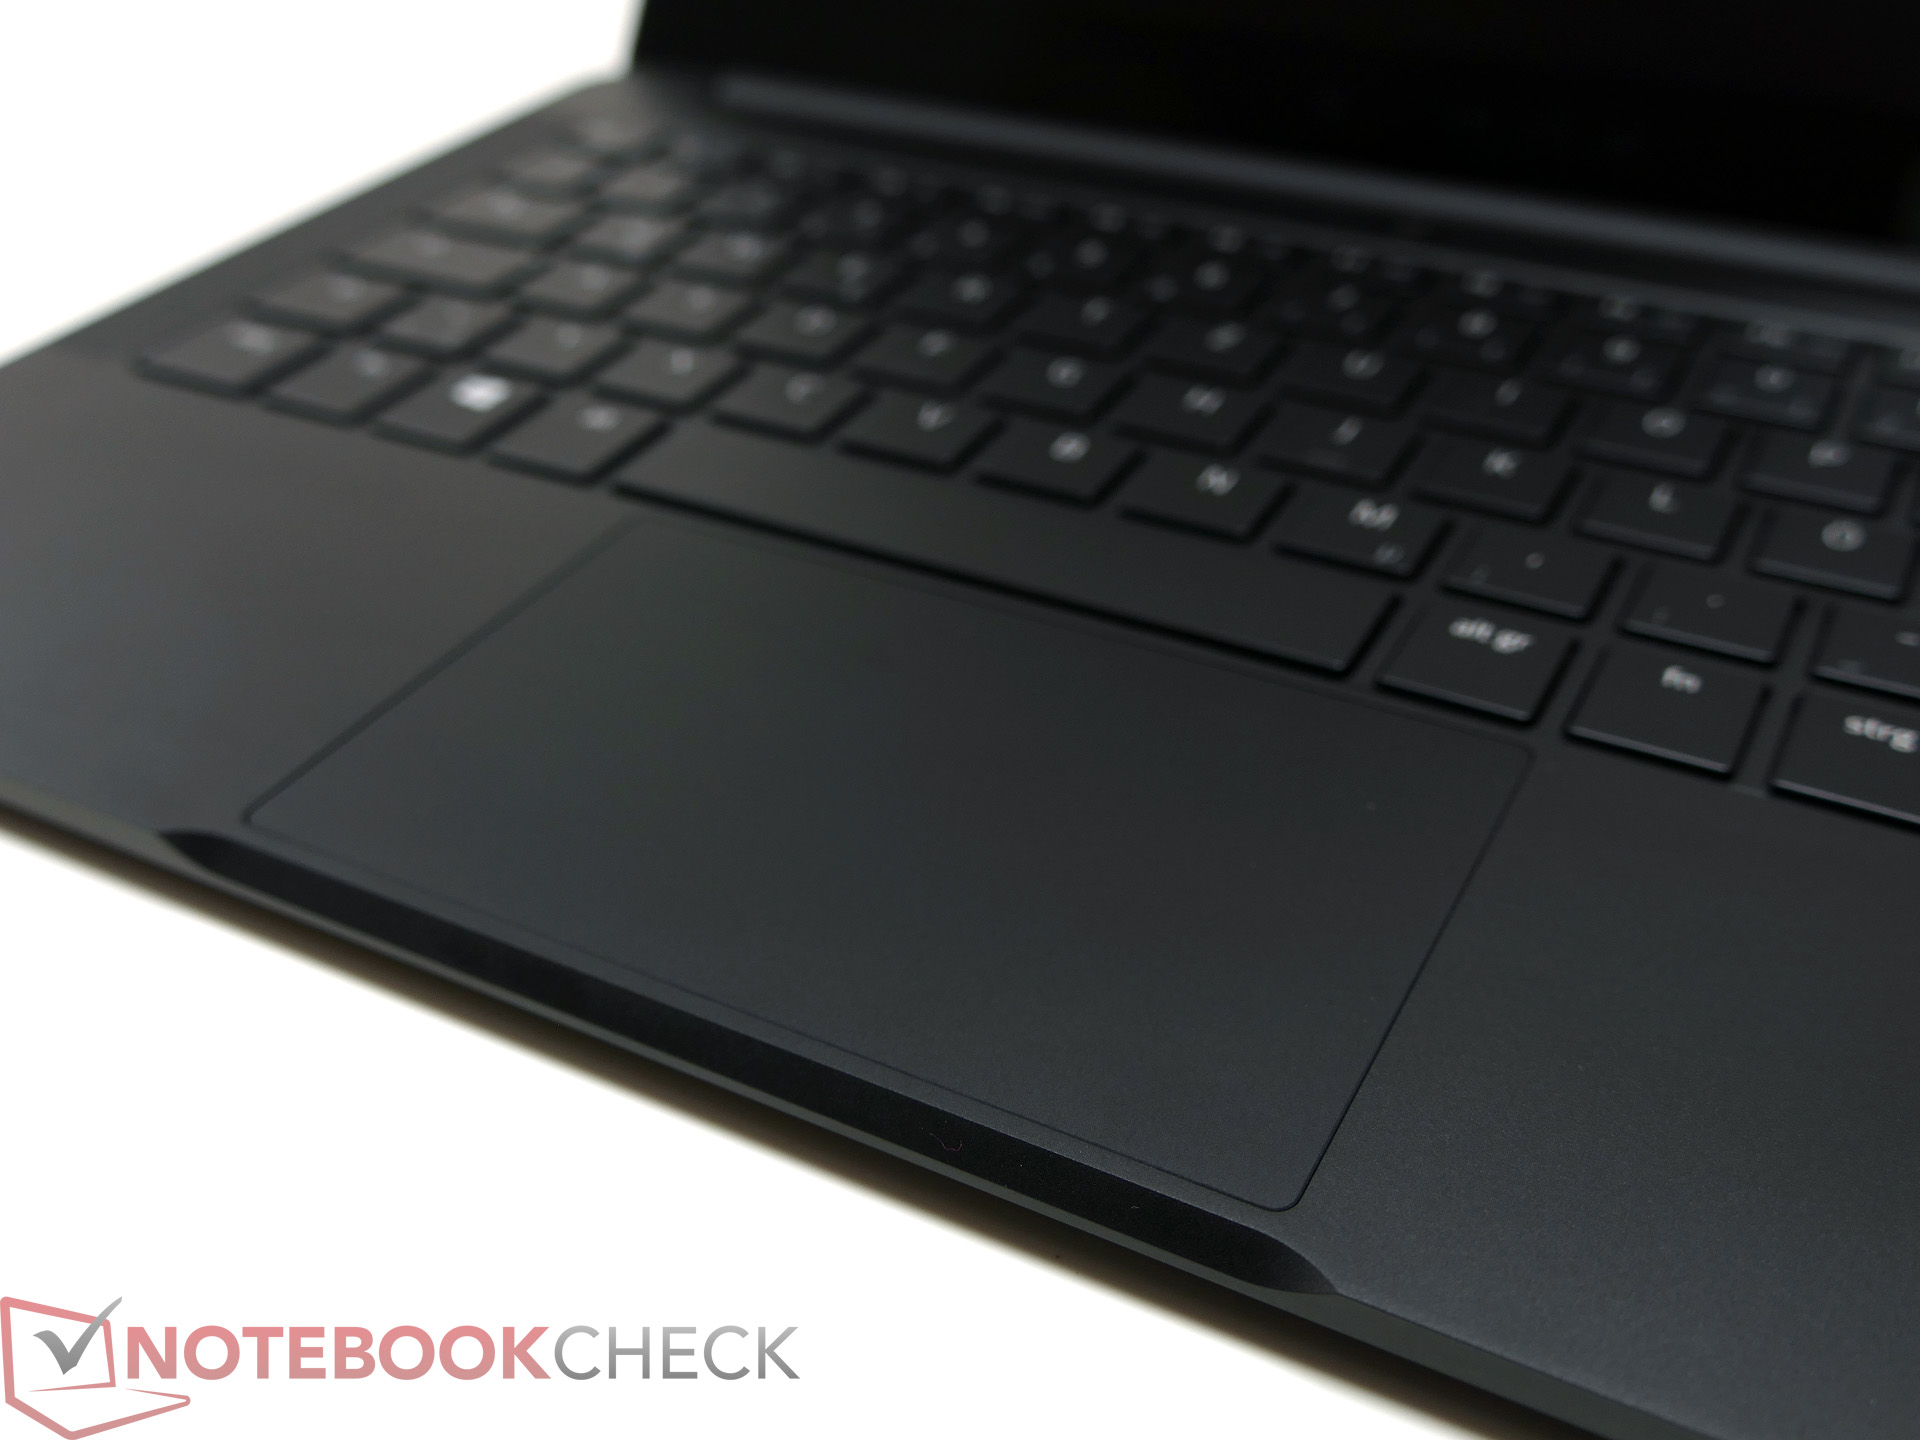
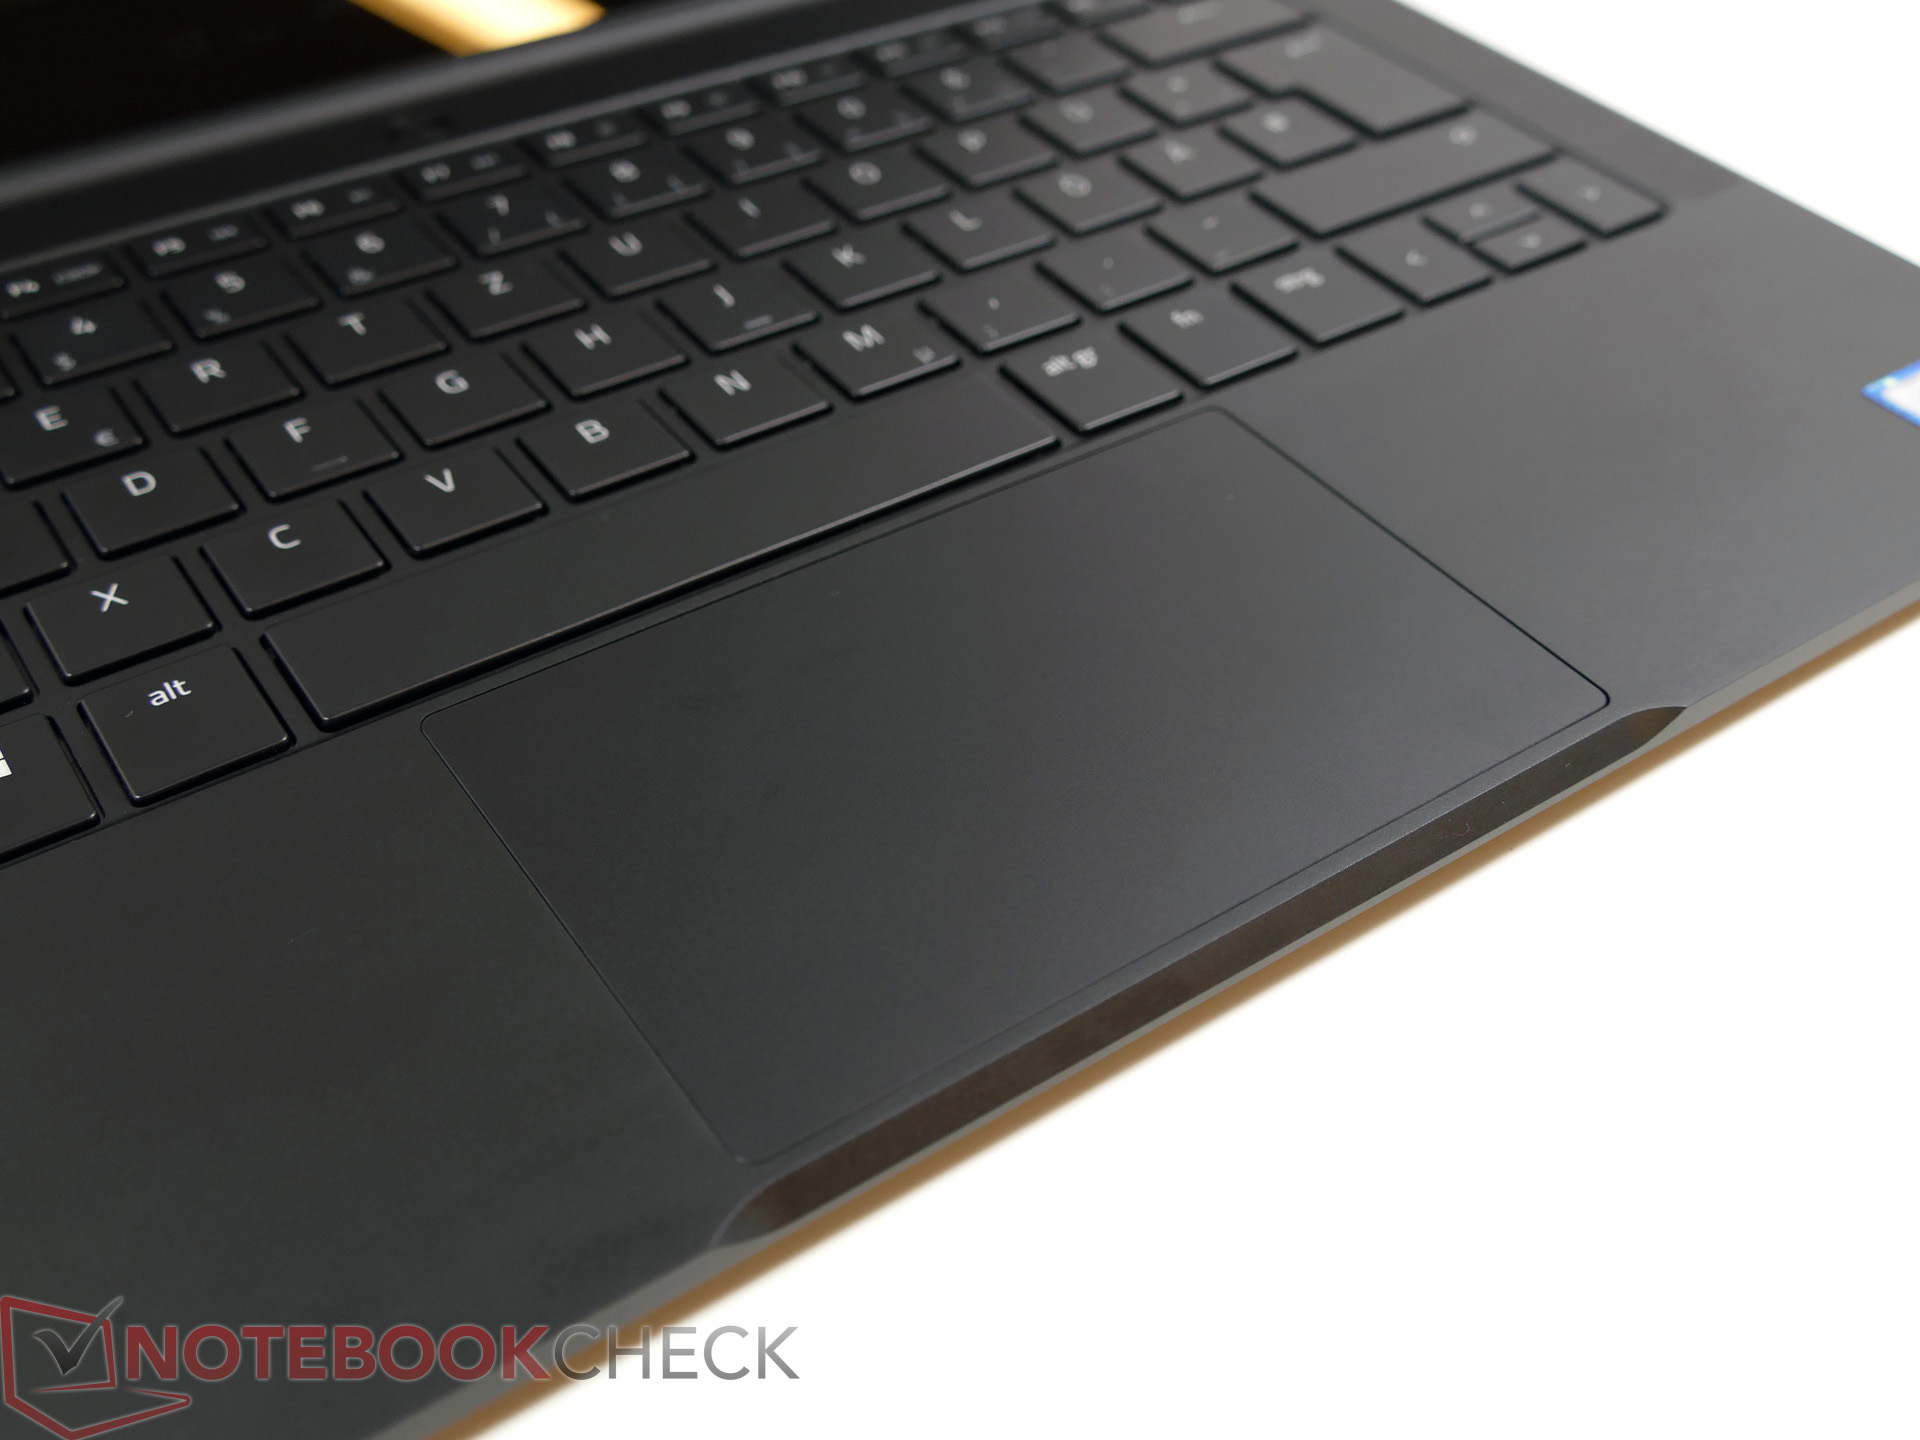
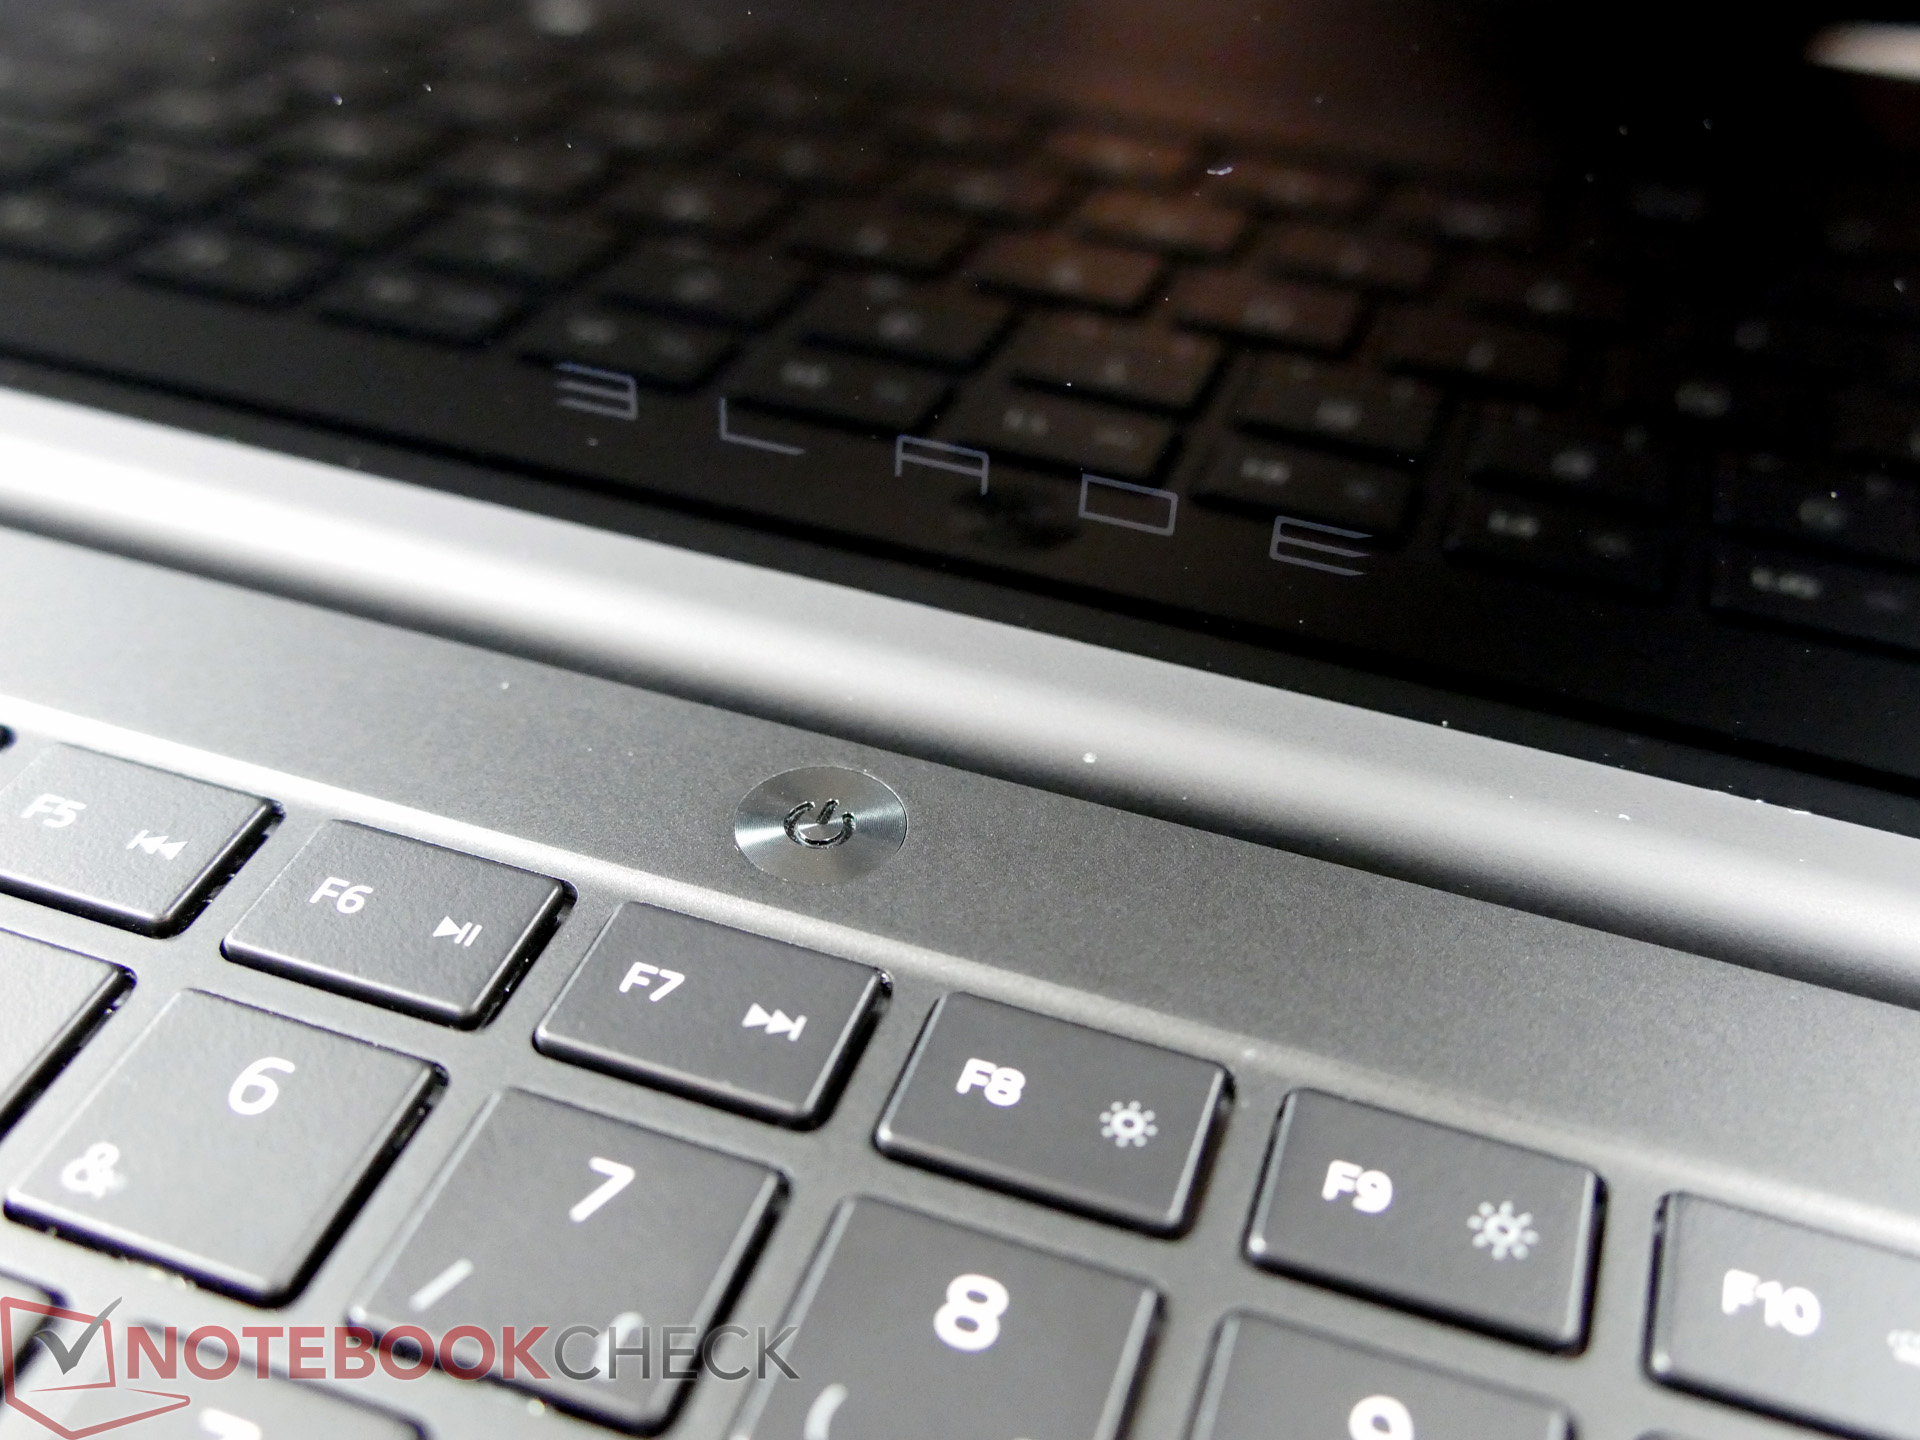
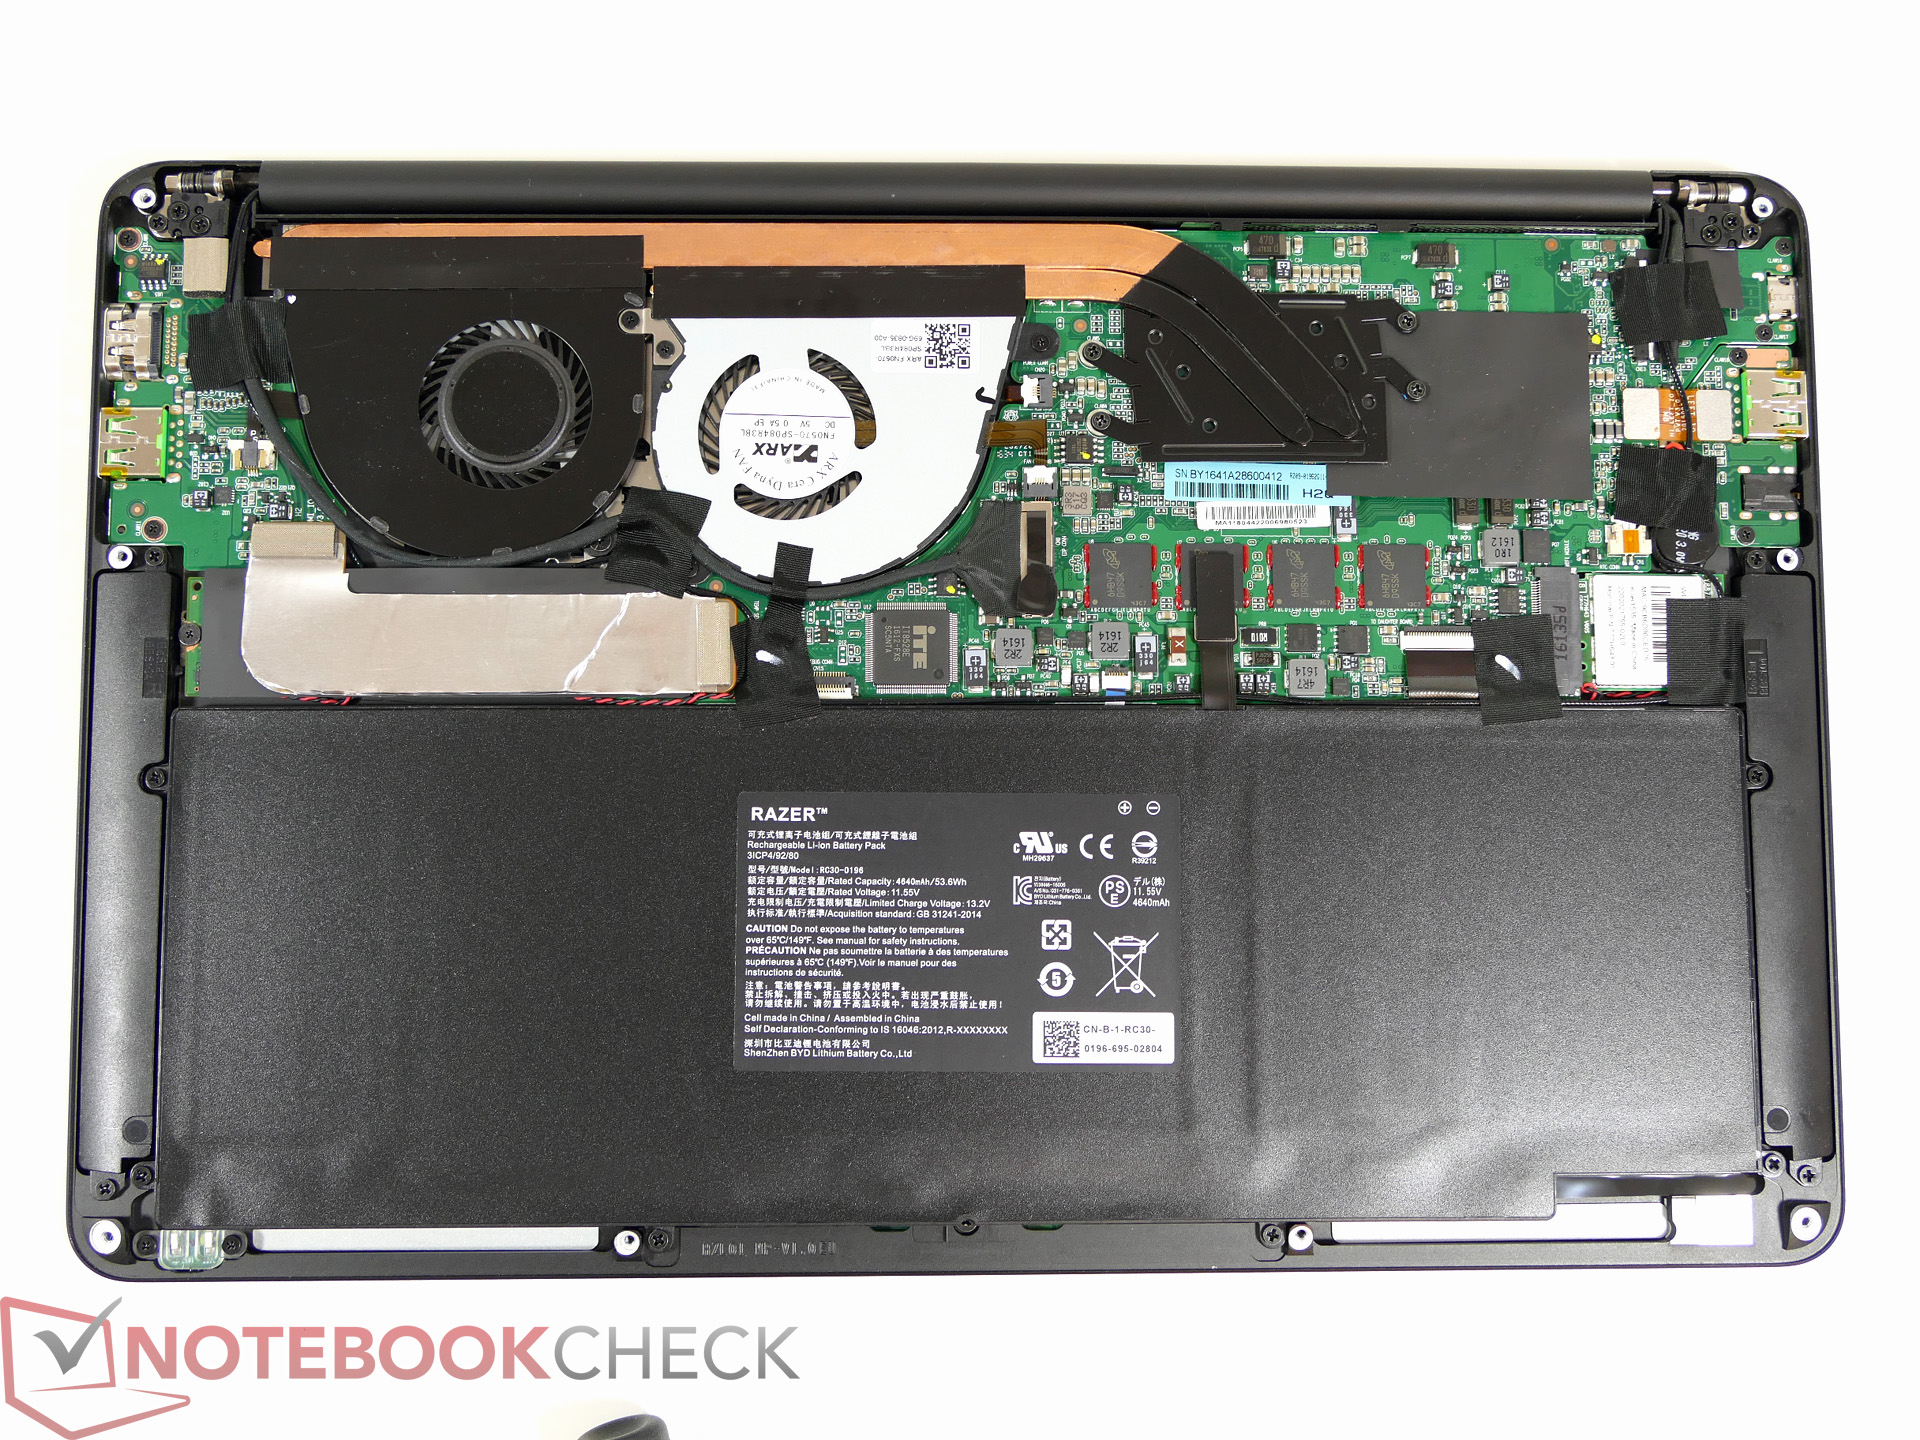
雷蛇的最新Blade Stealth几乎克服了前代机型最大的缺点:一般的电池续航。这台新设备的8到13小时续航表现完全可以让用户在一整天的时间内(根据使用需要)远离插座。它的机身没有变化,高端设计加上工艺品质和质感完全可以和Apple的MacBook系列抗衡。遗憾的是它的黑色磨砂表面比较容易沾染指纹,同时十分难以清除。
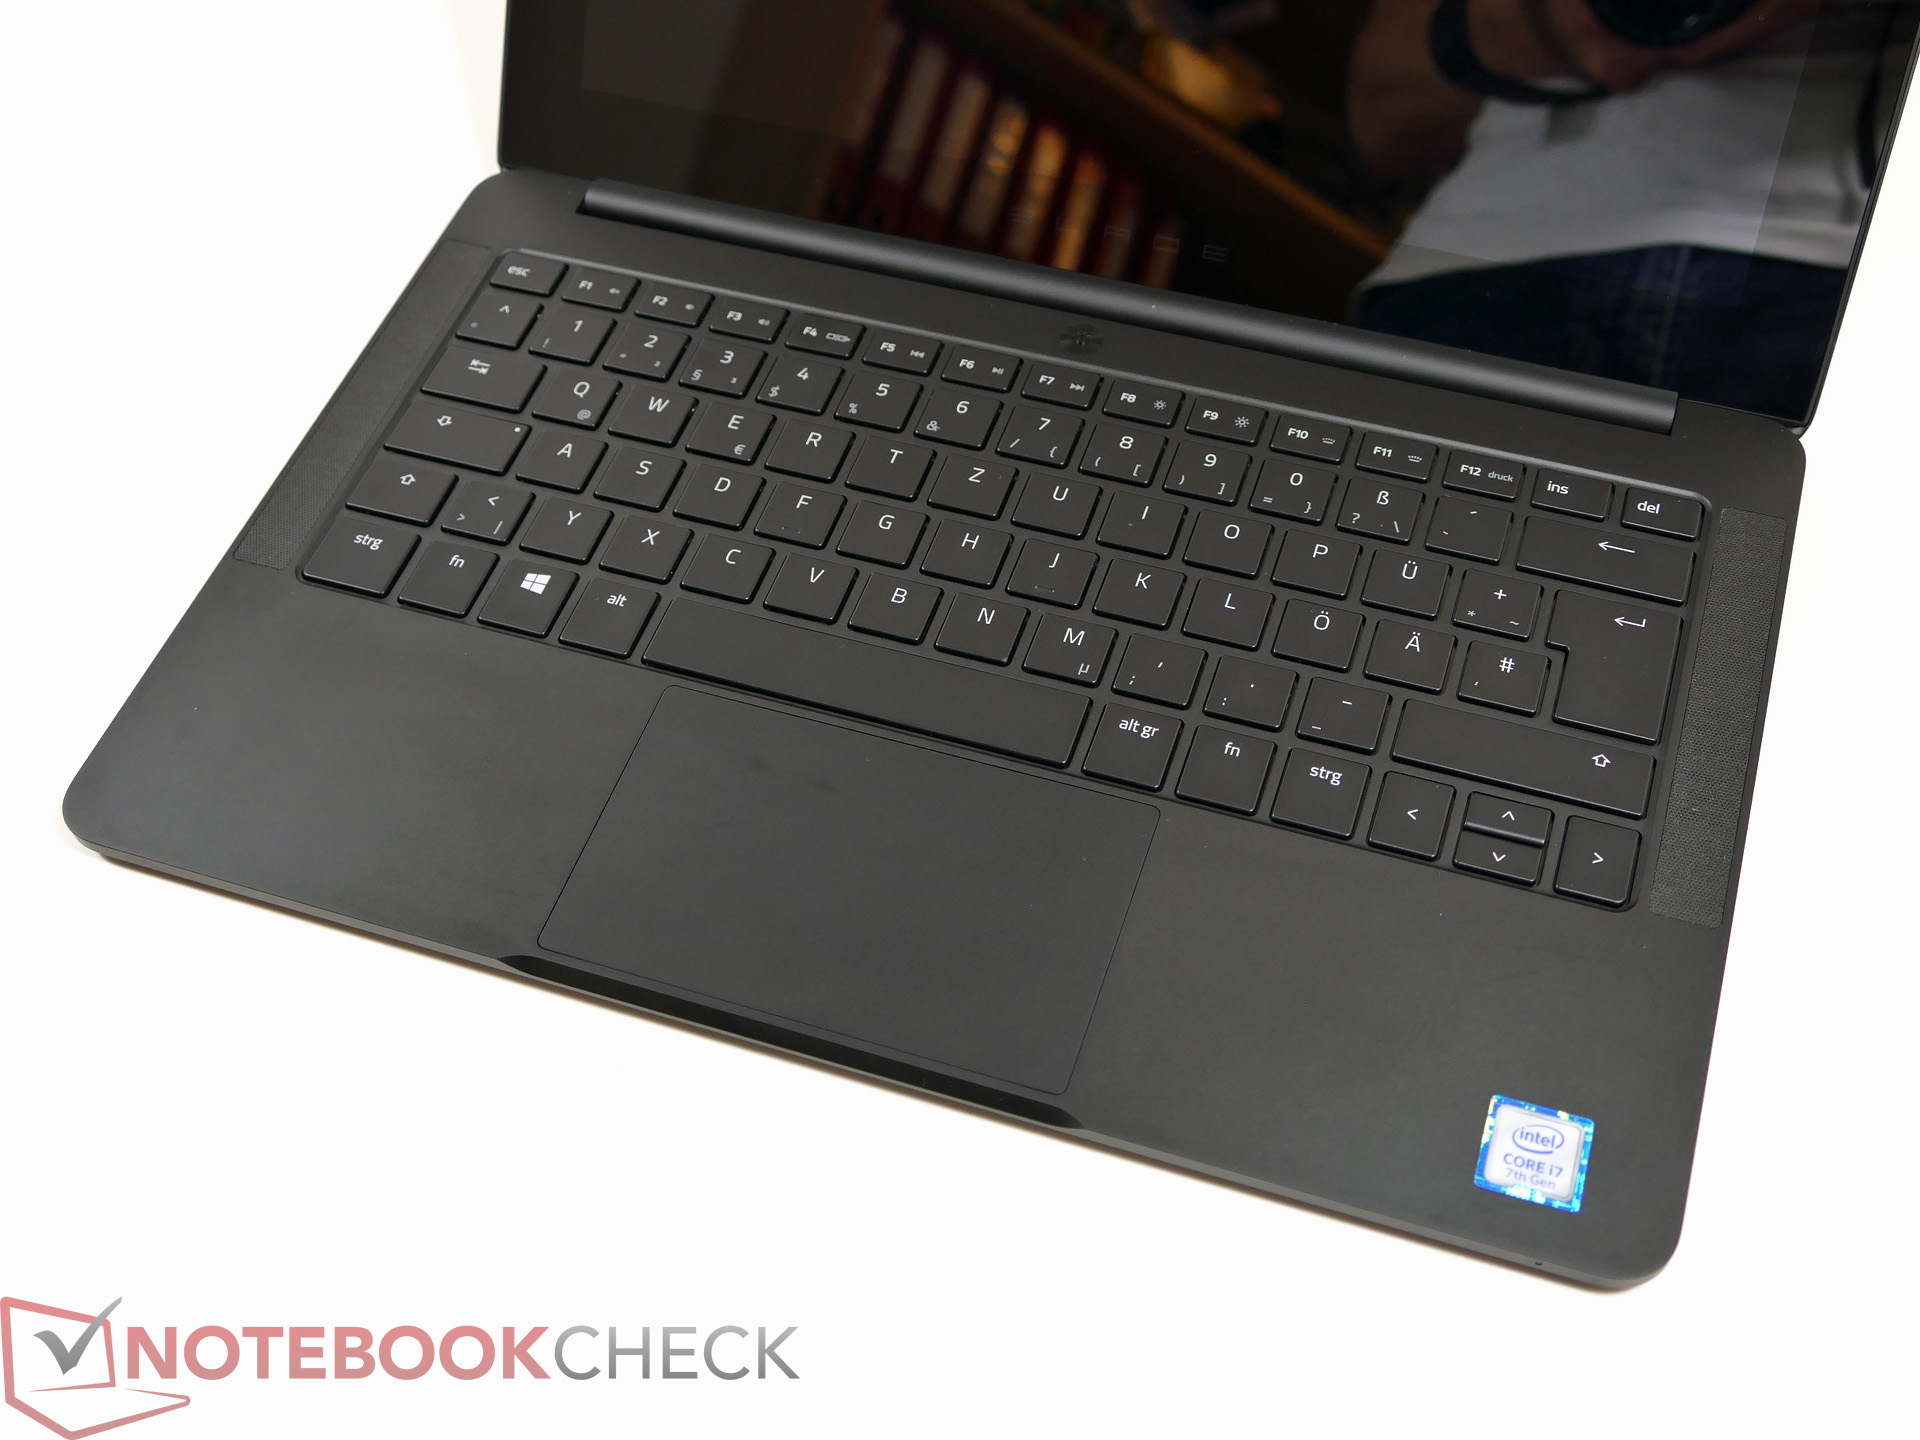
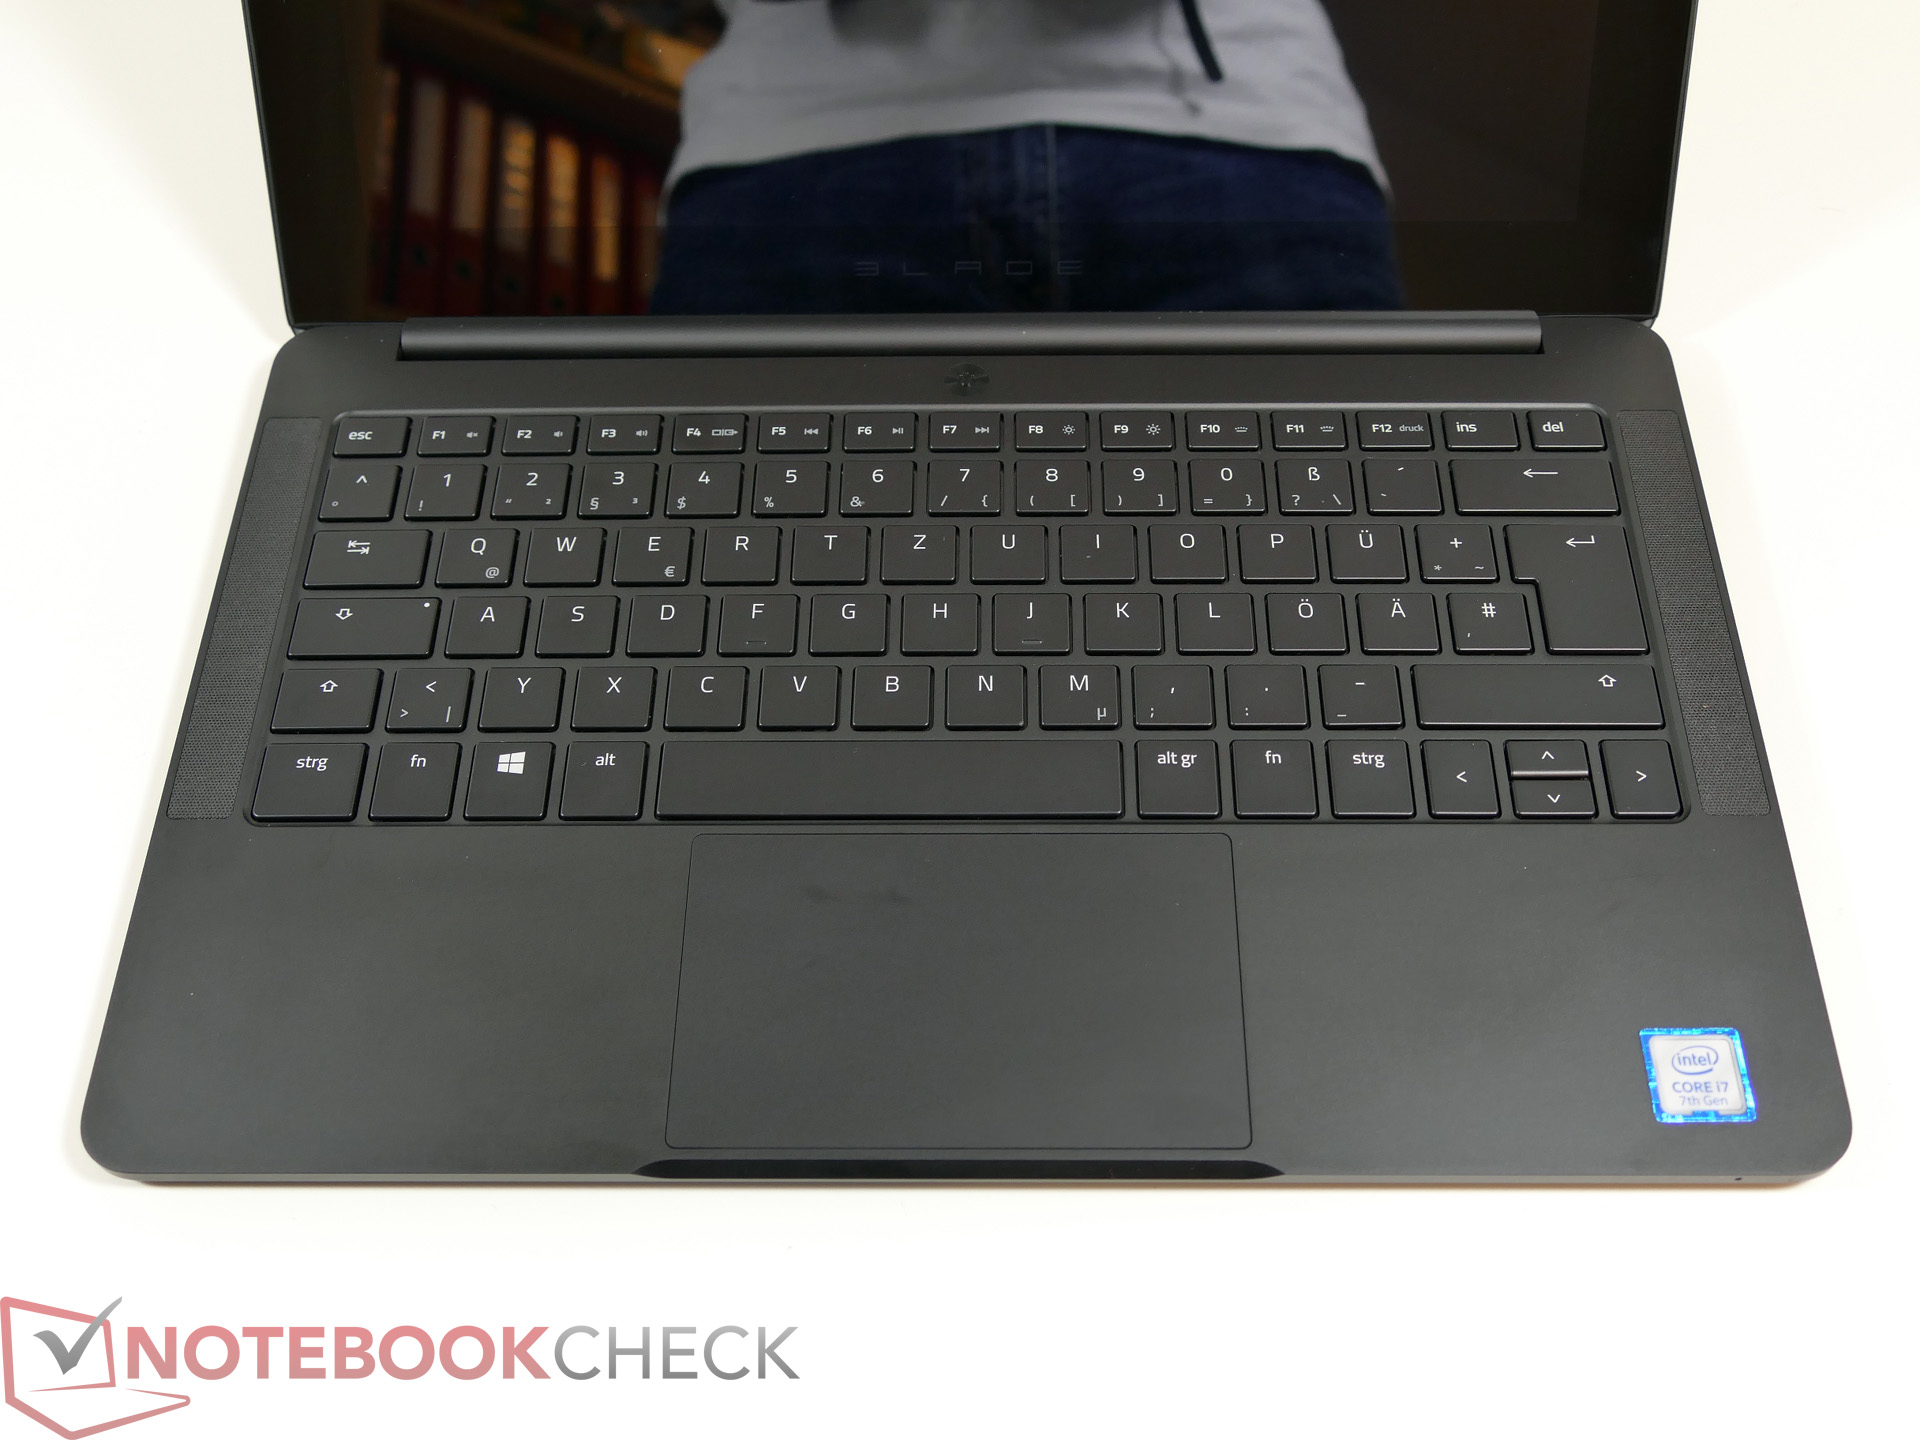
得力于Kaby Lake处理器和更大容量的电池,Blade Stealth现在不用再在其他亚笔记本电脑面前抬不起头了。雷蛇Core外置显卡也是个让人期待的搭配选项,不过即使没有它,Blade Stealth自身也是一台十分成功的笔记本电脑。
这次我们得到的测试机搭配了QHD+屏幕。这块面板在各方面的表现都十分优秀,完全可以媲美4K屏幕。特别是考虑到较小的12.5寸大小,这块屏幕的在大部分情况下可能都是更好的选择。这个搭配较低分辨率屏幕的配置型号价位也低200欧元(约1505人民币),同时可能也对降低功耗做出了贡献。
它的性能也让我们十分惊喜。这颗处理器的表现十分优秀,即使是在系统负载较高的情况下也十分稳定。Blade Stealth十分适合与雷蛇Core搭配,构建一个强劲的游戏系统。我们将在接下来的评测中提供更多的相关信息。
注:本文是基于完整评测的缩减版本,阅读完整的英文评测,请点击这里。
Razer Blade Stealth QHD i7-7500U
-
10/25/2016 v5.1(old)
J. Simon Leitner
Pricecompare
