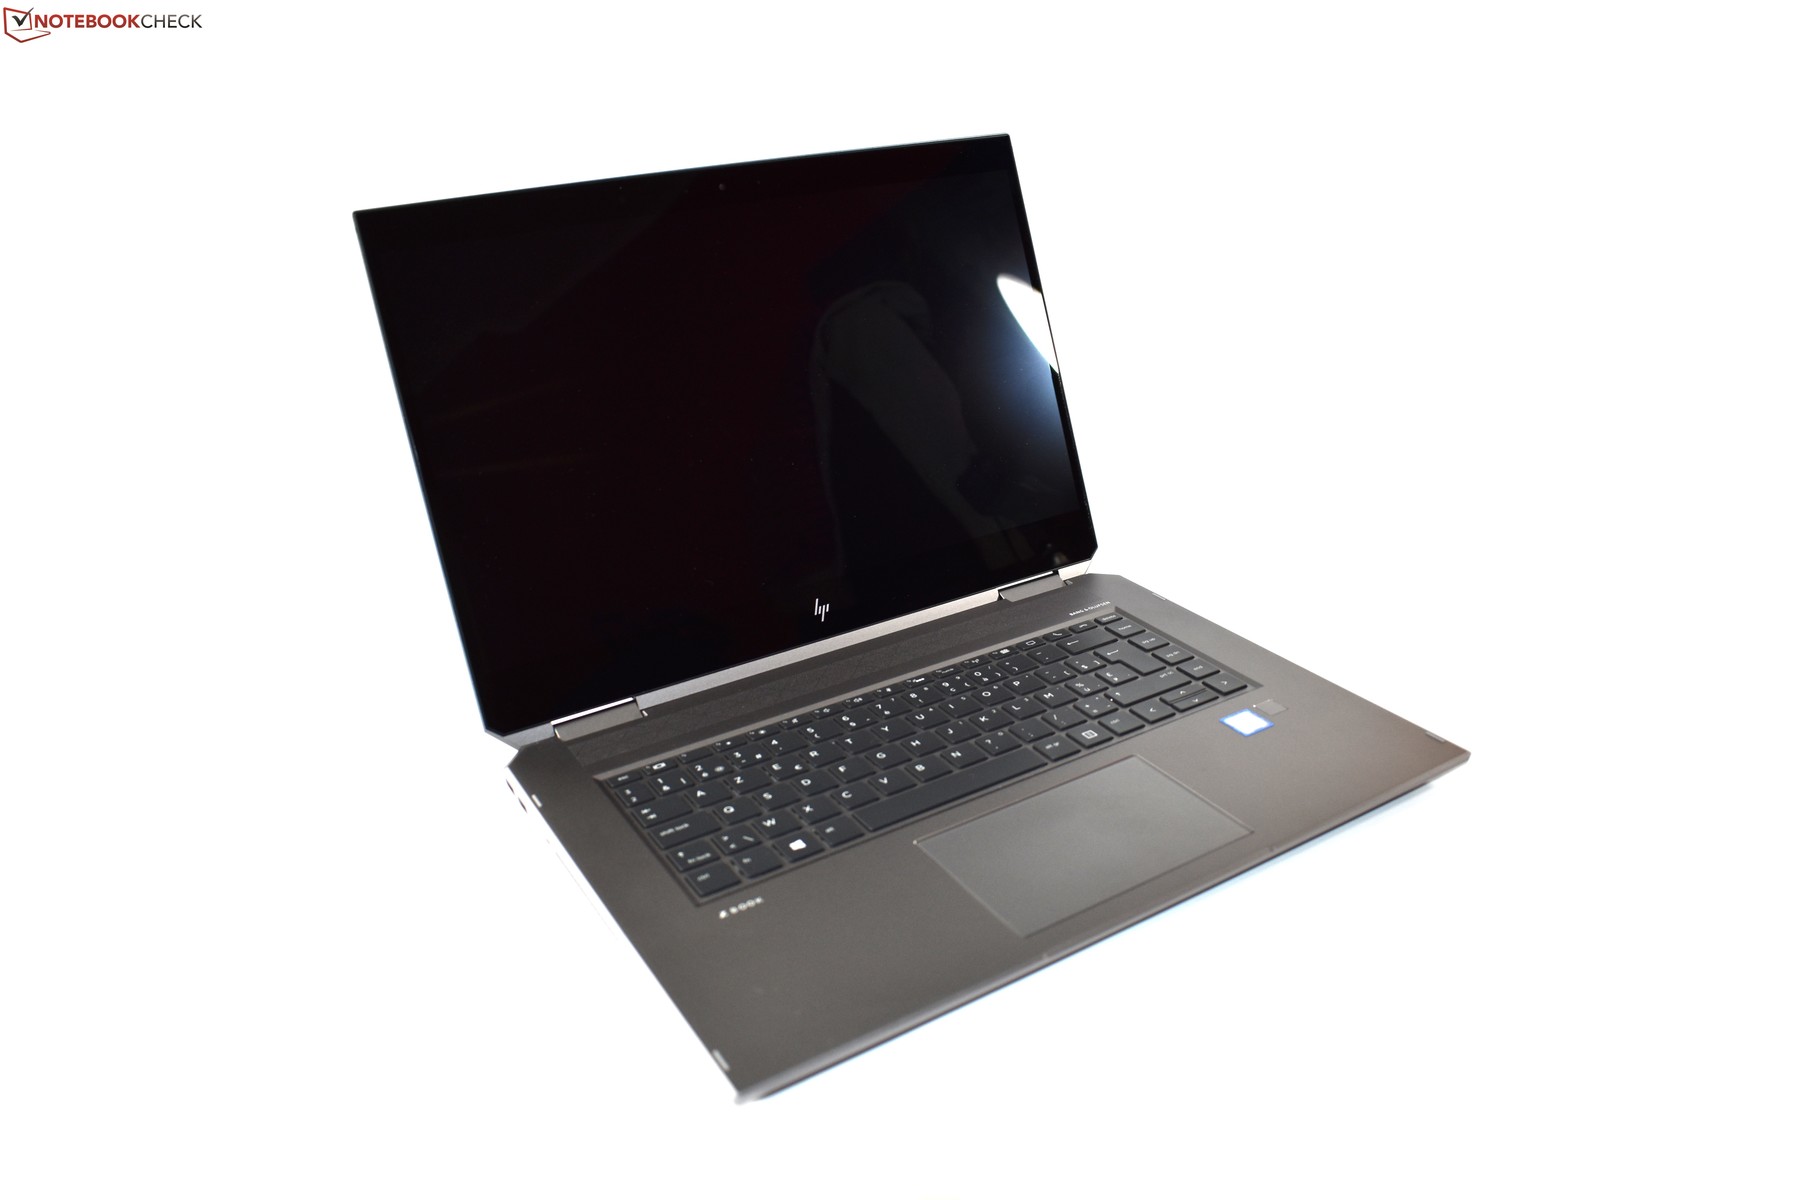
惠普ZBook Studio x360 G5(i7,P1000,FHD)工作站评测

| SD Card Reader | |
| average JPG Copy Test (av. of 3 runs) | |
| Lenovo ThinkPad P1-20MD002LUS (Toshiba Exceria Pro SDXC 64 GB UHS-II) | |
| HP ZBook Studio x360 G5-4QH13EA (Toshiba Exceria Pro SDXC 64 GB UHS-II) | |
| Dell Precision 5530 Xeon E-2176M (Toshiba Exceria Pro SDXC 64 GB UHS-II) | |
| Average of class Workstation (49.6 - 681, n=14, last 2 years) | |
| Dell Precision 5530 2-in-1 (Toshiba Exceria Pro M501 UHS-II) | |
| maximum AS SSD Seq Read Test (1GB) | |
| Lenovo ThinkPad P1-20MD002LUS (Toshiba Exceria Pro SDXC 64 GB UHS-II) | |
| Average of class Workstation (87.6 - 1455, n=14, last 2 years) | |
| Dell Precision 5530 2-in-1 (Toshiba Exceria Pro M501 UHS-II) | |
| Dell Precision 5530 Xeon E-2176M (Toshiba Exceria Pro SDXC 64 GB UHS-II) | |
| HP ZBook Studio x360 G5-4QH13EA (Toshiba Exceria Pro SDXC 64 GB UHS-II) | |
| |||||||||||||||||||||||||
Brightness Distribution: 85 %
Center on Battery: 386 cd/m²
Contrast: 1121:1 (Black: 0.34 cd/m²)
ΔE ColorChecker Calman: 1.8 | ∀{0.5-29.43 Ø4.73}
calibrated: 1
ΔE Greyscale Calman: 1.8 | ∀{0.09-98 Ø4.97}
97.7% sRGB (Argyll 1.6.3 3D)
62.5% AdobeRGB 1998 (Argyll 1.6.3 3D)
67.6% AdobeRGB 1998 (Argyll 3D)
98% sRGB (Argyll 3D)
66.5% Display P3 (Argyll 3D)
Gamma: 2.25
CCT: 6735 K
| HP ZBook Studio x360 G5-4QH13EA LGD05A9, , 1920x1080, 15.6" | Dell Precision 5530 Xeon E-2176M Sharp SHP148D / LQ156D1, , 3840x2160, 15.6" | Dell Precision 5530 2-in-1 Sharp SHP148D, , 3840x2160, 15.6" | Lenovo ThinkPad P1-20MD002LUS B156ZAN03.2, , 3840x2160, 15.6" | HP ZBook Studio G5-4QH10EA AUO30EB, , 3840x2160, 15.6" | Apple MacBook Pro 15 2018 (2.6 GHz, 560X) APPA040, , 2880x1800, 15.4" | |
|---|---|---|---|---|---|---|
| Display | 9% | 29% | 26% | 1% | 26% | |
| Display P3 Coverage (%) | 66.5 | 76.5 15% | 91.2 37% | 86.4 30% | 68.2 3% | 98.7 48% |
| sRGB Coverage (%) | 98 | 98.4 0% | 99.9 2% | 99.9 2% | 96.2 -2% | 99.9 2% |
| AdobeRGB 1998 Coverage (%) | 67.6 | 76.4 13% | 99.4 47% | 99.1 47% | 68.8 2% | 86.6 28% |
| Response Times | -18% | -27% | -22% | -32% | -8% | |
| Response Time Grey 50% / Grey 80% * (ms) | 41.6 ? | 48 ? -15% | 49.6 ? -19% | 55.6 ? -34% | 60.8 ? -46% | 43.2 ? -4% |
| Response Time Black / White * (ms) | 28 ? | 33.6 ? -20% | 37.6 ? -34% | 30.8 ? -10% | 32.8 ? -17% | 31.2 ? -11% |
| PWM Frequency (Hz) | 1000 | 990 ? | 117000 ? | |||
| Screen | -39% | -35% | -62% | -36% | 24% | |
| Brightness middle (cd/m²) | 381 | 451.7 19% | 430.9 13% | 397.6 4% | 417 9% | 520 36% |
| Brightness (cd/m²) | 362 | 440 22% | 398 10% | 396 9% | 412 14% | 492 36% |
| Brightness Distribution (%) | 85 | 90 6% | 79 -7% | 85 0% | 85 0% | 88 4% |
| Black Level * (cd/m²) | 0.34 | 0.4 -18% | 0.35 -3% | 0.25 26% | 0.29 15% | 0.39 -15% |
| Contrast (:1) | 1121 | 1129 1% | 1231 10% | 1590 42% | 1438 28% | 1333 19% |
| Colorchecker dE 2000 * | 1.8 | 3.11 -73% | 3.29 -83% | 4.95 -175% | 4.4 -144% | 1.2 33% |
| Colorchecker dE 2000 max. * | 4.6 | 8.62 -87% | 7.46 -62% | 10.23 -122% | 6.7 -46% | 2.3 50% |
| Colorchecker dE 2000 calibrated * | 1 | 3.07 -207% | 3.58 -258% | 4.22 -322% | 1.9 -90% | |
| Greyscale dE 2000 * | 1.8 | 3.7 -106% | 2.6 -44% | 5.1 -183% | 5 -178% | 1.3 28% |
| Gamma | 2.25 98% | 2.11 104% | 2.19 100% | 2.234 98% | 2.28 96% | 2.18 101% |
| CCT | 6735 97% | 6492 100% | 6870 95% | 7543 86% | 7575 86% | 6738 96% |
| Color Space (Percent of AdobeRGB 1998) (%) | 62.5 | 69 10% | 87.2 40% | 87.6 40% | 62.3 0% | |
| Color Space (Percent of sRGB) (%) | 97.7 | 98 0% | 100 2% | 100 2% | 96 -2% | |
| Total Average (Program / Settings) | -16% /
-28% | -11% /
-22% | -19% /
-40% | -22% /
-28% | 14% /
20% |
* ... smaller is better
Display Response Times
| ↔ Response Time Black to White | ||
|---|---|---|
| 28 ms ... rise ↗ and fall ↘ combined | ↗ 16.4 ms rise | 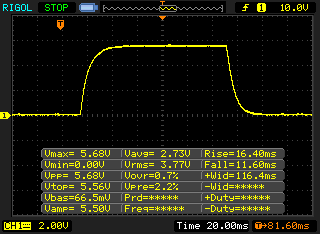 |
| ↘ 11.6 ms fall | ||
| The screen shows relatively slow response rates in our tests and may be too slow for gamers. In comparison, all tested devices range from 0.1 (minimum) to 240 (maximum) ms. » 71 % of all devices are better. This means that the measured response time is worse than the average of all tested devices (19.9 ms). | ||
| ↔ Response Time 50% Grey to 80% Grey | ||
| 41.6 ms ... rise ↗ and fall ↘ combined | ↗ 22 ms rise | 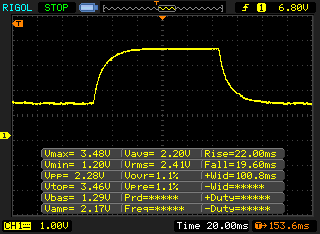 |
| ↘ 19.6 ms fall | ||
| The screen shows slow response rates in our tests and will be unsatisfactory for gamers. In comparison, all tested devices range from 0.165 (minimum) to 636 (maximum) ms. » 67 % of all devices are better. This means that the measured response time is worse than the average of all tested devices (31.1 ms). | ||
Screen Flickering / PWM (Pulse-Width Modulation)
| Screen flickering / PWM not detected |  | ||
In comparison: 52 % of all tested devices do not use PWM to dim the display. If PWM was detected, an average of 7798 (minimum: 5 - maximum: 343500) Hz was measured. | |||
| PCMark 8 Home Score Accelerated v2 | 4244 points | |
| PCMark 8 Creative Score Accelerated v2 | 5138 points | |
| PCMark 8 Work Score Accelerated v2 | 5335 points | |
| PCMark 10 Score | 4735 points | |
Help | ||
| HP ZBook Studio x360 G5-4QH13EA Samsung SSD PM981 MZVLB512HAJQ | Dell Precision 5530 Xeon E-2176M SK hynix PC400 512 GB | Dell Precision 5530 2-in-1 SK Hynix PC401 512GB M.2 (HFS512GD9TNG) | Lenovo ThinkPad P1-20MD002LUS Samsung SSD PM981 MZVLB2T0HMLB | Apple MacBook Pro 15 2018 (2.6 GHz, 560X) Apple SSD AP0512 | Average Samsung SSD PM981 MZVLB512HAJQ | |
|---|---|---|---|---|---|---|
| CrystalDiskMark 5.2 / 6 | -1% | -6% | 1% | -21% | 12% | |
| Write 4K (MB/s) | 105.1 | 97.8 -7% | 128.9 23% | 108 3% | 43.59 -59% 35.92 -66% | 126.7 ? 21% |
| Read 4K (MB/s) | 42.66 | 41.21 -3% | 45.7 7% | 37.24 -13% | 12.68 -70% 11.67 -73% | 44 ? 3% |
| Write Seq (MB/s) | 1571 | 1312 -16% | 635 -60% | 1476 -6% | 1605 2% 1522 -3% | 1617 ? 3% |
| Read Seq (MB/s) | 1427 | 1667 17% | 2065 45% | 1367 -4% | 1595 12% 1528 7% | 1716 ? 20% |
| Write 4K Q32T1 (MB/s) | 291.2 | 449.5 54% | 336.6 16% | 302.4 4% | 232.7 -20% 204.5 -30% | 413 ? 42% |
| Read 4K Q32T1 (MB/s) | 369.9 | 327.4 -11% | 393.6 6% | 375 1% | 404 9% 393.3 6% | 420 ? 14% |
| Write Seq Q32T1 (MB/s) | 2024 | 1385 -32% | 662 -67% | 2433 20% | 1770 -13% 1756 -13% | 2076 ? 3% |
| Read Seq Q32T1 (MB/s) | 3392 | 2948 -13% | 2664 -21% | 3493 3% | 2993 -12% 2805 -17% | 3130 ? -8% |

| SiSoft Sandra 2016 | |
| Image Processing | |
| Average NVIDIA Quadro P1000 (264 - 269, n=3) | |
| HP ZBook Studio x360 G5-4QH13EA | |
| HP ZBook Studio G5-4QH10EA | |
| GP Cryptography (Higher Security AES256+SHA2-512) | |
| HP ZBook Studio x360 G5-4QH13EA | |
| Average NVIDIA Quadro P1000 (10.8 - 11, n=3) | |
| HP ZBook Studio G5-4QH10EA | |
| GP Financial Analysis (FP High/Double Precision) | |
| Average NVIDIA Quadro P1000 (23.2 - 23.8, n=3) | |
| HP ZBook Studio G5-4QH10EA | |
| HP ZBook Studio x360 G5-4QH13EA | |
| 3DMark 11 Performance | 6506 points | |
| 3DMark Cloud Gate Standard Score | 21290 points | |
| 3DMark Fire Strike Score | 4508 points | |
Help | ||
| The Witcher 3 - 1920x1080 Ultra Graphics & Postprocessing (HBAO+) | |
| Average of class Workstation (26.3 - 91.7, n=3, last 2 years) | |
| Dell Precision 5530 Xeon E-2176M | |
| Lenovo ThinkPad P1-20MD002LUS | |
| Dell Precision 5530 2-in-1 | |
| HP EliteBook 1050 G1-4QY20EA | |
| HP ZBook Studio x360 G5-4QH13EA | |
| Average NVIDIA Quadro P1000 (15.7 - 16.9, n=3) | |
| BioShock Infinite - 1920x1080 Ultra Preset, DX11 (DDOF) | |
| Dell Precision 5530 Xeon E-2176M | |
| Lenovo ThinkPad P1-20MD002LUS | |
| HP EliteBook 1050 G1-4QY20EA | |
| Dell Precision 5530 2-in-1 | |
| HP ZBook Studio x360 G5-4QH13EA | |
| Average NVIDIA Quadro P1000 (51 - 51.7, n=3) | |
| low | med. | high | ultra | |
|---|---|---|---|---|
| BioShock Infinite (2013) | 276.8 | 155.4 | 133.8 | 51.7 |
| The Witcher 3 (2015) | 89.4 | 52.5 | 26.1 | 16.9 |
| Rainbow Six Siege (2015) | 172.7 | 115.1 | 62.8 | 56.1 |
| Rise of the Tomb Raider (2016) | 88.3 | 55.7 | 29.6 | 24.1 |
| Battlefield 1 (2016) | 135.8 | 80.5 | 38.7 | 35.3 |
| For Honor (2017) | 117.6 | 44.3 | 42 | 33 |
| Ghost Recon Wildlands (2017) | 71.7 | 31.9 | 29.1 | 15.8 |
| Final Fantasy XV Benchmark (2018) | 51.9 | 25.3 | 18.2 | |
| F1 2018 (2018) | 96 | 53 | 41 | 25 |
| FIFA 19 (2018) | 204.6 | 107.8 | 99.9 | 89.5 |
Noise level
| Idle |
| 28.7 / 28.7 / 33.3 dB(A) |
| Load |
| 38 / 42.3 dB(A) |
 | ||
30 dB silent 40 dB(A) audible 50 dB(A) loud |
||
min: | ||
(±) The maximum temperature on the upper side is 42 °C / 108 F, compared to the average of 38.2 °C / 101 F, ranging from 22.2 to 69.8 °C for the class Workstation.
(±) The bottom heats up to a maximum of 44.7 °C / 112 F, compared to the average of 41.1 °C / 106 F
(+) In idle usage, the average temperature for the upper side is 24.4 °C / 76 F, compared to the device average of 32 °C / 90 F.
(±) Playing The Witcher 3, the average temperature for the upper side is 34.7 °C / 94 F, compared to the device average of 32 °C / 90 F.
(+) The palmrests and touchpad are cooler than skin temperature with a maximum of 29.4 °C / 84.9 F and are therefore cool to the touch.
(±) The average temperature of the palmrest area of similar devices was 27.8 °C / 82 F (-1.6 °C / -2.9 F).
HP ZBook Studio x360 G5-4QH13EA audio analysis
(±) | speaker loudness is average but good (75.5 dB)
Bass 100 - 315 Hz
(±) | reduced bass - on average 9.8% lower than median
(±) | linearity of bass is average (8.2% delta to prev. frequency)
Mids 400 - 2000 Hz
(±) | higher mids - on average 5.1% higher than median
(+) | mids are linear (5.7% delta to prev. frequency)
Highs 2 - 16 kHz
(+) | balanced highs - only 4.1% away from median
(+) | highs are linear (5.9% delta to prev. frequency)
Overall 100 - 16.000 Hz
(±) | linearity of overall sound is average (17.4% difference to median)
Compared to same class
» 53% of all tested devices in this class were better, 10% similar, 37% worse
» The best had a delta of 7%, average was 17%, worst was 35%
Compared to all devices tested
» 33% of all tested devices were better, 8% similar, 59% worse
» The best had a delta of 4%, average was 24%, worst was 134%
Dell Precision 5530 2-in-1 audio analysis
(±) | speaker loudness is average but good (72.5 dB)
Bass 100 - 315 Hz
(±) | reduced bass - on average 9.6% lower than median
(±) | linearity of bass is average (13% delta to prev. frequency)
Mids 400 - 2000 Hz
(+) | balanced mids - only 3.2% away from median
(+) | mids are linear (6.9% delta to prev. frequency)
Highs 2 - 16 kHz
(+) | balanced highs - only 2.8% away from median
(±) | linearity of highs is average (9.7% delta to prev. frequency)
Overall 100 - 16.000 Hz
(+) | overall sound is linear (13.9% difference to median)
Compared to same class
» 28% of all tested devices in this class were better, 4% similar, 67% worse
» The best had a delta of 7%, average was 17%, worst was 35%
Compared to all devices tested
» 16% of all tested devices were better, 4% similar, 80% worse
» The best had a delta of 4%, average was 24%, worst was 134%
| Off / Standby | |
| Idle | |
| Load |
|
Key:
min: | |
| HP ZBook Studio x360 G5-4QH13EA i7-8750H, Quadro P1000, Samsung SSD PM981 MZVLB512HAJQ, IPS LED, 1920x1080, 15.6" | Dell Precision 5530 Xeon E-2176M E-2176M, Quadro P2000, SK hynix PC400 512 GB, IGZO, 3840x2160, 15.6" | Dell Precision 5530 2-in-1 i7-8706G, WX Vega M GL, SK Hynix PC401 512GB M.2 (HFS512GD9TNG), IPS, 3840x2160, 15.6" | Lenovo ThinkPad P1-20MD002LUS E-2176M, Quadro P2000 Max-Q, Samsung SSD PM981 MZVLB2T0HMLB, IPS, 3840x2160, 15.6" | Apple MacBook Pro 15 2018 (2.6 GHz, 560X) i7-8850H, Radeon Pro 560X, Apple SSD AP0512, IPS, 2880x1800, 15.4" | Average NVIDIA Quadro P1000 | Average of class Workstation | |
|---|---|---|---|---|---|---|---|
| Power Consumption | -45% | -18% | -23% | 3% | -4% | -50% | |
| Idle Minimum * (Watt) | 4.44 | 9.8 -121% | 7.4 -67% | 7.1 -60% | 3.4 23% | 5.09 ? -15% | 8.94 ? -101% |
| Idle Average * (Watt) | 9.24 | 16.8 -82% | 12.4 -34% | 14.4 -56% | 11 -19% | 9.25 ? -0% | 13.8 ? -49% |
| Idle Maximum * (Watt) | 13.3 | 16.9 -27% | 13.3 -0% | 14.6 -10% | 14.9 -12% | 13 ? 2% | 17.5 ? -32% |
| Load Average * (Watt) | 80.4 | 102.3 -27% | 79.2 1% | 93.9 -17% | 78.9 2% | 78.2 ? 3% | 95 ? -18% |
| Witcher 3 ultra * (Watt) | 66 | 76.5 -16% | 82.2 -25% | 77.9 -18% | |||
| Load Maximum * (Watt) | 118 | 114.5 3% | 96.5 18% | 88.3 25% | 91.2 23% | 132.7 ? -12% | 175.2 ? -48% |
* ... smaller is better
| HP ZBook Studio x360 G5-4QH13EA i7-8750H, Quadro P1000, 97.2 Wh | Dell Precision 5530 Xeon E-2176M E-2176M, Quadro P2000, 97 Wh | Dell Precision 5530 2-in-1 i7-8706G, WX Vega M GL, 75 Wh | Lenovo ThinkPad P1-20MD002LUS E-2176M, Quadro P2000 Max-Q, 80 Wh | Apple MacBook Pro 15 2018 (2.6 GHz, 560X) i7-8850H, Radeon Pro 560X, 83 Wh | Average of class Workstation | |
|---|---|---|---|---|---|---|
| Battery runtime | -26% | -44% | -57% | 4% | -14% | |
| Reader / Idle (h) | 24.1 | 16.5 -32% | 12.3 -49% | 26.1 ? 8% | ||
| H.264 (h) | 9.4 | 11.7 24% | 9.51 ? 1% | |||
| WiFi v1.3 (h) | 12.3 | 8.4 -32% | 7.3 -41% | 5.3 -57% | 10.2 -17% | 8.53 ? -31% |
| Load (h) | 2.1 | 1.8 -14% | 1.2 -43% | 1.429 ? -32% | ||
| Witcher 3 ultra (h) | 1.5 |
Pros
Cons
从某些方面来说,惠普ZBook Studio x360 G5是一款独特的笔记本电脑。翻转功能与工作站设计以及最新的六核处理器的结合是目前其他竞品无法提供的。但这种独特性是否使得ZBook Studio x360 G5成为一款优秀的笔记本电脑了呢?
在许多方面,ZBook Studio提供了高于其售价的功能。例如高质量且稳固的机身。此外,尽管屏幕没能达到400 cd /m²的目标,作为ZBook Studio x360最便宜的选项已经很不错了。这块屏幕的一个真正缺点可能是其反光表面。另一方面,续航能力非常有说服力:Wi-Fi测试超过12小时已经是一个非常好的成绩了。外壳温度在负载下非常低,ZBook Studio x360可以通过两个RAM插槽和两个SSD插槽进行升级。最后值得一提的是,尽管我们的设备采用了恼人的AZERTY布局,但我们还是喜欢它的手感。
但是,惠普并没有做出一台完美的ZBook Studio x360;这台笔记本电脑也有一些缺点。在某些方面,它们也是ZBook的优势。例如,大电池和坚固的金属外壳导致机身重达2.4千克,这远远高于其竞品。特别是作平板使用时,负面影响很大。此外,ZBook Studio x360提供比翻转本竞品例如Dell Precision 5530二合一更高的CPU性能,但普通的Dell Precision 5530和联想ThinkPad P1在负载下提供更加持久,整体更高的性能。此外,竞品在无负载下更安静。我们确实喜欢ZBook Studio x360 G5的触摸板,但是驱动程序还有很多不足之处。
“高品质,高价格和高重量:HP ZBook Studio x360 G5是一台特立独行的翻转本工作站——但它肯定不是每个工作站用户的最佳选择。”
这些缺点不足以阻止我们推荐ZBook Studio x360 G5。总的来说,它是一台昂贵的笔记本,但也是一款高级笔记本,大多数用户都会对其带来的生产力的提升感到高兴,前提是没有更好的竞品。当然,Dell Precision 5530和联想ThinkPad P1是其强大的竞争对手,特别是如果不需要翻转功能的话。如果需要,HP ZBook Studio x360 G5几乎是唯一的选择。 只有Dell Precision 5530二合一提供了类似的功能组合——尽管两者之间的某些规格有很大差异。 ZBook拥有更多接口,更传统的键盘和更好的CPU性能。 Dell Precision则具有更高的GPU性能和更低的重量。哪台是更好的选择取决于买家自己
HP ZBook Studio x360 G5-4QH13EA
- 03/26/2020 v7 (old)
Benjamin Herzig
Price comparison

