谷歌Pixel 3智能手机评测
| Networking | |
| iperf3 transmit AX12 | |
| Google Pixel 3 | |
| Apple iPhone XS | |
| HTC U12 Plus | |
| Sony Xperia XZ3 | |
| Huawei P20 Pro | |
| iperf3 receive AX12 | |
| Google Pixel 3 | |
| Apple iPhone XS | |
| Huawei P20 Pro | |
| Sony Xperia XZ3 | |
| HTC U12 Plus | |


| |||||||||||||||||||||||||
Brightness Distribution: 91 %
Center on Battery: 393 cd/m²
Contrast: ∞:1 (Black: 0 cd/m²)
ΔE ColorChecker Calman: 1.4 | ∀{0.5-29.43 Ø4.71}
ΔE Greyscale Calman: 1.2 | ∀{0.09-98 Ø4.96}
99.6% sRGB (Calman 2D)
Gamma: 2.19
CCT: 6597 K
| Google Pixel 3 OLED, 2160x1080, 5.5" | Huawei P20 Pro OLED, 2240x1080, 6.1" | Apple iPhone XS OLED, 2436x1125, 5.8" | Sony Xperia XZ3 OLED, 2880x1440, 6" | HTC U12 Plus Super LCD 6, 2880x1440, 6" | |
|---|---|---|---|---|---|
| Screen | 14% | 14% | -155% | -7% | |
| Brightness middle (cd/m²) | 393 | 569 45% | 639 63% | 543 38% | 395 1% |
| Brightness (cd/m²) | 398 | 578 45% | 637 60% | 542 36% | 402 1% |
| Brightness Distribution (%) | 91 | 95 4% | 94 3% | 92 1% | 90 -1% |
| Black Level * (cd/m²) | 0.37 | ||||
| Colorchecker dE 2000 * | 1.4 | 1.3 7% | 1 29% | 6.6 -371% | 1.6 -14% |
| Colorchecker dE 2000 max. * | 2.5 | 2.1 16% | 2.2 12% | 11 -340% | 3.4 -36% |
| Greyscale dE 2000 * | 1.2 | 1.6 -33% | 2.2 -83% | 4.7 -292% | 1.1 8% |
| Gamma | 2.19 100% | 2.31 95% | 1.9 116% | 1.835 120% | 2.14 103% |
| CCT | 6597 99% | 6401 102% | 6364 102% | 6817 95% | 6536 99% |
| Contrast (:1) | 1068 |
* ... smaller is better
Screen Flickering / PWM (Pulse-Width Modulation)
| Screen flickering / PWM detected | 245.1 Hz | 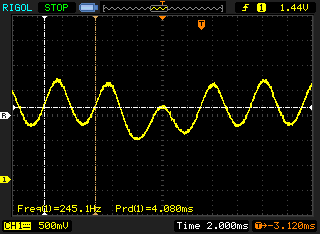 | |
The display backlight flickers at 245.1 Hz (worst case, e.g., utilizing PWM) . The frequency of 245.1 Hz is relatively low, so sensitive users will likely notice flickering and experience eyestrain at the stated brightness setting and below. In comparison: 52 % of all tested devices do not use PWM to dim the display. If PWM was detected, an average of 7754 (minimum: 5 - maximum: 343500) Hz was measured. | |||
Display Response Times
| ↔ Response Time Black to White | ||
|---|---|---|
| 4 ms ... rise ↗ and fall ↘ combined | ↗ 2 ms rise | 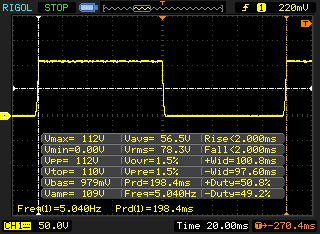 |
| ↘ 2 ms fall | ||
| The screen shows very fast response rates in our tests and should be very well suited for fast-paced gaming. In comparison, all tested devices range from 0.1 (minimum) to 240 (maximum) ms. » 16 % of all devices are better. This means that the measured response time is better than the average of all tested devices (19.8 ms). | ||
| ↔ Response Time 50% Grey to 80% Grey | ||
| 4.8 ms ... rise ↗ and fall ↘ combined | ↗ 2.8 ms rise | 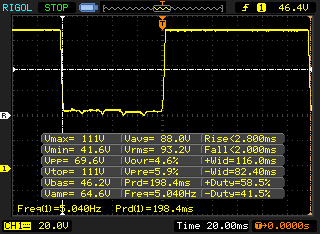 |
| ↘ 2 ms fall | ||
| The screen shows very fast response rates in our tests and should be very well suited for fast-paced gaming. In comparison, all tested devices range from 0.165 (minimum) to 636 (maximum) ms. » 17 % of all devices are better. This means that the measured response time is better than the average of all tested devices (31 ms). | ||
| PCMark for Android | |
| Work performance score (sort by value) | |
| Google Pixel 3 | |
| Huawei P20 Pro | |
| Sony Xperia XZ3 | |
| HTC U12 Plus | |
| Average Qualcomm Snapdragon 845 (7998 - 13211, n=26) | |
| Work 2.0 performance score (sort by value) | |
| Google Pixel 3 | |
| Huawei P20 Pro | |
| Sony Xperia XZ3 | |
| HTC U12 Plus | |
| Average Qualcomm Snapdragon 845 (7360 - 9868, n=27) | |
| GFXBench 3.0 | |
| on screen Manhattan Onscreen OGL (sort by value) | |
| Google Pixel 3 | |
| Huawei P20 Pro | |
| Apple iPhone XS | |
| Sony Xperia XZ3 | |
| HTC U12 Plus | |
| Average Qualcomm Snapdragon 845 (33 - 75, n=27) | |
| Average of class Smartphone (18 - 166, n=113, last 2 years) | |
| 1920x1080 1080p Manhattan Offscreen (sort by value) | |
| Google Pixel 3 | |
| Huawei P20 Pro | |
| Apple iPhone XS | |
| Sony Xperia XZ3 | |
| HTC U12 Plus | |
| Average Qualcomm Snapdragon 845 (54 - 83, n=27) | |
| Average of class Smartphone (14 - 606, n=112, last 2 years) | |
| GFXBench 3.1 | |
| on screen Manhattan ES 3.1 Onscreen (sort by value) | |
| Google Pixel 3 | |
| Huawei P20 Pro | |
| Apple iPhone XS | |
| Sony Xperia XZ3 | |
| HTC U12 Plus | |
| Average Qualcomm Snapdragon 845 (21 - 59, n=27) | |
| Average of class Smartphone (11 - 166, n=113, last 2 years) | |
| 1920x1080 Manhattan ES 3.1 Offscreen (sort by value) | |
| Google Pixel 3 | |
| Huawei P20 Pro | |
| Apple iPhone XS | |
| Sony Xperia XZ3 | |
| HTC U12 Plus | |
| Average Qualcomm Snapdragon 845 (32 - 61, n=28) | |
| Average of class Smartphone (8.6 - 413, n=112, last 2 years) | |
| AnTuTu v7 - Total Score (sort by value) | |
| Google Pixel 3 | |
| Huawei P20 Pro | |
| Apple iPhone XS | |
| Sony Xperia XZ3 | |
| HTC U12 Plus | |
| Average Qualcomm Snapdragon 845 (246366 - 299878, n=27) | |
| AnTuTu v6 - Total Score (sort by value) | |
| Google Pixel 3 | |
| Huawei P20 Pro | |
| Sony Xperia XZ3 | |
| HTC U12 Plus | |
| Average Qualcomm Snapdragon 845 (162183 - 242953, n=23) | |
| JetStream 1.1 - 1.1 Total | |
| Apple iPhone XS (Safari Mobile 12.0) | |
| Sony Xperia XZ3 (Chrome 70) | |
| HTC U12 Plus (Chrome 66) | |
| Google Pixel 3 (Chrome 70) | |
| Average Qualcomm Snapdragon 845 (22.5 - 90.9, n=25) | |
| Huawei P20 Pro (Chrome 65) | |
| Octane V2 - Total Score | |
| Average of class Smartphone (2800 - 126661, n=142, last 2 years) | |
| Apple iPhone XS (Safari Mobile 12.0) | |
| Sony Xperia XZ3 (Chrome 70) | |
| Google Pixel 3 (Chrome 70) | |
| HTC U12 Plus (Chrome 66) | |
| Average Qualcomm Snapdragon 845 (3991 - 18275, n=28) | |
| Huawei P20 Pro (Chrome 65) | |
| Mozilla Kraken 1.1 - Total | |
| Huawei P20 Pro (Chrome 65) | |
| Average Qualcomm Snapdragon 845 (2154 - 11204, n=28) | |
| HTC U12 Plus (Chrome 66) | |
| Google Pixel 3 (Chrome 70) | |
| Sony Xperia XZ3 (Chrome 70) | |
| Average of class Smartphone (257 - 28190, n=121, last 2 years) | |
| Apple iPhone XS (Safari Mobile 12.0) | |
| WebXPRT 3 - Overall | |
| Average of class Smartphone (104 - 380, n=12, last 2 years) | |
| Apple iPhone XS (Safari Mobile 12.0) | |
| HTC U12 Plus (Chrome 66) | |
| Google Pixel 3 (Chrome 70) | |
| Sony Xperia XZ3 (Chrome 70) | |
| Average Qualcomm Snapdragon 845 (19 - 103, n=17) | |
| Huawei P20 Pro (Chrome 65) | |
* ... smaller is better
| Google Pixel 3 | Huawei P20 Pro | Sony Xperia XZ3 | HTC U12 Plus | Average 64 GB UFS 2.1 Flash | Average of class Smartphone | |
|---|---|---|---|---|---|---|
| AndroBench 3-5 | 8% | -24% | -11% | -8% | 353% | |
| Sequential Read 256KB (MB/s) | 766 | 832 9% | 681 -11% | 709 -7% | 696 ? -9% | 2225 ? 190% |
| Sequential Write 256KB (MB/s) | 181.8 | 196.7 8% | 196.1 8% | 195.8 8% | 224 ? 23% | 1903 ? 947% |
| Random Read 4KB (MB/s) | 149.8 | 144.3 -4% | 135.7 -9% | 118.1 -21% | 137.2 ? -8% | 311 ? 108% |
| Random Write 4KB (MB/s) | 133.8 | 160.5 20% | 22.22 -83% | 104.2 -22% | 84.7 ? -37% | 358 ? 168% |
Arena of Valor
Asphalt 9: Legends
(+) The maximum temperature on the upper side is 35.4 °C / 96 F, compared to the average of 35.3 °C / 96 F, ranging from 21.9 to 247 °C for the class Smartphone.
(+) The bottom heats up to a maximum of 37 °C / 99 F, compared to the average of 34 °C / 93 F
(+) In idle usage, the average temperature for the upper side is 29.2 °C / 85 F, compared to the device average of 33 °C / 91 F.
Google Pixel 3 audio analysis
(+) | speakers can play relatively loud (84.9 dB)
Bass 100 - 315 Hz
(-) | nearly no bass - on average 22.3% lower than median
(±) | linearity of bass is average (13.8% delta to prev. frequency)
Mids 400 - 2000 Hz
(+) | balanced mids - only 4.1% away from median
(+) | mids are linear (3% delta to prev. frequency)
Highs 2 - 16 kHz
(+) | balanced highs - only 4.8% away from median
(+) | highs are linear (6.9% delta to prev. frequency)
Overall 100 - 16.000 Hz
(±) | linearity of overall sound is average (17.4% difference to median)
Compared to same class
» 13% of all tested devices in this class were better, 8% similar, 79% worse
» The best had a delta of 11%, average was 34%, worst was 134%
Compared to all devices tested
» 33% of all tested devices were better, 8% similar, 58% worse
» The best had a delta of 4%, average was 23%, worst was 134%
Apple iPhone XS audio analysis
(+) | speakers can play relatively loud (87.3 dB)
Bass 100 - 315 Hz
(-) | nearly no bass - on average 17.9% lower than median
(±) | linearity of bass is average (10.3% delta to prev. frequency)
Mids 400 - 2000 Hz
(±) | higher mids - on average 5.6% higher than median
(+) | mids are linear (5.5% delta to prev. frequency)
Highs 2 - 16 kHz
(±) | higher highs - on average 8.7% higher than median
(+) | highs are linear (3.7% delta to prev. frequency)
Overall 100 - 16.000 Hz
(±) | linearity of overall sound is average (19.7% difference to median)
Compared to same class
» 31% of all tested devices in this class were better, 8% similar, 61% worse
» The best had a delta of 11%, average was 34%, worst was 134%
Compared to all devices tested
» 50% of all tested devices were better, 7% similar, 43% worse
» The best had a delta of 4%, average was 23%, worst was 134%
| Off / Standby | |
| Idle | |
| Load |
|
Key:
min: | |
| Google Pixel 3 2915 mAh | Huawei P20 Pro 4000 mAh | Apple iPhone XS 2658 mAh | Sony Xperia XZ3 3300 mAh | HTC U12 Plus 3500 mAh | Average Qualcomm Snapdragon 845 | Average of class Smartphone | |
|---|---|---|---|---|---|---|---|
| Power Consumption | 38% | 25% | 22% | -10% | 3% | -5% | |
| Idle Minimum * (Watt) | 1.21 | 0.84 31% | 0.95 21% | 0.8 34% | 0.77 36% | 0.862 ? 29% | 0.887 ? 27% |
| Idle Average * (Watt) | 2.01 | 1.54 23% | 1.34 33% | 1.2 40% | 2.18 -8% | 1.728 ? 14% | 1.485 ? 26% |
| Idle Maximum * (Watt) | 2.05 | 1.57 23% | 1.48 28% | 1.5 27% | 2.21 -8% | 2.07 ? -1% | 1.672 ? 18% |
| Load Average * (Watt) | 4.06 | 2.47 39% | 4 1% | 4.8 -18% | 6.25 -54% | 4.87 ? -20% | 6.76 ? -67% |
| Load Maximum * (Watt) | 8.79 | 2.49 72% | 5.13 42% | 6.2 29% | 10.16 -16% | 9.27 ? -5% | 11.2 ? -27% |
* ... smaller is better
| Google Pixel 3 2915 mAh | Huawei P20 Pro 4000 mAh | Apple iPhone XS 2658 mAh | Sony Xperia XZ3 3300 mAh | HTC U12 Plus 3500 mAh | |
|---|---|---|---|---|---|
| Battery runtime | 52% | 20% | -9% | 5% | |
| Reader / Idle (h) | 22.9 | 28.8 26% | 24 5% | 21.2 -7% | 24.2 6% |
| H.264 (h) | 12.1 | 13.1 8% | 12.4 2% | 7 -42% | 7.7 -36% |
| WiFi v1.3 (h) | 7.9 | 12.4 57% | 9.5 20% | 7 -11% | 8.5 8% |
| Load (h) | 2.7 | 5.8 115% | 4.1 52% | 3.4 26% | 3.8 41% |
Pros
Cons
谷歌Pixel 3是一款坚固耐用的高端智能手机。它价格昂贵,我们认为它的设计有些过时,但其出色的后置摄像头,纯粹的安卓体验和前置式立体声扬声器令人印象深刻。 Active Edge也是一个有用的功能,虽然它自定义设置的缺乏限制了它的实用性并阻止它成为一个独特的卖点。
“Pixel 3做好了很多事情。然而,这台手机缺乏足够的功能来证明其近6000元的售价,特别是因为许多竞品多多少少都有这些功能。”
此外,该设备具有亮度较低的屏幕,并且其续航令人失望。我们希望谷歌将在未来的更新中改进这一点,因为它破坏了这台旗舰的整体表现。Pixel 3在并没有在我们的竞争中脱颖而出,但满足了大多数的事情。我们将Pixel 3推荐给那些想要花钱买到最纯粹的Android体验的买家,你得到的是最频繁的系统更新,领先的后置摄像头和优秀的扬声器。
Google Pixel 3
- 08/31/2022 v7 (old)
Mike Wobker
Price comparison

