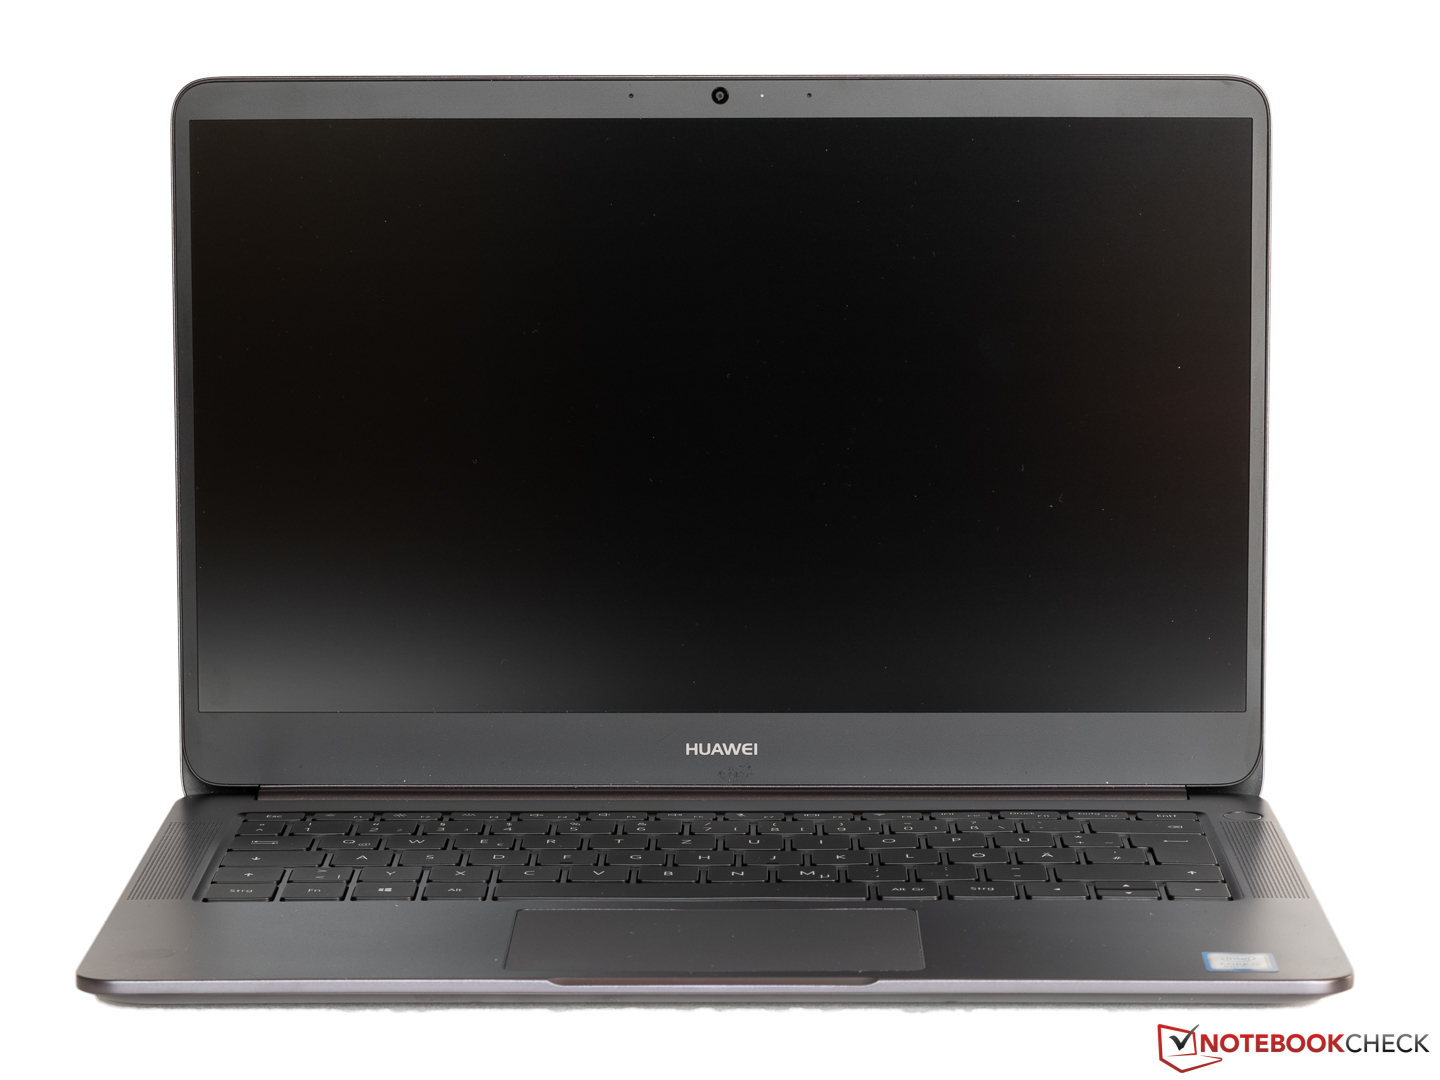
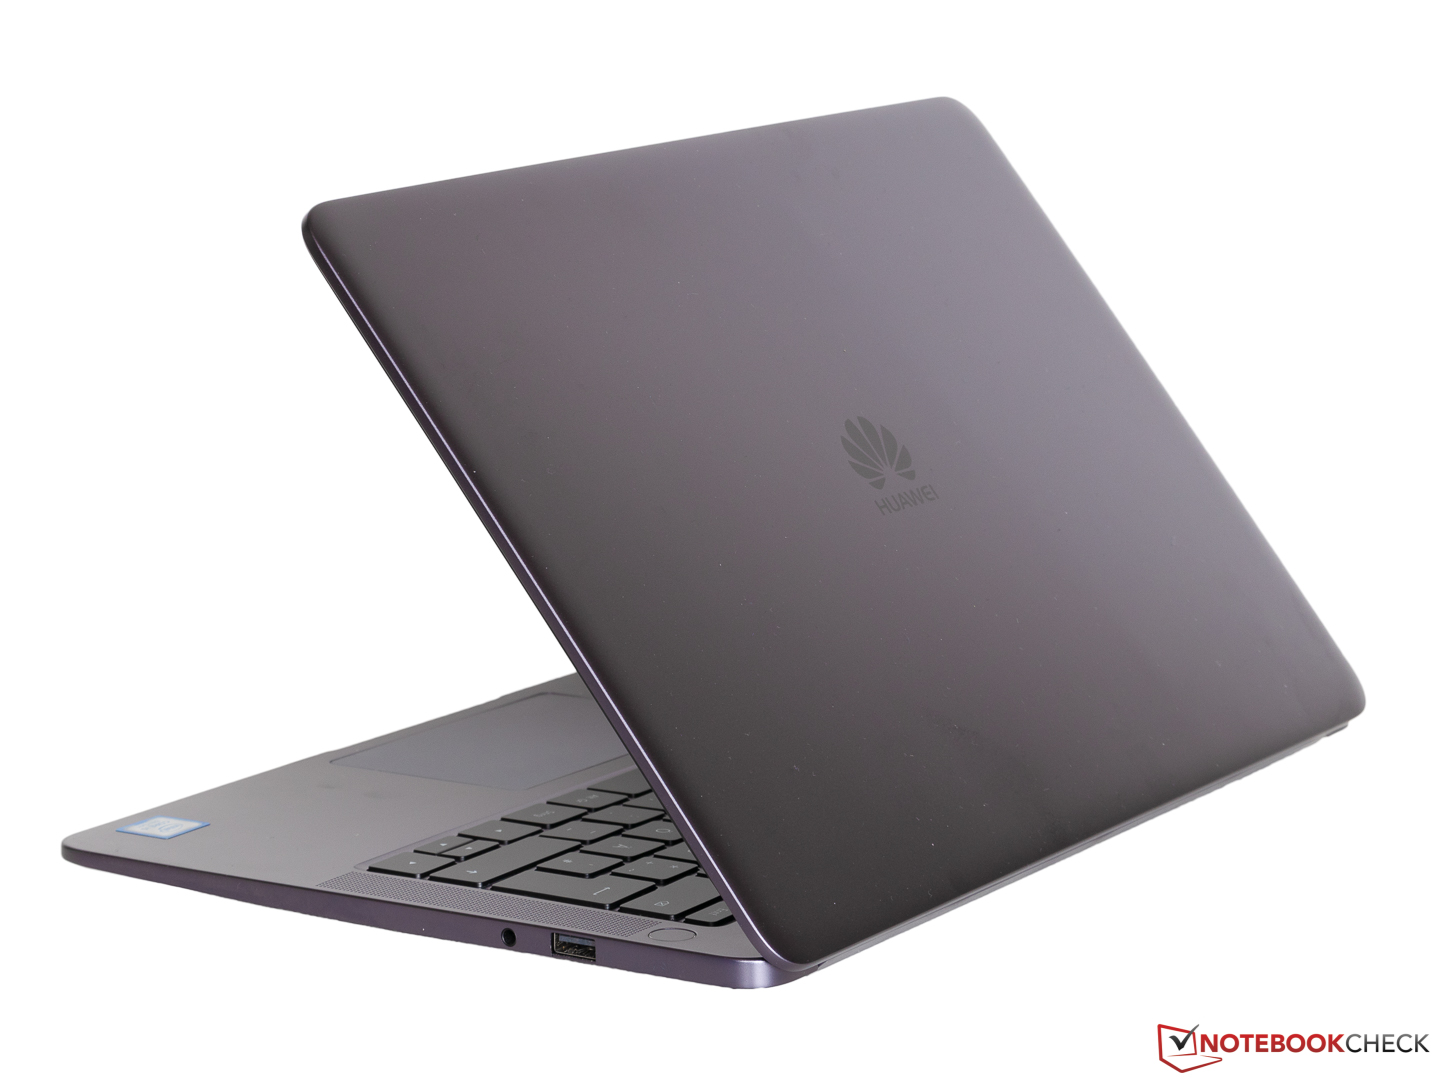
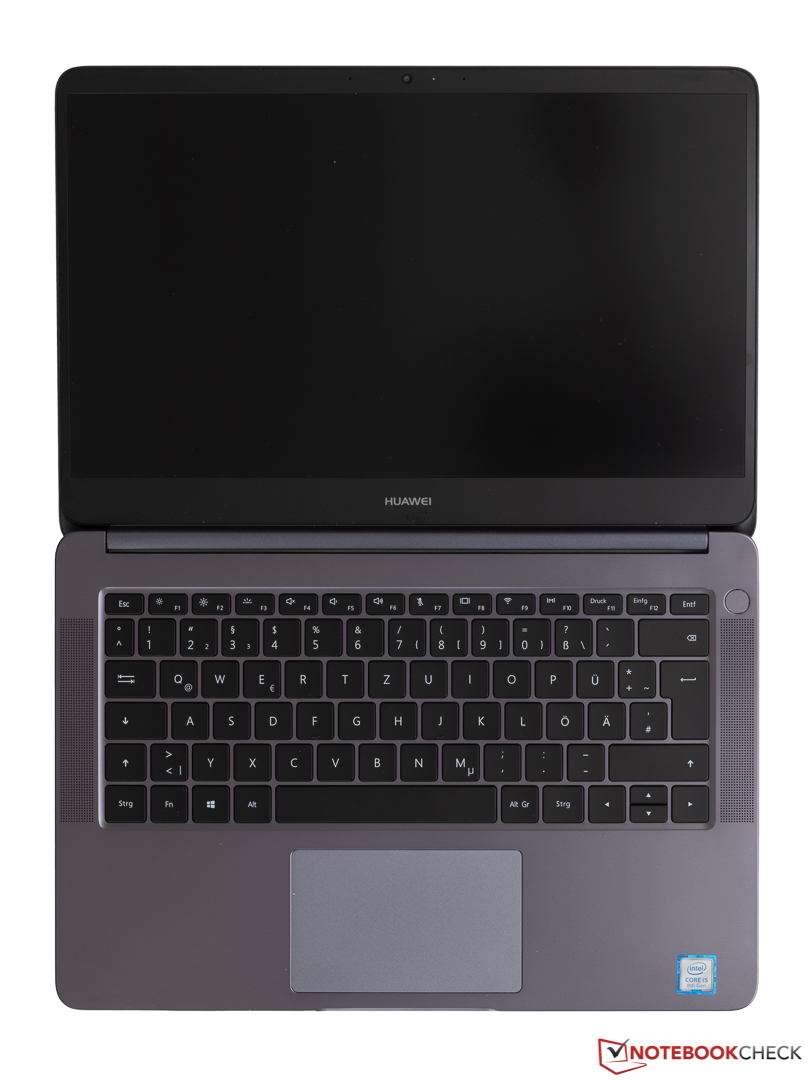
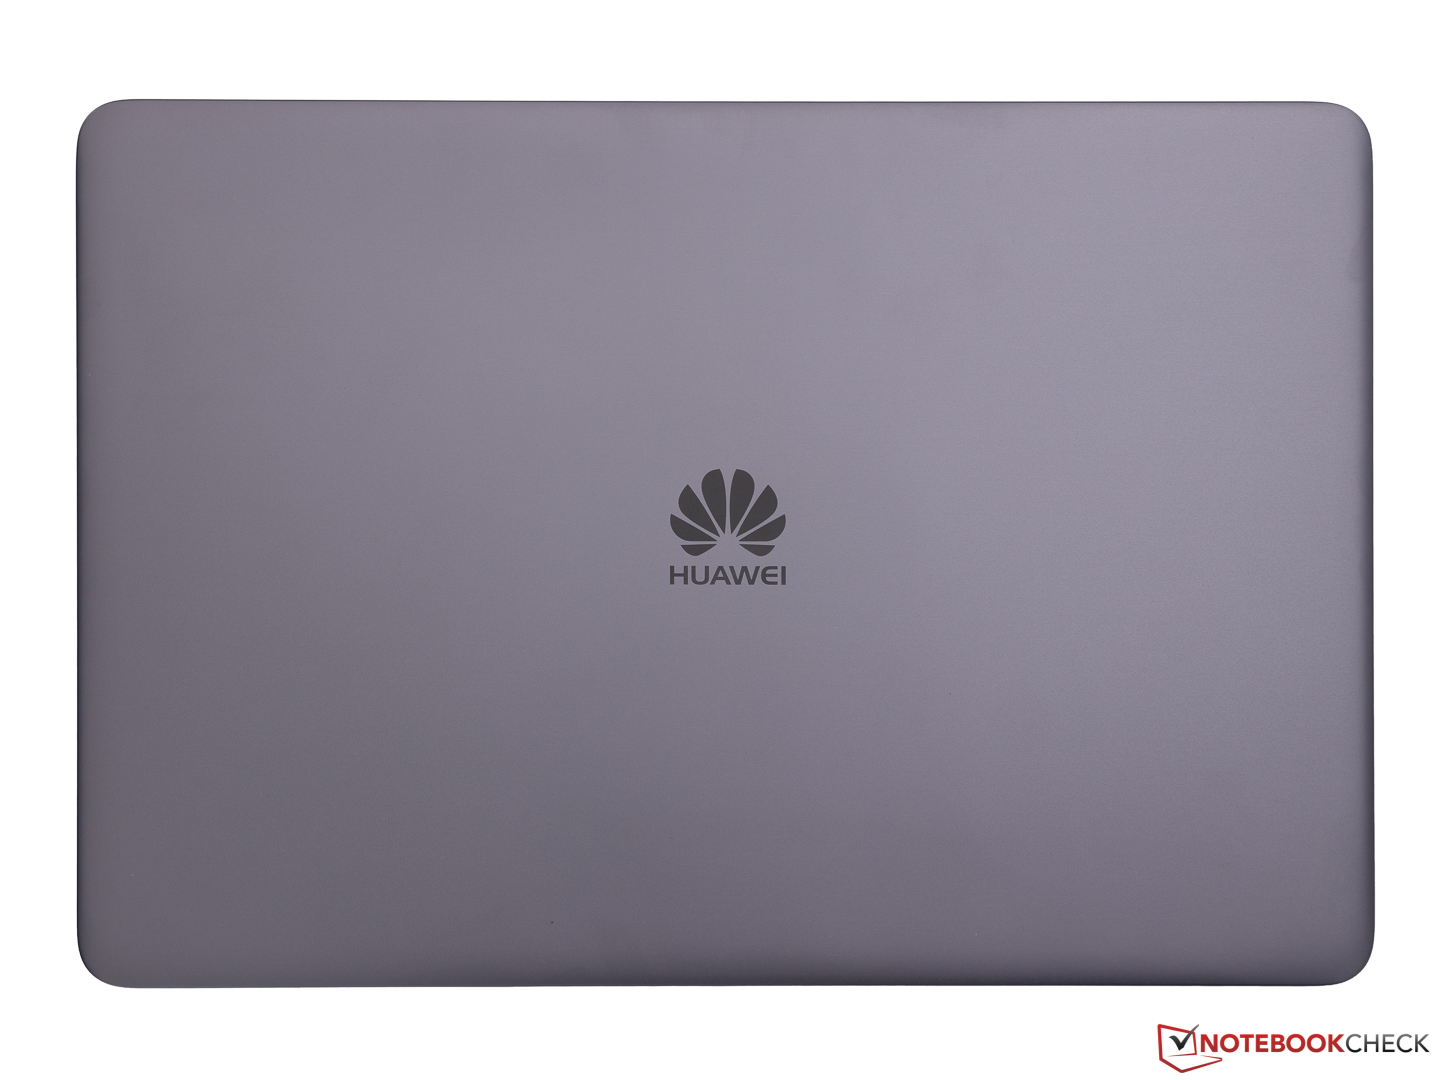
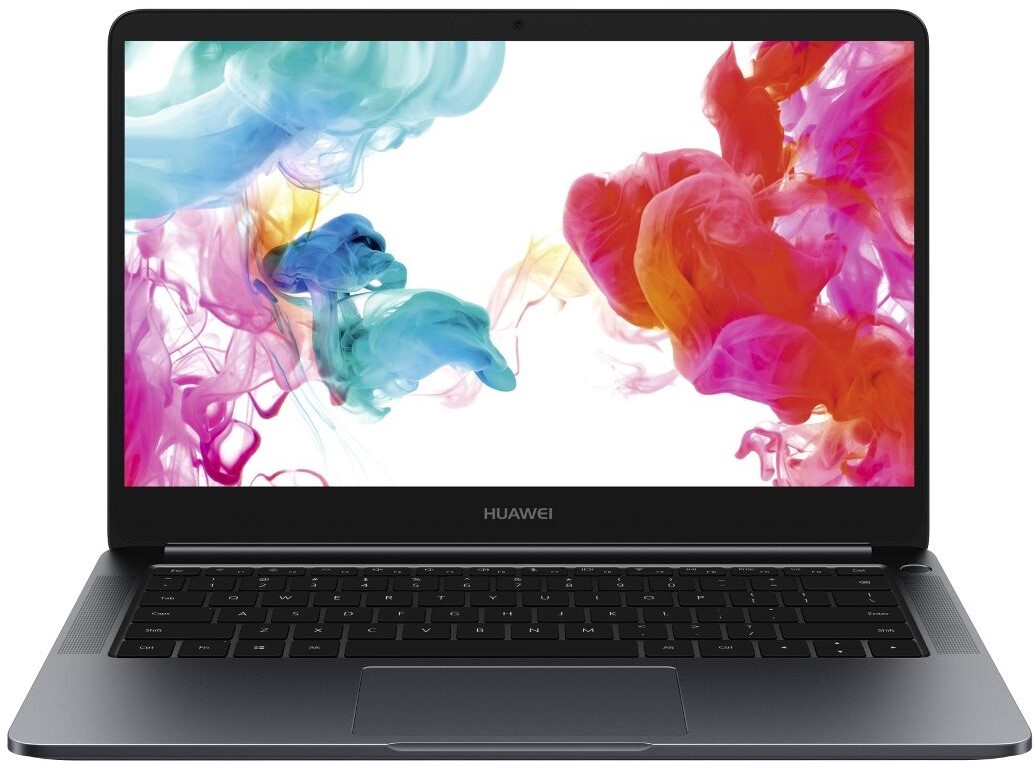
华为MateBook D 14 W00D (Ryzen 5, Vega 8) 笔记本电脑评测
| Networking | |
| iperf3 transmit AX12 | |
| Asus VivoBook 14 F412FJ-EB084T | |
| Acer Swift 3 SF314-55-31N8 | |
| Huawei MateBook D 14 W50F | |
| HP ProBook 445 G6 | |
| Huawei MateBook D 14 W00D-53010GXL | |
| Lenovo ThinkPad E485-20KU000NGE | |
| iperf3 receive AX12 | |
| Huawei MateBook D 14 W00D-53010GXL | |
| Acer Swift 3 SF314-55-31N8 | |
| Asus VivoBook 14 F412FJ-EB084T | |
| HP ProBook 445 G6 | |
| Huawei MateBook D 14 W50F | |
| Lenovo ThinkPad E485-20KU000NGE | |
| |||||||||||||||||||||||||
Brightness Distribution: 86 %
Center on Battery: 284 cd/m²
Contrast: 1148:1 (Black: 0.25 cd/m²)
ΔE ColorChecker Calman: 5.4 | ∀{0.5-29.43 Ø4.71}
calibrated: 5
ΔE Greyscale Calman: 3.1 | ∀{0.09-98 Ø4.96}
64.6% sRGB (Argyll 1.6.3 3D)
41.8% AdobeRGB 1998 (Argyll 1.6.3 3D)
45.73% AdobeRGB 1998 (Argyll 3D)
65.1% sRGB (Argyll 3D)
44.26% Display P3 (Argyll 3D)
Gamma: 1.99
CCT: 6769 K
| Huawei MateBook D 14 W00D-53010GXL BOE083C, , 1920x1080, 14" | HP ProBook 445 G6 Chi Mei CMN14D4, , 1920x1080, 14" | Asus VivoBook 14 F412FJ-EB084T AU Optronics AUO403D B140HAN04.0, , 1920x1080, 14" | Lenovo ThinkPad E485-20KU000NGE B140HAN04.2, , 1920x1080, 14" | Acer Swift 3 SF314-55-31N8 Chi Mei N140HCE-EN2, , 1920x1080, 14" | |
|---|---|---|---|---|---|
| Display | -6% | -9% | -12% | 50% | |
| Display P3 Coverage (%) | 44.26 | 41.53 -6% | 39.71 -10% | 39.21 -11% 38.48 -13% | 66.2 50% |
| sRGB Coverage (%) | 65.1 | 62 -5% | 59.6 -8% | 58.8 -10% 57.9 -11% | 98.3 51% |
| AdobeRGB 1998 Coverage (%) | 45.73 | 42.94 -6% | 41.04 -10% | 40.52 -11% 39.76 -13% | 67.8 48% |
| Response Times | 14% | 9% | -4% | 6% | |
| Response Time Grey 50% / Grey 80% * (ms) | 42.4 ? | 40 ? 6% | 40 ? 6% | 44.8 ? -6% | 41 ? 3% |
| Response Time Black / White * (ms) | 32.8 ? | 26 ? 21% | 29 ? 12% | 33.6 ? -2% | 30 ? 9% |
| PWM Frequency (Hz) | 198.4 ? | 208 ? | 25000 ? | ||
| Screen | 1% | 14% | 3% | 10% | |
| Brightness middle (cd/m²) | 287 | 200 -30% | 267 -7% | 289 1% | 291 1% |
| Brightness (cd/m²) | 276 | 196 -29% | 257 -7% | 271 -2% | 276 0% |
| Brightness Distribution (%) | 86 | 67 -22% | 91 6% | 87 1% | 90 5% |
| Black Level * (cd/m²) | 0.25 | 0.17 32% | 0.2 20% | 0.19 24% | 0.27 -8% |
| Contrast (:1) | 1148 | 1176 2% | 1335 16% | 1521 32% | 1078 -6% |
| Colorchecker dE 2000 * | 5.4 | 4.26 21% | 3.79 30% | 5.6 -4% | 3.86 29% |
| Colorchecker dE 2000 max. * | 18.1 | 9.7 46% | 8.18 55% | 20.8 -15% | 8.26 54% |
| Colorchecker dE 2000 calibrated * | 5 | 4.71 6% | 4.7 6% | ||
| Greyscale dE 2000 * | 3.1 | 3.15 -2% | 1.49 52% | 2.7 13% | 5.33 -72% |
| Gamma | 1.99 111% | 2.31 95% | 2.48 89% | 1.96 112% | 2.25 98% |
| CCT | 6769 96% | 6882 94% | 6659 98% | 6506 100% | 7426 88% |
| Color Space (Percent of AdobeRGB 1998) (%) | 41.8 | 40 -4% | 38 -9% | 37.2 -11% | 62 48% |
| Color Space (Percent of sRGB) (%) | 64.6 | 62 -4% | 59 -9% | 58.5 -9% | 98 52% |
| Total Average (Program / Settings) | 3% /
1% | 5% /
9% | -4% /
-2% | 22% /
18% |
* ... smaller is better
Display Response Times
| ↔ Response Time Black to White | ||
|---|---|---|
| 32.8 ms ... rise ↗ and fall ↘ combined | ↗ 18 ms rise | 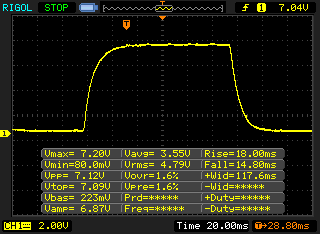 |
| ↘ 14.8 ms fall | ||
| The screen shows slow response rates in our tests and will be unsatisfactory for gamers. In comparison, all tested devices range from 0.1 (minimum) to 240 (maximum) ms. » 88 % of all devices are better. This means that the measured response time is worse than the average of all tested devices (19.8 ms). | ||
| ↔ Response Time 50% Grey to 80% Grey | ||
| 42.4 ms ... rise ↗ and fall ↘ combined | ↗ 22.8 ms rise | 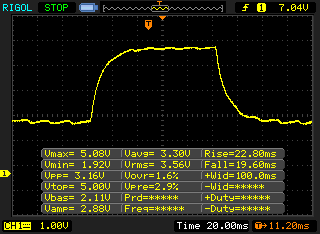 |
| ↘ 19.6 ms fall | ||
| The screen shows slow response rates in our tests and will be unsatisfactory for gamers. In comparison, all tested devices range from 0.165 (minimum) to 636 (maximum) ms. » 70 % of all devices are better. This means that the measured response time is worse than the average of all tested devices (31 ms). | ||
Screen Flickering / PWM (Pulse-Width Modulation)
| Screen flickering / PWM detected | 198.4 Hz | ≤ 99 % brightness setting | 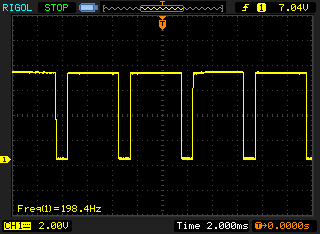 |
The display backlight flickers at 198.4 Hz (worst case, e.g., utilizing PWM) Flickering detected at a brightness setting of 99 % and below. There should be no flickering or PWM above this brightness setting. The frequency of 198.4 Hz is relatively low, so sensitive users will likely notice flickering and experience eyestrain at the stated brightness setting and below. In comparison: 52 % of all tested devices do not use PWM to dim the display. If PWM was detected, an average of 7754 (minimum: 5 - maximum: 343500) Hz was measured. | |||
| Cinebench R15 | |
| CPU Single 64Bit | |
| Average of class Office (99.5 - 316, n=77, last 2 years) | |
| Asus VivoBook 14 F412FJ-EB084T | |
| Acer Swift 3 SF314-55-31N8 | |
| Huawei MateBook D 14 W50F | |
| Lenovo ThinkPad E485-20KU000NGE | |
| Huawei MateBook D 14 W00D-53010GXL | |
| Average AMD Ryzen 5 2500U (124 - 142, n=15) | |
| HP ProBook 445 G6 | |
| CPU Multi 64Bit | |
| Average of class Office (250 - 3380, n=77, last 2 years) | |
| Asus VivoBook 14 F412FJ-EB084T | |
| Lenovo ThinkPad E485-20KU000NGE | |
| Huawei MateBook D 14 W00D-53010GXL | |
| HP ProBook 445 G6 | |
| Average AMD Ryzen 5 2500U (510 - 642, n=16) | |
| Huawei MateBook D 14 W50F | |
| Acer Swift 3 SF314-55-31N8 | |
| PCMark 8 | |
| Home Score Accelerated v2 | |
| Average of class Office (n=1last 2 years) | |
| Lenovo ThinkPad E485-20KU000NGE | |
| Huawei MateBook D 14 W00D-53010GXL | |
| Average AMD Ryzen 5 2500U, AMD Radeon RX Vega 8 (Ryzen 2000/3000) (3049 - 3550, n=14) | |
| Acer Swift 3 SF314-55-31N8 | |
| HP ProBook 445 G6 | |
| Work Score Accelerated v2 | |
| Average of class Office (n=1last 2 years) | |
| Lenovo ThinkPad E485-20KU000NGE | |
| Acer Swift 3 SF314-55-31N8 | |
| Huawei MateBook D 14 W00D-53010GXL | |
| HP ProBook 445 G6 | |
| Average AMD Ryzen 5 2500U, AMD Radeon RX Vega 8 (Ryzen 2000/3000) (3437 - 4870, n=11) | |
| PCMark 8 Home Score Accelerated v2 | 3420 points | |
| PCMark 8 Work Score Accelerated v2 | 4420 points | |
| PCMark 10 Score | 3534 points | |
Help | ||
| Huawei MateBook D 14 W00D-53010GXL SK Hynix SC313 HFS256G39TNF | HP ProBook 445 G6 SK Hynix BC501 NVMe 256 GB | Asus VivoBook 14 F412FJ-EB084T Kingston RBU-SNS8180DS3512GJ | Lenovo ThinkPad E485-20KU000NGE Samsung PM961 MZVLW256HEHP | Acer Swift 3 SF314-55-31N8 Kingston RBUSNS8154P3128GJ | Huawei MateBook D 14 W50F SanDisk SD9SN8W256G1027 | Average SK Hynix SC313 HFS256G39TNF | |
|---|---|---|---|---|---|---|---|
| CrystalDiskMark 5.2 / 6 | 78% | -19% | 128% | 45% | -2% | -2% | |
| Write 4K (MB/s) | 72.3 | 110.4 53% | 55 -24% | 72.2 0% | 96.8 34% | 60.5 -16% | 71.3 ? -1% |
| Read 4K (MB/s) | 30.77 | 39.46 28% | 28.79 -6% | 35.25 15% | 36.99 20% | 21.63 -30% | 25.3 ? -18% |
| Write Seq (MB/s) | 468.1 | 808 73% | 307.5 -34% | 1412 202% | 463.1 -1% | 450.9 -4% | 473 ? 1% |
| Read Seq (MB/s) | 518 | 1130 118% | 430 -17% | 1523 194% | 794 53% | 482.3 -7% | 517 ? 0% |
| Write 4K Q32T1 (MB/s) | 214.2 | 260.8 22% | 149.5 -30% | 102.1 -52% | 291.7 36% | 248.9 16% | 209 ? -2% |
| Read 4K Q32T1 (MB/s) | 241.1 | 308 28% | 207.2 -14% | 170.9 -29% | 352 46% | 267.6 11% | 234 ? -3% |
| Write Seq Q32T1 (MB/s) | 482 | 816 69% | 389.2 -19% | 1429 196% | 468.1 -3% | 534 11% | 494 ? 2% |
| Read Seq Q32T1 (MB/s) | 537 | 1783 232% | 497.1 -7% | 3204 497% | 1489 177% | 563 5% | 552 ? 3% |
| AS SSD | 110% | -66% | 162% | 66% | -2% | 16% | |
| Seq Read (MB/s) | 500 | 1546 209% | 487.6 -2% | 2030 306% | 1201 140% | 458.3 -8% | 499 ? 0% |
| Seq Write (MB/s) | 457.9 | 708 55% | 392.7 -14% | 1395 205% | 434.5 -5% | 268.6 -41% | 474 ? 4% |
| 4K Read (MB/s) | 25.12 | 34.12 36% | 36.4 45% | 38.63 54% | 40.9 63% | 26.87 7% | 28.6 ? 14% |
| 4K Write (MB/s) | 51.7 | 76.7 48% | 26.46 -49% | 63.9 24% | 90 74% | 51.7 0% | 60.7 ? 17% |
| 4K-64 Read (MB/s) | 220.7 | 528 139% | 325.4 47% | 1035 369% | 425.5 93% | 364.2 65% | 298 ? 35% |
| 4K-64 Write (MB/s) | 195.6 | 588 201% | 87.2 -55% | 371.5 90% | 390.9 100% | 137.3 -30% | 233 ? 19% |
| Access Time Read * (ms) | 0.135 | 0.062 54% | 0.432 -220% | 0.054 60% | 0.184 -36% | 0.092 32% | 0.1193 ? 12% |
| Access Time Write * (ms) | 0.07 | 0.048 31% | 0.4 -471% | 0.059 16% | 0.048 31% | 0.13 -86% | 0.06033 ? 14% |
| Score Read (Points) | 296 | 717 142% | 411 39% | 1277 331% | 586 98% | 437 48% | 376 ? 27% |
| Score Write (Points) | 293 | 735 151% | 153 -48% | 575 96% | 524 79% | 216 -26% | 341 ? 16% |
| Score Total (Points) | 747 | 1785 139% | 782 5% | 2478 232% | 1386 86% | 875 17% | 918 ? 23% |
| Copy ISO MB/s (MB/s) | 576 | 310.1 | 514 ? | ||||
| Copy Program MB/s (MB/s) | 159.8 | 88.4 | 259 ? | ||||
| Copy Game MB/s (MB/s) | 330.8 | 166.4 | 521 ? | ||||
| Total Average (Program / Settings) | 94% /
96% | -43% /
-46% | 145% /
148% | 56% /
57% | -2% /
-2% | 7% /
9% |
* ... smaller is better

| 3DMark 11 - 1280x720 Performance GPU | |
| Average of class Office (2551 - 18313, n=72, last 2 years) | |
| Huawei MateBook D 14 W00D-53010GXL | |
| Average AMD Radeon RX Vega 8 (Ryzen 2000/3000) (1668 - 4317, n=44) | |
| Asus VivoBook 14 F412FJ-EB084T | |
| HP ProBook 445 G6 | |
| Lenovo ThinkPad E485-20KU000NGE | |
| Huawei MateBook D 14 W50F | |
| Acer Swift 3 SF314-55-31N8 | |
| 3DMark | |
| 1280x720 Cloud Gate Standard Graphics | |
| Average of class Office (11640 - 118515, n=38, last 2 years) | |
| Huawei MateBook D 14 W00D-53010GXL | |
| Average AMD Radeon RX Vega 8 (Ryzen 2000/3000) (7309 - 19399, n=37) | |
| Asus VivoBook 14 F412FJ-EB084T | |
| HP ProBook 445 G6 | |
| Lenovo ThinkPad E485-20KU000NGE | |
| Huawei MateBook D 14 W50F | |
| Acer Swift 3 SF314-55-31N8 | |
| 1920x1080 Fire Strike Graphics | |
| Average of class Office (736 - 21871, n=75, last 2 years) | |
| Huawei MateBook D 14 W00D-53010GXL | |
| Asus VivoBook 14 F412FJ-EB084T | |
| Average AMD Radeon RX Vega 8 (Ryzen 2000/3000) (1095 - 2901, n=41) | |
| HP ProBook 445 G6 | |
| Lenovo ThinkPad E485-20KU000NGE | |
| Huawei MateBook D 14 W50F | |
| Acer Swift 3 SF314-55-31N8 | |
| 2560x1440 Time Spy Graphics | |
| Average of class Office (493 - 6679, n=70, last 2 years) | |
| Asus VivoBook 14 F412FJ-EB084T | |
| Average AMD Radeon RX Vega 8 (Ryzen 2000/3000) (523 - 790, n=23) | |
| HP ProBook 445 G6 | |
| 3DMark 11 Performance | 3682 points | |
| 3DMark Cloud Gate Standard Score | 8316 points | |
| 3DMark Fire Strike Score | 2184 points | |
Help | ||
| BioShock Infinite - 1920x1080 Ultra Preset, DX11 (DDOF) | |
| Asus VivoBook 14 F412FJ-EB084T | |
| Huawei MateBook D 14 W00D-53010GXL | |
| Average AMD Radeon RX Vega 8 (Ryzen 2000/3000) (7.6 - 28, n=30) | |
| HP ProBook 445 G6 | |
| Lenovo ThinkPad E485-20KU000NGE | |
| Huawei MateBook D 14 W50F | |
| Acer Swift 3 SF314-55-31N8 | |
| low | med. | high | ultra | |
|---|---|---|---|---|
| BioShock Infinite (2013) | 19.84 | |||
| The Witcher 3 (2015) | 28.98 | 16.37 | ||
| Dota 2 Reborn (2015) | 69 | 60 | 34.8 | 32.6 |
| X-Plane 11.11 (2018) | 26.5 | 19.4 | 18.2 | |
| F1 2019 (2019) | 47.1 | 19.8 | 18.4 | 12 |
Noise level
| Idle |
| 29.5 / 29.5 / 30.4 dB(A) |
| Load |
| 31.5 / 33.5 dB(A) |
 | ||
30 dB silent 40 dB(A) audible 50 dB(A) loud |
||
min: | ||
(±) The maximum temperature on the upper side is 44.3 °C / 112 F, compared to the average of 34.3 °C / 94 F, ranging from 21.2 to 62.5 °C for the class Office.
(±) The bottom heats up to a maximum of 45 °C / 113 F, compared to the average of 36.8 °C / 98 F
(+) In idle usage, the average temperature for the upper side is 22.9 °C / 73 F, compared to the device average of 29.5 °C / 85 F.
(+) The palmrests and touchpad are cooler than skin temperature with a maximum of 31.8 °C / 89.2 F and are therefore cool to the touch.
(-) The average temperature of the palmrest area of similar devices was 27.5 °C / 81.5 F (-4.3 °C / -7.7 F).
Huawei MateBook D 14 W00D-53010GXL audio analysis
(±) | speaker loudness is average but good (74 dB)
Bass 100 - 315 Hz
(-) | nearly no bass - on average 17.2% lower than median
(±) | linearity of bass is average (10.7% delta to prev. frequency)
Mids 400 - 2000 Hz
(+) | balanced mids - only 4.8% away from median
(±) | linearity of mids is average (10.2% delta to prev. frequency)
Highs 2 - 16 kHz
(±) | higher highs - on average 5.1% higher than median
(±) | linearity of highs is average (11% delta to prev. frequency)
Overall 100 - 16.000 Hz
(±) | linearity of overall sound is average (24.5% difference to median)
Compared to same class
» 71% of all tested devices in this class were better, 8% similar, 21% worse
» The best had a delta of 7%, average was 21%, worst was 53%
Compared to all devices tested
» 74% of all tested devices were better, 6% similar, 20% worse
» The best had a delta of 4%, average was 23%, worst was 134%
Apple MacBook 12 (Early 2016) 1.1 GHz audio analysis
(+) | speakers can play relatively loud (83.6 dB)
Bass 100 - 315 Hz
(±) | reduced bass - on average 11.3% lower than median
(±) | linearity of bass is average (14.2% delta to prev. frequency)
Mids 400 - 2000 Hz
(+) | balanced mids - only 2.4% away from median
(+) | mids are linear (5.5% delta to prev. frequency)
Highs 2 - 16 kHz
(+) | balanced highs - only 2% away from median
(+) | highs are linear (4.5% delta to prev. frequency)
Overall 100 - 16.000 Hz
(+) | overall sound is linear (10.2% difference to median)
Compared to same class
» 7% of all tested devices in this class were better, 2% similar, 90% worse
» The best had a delta of 5%, average was 18%, worst was 53%
Compared to all devices tested
» 5% of all tested devices were better, 1% similar, 94% worse
» The best had a delta of 4%, average was 23%, worst was 134%
| Off / Standby | |
| Idle | |
| Load |
|
Key:
min: | |
| Huawei MateBook D 14 W00D-53010GXL R5 2500U, Vega 8, SK Hynix SC313 HFS256G39TNF, IPS, 1920x1080, 14" | HP ProBook 445 G6 R5 2500U, Vega 8, SK Hynix BC501 NVMe 256 GB, IPS, 1920x1080, 14" | Asus VivoBook 14 F412FJ-EB084T i5-8265U, GeForce MX230, Kingston RBU-SNS8180DS3512GJ, IPS, 1920x1080, 14" | Lenovo ThinkPad E485-20KU000NGE R5 2500U, Vega 8, Samsung PM961 MZVLW256HEHP, IPS, 1920x1080, 14" | Acer Swift 3 SF314-55-31N8 i3-8145U, UHD Graphics 620, Kingston RBUSNS8154P3128GJ, IPS, 1920x1080, 14" | Huawei MateBook D 14 W50F i5-8250U, UHD Graphics 620, SanDisk SD9SN8W256G1027, IPS, 1920x1080, 14" | Average AMD Radeon RX Vega 8 (Ryzen 2000/3000) | Average of class Office | |
|---|---|---|---|---|---|---|---|---|
| Power Consumption | 6% | 2% | -7% | 30% | 18% | -7% | -5% | |
| Idle Minimum * (Watt) | 5.3 | 4.8 9% | 3.7 30% | 6.2 -17% | 2.9 45% | 3.7 30% | 5.68 ? -7% | 4.26 ? 20% |
| Idle Average * (Watt) | 7.8 | 6.9 12% | 6.1 22% | 8.6 -10% | 5.6 28% | 6.9 12% | 8.75 ? -12% | 7.31 ? 6% |
| Idle Maximum * (Watt) | 8.46 | 9.8 -16% | 8.3 2% | 9.7 -15% | 6.1 28% | 8.4 1% | 10.1 ? -19% | 8.55 ? -1% |
| Load Average * (Watt) | 36.9 | 35 5% | 43 -17% | 37.4 -1% | 29 21% | 32 13% | 37.8 ? -2% | 43.8 ? -19% |
| Load Maximum * (Watt) | 49.4 | 39.7 20% | 61.6 -25% | 44.8 9% | 35.3 29% | 32.6 34% | 46.2 ? 6% | 64.5 ? -31% |
* ... smaller is better
| Huawei MateBook D 14 W00D-53010GXL R5 2500U, Vega 8, 57.4 Wh | HP ProBook 445 G6 R5 2500U, Vega 8, 45 Wh | Asus VivoBook 14 F412FJ-EB084T i5-8265U, GeForce MX230, 37 Wh | Lenovo ThinkPad E485-20KU000NGE R5 2500U, Vega 8, 45 Wh | Acer Swift 3 SF314-55-31N8 i3-8145U, UHD Graphics 620, 50.7 Wh | Huawei MateBook D 14 W50F i5-8250U, UHD Graphics 620, 57 Wh | Average of class Office | |
|---|---|---|---|---|---|---|---|
| Battery runtime | -28% | -39% | -42% | 13% | 21% | 27% | |
| Reader / Idle (h) | 19 | 10.4 -45% | 9.1 -52% | 23.6 24% | 24.5 ? 29% | ||
| WiFi v1.3 (h) | 9 | 5.9 -34% | 5.5 -39% | 5.4 -40% | 10.2 13% | 10 11% | 13.2 ? 47% |
| Load (h) | 1.7 | 1.6 -6% | 1.1 -35% | 2.2 29% | 1.808 ? 6% |
Pros
Cons
Verdict - A good performance with a mediocre display
虽然大多数其他制造商在使用AMD处理器时并不能提供最好的性能,但华为在MateBook D的超薄笔记本电脑中展示了AMD技术的良好实施。性能高于同定位英特尔型号,并且只有续航时间略差。然而,两种设备之间的价格差异是一个很大的优势,因为我们在这里测试的带有AMD CPU的笔记本电脑的售价比配备较弱的Intel CPU的型号低300欧元(国内差价仅为700元,i5版Magicbook)。
华为MateBook D通过使用AMD处理器提供了更高的性能,但也继承了英特尔版本中已有的弱点。
之前列出的关于屏幕和接口的负面观点基本上和英特尔版一样,这也阻止了这台华为笔记本电脑获得更高的评价。总的来说,这台轻薄的设备在任何办公室环境都很搭,并且还能够满足这种环境对笔记本电脑性能的要求。
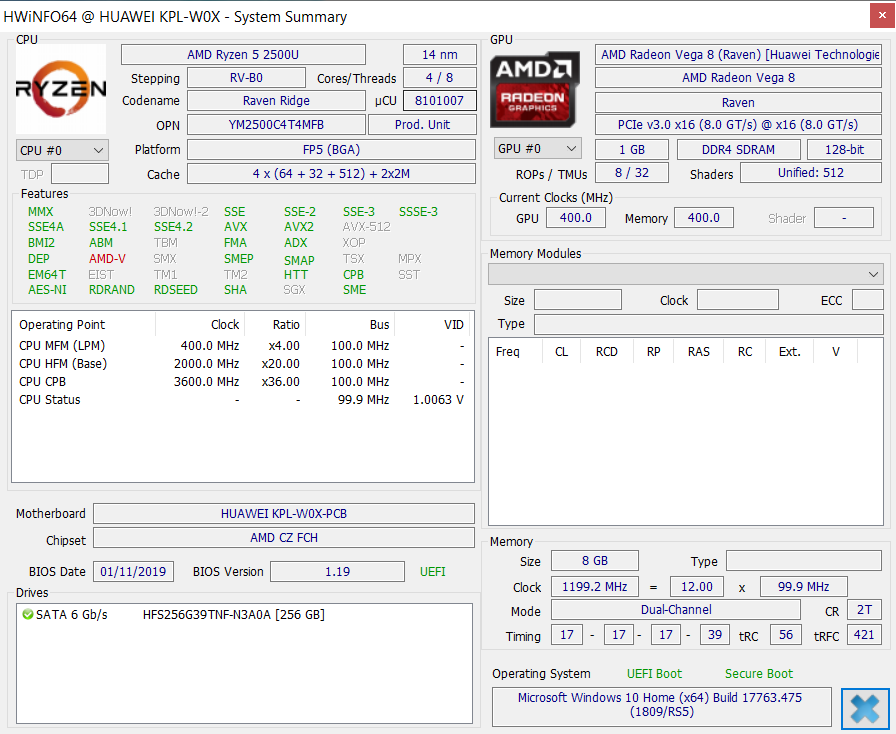
Huawei MateBook D 14 W00D-53010GXL
- 10/29/2019 v7 (old)
Mike Wobker
Price comparison

