Geo Computers GeoFlex 140二合一笔记本电脑测试中。价值约160美元的敞篷车

Geo Computers与Chillblast、Nazare和Horizon等品牌一样,属于英国Tactus集团。在游戏玩家圈子里,这三个品牌以带水冷的极端台式电脑和强大的笔记本电脑而闻名。Geo更多的是针对对PC要求不高的终端客户,但也可以在2021年的年度合作伙伴OEM设备奖中说服微软。
GeoFlex 140是一款不寻常的笔记本电脑,不是因为它特别强大,而是因为它非常便宜。在总理日、网络星期一和其他场合,像Notebooksbilliger这样的零售商有时只提供150欧元(约163美元)的设备。我们在黑色星期期间以这个价格从Notebooksbilliger购买了评测样品。仅仅是Windows和微软365的许可证,你就可以得到这台笔记本电脑,这比笔记本电脑在微软的价格216欧元(约235美元)要高。这让我们不禁要问:"你怎么能提供这么便宜的笔记本电脑?"
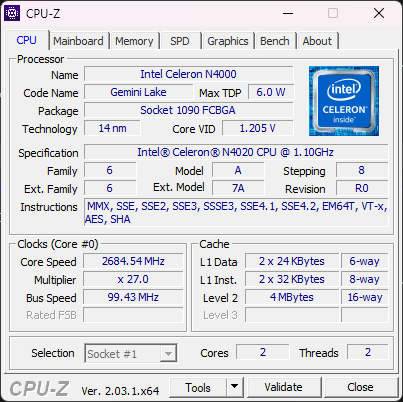
不出所料,答案是GeoFlex 140依靠的是廉价的硬件。因此,一个廉价的英特尔赛扬N4020 ,4GB内存和一个只有128GB的M.2 SATA固态硬盘在设备中。有了这个要求不高的处理器,Geo Computers甚至可以依靠一个纯粹的被动解决方案来进行散热。制造商还为屏幕和其他外围设备选择了最有利的方案。尽管如此,你得到的是一台可以毫无问题地处理大多数日常应用(办公、流媒体、浏览)的可转换设备。然而,你应该不需要多任务处理。
在选择可能的竞争对手时,我们将自己限制在最便宜的设备上,在我们的数据库中仍然找不到目前可以低于200欧元(约218美元)的新设备的笔记本电脑。在我们的顶级列表中 600欧元(约合人民币652元)以下的最佳笔记本电脑中然而,有一些笔记本电脑至少可以低于300欧元(约合人民币326元)。
潜在的竞争对手比较
Rating | Date | Model | Weight | Height | Size | Resolution | Price |
|---|---|---|---|---|---|---|---|
| 76.1 % v7 (old) | 01 / 2023 | Geo Computers GeoFlex 140 Celeron N4020, UHD Graphics 600 | 2 kg | 21 mm | 14.10" | 1366x768 | |
| 74.9 % v7 (old) | 06 / 2021 | Asus BR1100FKA-BP0109RA Celeron N4500, UHD Graphics (Jasper Lake 16 EU) | 1.4 kg | 19.9 mm | 11.60" | 1366x768 | |
| 78.1 % v7 (old) | 02 / 2021 | Lenovo IdeaPad Flex 3 11IGL05 Celeron N4020, UHD Graphics 600 | 1.1 kg | 17.5 mm | 11.60" | 1366x768 | |
| 69.1 % v7 (old) | Chuwi Hi10 X Celeron N4100, UHD Graphics 600 | 600 g | 8.8 mm | 10.10" | 1920x1200 | ||
| 74.9 % v7 (old) | BMAX MaxBook Y11 H1M6 Celeron N4100, UHD Graphics 600 | 1 kg | 14.4 mm | 11.60" | 1920x1080 | ||
| 74.2 % v7 (old) | 12 / 2019 | XIDU PhilBook Max Celeron J3355, HD Graphics 500 | 1.5 kg | 17.8 mm | 14.10" | 1920x1080 | |
| 73.1 % v7 (old) | 12 / 2020 | Asus Vivobook 15 F512DA-SH31 R3 3200U, Vega 3 | 1.8 kg | 19.9 mm | 15.60" | 1920x1080 |
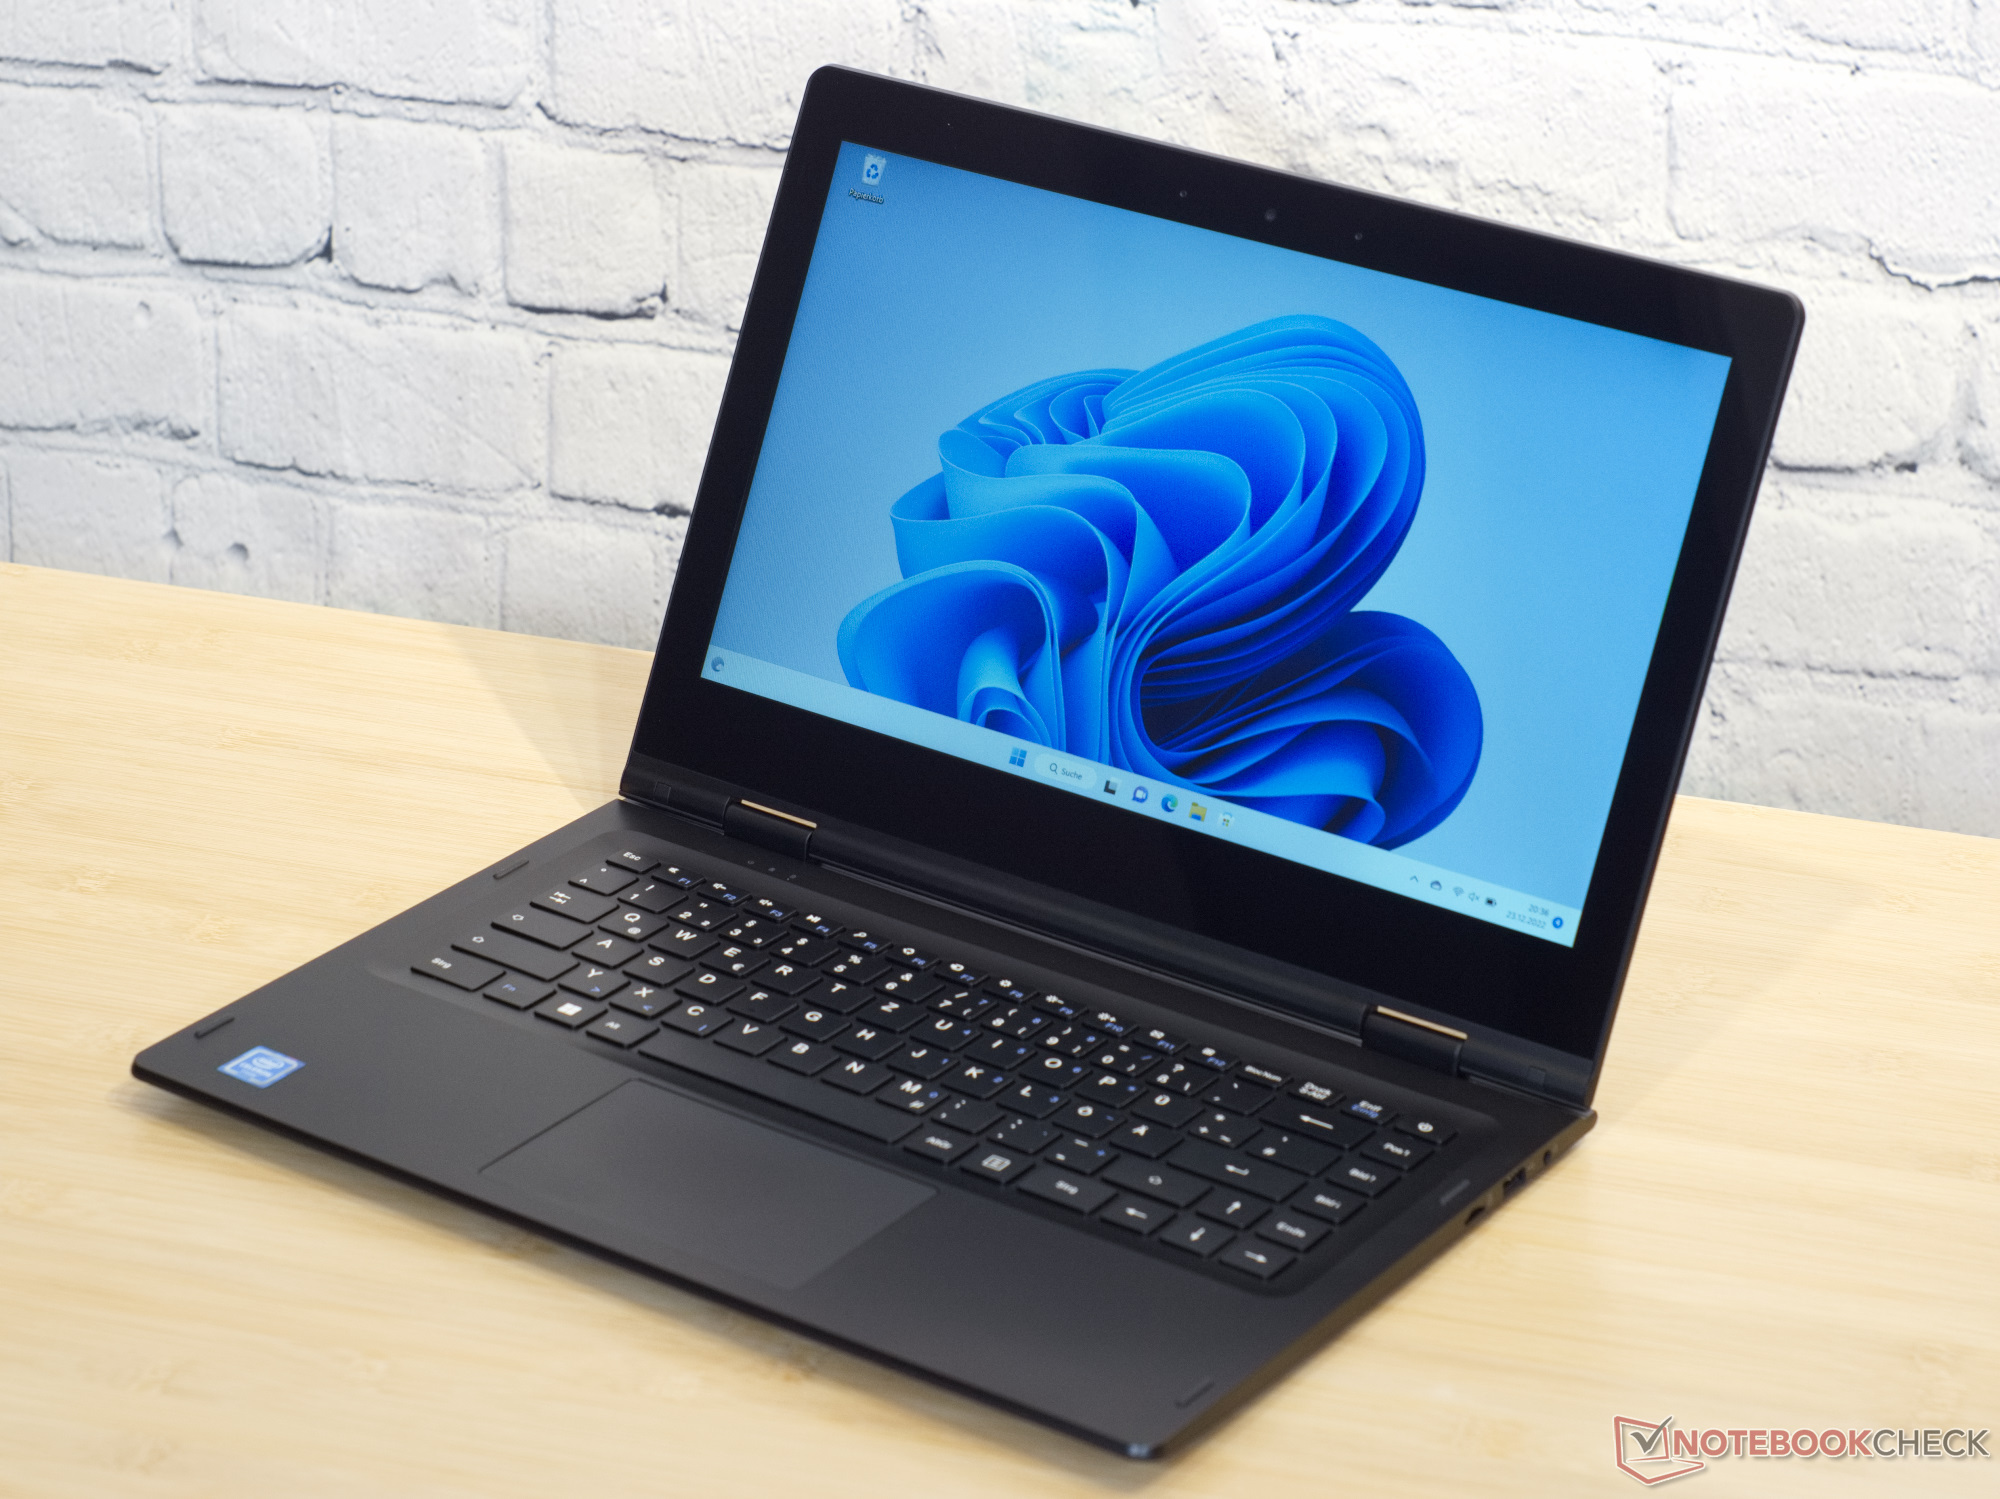
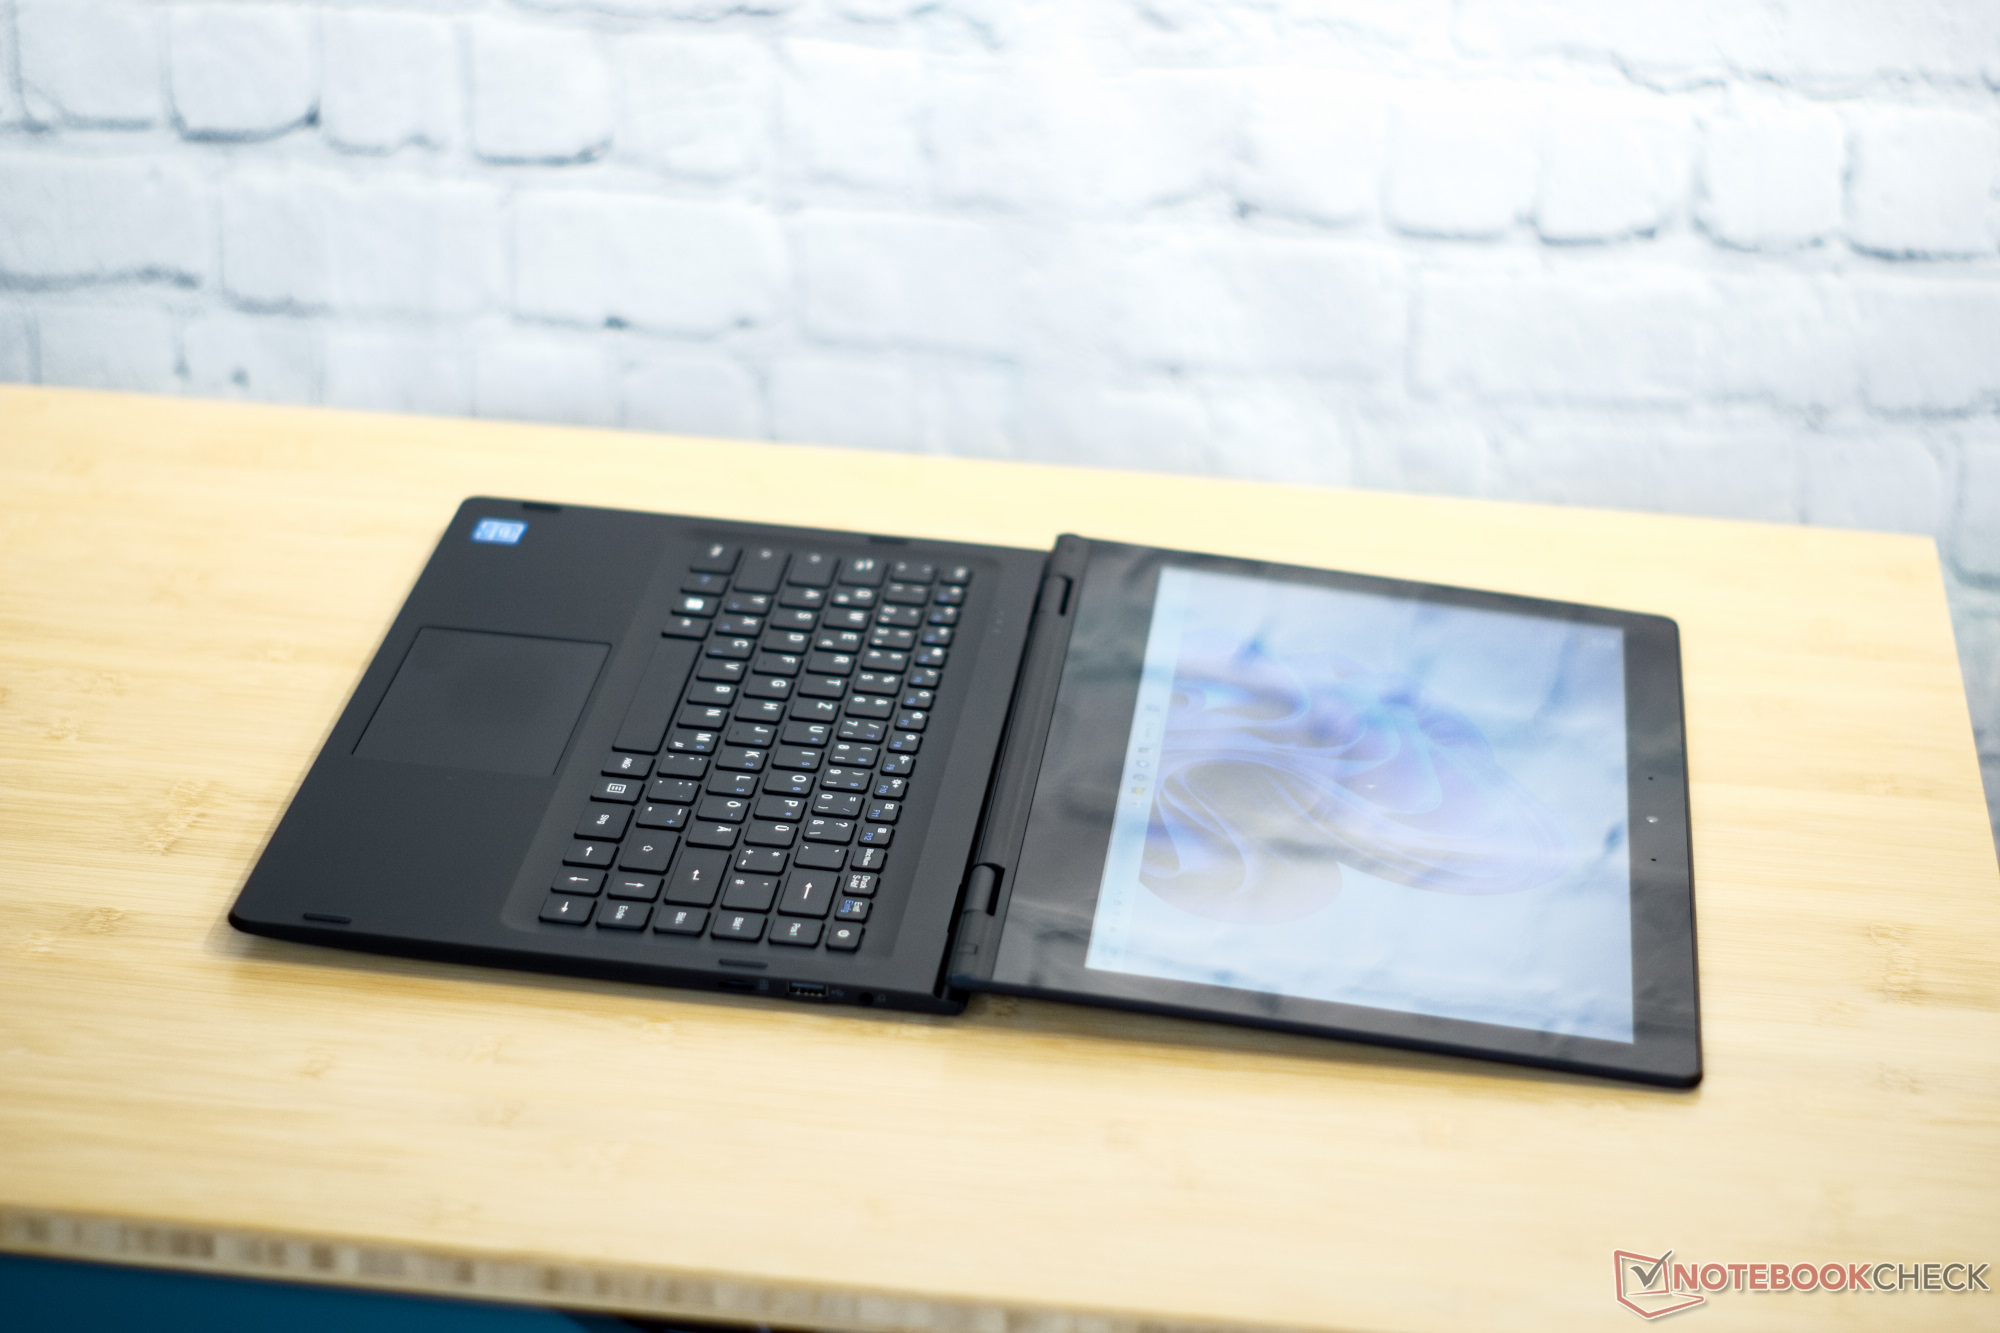
外壳 - 坚固的笔记本电脑,有很多塑料材质
笔记本电脑的外壳在我们打开包装时是一个惊喜,因为GeoFlex 140给人的感觉并不廉价。这台黑色笔记本电脑的外壳很稳定,几乎不可能被扭曲。显示屏的铰链保持着自己的位置,然而屏幕可以用一只手打开。均匀的缝隙和纤细的设计甚至使GeoFlex 140看起来相对高端。底部的大橡胶脚确保了支架的安全。在上侧,有更多的橡胶作为屏幕的间隔物和演示模式的脚。只有由显示器盖子和底座底面组成的橡胶表面暗示着不好的事情。我们从经验中知道,从长远来看,这种涂层不是很耐脏。事实上,我们在短期使用后就会发现第一道划痕。如果14.1英寸的设备对你来说太大,你也可以考虑GeoFlex 110。它具有几乎相同的功能和一个11英寸的屏幕。
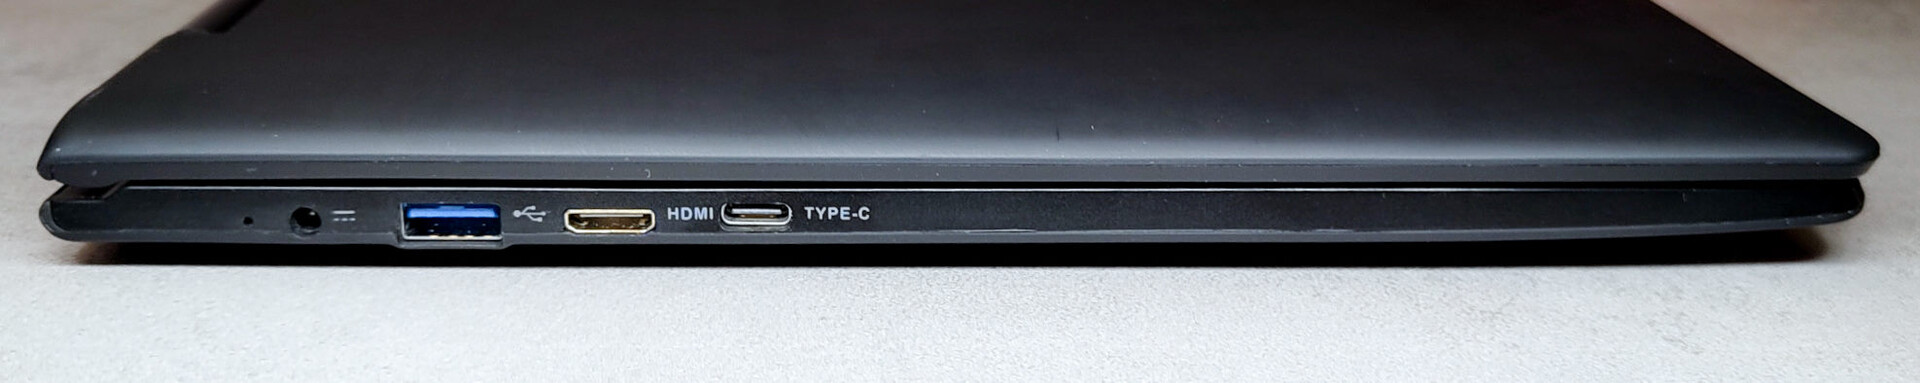
设备--满足基本条件
乍一看,GeoFlex 140拥有现代笔记本电脑的所有连接标准。机上有两个USB Type-A端口、一个3.5毫米插孔、HDMI和一个SD读卡器。在笔记本电脑的左侧也有一个USB Type-C端口。然而,除了纯粹的USB 3.0连接外,它没有任何其他功能。该端口不支持PowerDelivery、DisplayPort或Thunderbolt。因此,你必须依靠附带的24瓦电源适配器为笔记本电脑充电。在我们的测试中,只有在Windows加载了所有可能的驱动程序的更新后,通过HDMI的外部显示器才能工作。
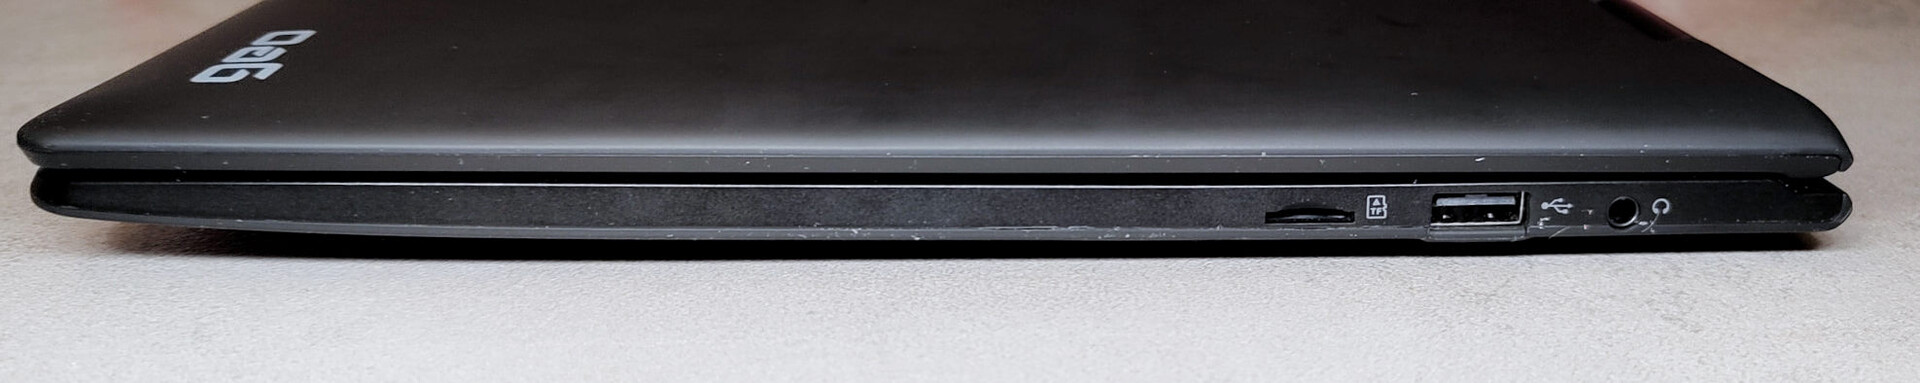
SD卡阅读器
GeoFlex 140上的SD读卡器是通过USB 2.0连接的。相应地,我们的AV Pro microSD的传输速度也很低。然而,这些显然符合廉价笔记本电脑的情况。
| SD Card Reader | |
| average JPG Copy Test (av. of 3 runs) | |
| Lenovo IdeaPad Flex 3 11IGL05 (Toshiba Exceria Pro SDXC 64 GB UHS-II) | |
| Average of class Convertible (28.1 - 197, n=23, last 2 years) | |
| Asus Vivobook 15 F512DA-SH31 (Toshiba Exceria Pro M501 64 GB UHS-II) | |
| BMAX MaxBook Y11 H1M6 (Toshiba Exceria Pro M501 64 GB UHS-II) | |
| Chuwi Hi10 X (Toshiba Exceria Pro M501 64 GB UHS-II) | |
| XIDU PhilBook Max (Toshiba Exceria Pro M501 64 GB UHS-II) | |
| Geo Computers GeoFlex 140 (AV PRO microSD (128GB) V60) | |
| maximum AS SSD Seq Read Test (1GB) | |
| Average of class Convertible (28.9 - 254, n=22, last 2 years) | |
| Lenovo IdeaPad Flex 3 11IGL05 (Toshiba Exceria Pro SDXC 64 GB UHS-II) | |
| Asus Vivobook 15 F512DA-SH31 (Toshiba Exceria Pro M501 64 GB UHS-II) | |
| BMAX MaxBook Y11 H1M6 (Toshiba Exceria Pro M501 64 GB UHS-II) | |
| XIDU PhilBook Max (Toshiba Exceria Pro M501 64 GB UHS-II) | |
| Chuwi Hi10 X (Toshiba Exceria Pro M501 64 GB UHS-II) | |
| Geo Computers GeoFlex 140 (AV PRO microSD (128GB) V60) | |
沟通
Geo安装了一个英特尔双频Wireless-AC 7265的WLAN和蓝牙4.2。该模块在2014年底已经推出,还没有提供Wi-Fi 6。Wi-Fi 5(802.11ac)是该模块支持的最高标准。WLAN中的传输速度也与该模块在这里的能力相符。然而,值得一提的是,与竞争对手相比,GeoFlex 140在网络中的速度甚至相当快。
| Networking | |
| iperf3 transmit AX12 | |
| Lenovo IdeaPad Flex 3 11IGL05 | |
| Average Intel Dual Band Wireless-AC 7265 (34 - 688, n=69) | |
| Chuwi Hi10 X | |
| BMAX MaxBook Y11 H1M6 | |
| XIDU PhilBook Max | |
| Asus BR1100FKA-BP0109RA | |
| Asus Vivobook 15 F512DA-SH31 | |
| iperf3 receive AX12 | |
| Lenovo IdeaPad Flex 3 11IGL05 | |
| Asus Vivobook 15 F512DA-SH31 | |
| Average Intel Dual Band Wireless-AC 7265 (243 - 702, n=69) | |
| Chuwi Hi10 X | |
| XIDU PhilBook Max | |
| BMAX MaxBook Y11 H1M6 | |
| Asus BR1100FKA-BP0109RA | |
| iperf3 receive AXE11000 | |
| Average of class Convertible (492 - 1755, n=47, last 2 years) | |
| Geo Computers GeoFlex 140 | |
| Average Intel Dual Band Wireless-AC 7265 (290 - 680, n=2) | |
| iperf3 transmit AXE11000 | |
| Average of class Convertible (131.3 - 1845, n=46, last 2 years) | |
| Geo Computers GeoFlex 140 | |
| Average Intel Dual Band Wireless-AC 7265 (225 - 426, n=2) | |
网络摄像头
GeoFlex 140的网络摄像头出乎意料地好。Geo公司在该设备中安装了一个相当不寻常的模块,具有190万像素的4:3格式。因此,1600×1200像素的分辨率高于高清,但仍低于全高清。虽然色彩再现可能可以被描述为差,但相机照片的清晰度和对比度是可敬的。


安全问题
这款二合一笔记本电脑至少有一个TPM 2.0模块和Windows 11的所有其他安全要求。除此以外,你不会在GeoFlex 140上发现任何其他安全功能。
辅料
在GeoFlex 140的盒子里,除了电源之外,我们只找到了必须的纸质文件。微软365年度许可证与计算机相连,可以在投入使用后六个月内激活。
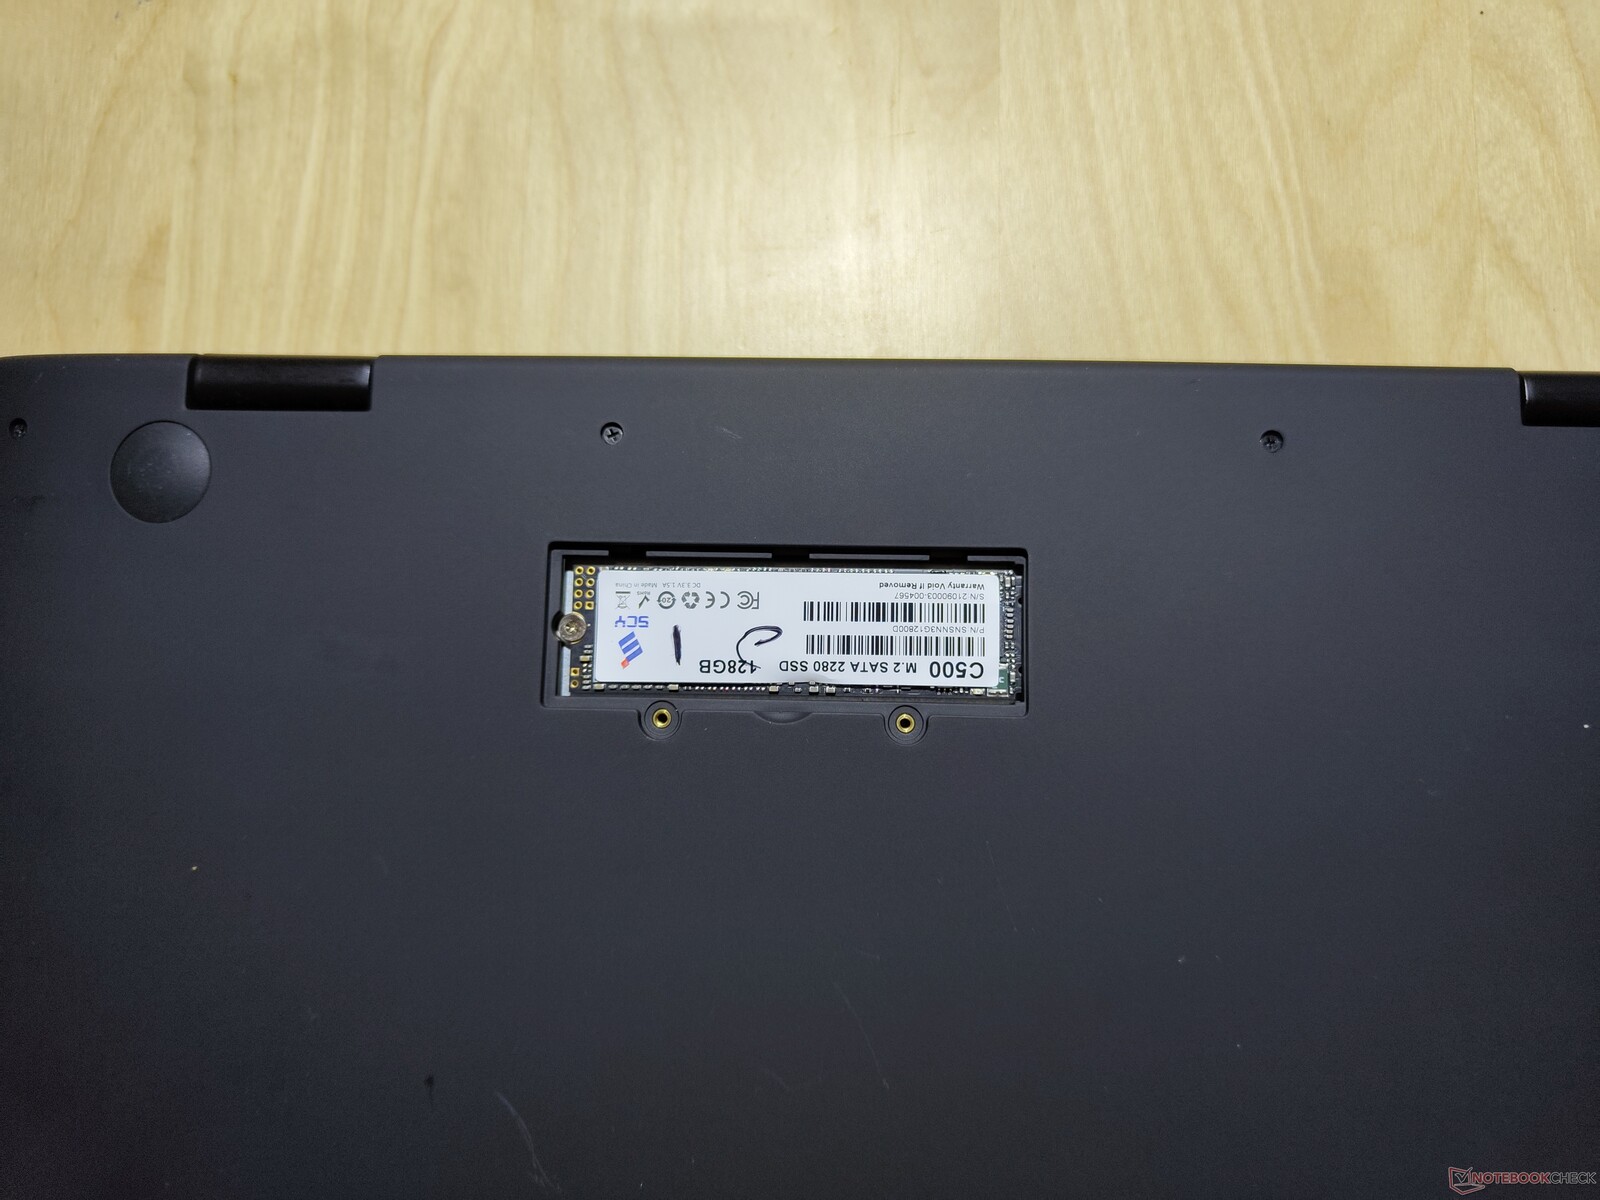
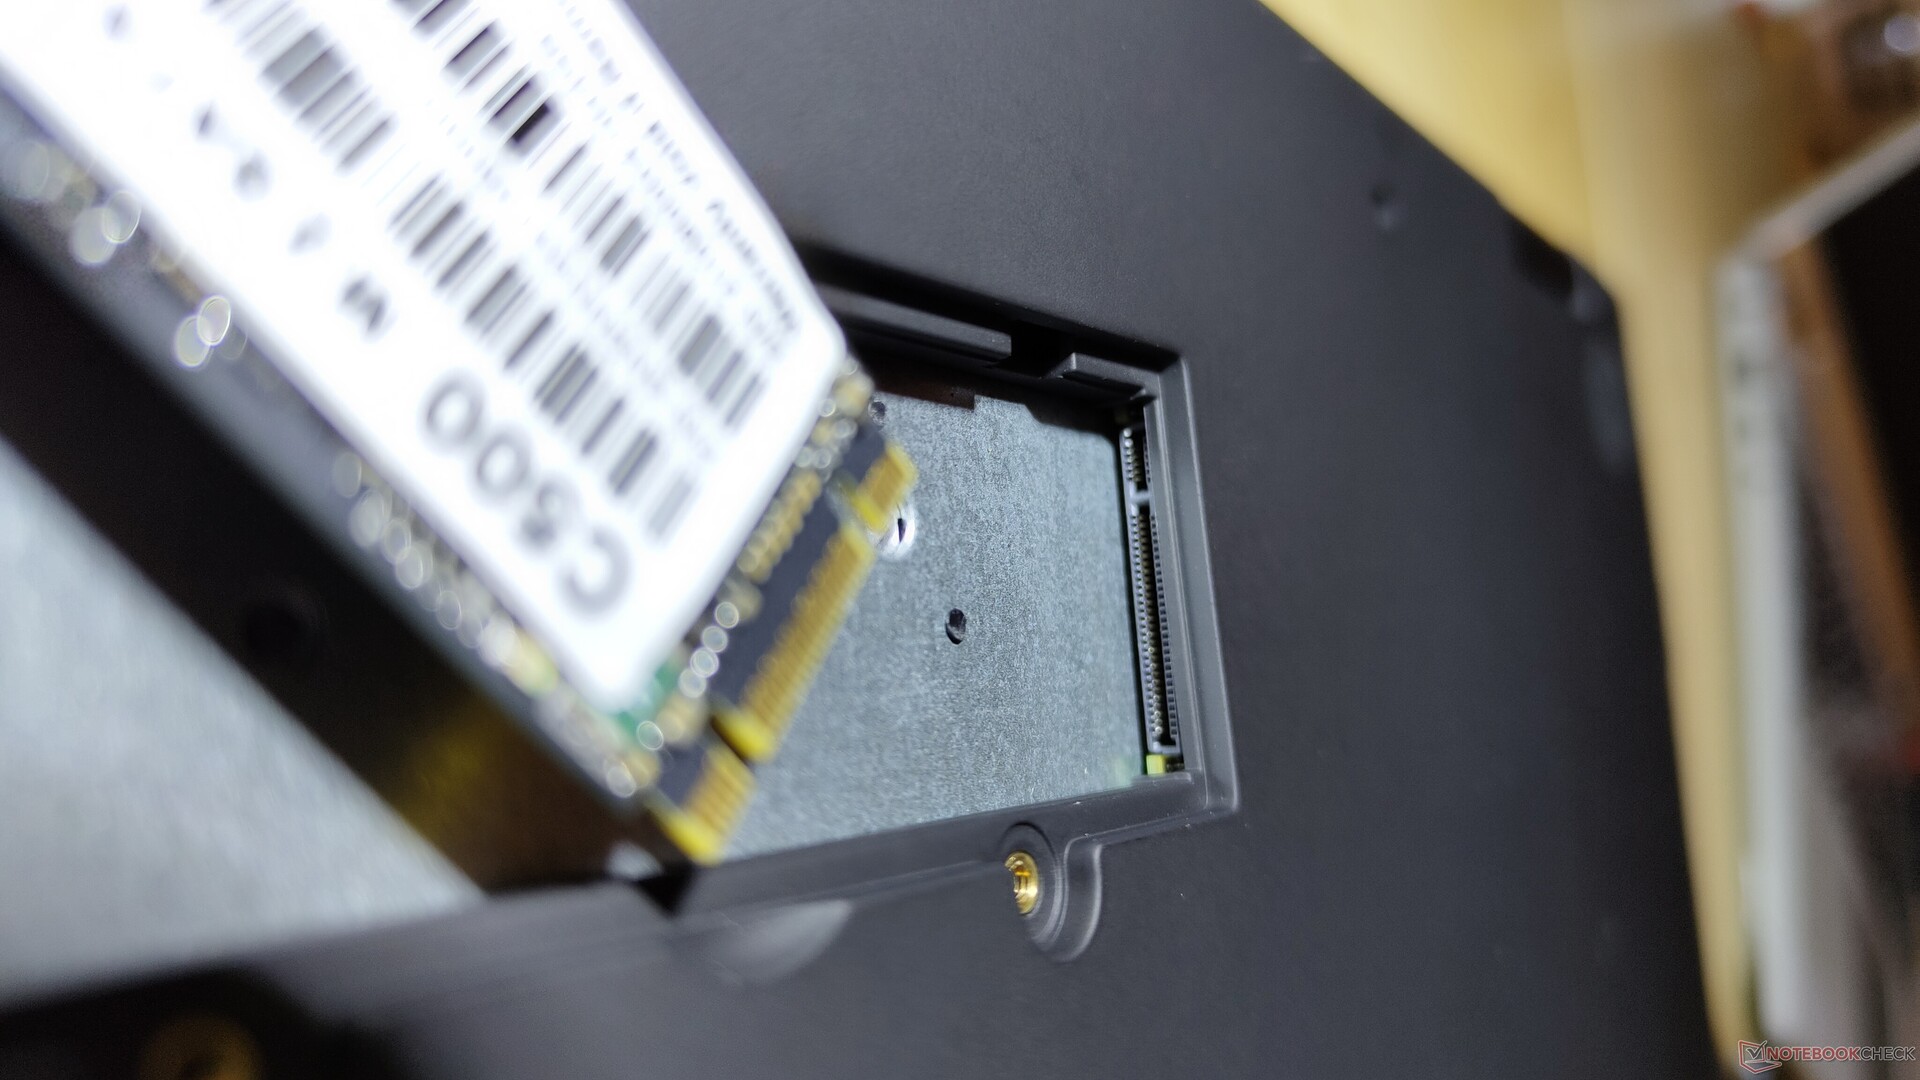
维护
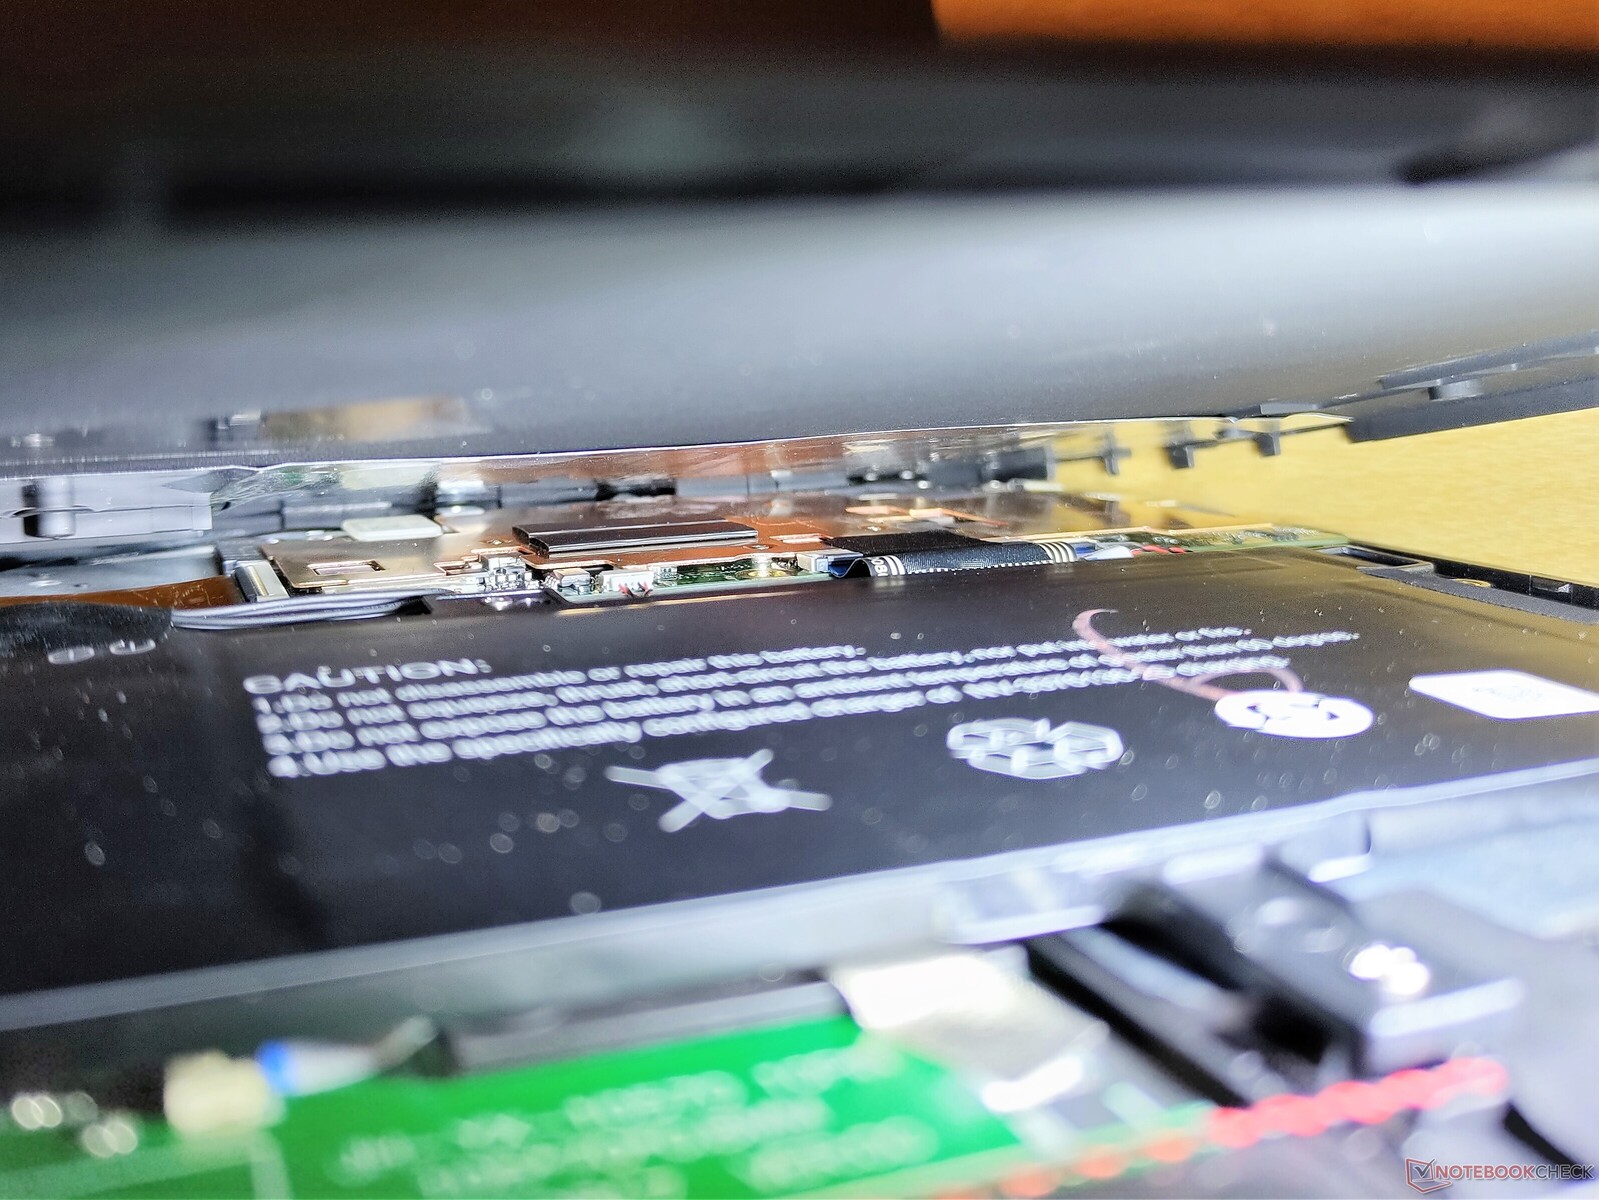
在笔记本电脑的底部,我们首先发现了一个用于M.2 SATA固态硬盘的小型维护通道。因此,你不必马上拆解整个笔记本来更换硬盘。然而,在你拆卸底盖的其他部分之前,你也应该拆下固态硬盘。之后,还有14颗螺丝将我们与敞篷车的内部分开。不幸的是,底盖几乎不可能被拆除。无数的塑料夹子使它保持在原位。然而,看一下部分打开的笔记本内部也可以看出,这种努力可能是徒劳的。所有其他部件都焊接在主板上。只有电池和右侧的子板以及扬声器可以被替换。此外,在打开笔记本时,有可能造成损坏。例如,用于关闭笔记本的强磁铁没有被粘住,而只是被插入。在紧急情况下,它们可能导致设备的短路。
担保
Geo Computers没有提供任何关于保修的信息。因此,你可能不得不依赖德国24个月的法定保修。
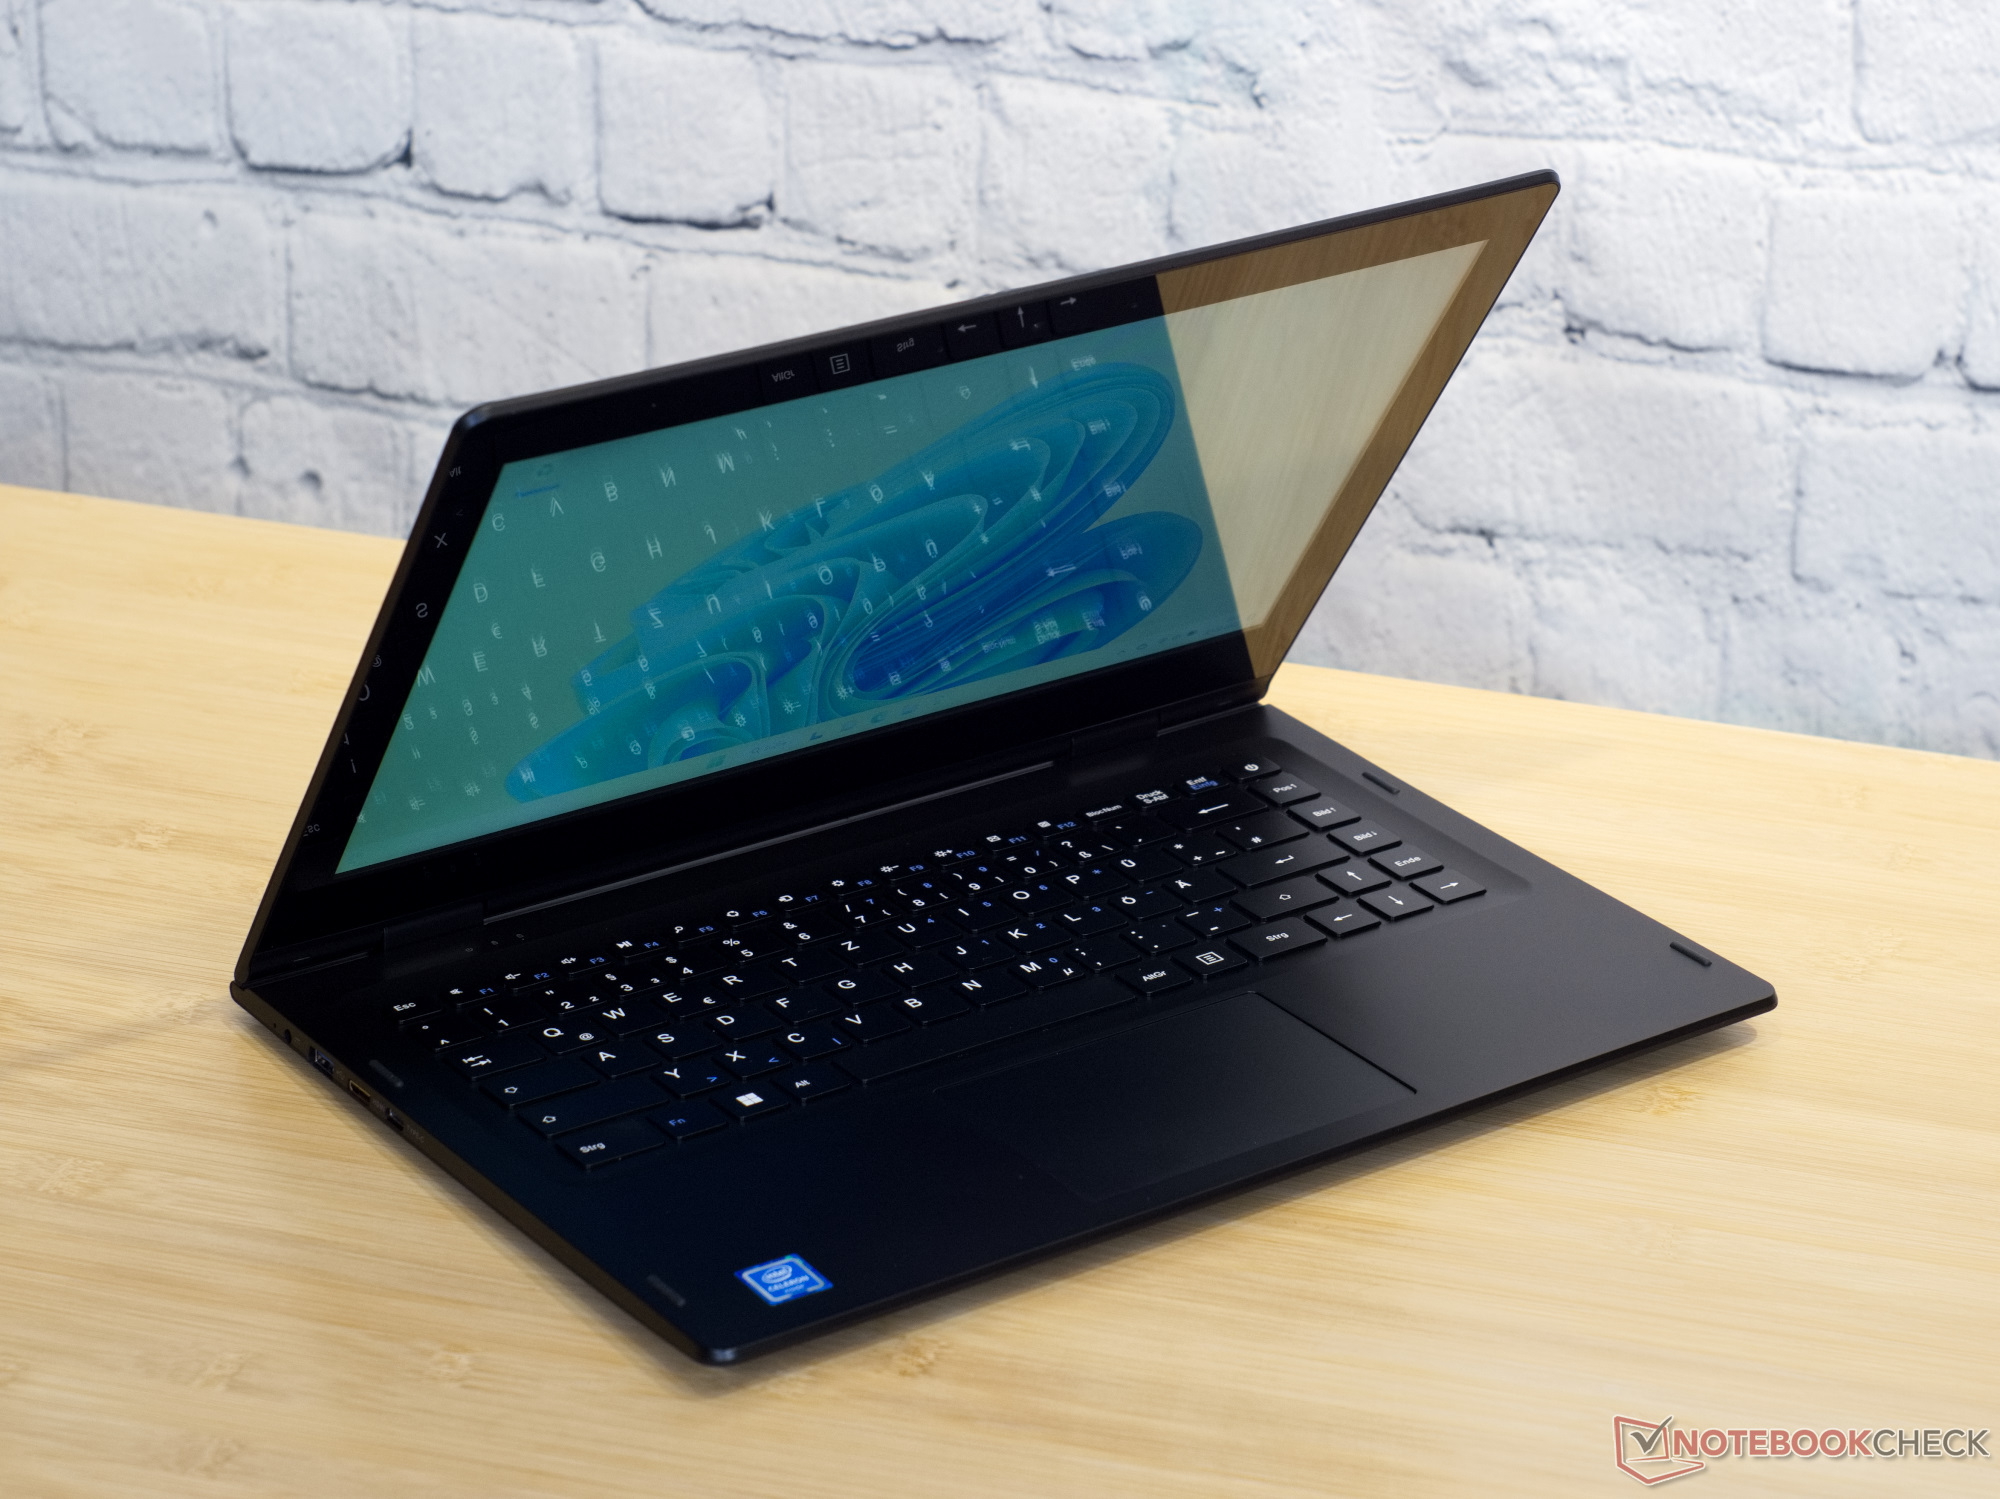
输入设备 - 不支持手写笔
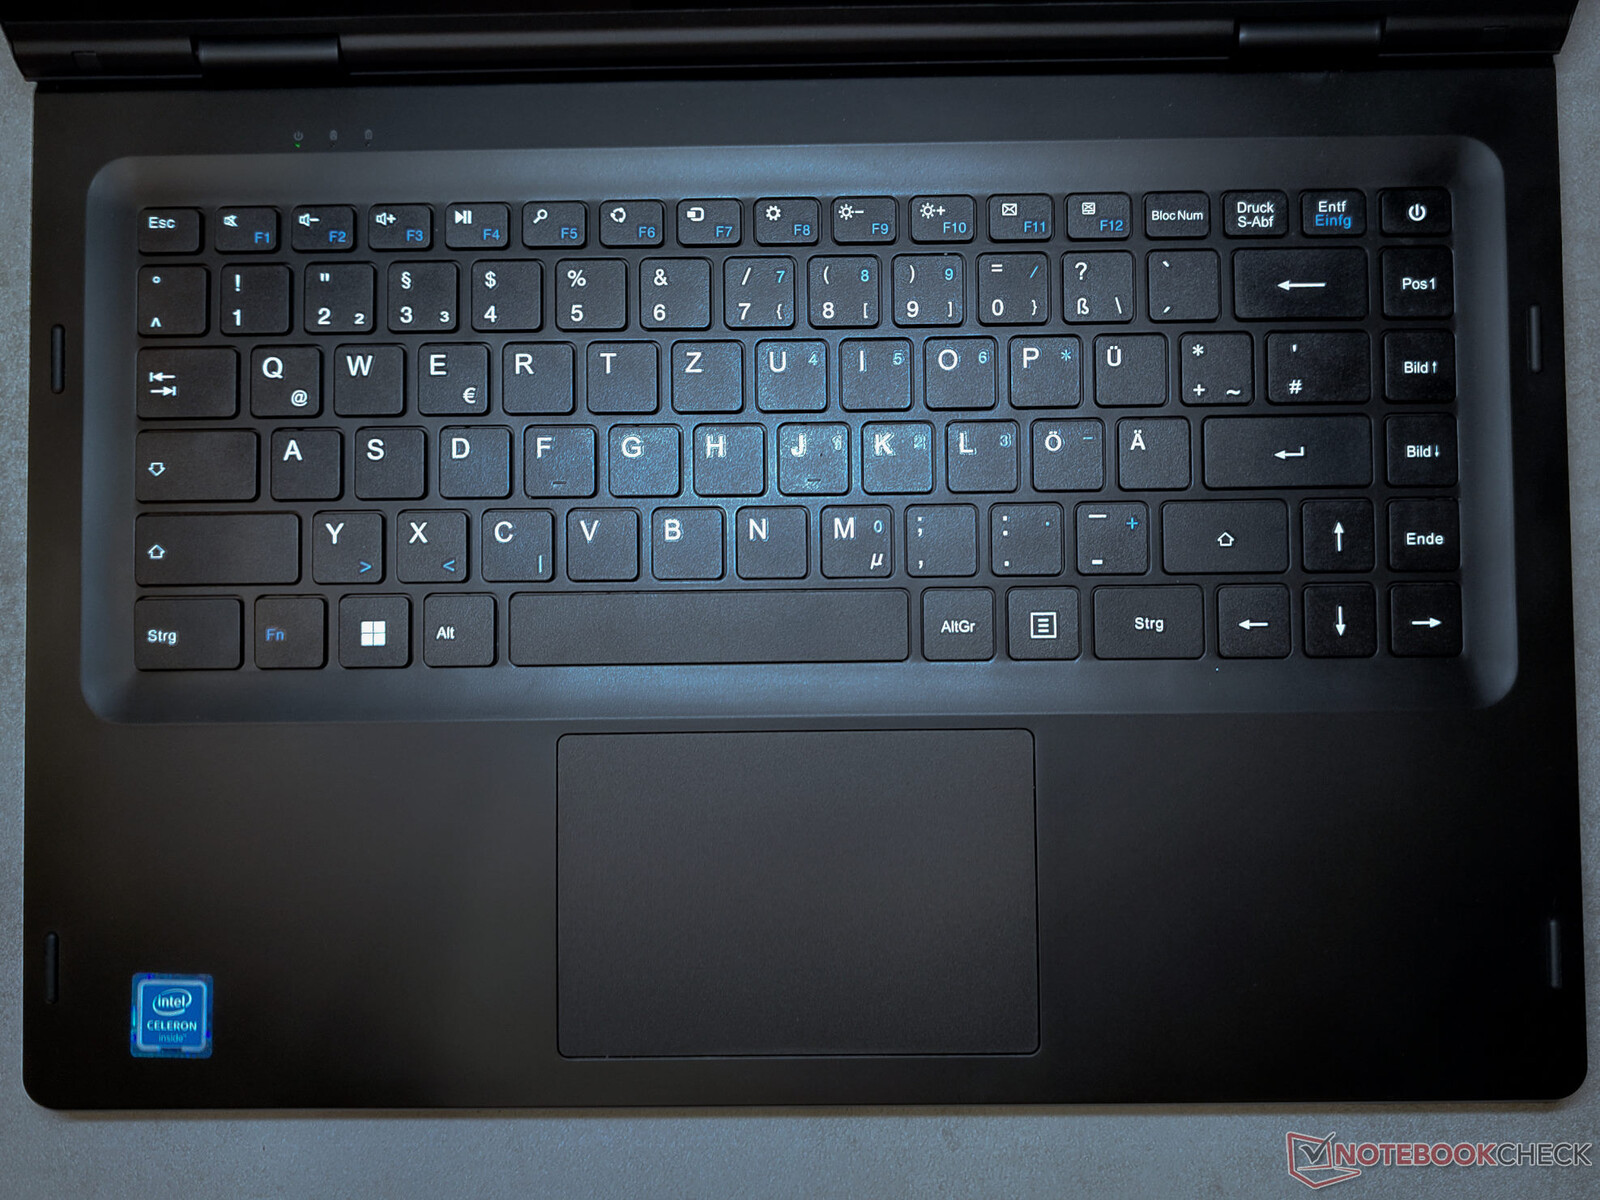
GeoFlex 140的触摸屏和触摸板非常精确,分别提供十个和五个触摸点。两者反应迅速,没有明显的延迟。这款敞篷车的键盘不提供高键位,但至少它在打字时有一种令人愉快的感觉。一种NumBlock可以作为覆盖物放置在右侧的字母上。键盘的两个明显的批评是缺乏背光和键盘的不寻常的ANSI布局。所有的欧洲键盘通常都是基于ISO布局,为不同国家的语言提供相应的字符排列。由于Geo Computers是一家主要在欧洲经营的公司,选择ANSI布局对我们来说没有意义。与其他许多转换机不同,GeoFlex 140不支持数字笔输入。
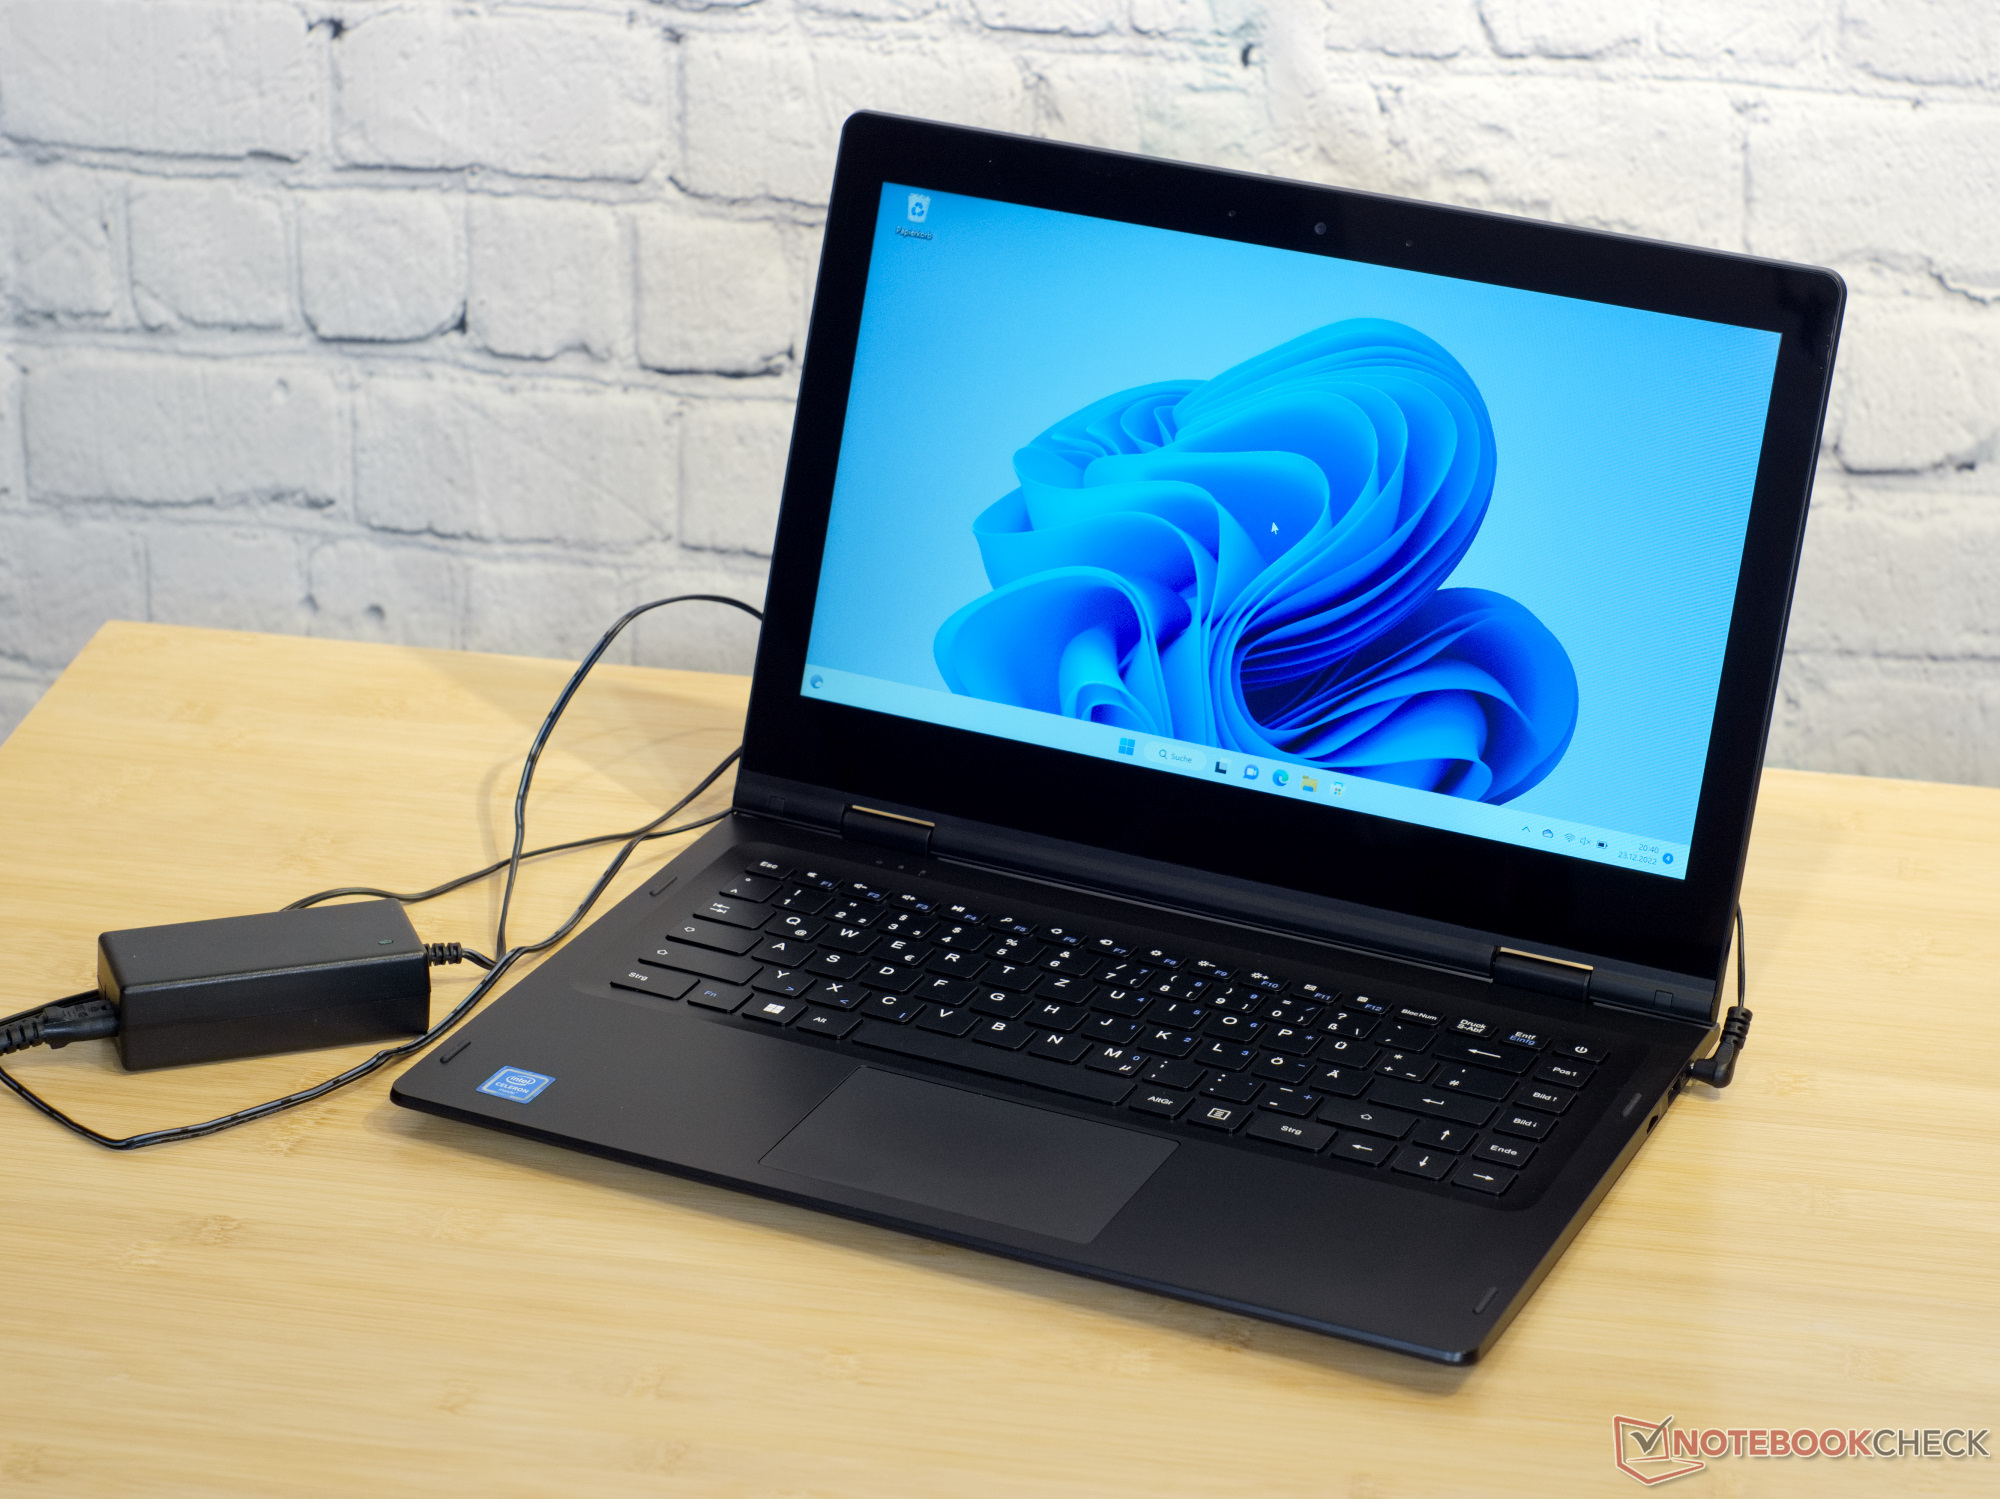
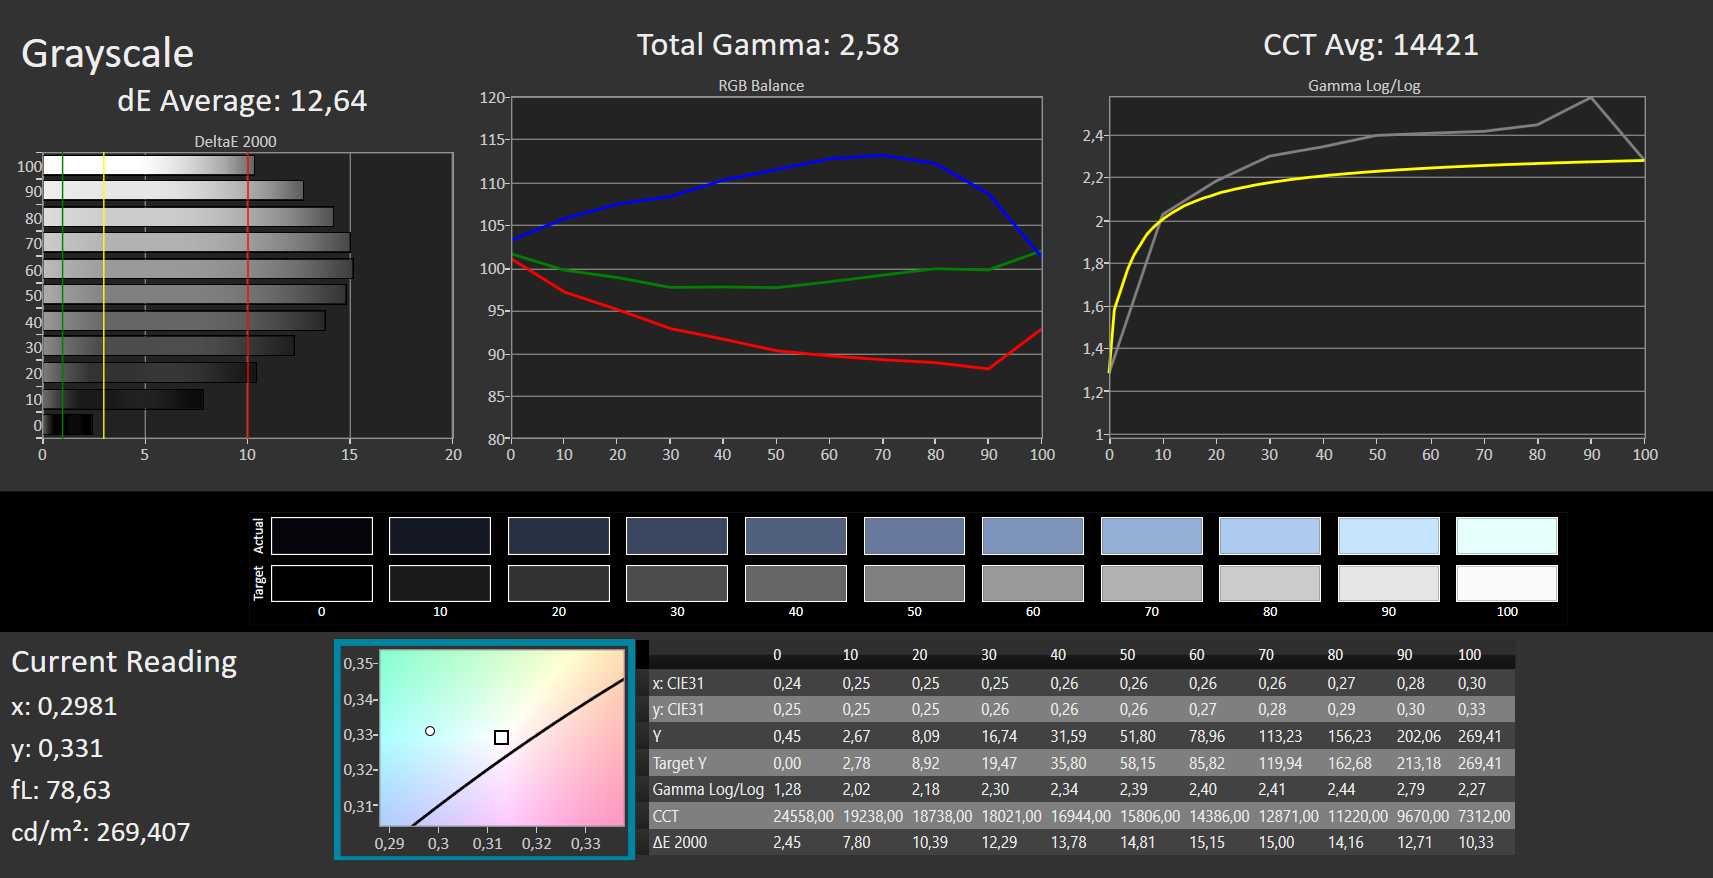
显示器 - 校准不佳的TN面板

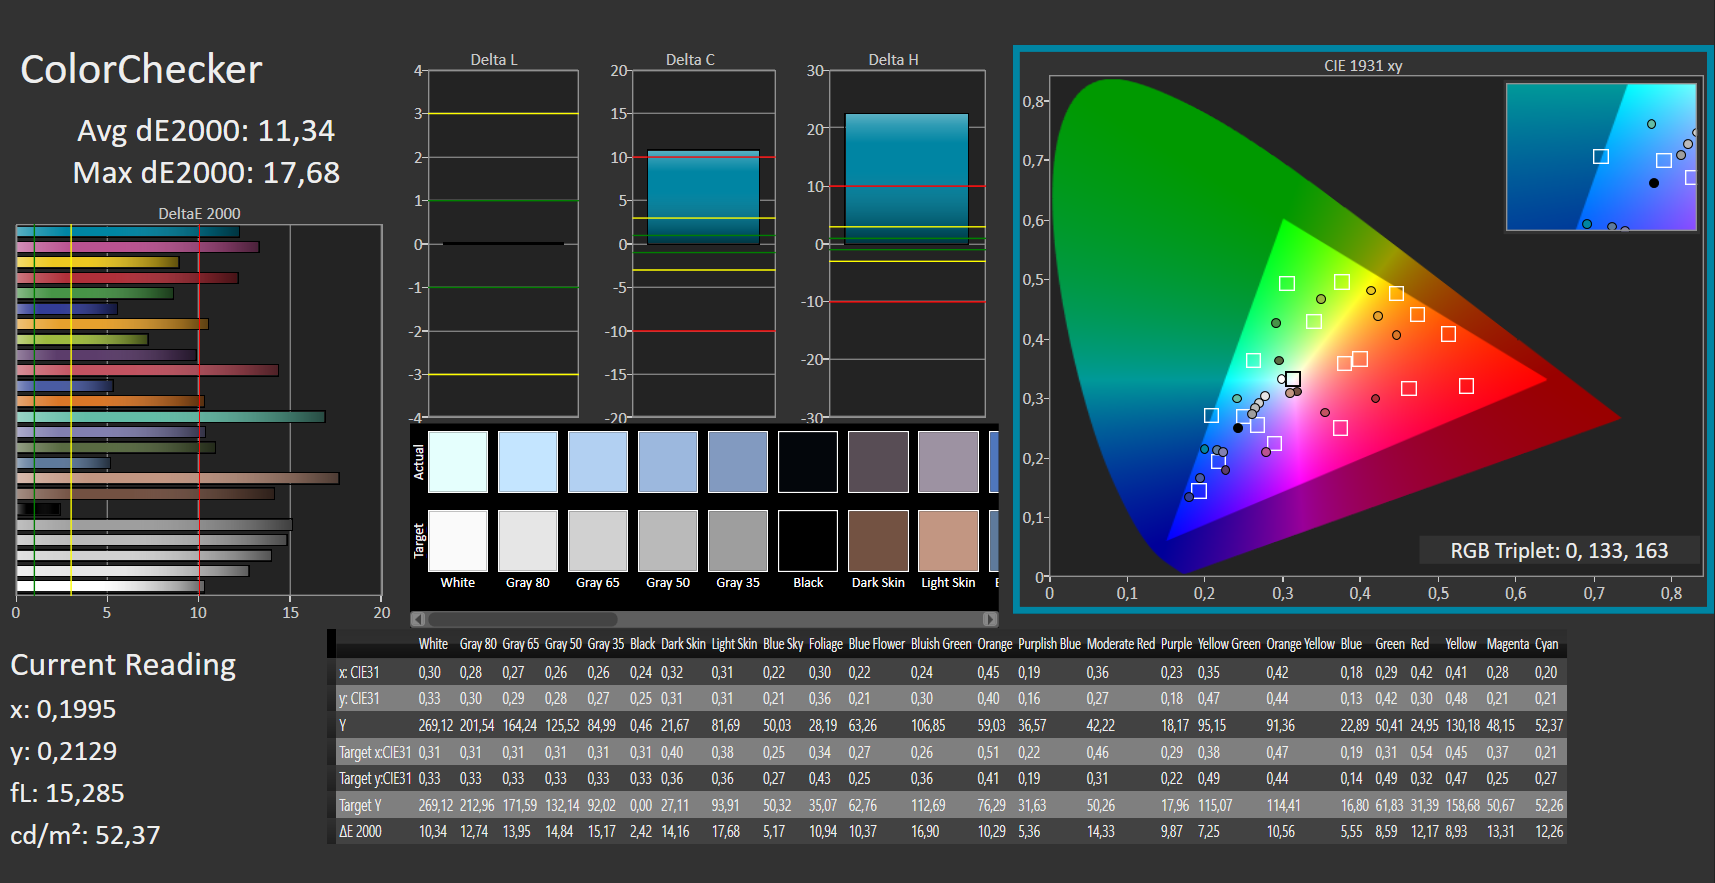
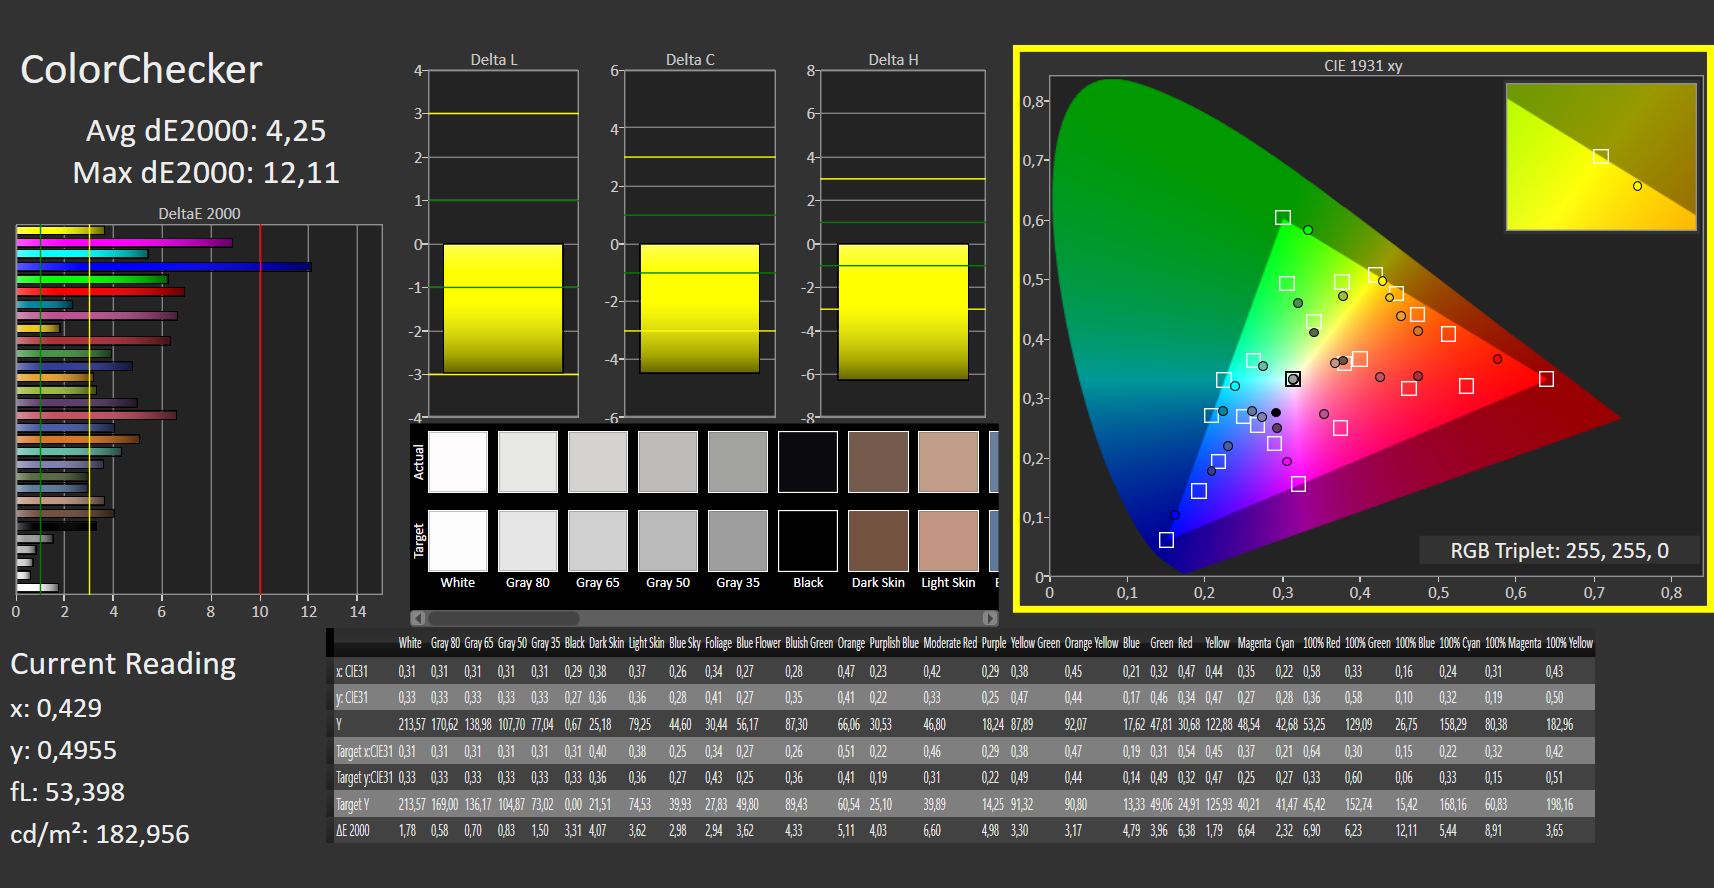
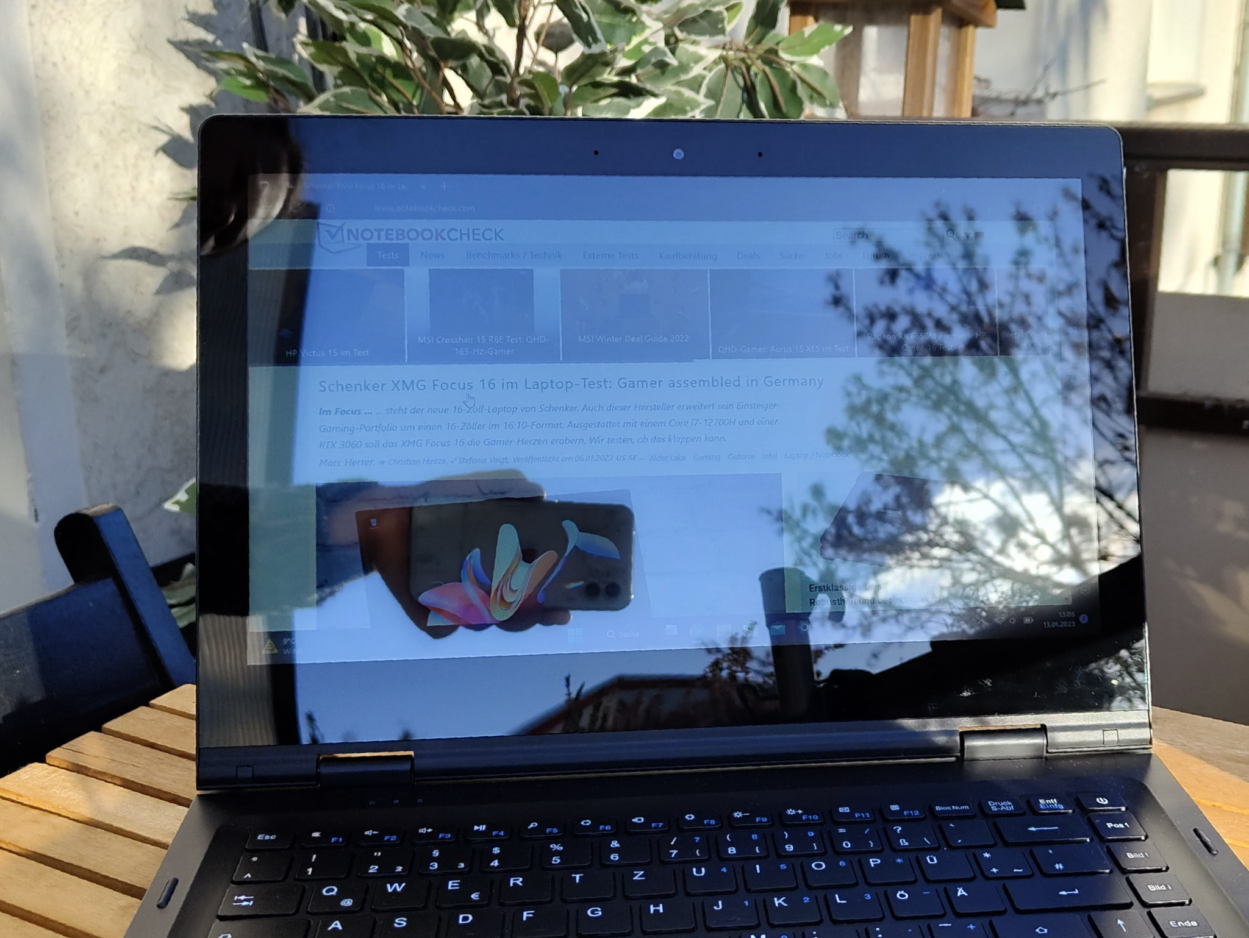
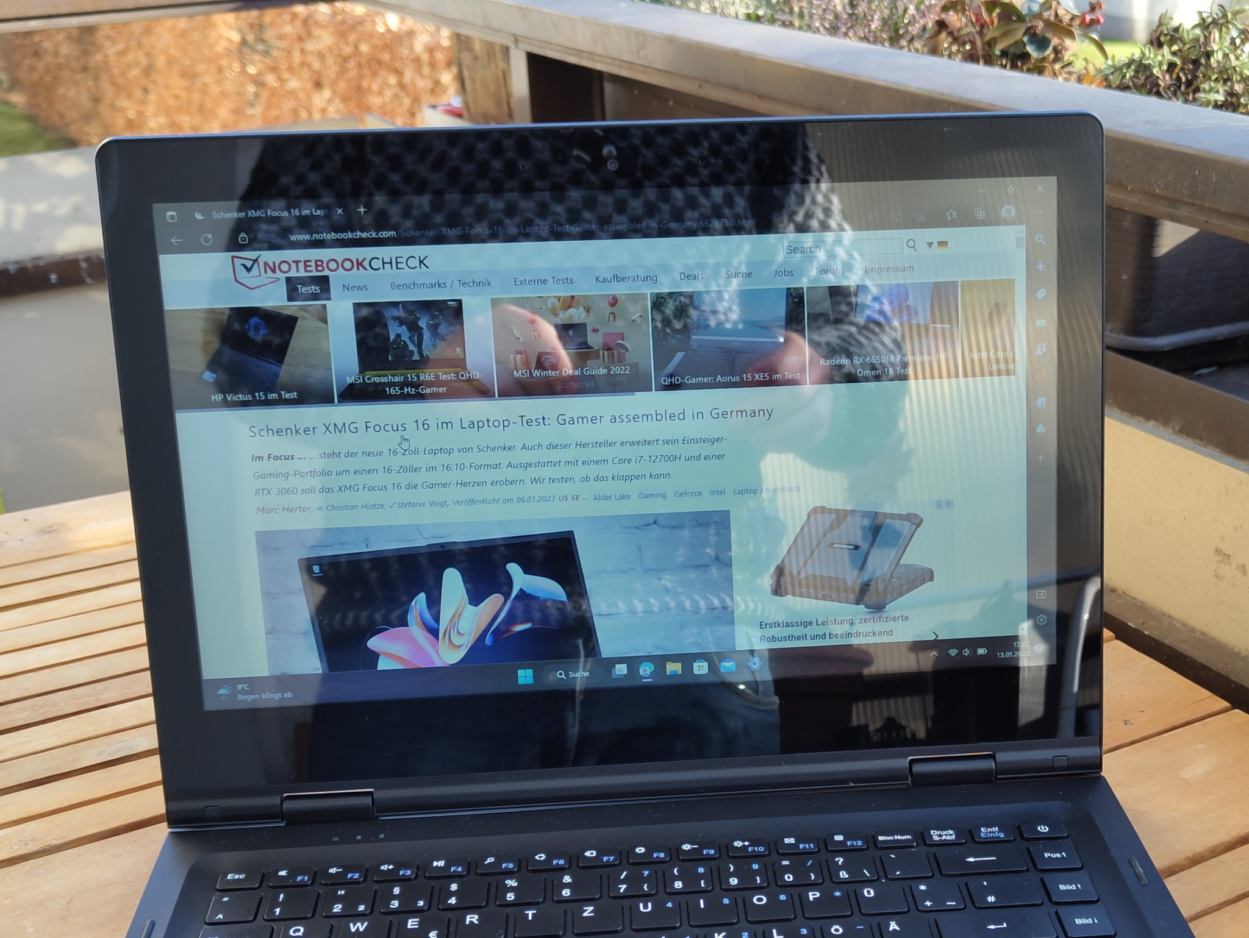
在GeoFlex 140中,你发现对于一台低价位的电脑来说,必要的节省是屏幕。1,366 × 768像素的TN面板几乎没有更新,247.8 cd/m²的亮度也不高。其598:1的对比度也很低。至少没有发现明显的照明错误。归根结底,没有其他办法可以说。敞篷车的屏幕是来自最低的抽屉。
| |||||||||||||||||||||||||
Brightness Distribution: 80 %
Center on Battery: 269 cd/m²
Contrast: 598:1 (Black: 0.45 cd/m²)
ΔE ColorChecker Calman: 11.34 | ∀{0.5-29.43 Ø4.73}
calibrated: 4.25
ΔE Greyscale Calman: 12.64 | ∀{0.09-98 Ø4.97}
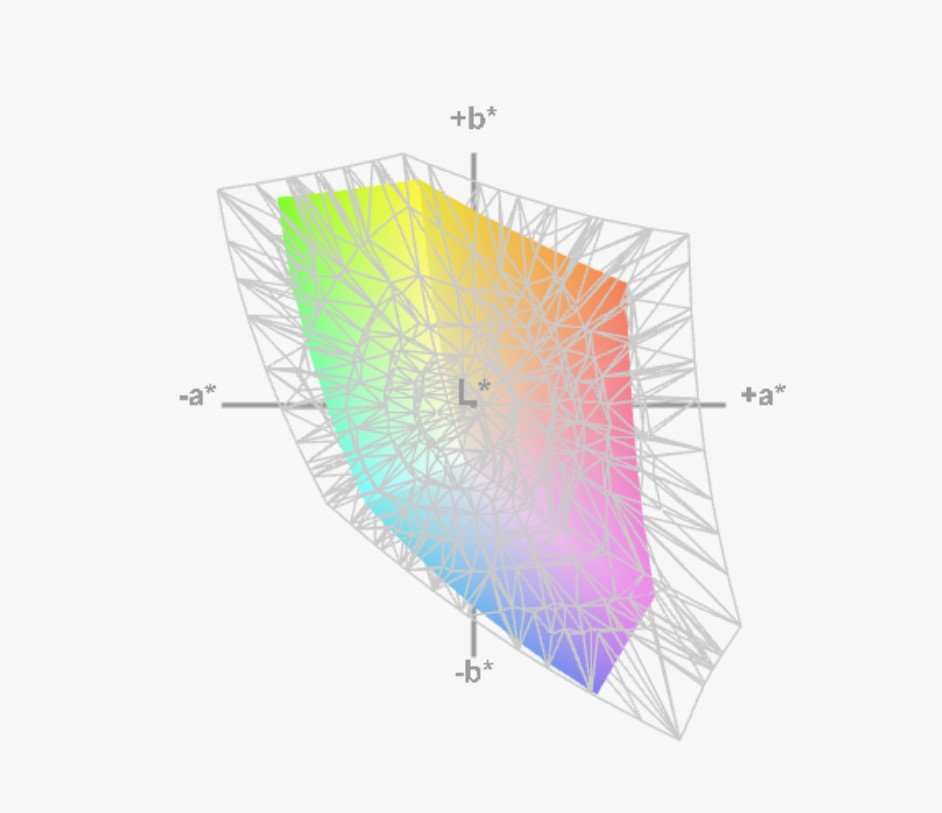
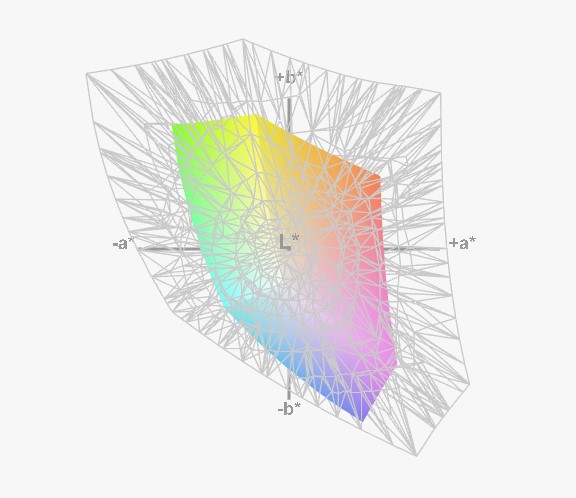
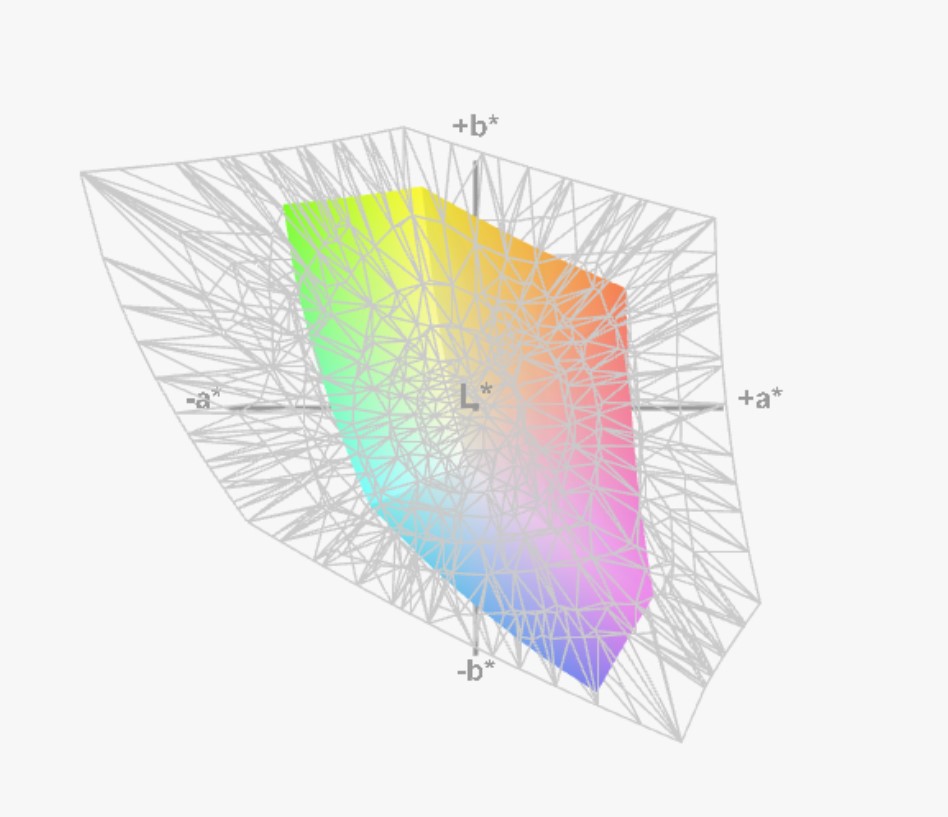
42.76% AdobeRGB 1998 (Argyll 3D)
62.35% sRGB (Argyll 3D)
41.39% Display P3 (Argyll 3D)
Gamma: 2.58
CCT: 14421 K
| Geo Computers GeoFlex 140 GJX08BD, TN, 1366x768, 14.1" | Asus BR1100FKA-BP0109RA IPS, 1366x768, 11.6" | Lenovo IdeaPad Flex 3 11IGL05 N116BCA-EA1, IPS LED, 1366x768, 11.6" | Chuwi Hi10 X AU Optronics AUO17D8, IPS, 1920x1200, 10.1" | BMAX MaxBook Y11 H1M6 LC116LF3L01, IPS, 1920x1080, 11.6" | XIDU PhilBook Max CMN N140HCA-EAC, IPS, 1920x1080, 14.1" | Asus Vivobook 15 F512DA-SH31 AU Optronics B156HAN02.1, IPS, 1920x1080, 15.6" | |
|---|---|---|---|---|---|---|---|
| Display | 10% | 10% | 60% | 50% | 2% | -6% | |
| Display P3 Coverage (%) | 41.39 | 46 11% | 45.35 10% | 67.9 64% | 62.4 51% | 42.16 2% | 38.71 -6% |
| sRGB Coverage (%) | 62.35 | 68 9% | 67.7 9% | 96.8 55% | 93.4 50% | 63 1% | 58.2 -7% |
| AdobeRGB 1998 Coverage (%) | 42.76 | 47 10% | 46.93 10% | 68.9 61% | 64.2 50% | 43.6 2% | 40 -6% |
| Response Times | 6% | 0% | 11% | -9% | -8% | -7% | |
| Response Time Grey 50% / Grey 80% * (ms) | 38 ? | 34 ? 11% | 38 ? -0% | 30.4 ? 20% | 36.1 ? 5% | 38.4 ? -1% | 36 ? 5% |
| Response Time Black / White * (ms) | 25 ? | 25 ? -0% | 25 ? -0% | 24.4 ? 2% | 30.4 ? -22% | 28.8 ? -15% | 29.6 ? -18% |
| PWM Frequency (Hz) | 25000 | 2500 | 250 ? | 20000 ? | 25000 ? | ||
| Screen | 40% | 43% | 12% | 30% | 22% | -0% | |
| Brightness middle (cd/m²) | 269 | 242 -10% | 270 0% | 256.3 -5% | 258 -4% | 179 -33% | 252.8 -6% |
| Brightness (cd/m²) | 248 | 230 -7% | 259 4% | 255 3% | 248 0% | 175 -29% | 237 -4% |
| Brightness Distribution (%) | 80 | 87 9% | 76 -5% | 93 16% | 94 18% | 78 -2% | 89 11% |
| Black Level * (cd/m²) | 0.45 | 0.195 57% | 0.195 57% | 0.41 9% | 0.26 42% | 0.15 67% | 0.86 -91% |
| Contrast (:1) | 598 | 1241 108% | 1385 132% | 625 5% | 992 66% | 1193 99% | 294 -51% |
| Colorchecker dE 2000 * | 11.34 | 5.35 53% | 3.98 65% | 10.04 11% | 7.1 37% | 6 47% | 4.83 57% |
| Colorchecker dE 2000 max. * | 17.68 | 8.74 51% | 8.46 52% | 17.49 1% | 14.8 16% | 20.2 -14% | 16.38 7% |
| Colorchecker dE 2000 calibrated * | 4.25 | 4 6% | 2.17 49% | 1.3 69% | 4.3 -1% | 3.78 11% | |
| Greyscale dE 2000 * | 12.64 | 4.79 62% | 2.57 80% | 10.4 18% | 9.6 24% | 5 60% | 4.6 64% |
| Gamma | 2.58 85% | 2.22 99% | 2.3 96% | 2.23 99% | 2.148 102% | 2 110% | 2.34 94% |
| CCT | 14421 45% | 6148 106% | 6332 103% | 10211 64% | 10313 63% | 6197 105% | 6841 95% |
| Color Space (Percent of AdobeRGB 1998) (%) | 43 | 43 | 63 | 39.4 | 36.9 | ||
| Color Space (Percent of sRGB) (%) | 68 | 67 | 96.7 | 61.6 | 58.1 | ||
| Total Average (Program / Settings) | 19% /
28% | 18% /
30% | 28% /
22% | 24% /
29% | 5% /
13% | -4% /
-2% |
* ... smaller is better
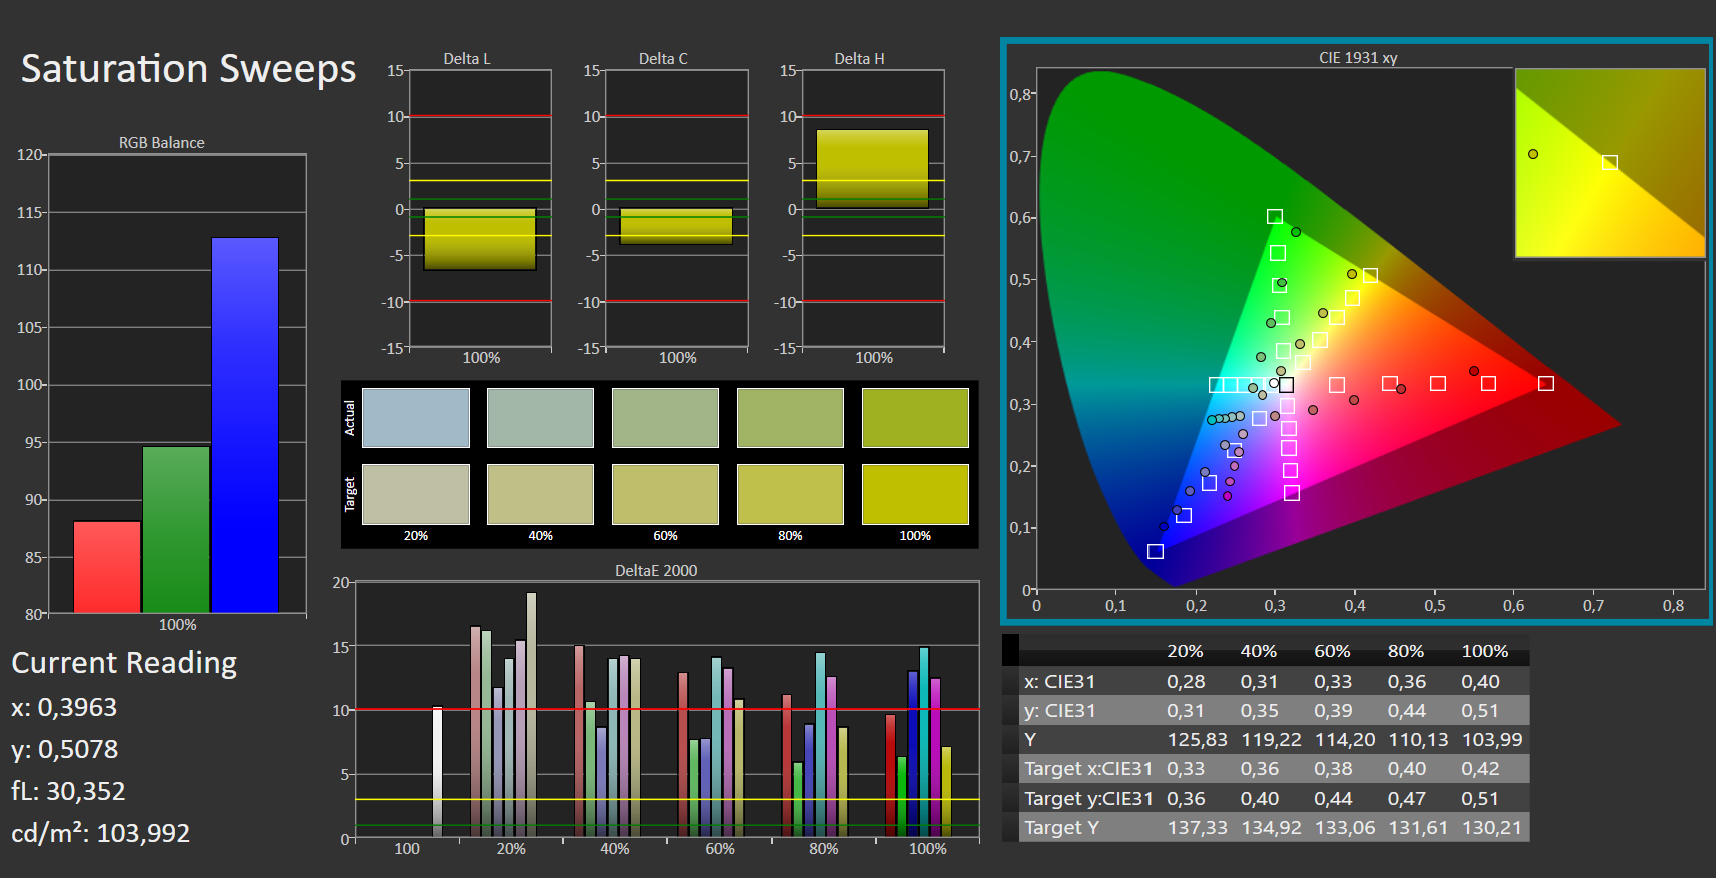
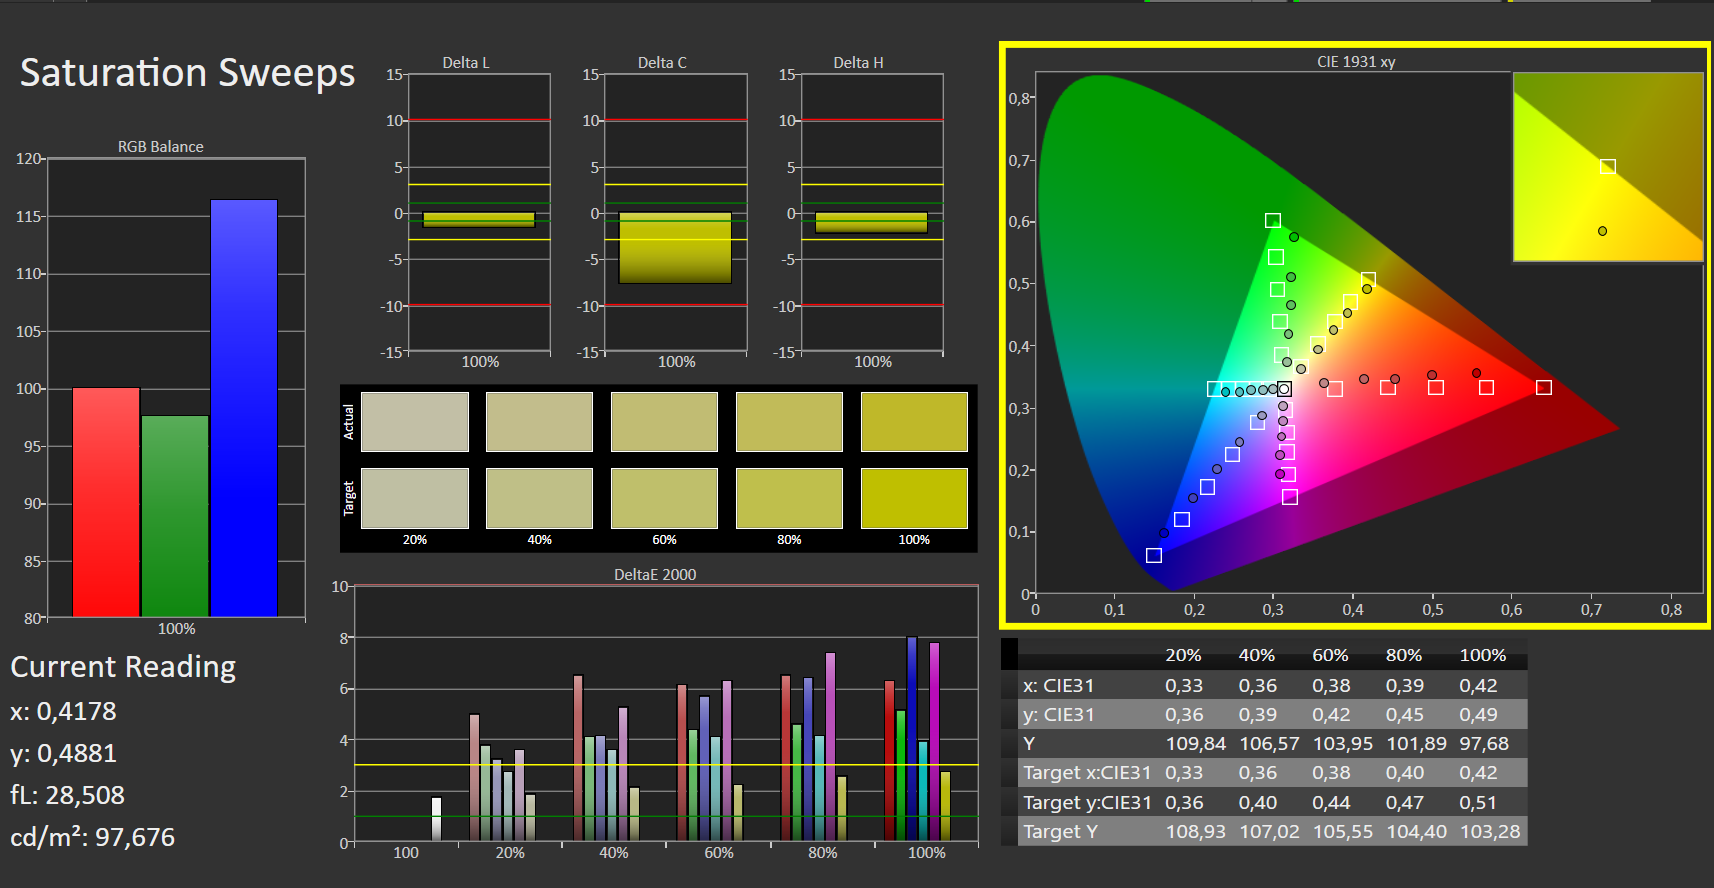
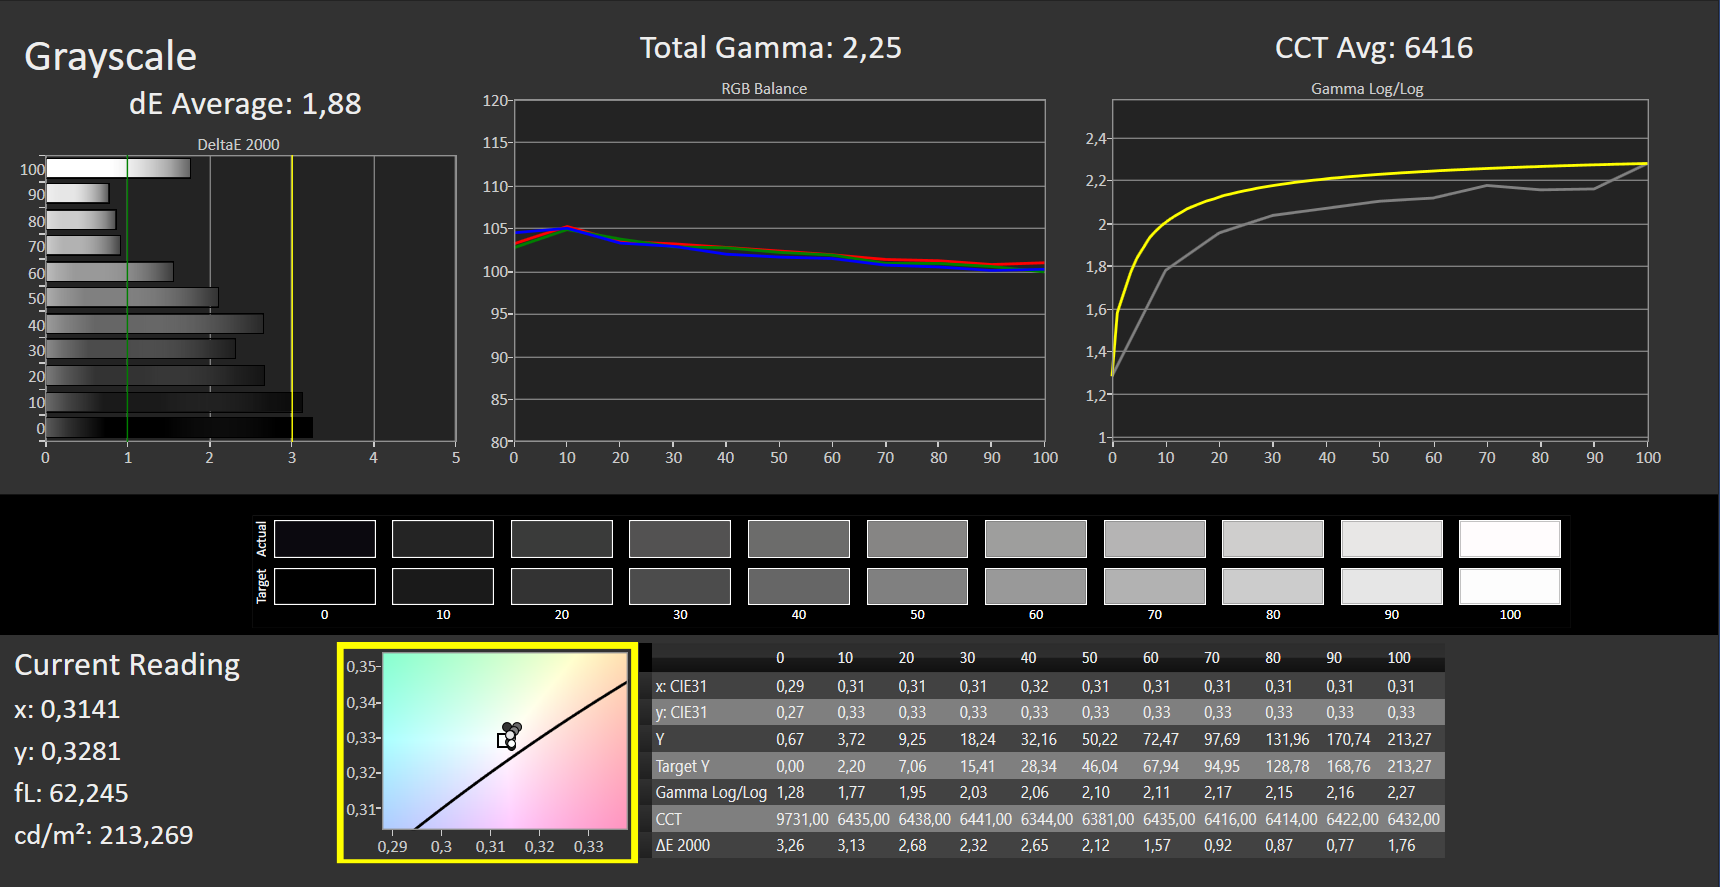
由于sRGB色彩空间的覆盖率只有62%,这块屏幕在这里提供的东西也相当少。出厂时就能感觉到明显的偏蓝,而且屏幕的色彩偏差非常大。但是,GeoFlex 140可以被校准得很好,令人惊讶。使用信息框中的ICC配置文件,平均ΔΕ2000下降到4.25的可接受值。这样一来,颜色变得更加自然,屏幕也相当值得尊敬。尽管GeoFlex 140的价格只有200欧元(约合218美元),但在交货时至少有一半的显示器被校准过,这仍然是可取的。
Display Response Times
| ↔ Response Time Black to White | ||
|---|---|---|
| 25 ms ... rise ↗ and fall ↘ combined | ↗ 19 ms rise |  |
| ↘ 6 ms fall | ||
| The screen shows relatively slow response rates in our tests and may be too slow for gamers. In comparison, all tested devices range from 0.1 (minimum) to 240 (maximum) ms. » 59 % of all devices are better. This means that the measured response time is worse than the average of all tested devices (19.9 ms). | ||
| ↔ Response Time 50% Grey to 80% Grey | ||
| 38 ms ... rise ↗ and fall ↘ combined | ↗ 20 ms rise |  |
| ↘ 18 ms fall | ||
| The screen shows slow response rates in our tests and will be unsatisfactory for gamers. In comparison, all tested devices range from 0.165 (minimum) to 636 (maximum) ms. » 55 % of all devices are better. This means that the measured response time is worse than the average of all tested devices (31.1 ms). | ||
Screen Flickering / PWM (Pulse-Width Modulation)
| Screen flickering / PWM detected | 25000 Hz |  | |
The display backlight flickers at 25000 Hz (worst case, e.g., utilizing PWM) . The frequency of 25000 Hz is quite high, so most users sensitive to PWM should not notice any flickering. In comparison: 52 % of all tested devices do not use PWM to dim the display. If PWM was detected, an average of 7798 (minimum: 5 - maximum: 343500) Hz was measured. | |||


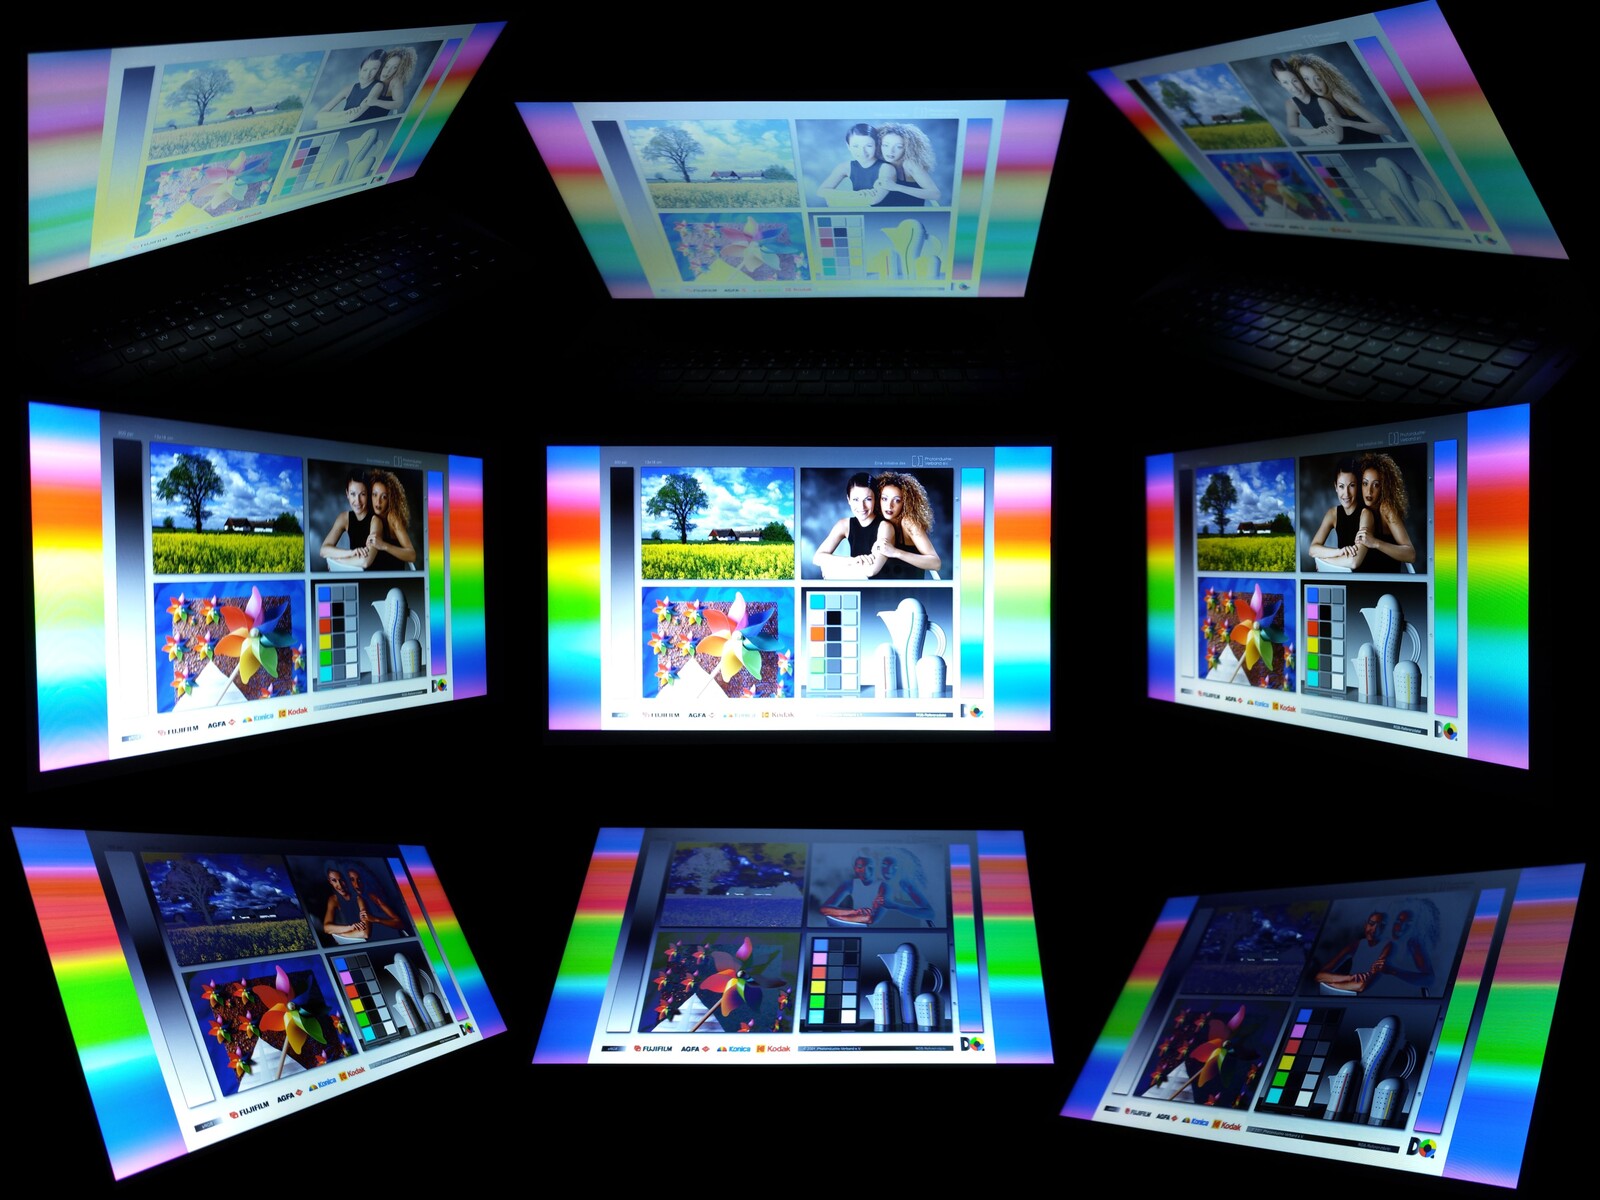
TN面板的低亮度几乎不允许在户外有良好的可读性。这里的可视角度稳定性是该技术的典型值。这意味着屏幕只能在非常有限的视角范围内真正显示正确的颜色。
性能 - 多任务处理几乎不可能
有了 英特尔赛扬N4020和4GB的工作内存,人们至少可以期待GeoFlex 140在互联网浏览器、网络应用程序、Office和微软商店的许多应用程序方面有一个体面的性能。相应地,GeoFlex 140以S模式搭载Windows。在日常使用中,至少流媒体、浏览和Office也没有问题。然而,应该清楚的是,所安装的双核处理器只能在非常有限的范围内执行多任务,许多应用程序需要的时间比你在更强大的笔记本电脑上习惯的要多。
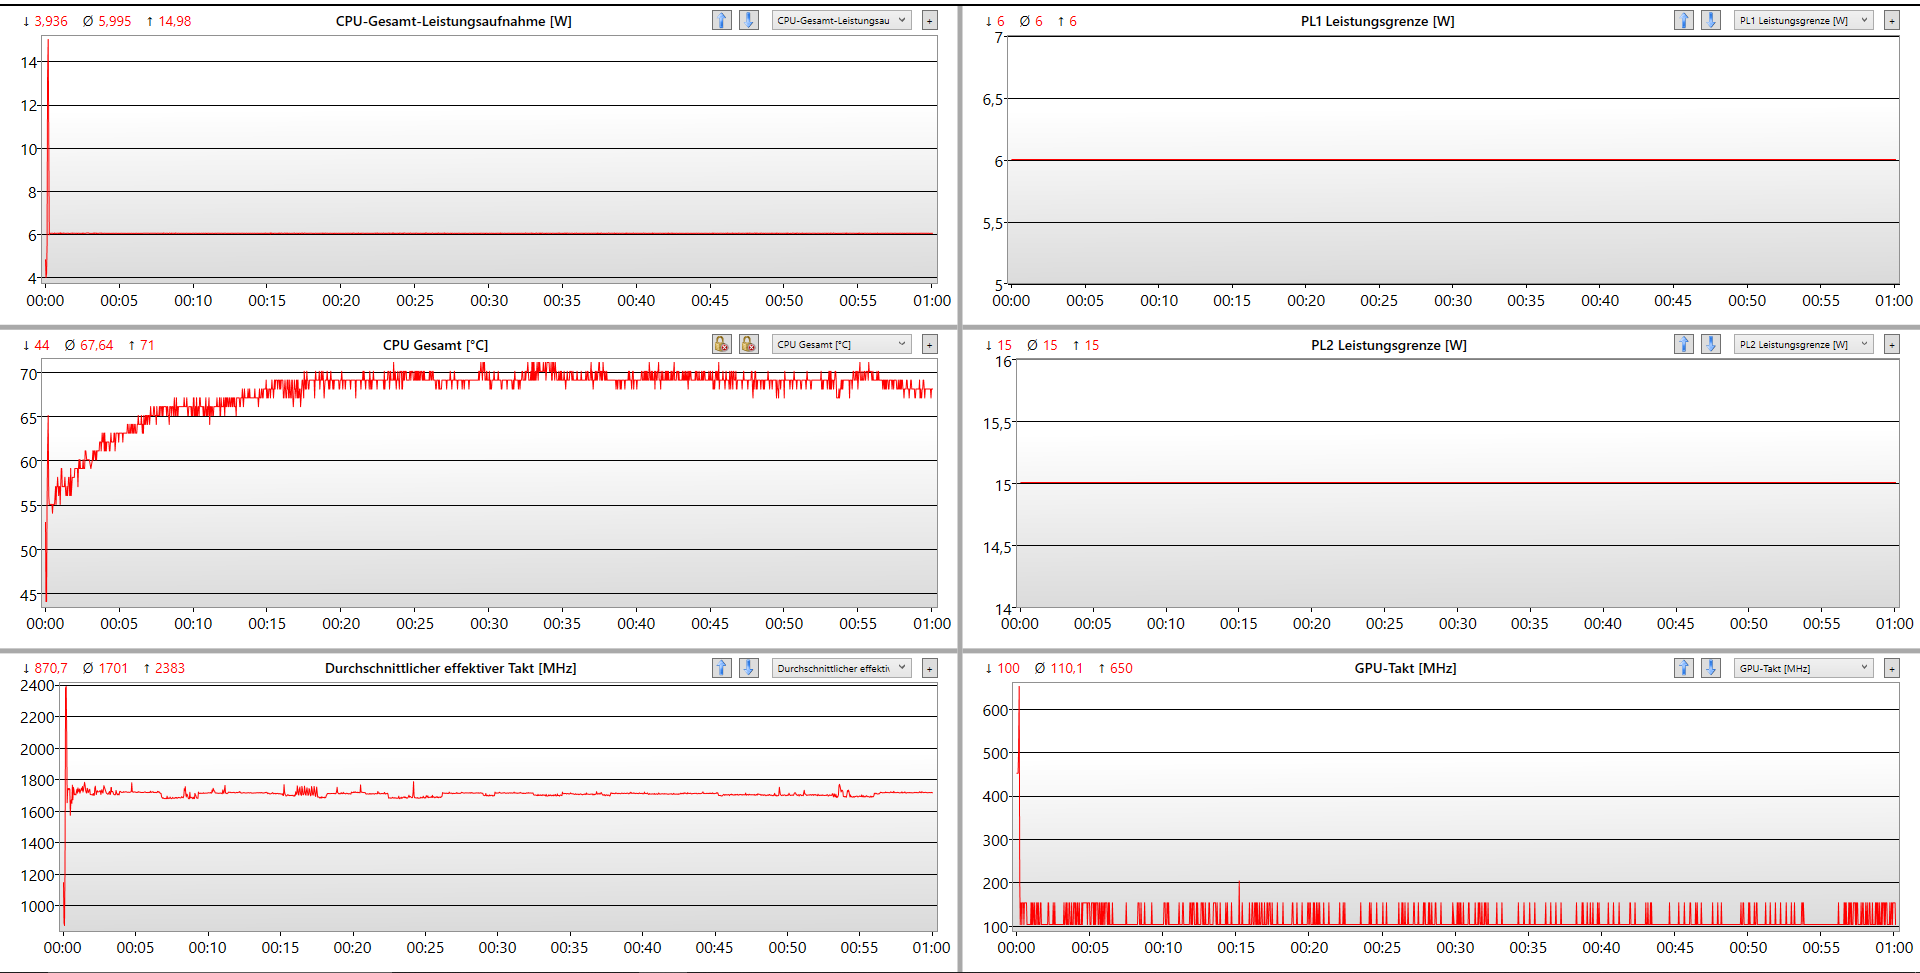
测试条件
由于被动冷却,在GeoFlex 140中几乎没有任何可以应用性能控制的点。因此,笔记本电脑的性能最多只能通过Windows的能源设置进行操控,这一点并不令人惊讶。在这里我们发现,在设定的性能限制中没有任何变化。处理器的提升功率(PL2)始终为15瓦,永久功率为6瓦。因此,原则上来说,在哪种设置下执行基准测试并不重要。然而,我们选择了 "最佳性能 "的能源状态。
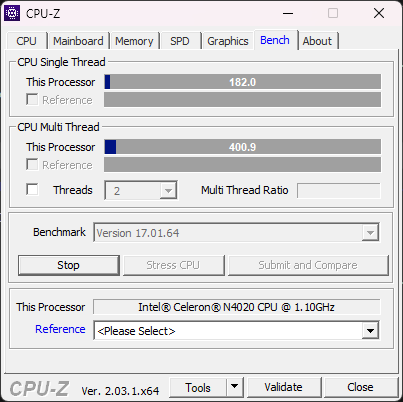
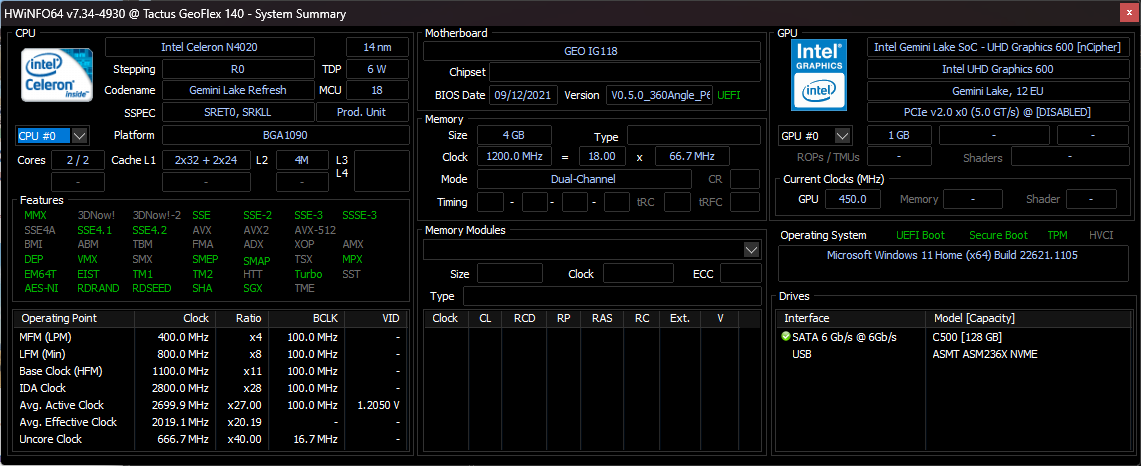
处理器
ǞǞǞ 英特尔赛扬N4020已经上市三年了,采用14纳米工艺制造。该处理器有两个核心,没有超线程。因此,它不是一个多任务的人才。太多的应用程序同时打开会使它迅速超载。因此,在所有可能的处理器基准测试中的分数和结果都很低。纯被动冷却的英特尔赛扬处理器在这里不能取得特别好的分数。它只能耐心地管理所有交给它的任务。
Cinebench R15 Multi Endurance test
Cinebench R23: Multi Core | Single Core
Cinebench R20: CPU (Multi Core) | CPU (Single Core)
Cinebench R15: CPU Multi 64Bit | CPU Single 64Bit
Blender: v2.79 BMW27 CPU
7-Zip 18.03: 7z b 4 | 7z b 4 -mmt1
Geekbench 5.5: Multi-Core | Single-Core
HWBOT x265 Benchmark v2.2: 4k Preset
LibreOffice : 20 Documents To PDF
R Benchmark 2.5: Overall mean
| CPU Performance rating | |
| Average of class Convertible | |
| Asus Vivobook 15 F512DA-SH31 -2! | |
| Lenovo IdeaPad Flex 3 11IGL05 -2! | |
| Chuwi Hi10 X -2! | |
| Average Intel Celeron N4020 | |
| BMAX MaxBook Y11 H1M6 | |
| Asus BR1100FKA-BP0109RA | |
| Geo Computers GeoFlex 140 -5! | |
| XIDU PhilBook Max -6! | |
| Cinebench R23 / Multi Core | |
| Average of class Convertible (1317 - 30959, n=49, last 2 years) | |
| BMAX MaxBook Y11 H1M6 | |
| Asus BR1100FKA-BP0109RA | |
| Geo Computers GeoFlex 140 | |
| Average Intel Celeron N4020 (n=1) | |
| Cinebench R23 / Single Core | |
| Average of class Convertible (740 - 2188, n=49, last 2 years) | |
| Asus BR1100FKA-BP0109RA | |
| BMAX MaxBook Y11 H1M6 | |
| Geo Computers GeoFlex 140 | |
| Average Intel Celeron N4020 (n=1) | |
| Cinebench R20 / CPU (Multi Core) | |
| Average of class Convertible (595 - 12102, n=49, last 2 years) | |
| Asus Vivobook 15 F512DA-SH31 | |
| BMAX MaxBook Y11 H1M6 | |
| Chuwi Hi10 X | |
| Asus BR1100FKA-BP0109RA | |
| Lenovo IdeaPad Flex 3 11IGL05 | |
| Average Intel Celeron N4020 (242 - 316, n=2) | |
| Geo Computers GeoFlex 140 | |
| XIDU PhilBook Max | |
| Cinebench R20 / CPU (Single Core) | |
| Average of class Convertible (273 - 834, n=49, last 2 years) | |
| Asus Vivobook 15 F512DA-SH31 | |
| Asus BR1100FKA-BP0109RA | |
| Lenovo IdeaPad Flex 3 11IGL05 | |
| Average Intel Celeron N4020 (149.8 - 175, n=2) | |
| Chuwi Hi10 X | |
| BMAX MaxBook Y11 H1M6 | |
| Geo Computers GeoFlex 140 | |
| XIDU PhilBook Max | |
| Cinebench R15 / CPU Multi 64Bit | |
| Average of class Convertible (478 - 4940, n=48, last 2 years) | |
| Asus Vivobook 15 F512DA-SH31 | |
| BMAX MaxBook Y11 H1M6 | |
| Chuwi Hi10 X | |
| Asus BR1100FKA-BP0109RA | |
| Lenovo IdeaPad Flex 3 11IGL05 | |
| Average Intel Celeron N4020 (110.1 - 144.1, n=2) | |
| Geo Computers GeoFlex 140 | |
| XIDU PhilBook Max | |
| Cinebench R15 / CPU Single 64Bit | |
| Average of class Convertible (149.8 - 317, n=48, last 2 years) | |
| Asus Vivobook 15 F512DA-SH31 | |
| Asus BR1100FKA-BP0109RA | |
| Lenovo IdeaPad Flex 3 11IGL05 | |
| Average Intel Celeron N4020 (68.6 - 78.9, n=2) | |
| Chuwi Hi10 X | |
| Geo Computers GeoFlex 140 | |
| BMAX MaxBook Y11 H1M6 | |
| XIDU PhilBook Max | |
| Blender / v2.79 BMW27 CPU | |
| XIDU PhilBook Max | |
| Asus BR1100FKA-BP0109RA | |
| Lenovo IdeaPad Flex 3 11IGL05 | |
| Average Intel Celeron N4020 (n=1) | |
| Chuwi Hi10 X | |
| BMAX MaxBook Y11 H1M6 | |
| Asus Vivobook 15 F512DA-SH31 | |
| Average of class Convertible (105 - 1051, n=48, last 2 years) | |
| 7-Zip 18.03 / 7z b 4 | |
| Average of class Convertible (12977 - 121368, n=48, last 2 years) | |
| Asus Vivobook 15 F512DA-SH31 | |
| BMAX MaxBook Y11 H1M6 | |
| Chuwi Hi10 X | |
| Asus BR1100FKA-BP0109RA | |
| Lenovo IdeaPad Flex 3 11IGL05 | |
| Average Intel Celeron N4020 (n=1) | |
| XIDU PhilBook Max | |
| 7-Zip 18.03 / 7z b 4 -mmt1 | |
| Average of class Convertible (3672 - 6655, n=48, last 2 years) | |
| Asus Vivobook 15 F512DA-SH31 | |
| Asus BR1100FKA-BP0109RA | |
| Lenovo IdeaPad Flex 3 11IGL05 | |
| Average Intel Celeron N4020 (n=1) | |
| Chuwi Hi10 X | |
| BMAX MaxBook Y11 H1M6 | |
| XIDU PhilBook Max | |
| Geekbench 5.5 / Multi-Core | |
| Average of class Convertible (1608 - 22023, n=48, last 2 years) | |
| Asus Vivobook 15 F512DA-SH31 | |
| BMAX MaxBook Y11 H1M6 | |
| Chuwi Hi10 X | |
| Lenovo IdeaPad Flex 3 11IGL05 | |
| Geo Computers GeoFlex 140 | |
| Geo Computers GeoFlex 140 | |
| Average Intel Celeron N4020 (663 - 858, n=3) | |
| Asus BR1100FKA-BP0109RA | |
| Geekbench 5.5 / Single-Core | |
| Average of class Convertible (806 - 2275, n=48, last 2 years) | |
| Asus Vivobook 15 F512DA-SH31 | |
| Lenovo IdeaPad Flex 3 11IGL05 | |
| Geo Computers GeoFlex 140 | |
| Geo Computers GeoFlex 140 | |
| Average Intel Celeron N4020 (319 - 475, n=3) | |
| Chuwi Hi10 X | |
| Asus BR1100FKA-BP0109RA | |
| BMAX MaxBook Y11 H1M6 | |
| HWBOT x265 Benchmark v2.2 / 4k Preset | |
| Average of class Convertible (3.43 - 36.2, n=48, last 2 years) | |
| Asus Vivobook 15 F512DA-SH31 | |
| BMAX MaxBook Y11 H1M6 | |
| Chuwi Hi10 X | |
| Lenovo IdeaPad Flex 3 11IGL05 | |
| Average Intel Celeron N4020 (0.73 - 0.92, n=2) | |
| Asus BR1100FKA-BP0109RA | |
| Geo Computers GeoFlex 140 | |
| XIDU PhilBook Max | |
| LibreOffice / 20 Documents To PDF | |
| Asus BR1100FKA-BP0109RA | |
| BMAX MaxBook Y11 H1M6 | |
| Chuwi Hi10 X | |
| Lenovo IdeaPad Flex 3 11IGL05 | |
| Average Intel Celeron N4020 (n=1) | |
| Asus Vivobook 15 F512DA-SH31 | |
| Average of class Convertible (42.5 - 84.3, n=48, last 2 years) | |
| R Benchmark 2.5 / Overall mean | |
| Asus BR1100FKA-BP0109RA | |
| BMAX MaxBook Y11 H1M6 | |
| Chuwi Hi10 X | |
| Lenovo IdeaPad Flex 3 11IGL05 | |
| Average Intel Celeron N4020 (n=1) | |
| Asus Vivobook 15 F512DA-SH31 | |
| Average of class Convertible (0.3915 - 0.84, n=48, last 2 years) | |
* ... smaller is better
AIDA64: FP32 Ray-Trace | FPU Julia | CPU SHA3 | CPU Queen | FPU SinJulia | FPU Mandel | CPU AES | CPU ZLib | FP64 Ray-Trace | CPU PhotoWorxx
| Performance rating | |
| Average of class Convertible | |
| Asus Vivobook 15 F512DA-SH31 | |
| BMAX MaxBook Y11 H1M6 | |
| Chuwi Hi10 X | |
| Geo Computers GeoFlex 140 | |
| Average Intel Celeron N4020 | |
| XIDU PhilBook Max -1! | |
| Asus BR1100FKA-BP0109RA | |
| AIDA64 / FP32 Ray-Trace | |
| Average of class Convertible (1480 - 64158, n=48, last 2 years) | |
| Asus Vivobook 15 F512DA-SH31 | |
| BMAX MaxBook Y11 H1M6 | |
| BMAX MaxBook Y11 H1M6 | |
| BMAX MaxBook Y11 H1M6 | |
| Chuwi Hi10 X | |
| Geo Computers GeoFlex 140 | |
| Average Intel Celeron N4020 (n=1) | |
| XIDU PhilBook Max | |
| Asus BR1100FKA-BP0109RA | |
| AIDA64 / FPU Julia | |
| Average of class Convertible (11392 - 184800, n=48, last 2 years) | |
| Asus Vivobook 15 F512DA-SH31 | |
| BMAX MaxBook Y11 H1M6 | |
| BMAX MaxBook Y11 H1M6 | |
| BMAX MaxBook Y11 H1M6 | |
| Chuwi Hi10 X | |
| XIDU PhilBook Max | |
| Geo Computers GeoFlex 140 | |
| Average Intel Celeron N4020 (n=1) | |
| Asus BR1100FKA-BP0109RA | |
| AIDA64 / CPU SHA3 | |
| Average of class Convertible (797 - 8291, n=48, last 2 years) | |
| Asus Vivobook 15 F512DA-SH31 | |
| BMAX MaxBook Y11 H1M6 | |
| BMAX MaxBook Y11 H1M6 | |
| BMAX MaxBook Y11 H1M6 | |
| Chuwi Hi10 X | |
| Geo Computers GeoFlex 140 | |
| Average Intel Celeron N4020 (n=1) | |
| Asus BR1100FKA-BP0109RA | |
| AIDA64 / CPU Queen | |
| Average of class Convertible (14686 - 148874, n=41, last 2 years) | |
| Asus Vivobook 15 F512DA-SH31 | |
| BMAX MaxBook Y11 H1M6 | |
| BMAX MaxBook Y11 H1M6 | |
| Chuwi Hi10 X | |
| Geo Computers GeoFlex 140 | |
| Average Intel Celeron N4020 (n=1) | |
| XIDU PhilBook Max | |
| Asus BR1100FKA-BP0109RA | |
| AIDA64 / FPU SinJulia | |
| Average of class Convertible (1120 - 29155, n=48, last 2 years) | |
| Asus Vivobook 15 F512DA-SH31 | |
| BMAX MaxBook Y11 H1M6 | |
| BMAX MaxBook Y11 H1M6 | |
| BMAX MaxBook Y11 H1M6 | |
| Chuwi Hi10 X | |
| Geo Computers GeoFlex 140 | |
| Average Intel Celeron N4020 (n=1) | |
| XIDU PhilBook Max | |
| Asus BR1100FKA-BP0109RA | |
| AIDA64 / FPU Mandel | |
| Average of class Convertible (4929 - 97193, n=48, last 2 years) | |
| Asus Vivobook 15 F512DA-SH31 | |
| BMAX MaxBook Y11 H1M6 | |
| BMAX MaxBook Y11 H1M6 | |
| BMAX MaxBook Y11 H1M6 | |
| Chuwi Hi10 X | |
| XIDU PhilBook Max | |
| Geo Computers GeoFlex 140 | |
| Average Intel Celeron N4020 (n=1) | |
| Asus BR1100FKA-BP0109RA | |
| AIDA64 / CPU AES | |
| Average of class Convertible (5271 - 190280, n=48, last 2 years) | |
| Asus Vivobook 15 F512DA-SH31 | |
| BMAX MaxBook Y11 H1M6 | |
| BMAX MaxBook Y11 H1M6 | |
| BMAX MaxBook Y11 H1M6 | |
| Chuwi Hi10 X | |
| Geo Computers GeoFlex 140 | |
| Average Intel Celeron N4020 (n=1) | |
| XIDU PhilBook Max | |
| Asus BR1100FKA-BP0109RA | |
| AIDA64 / CPU ZLib | |
| Average of class Convertible (218 - 2017, n=48, last 2 years) | |
| Asus Vivobook 15 F512DA-SH31 | |
| BMAX MaxBook Y11 H1M6 | |
| BMAX MaxBook Y11 H1M6 | |
| BMAX MaxBook Y11 H1M6 | |
| Chuwi Hi10 X | |
| Geo Computers GeoFlex 140 | |
| Average Intel Celeron N4020 (n=1) | |
| XIDU PhilBook Max | |
| Asus BR1100FKA-BP0109RA | |
| AIDA64 / FP64 Ray-Trace | |
| Average of class Convertible (1169 - 34297, n=48, last 2 years) | |
| Asus Vivobook 15 F512DA-SH31 | |
| BMAX MaxBook Y11 H1M6 | |
| BMAX MaxBook Y11 H1M6 | |
| BMAX MaxBook Y11 H1M6 | |
| Chuwi Hi10 X | |
| Geo Computers GeoFlex 140 | |
| Average Intel Celeron N4020 (n=1) | |
| XIDU PhilBook Max | |
| Asus BR1100FKA-BP0109RA | |
| AIDA64 / CPU PhotoWorxx | |
| Average of class Convertible (14193 - 85327, n=48, last 2 years) | |
| Asus Vivobook 15 F512DA-SH31 | |
| BMAX MaxBook Y11 H1M6 | |
| BMAX MaxBook Y11 H1M6 | |
| BMAX MaxBook Y11 H1M6 | |
| Chuwi Hi10 X | |
| Geo Computers GeoFlex 140 | |
| Average Intel Celeron N4020 (n=1) | |
| XIDU PhilBook Max | |
| Asus BR1100FKA-BP0109RA | |
系统性能
在PCMark10和CrossMark中,结果处于双核处理器的预期低水平。使用 英特尔赛扬N4020在日常使用中,用英特尔赛扬N4020可以做很多事情,但一旦涉及到较重的任务,如在基准测试中,笔记本电脑就会明显暴露出它的弱点。在实践中,事实证明,许多打开的程序明显减慢了GeoFlex 140的速度。然而,当你把它限制在浏览器和办公程序上时,就很难注意到这台敞篷车的低性能。
CrossMark: Overall | Productivity | Creativity | Responsiveness
| PCMark 10 / Score | |
| Average of class Convertible (3229 - 10123, n=45, last 2 years) | |
| Asus Vivobook 15 F512DA-SH31 | |
| BMAX MaxBook Y11 H1M6 | |
| Chuwi Hi10 X | |
| Lenovo IdeaPad Flex 3 11IGL05 | |
| Average Intel Celeron N4020, Intel UHD Graphics 600 (1486 - 1521, n=2) | |
| Geo Computers GeoFlex 140 | |
| Asus BR1100FKA-BP0109RA | |
| XIDU PhilBook Max | |
| PCMark 10 / Essentials | |
| Average of class Convertible (7233 - 12222, n=45, last 2 years) | |
| Asus Vivobook 15 F512DA-SH31 | |
| BMAX MaxBook Y11 H1M6 | |
| Chuwi Hi10 X | |
| Geo Computers GeoFlex 140 | |
| Average Intel Celeron N4020, Intel UHD Graphics 600 (3833 - 3975, n=2) | |
| Lenovo IdeaPad Flex 3 11IGL05 | |
| Asus BR1100FKA-BP0109RA | |
| XIDU PhilBook Max | |
| PCMark 10 / Productivity | |
| Average of class Convertible (5062 - 17914, n=45, last 2 years) | |
| Asus Vivobook 15 F512DA-SH31 | |
| Geo Computers GeoFlex 140 | |
| Average Intel Celeron N4020, Intel UHD Graphics 600 (2638 - 2764, n=2) | |
| Lenovo IdeaPad Flex 3 11IGL05 | |
| BMAX MaxBook Y11 H1M6 | |
| Chuwi Hi10 X | |
| Asus BR1100FKA-BP0109RA | |
| XIDU PhilBook Max | |
| PCMark 10 / Digital Content Creation | |
| Average of class Convertible (2496 - 16551, n=45, last 2 years) | |
| Asus Vivobook 15 F512DA-SH31 | |
| Lenovo IdeaPad Flex 3 11IGL05 | |
| BMAX MaxBook Y11 H1M6 | |
| Asus BR1100FKA-BP0109RA | |
| Chuwi Hi10 X | |
| Average Intel Celeron N4020, Intel UHD Graphics 600 (811 - 946, n=2) | |
| Geo Computers GeoFlex 140 | |
| XIDU PhilBook Max | |
| CrossMark / Overall | |
| Average of class Convertible (524 - 2274, n=49, last 2 years) | |
| Geo Computers GeoFlex 140 | |
| Average Intel Celeron N4020, Intel UHD Graphics 600 (n=1) | |
| CrossMark / Productivity | |
| Average of class Convertible (554 - 1942, n=49, last 2 years) | |
| Geo Computers GeoFlex 140 | |
| Average Intel Celeron N4020, Intel UHD Graphics 600 (n=1) | |
| CrossMark / Creativity | |
| Average of class Convertible (550 - 2949, n=49, last 2 years) | |
| Geo Computers GeoFlex 140 | |
| Average Intel Celeron N4020, Intel UHD Graphics 600 (n=1) | |
| CrossMark / Responsiveness | |
| Average of class Convertible (381 - 1719, n=49, last 2 years) | |
| Geo Computers GeoFlex 140 | |
| Average Intel Celeron N4020, Intel UHD Graphics 600 (n=1) | |
| PCMark 10 Score | 1486 points | |
Help | ||
| AIDA64 / Memory Copy | |
| Average of class Convertible (23880 - 161475, n=48, last 2 years) | |
| Geo Computers GeoFlex 140 | |
| Average Intel Celeron N4020 (n=1) | |
| Asus Vivobook 15 F512DA-SH31 | |
| XIDU PhilBook Max | |
| BMAX MaxBook Y11 H1M6 | |
| BMAX MaxBook Y11 H1M6 | |
| BMAX MaxBook Y11 H1M6 | |
| Chuwi Hi10 X | |
| Asus BR1100FKA-BP0109RA | |
| AIDA64 / Memory Read | |
| Average of class Convertible (19931 - 131960, n=48, last 2 years) | |
| Asus Vivobook 15 F512DA-SH31 | |
| Geo Computers GeoFlex 140 | |
| Average Intel Celeron N4020 (n=1) | |
| BMAX MaxBook Y11 H1M6 | |
| BMAX MaxBook Y11 H1M6 | |
| BMAX MaxBook Y11 H1M6 | |
| XIDU PhilBook Max | |
| Chuwi Hi10 X | |
| Asus BR1100FKA-BP0109RA | |
| AIDA64 / Memory Write | |
| Average of class Convertible (17473 - 216896, n=48, last 2 years) | |
| Asus Vivobook 15 F512DA-SH31 | |
| BMAX MaxBook Y11 H1M6 | |
| BMAX MaxBook Y11 H1M6 | |
| BMAX MaxBook Y11 H1M6 | |
| Chuwi Hi10 X | |
| Geo Computers GeoFlex 140 | |
| Average Intel Celeron N4020 (n=1) | |
| XIDU PhilBook Max | |
| Asus BR1100FKA-BP0109RA | |
| AIDA64 / Memory Latency | |
| Asus BR1100FKA-BP0109RA | |
| Average of class Convertible (6.9 - 536, n=47, last 2 years) | |
| XIDU PhilBook Max | |
| BMAX MaxBook Y11 H1M6 | |
| BMAX MaxBook Y11 H1M6 | |
| BMAX MaxBook Y11 H1M6 | |
| Asus Vivobook 15 F512DA-SH31 | |
| Chuwi Hi10 X | |
| Geo Computers GeoFlex 140 | |
| Average Intel Celeron N4020 (n=1) | |
* ... smaller is better
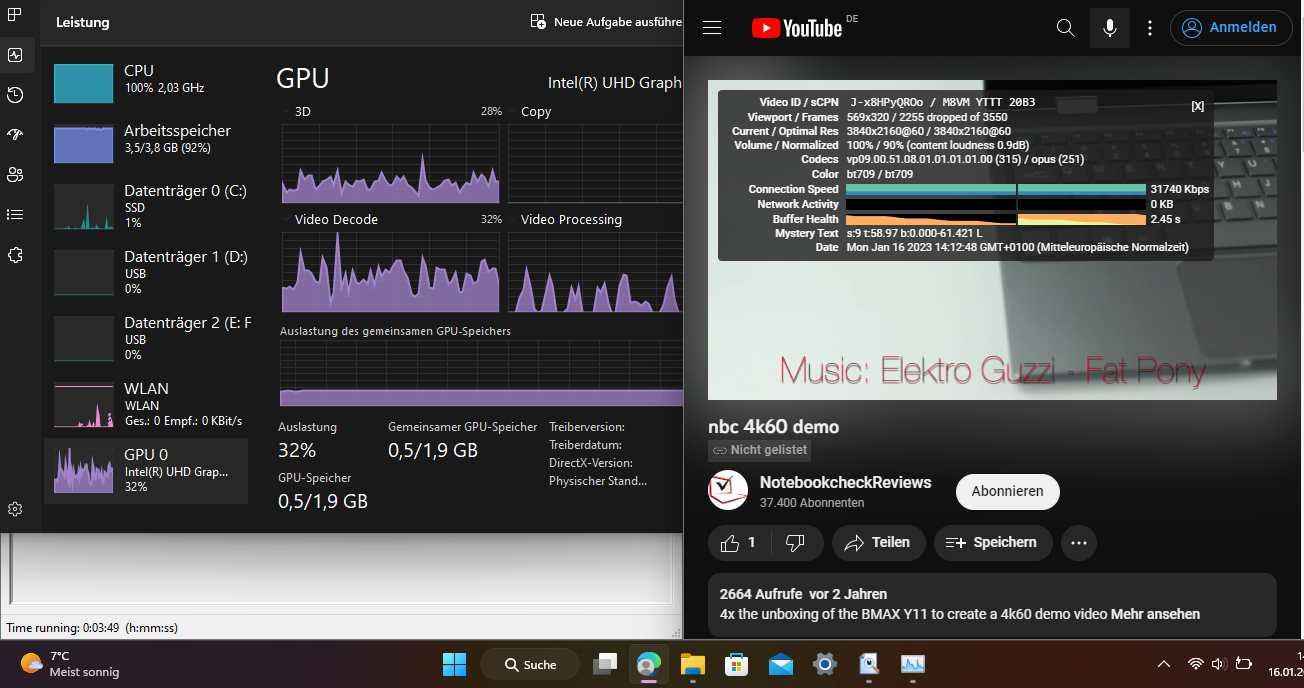
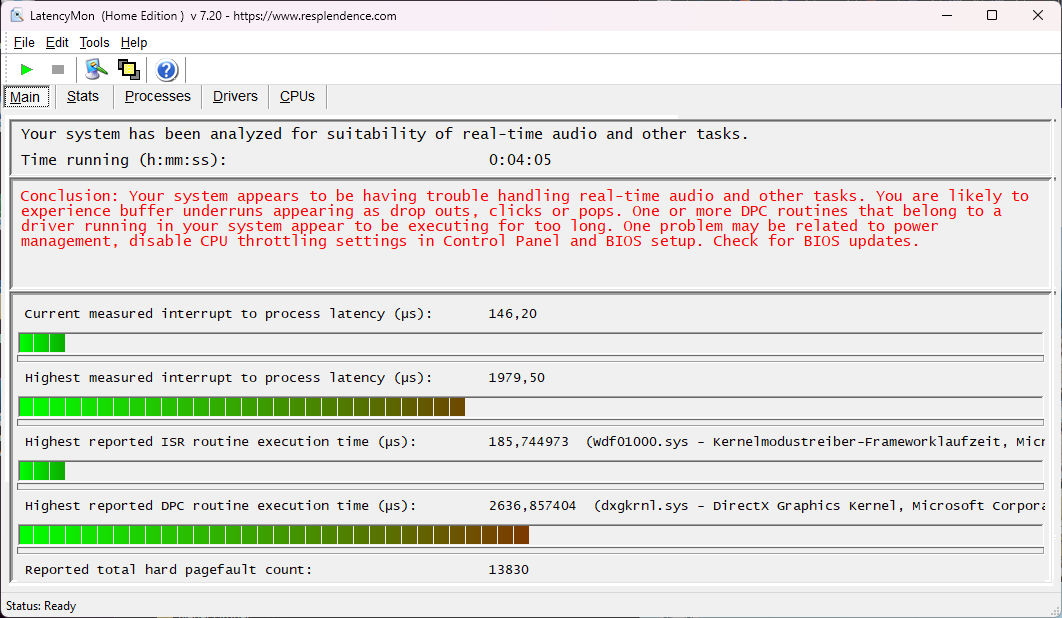
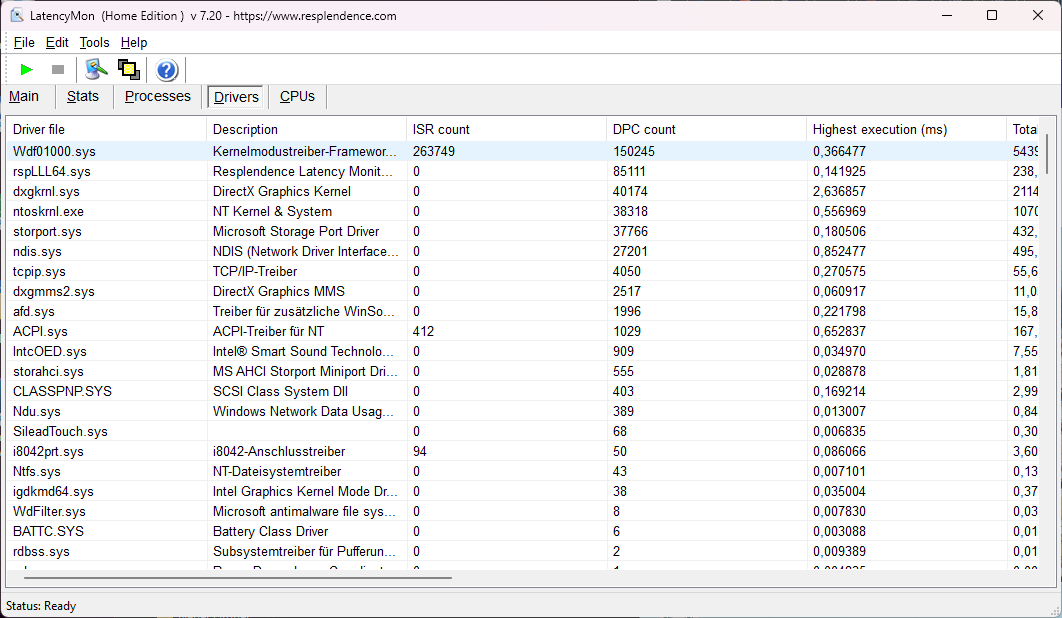
DPC延迟
由于只有两个核心,Windows很难在正确的时间执行所有任务。这导致了高DPC延迟。在YouTube 4K60 Hz的视频中,笔记本电脑省略了三分之二的帧。英特尔赛扬N4020和它的iGPU不能提供足够的性能来流畅地渲染这种高分辨率的视频。GeoFlex 140在播放高清或全高清视频时没有任何问题。
| DPC Latencies / LatencyMon - interrupt to process latency (max), Web, Youtube, Prime95 | |
| Asus BR1100FKA-BP0109RA | |
| Lenovo IdeaPad Flex 3 11IGL05 | |
| BMAX MaxBook Y11 H1M6 | |
| Chuwi Hi10 X | |
| Asus Vivobook 15 F512DA-SH31 | |
* ... smaller is better
大容量存储
谈到所使用的存储技术,GeoFlex 140比许多竞争对手要领先一些。虽然其他一些廉价的笔记本电脑依赖焊接的eMMC存储,但GeoFlex 140至少有一个M.2 SATA固态硬盘。这也可以进行交换。然而,在实践中,SCY C500 SNS1N3G12800D M.2 SATA并不意味着与采用eMMC存储的对手相比,笔记本电脑的速度优势明显。

| Drive Performance rating - Percent | |
| Average of class Convertible | |
| Asus Vivobook 15 F512DA-SH31 | |
| Average SCY C500 SNS1N3G12800D M.2 SATA | |
| Geo Computers GeoFlex 140 | |
| BMAX MaxBook Y11 H1M6 | |
| Asus BR1100FKA-BP0109RA | |
| Lenovo IdeaPad Flex 3 11IGL05 | |
| Chuwi Hi10 X | |
* ... smaller is better
Continuous power: DiskSpd Read Loop, Queue Depth 8
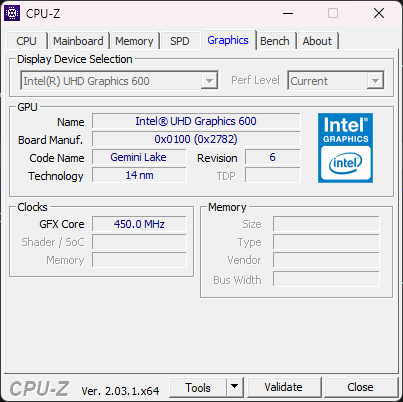
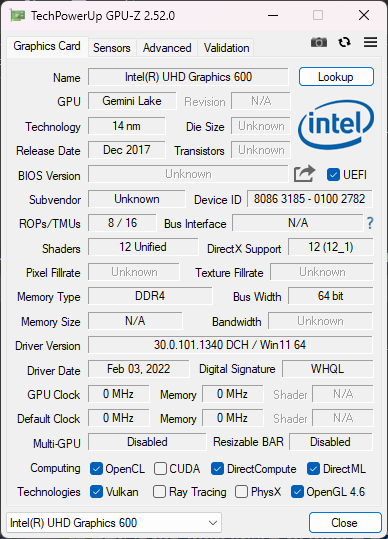
图形卡
英特尔赛扬N4020配备了英特尔UHD Graphics 600是集成的。这并不强大,不足以满足现代3D游戏的要求。我们在测试中也很清楚地确定了这一点。最多,笔记本电脑可以在倒数第二个十年的游戏中达到可玩的帧率。使用Blender、V-Ray和GPUScore的基准测试完全使笔记本电脑屈服。例如,我们停止了GPUScore。神圣之路》半小时后就停止了。由于CPU和iGPU必须共享6瓦特,当游戏同时对处理器有很大需求时,图形性能就会崩溃。
| 3DMark 11 - 1280x720 Performance GPU | |
| Average of class Convertible (1505 - 40732, n=48, last 2 years) | |
| Asus Vivobook 15 F512DA-SH31 | |
| Average Intel UHD Graphics 600 (410 - 854, n=27) | |
| Asus BR1100FKA-BP0109RA | |
| Lenovo IdeaPad Flex 3 11IGL05 | |
| Chuwi Hi10 X | |
| Geo Computers GeoFlex 140 | |
| BMAX MaxBook Y11 H1M6 | |
| 3DMark | |
| 1920x1080 Fire Strike Graphics | |
| Average of class Convertible (1185 - 27447, n=48, last 2 years) | |
| Asus Vivobook 15 F512DA-SH31 | |
| Average Intel UHD Graphics 600 (307 - 637, n=21) | |
| Asus BR1100FKA-BP0109RA | |
| Lenovo IdeaPad Flex 3 11IGL05 | |
| Geo Computers GeoFlex 140 | |
| Chuwi Hi10 X | |
| BMAX MaxBook Y11 H1M6 | |
| XIDU PhilBook Max | |
| 2560x1440 Time Spy Graphics | |
| Average of class Convertible (327 - 10434, n=51, last 2 years) | |
| Asus Vivobook 15 F512DA-SH31 | |
| Asus BR1100FKA-BP0109RA | |
| Average Intel UHD Graphics 600 (85 - 124, n=12) | |
| Chuwi Hi10 X | |
| Geo Computers GeoFlex 140 | |
| BMAX MaxBook Y11 H1M6 | |
| 1280x720 Cloud Gate Standard Graphics | |
| Average of class Convertible (7885 - 57566, n=32, last 2 years) | |
| Asus Vivobook 15 F512DA-SH31 | |
| Asus BR1100FKA-BP0109RA | |
| Average Intel UHD Graphics 600 (2346 - 4958, n=20) | |
| BMAX MaxBook Y11 H1M6 | |
| Geo Computers GeoFlex 140 | |
| Chuwi Hi10 X | |
| 3DMark 11 Performance | 530 points | |
| 3DMark Cloud Gate Standard Score | 2298 points | |
| 3DMark Fire Strike Score | 352 points | |
| 3DMark Time Spy Score | 106 points | |
Help | ||
| low | med. | high | ultra | |
|---|---|---|---|---|
| Counter-Strike: GO (2012) | 15 | |||
| Dota 2 Reborn (2015) | 15.5 | 6.9 | 5.5 | 5.4 |
| Final Fantasy XV Benchmark (2018) | 3.56 | |||
| X-Plane 11.11 (2018) | 4.16 | 3.91 |
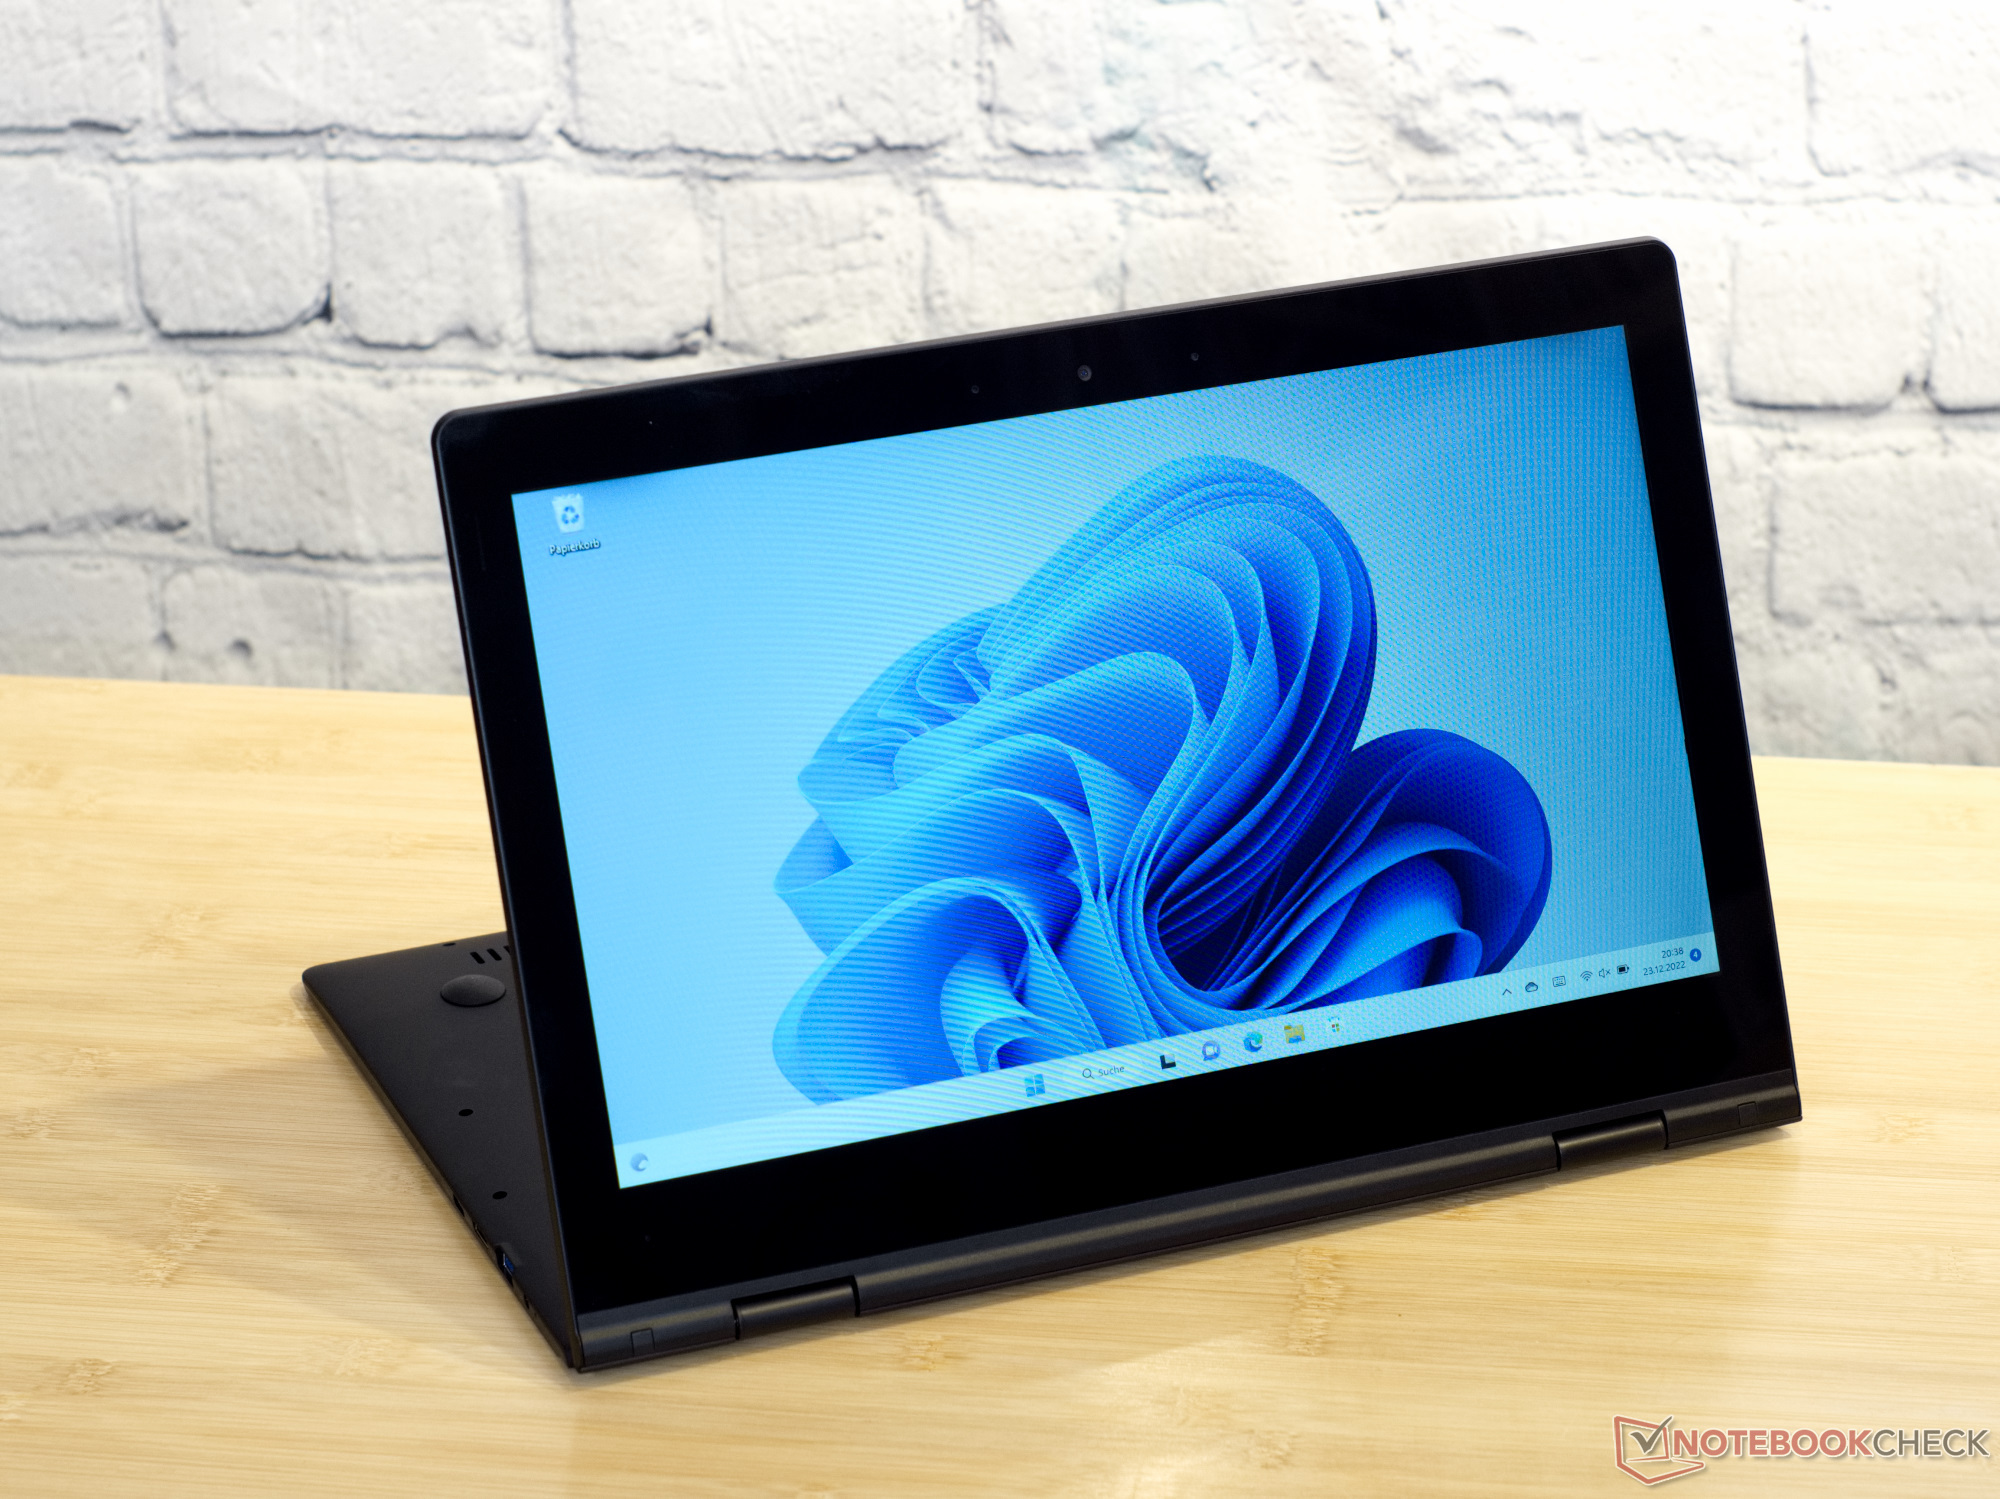
排放--安静的二合一笔记本电脑
噪声排放
与几乎所有的竞争设备一样,GeoFlex 140没有风扇或其他移动部件。即使是线圈的呜呜声或类似的声音也无法从笔记本上察觉。因此,可折叠式设备可以无声地运行。
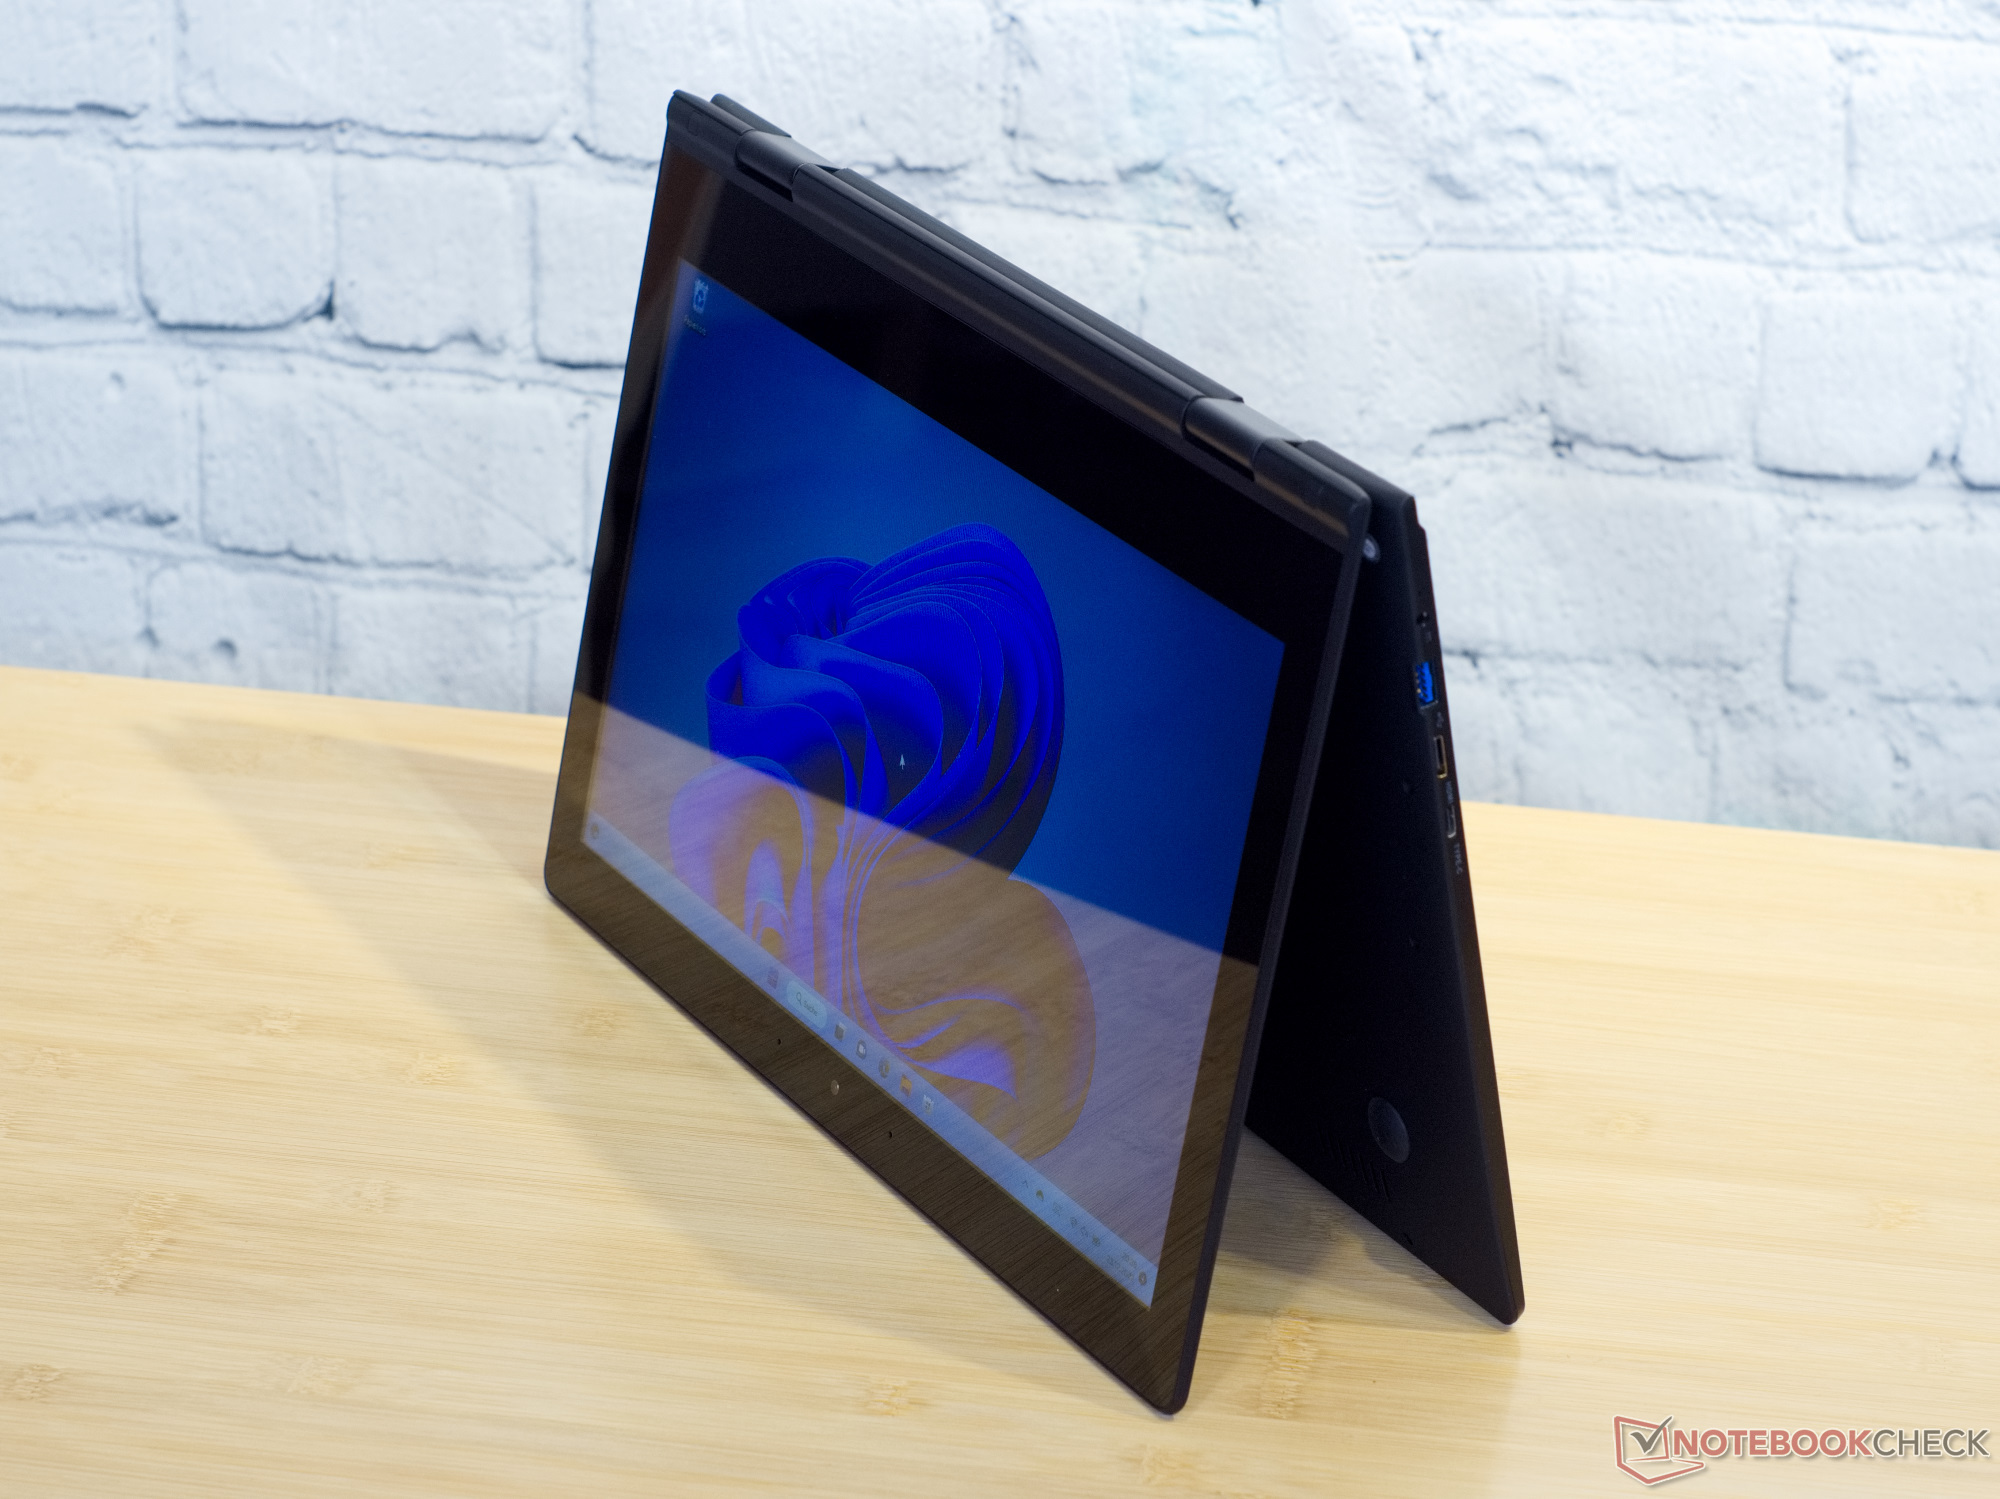
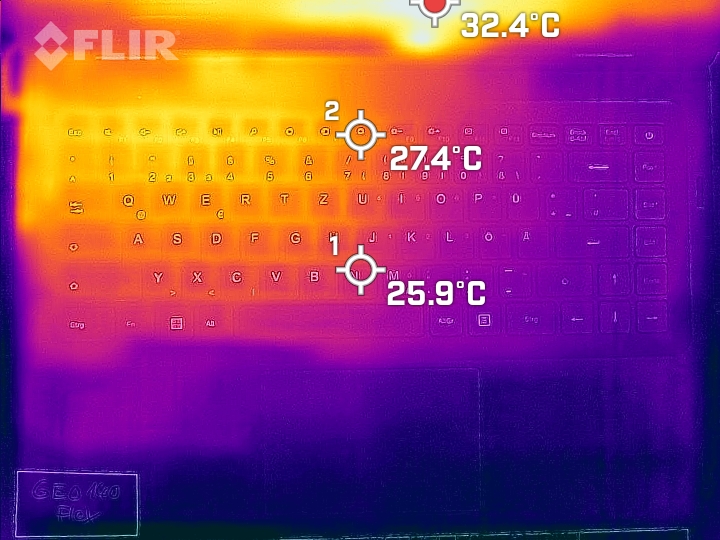
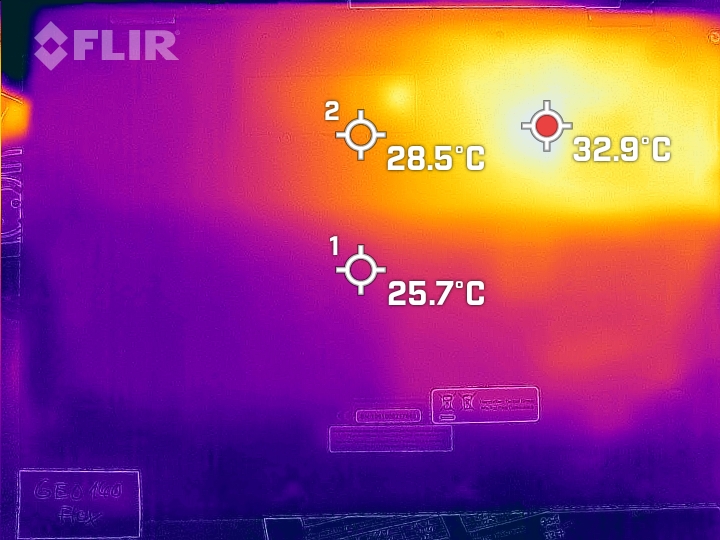
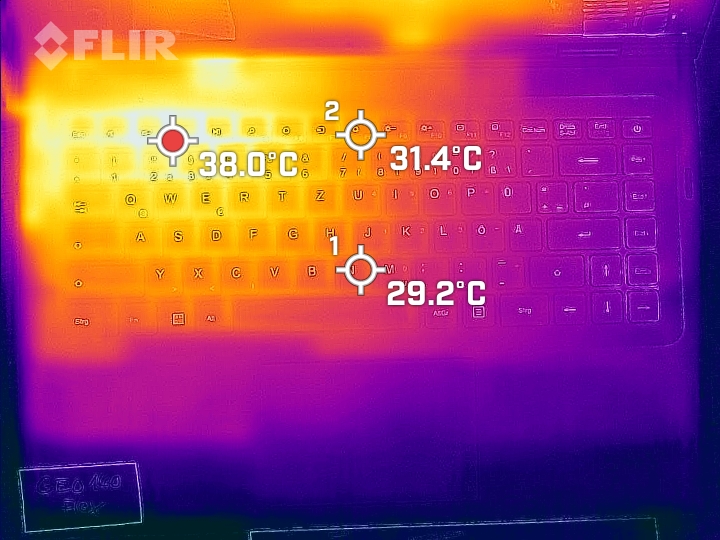
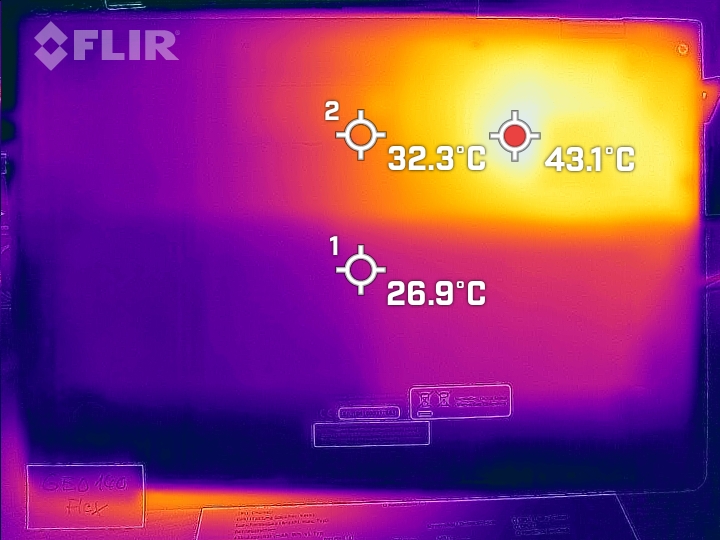
温度
这款敞篷车最多可以转换24瓦的功率。然而,这种低功率导致笔记本电脑的表面大幅升温。我们在底部测量到高达48℃(118.4°F)。由于一块相对较大的铜板将处理器的热量散发出去,机箱不仅在某些地方发热,GeoFlex 140底部几乎有四分之一的地方可以形成令人不舒服的高温。
(+) The maximum temperature on the upper side is 39.7 °C / 103 F, compared to the average of 35.4 °C / 96 F, ranging from 19.6 to 60 °C for the class Convertible.
(-) The bottom heats up to a maximum of 47.4 °C / 117 F, compared to the average of 36.9 °C / 98 F
(+) In idle usage, the average temperature for the upper side is 25.4 °C / 78 F, compared to the device average of 30.3 °C / 87 F.
(+) The palmrests and touchpad are cooler than skin temperature with a maximum of 26.2 °C / 79.2 F and are therefore cool to the touch.
(±) The average temperature of the palmrest area of similar devices was 28 °C / 82.4 F (+1.8 °C / 3.2 F).
| Geo Computers GeoFlex 140 Intel Celeron N4020, Intel UHD Graphics 600 | Asus BR1100FKA-BP0109RA Intel Celeron N4500, Intel UHD Graphics (Jasper Lake 16 EU) | Lenovo IdeaPad Flex 3 11IGL05 Intel Celeron N4020, Intel UHD Graphics 600 | Chuwi Hi10 X Intel Celeron N4100, Intel UHD Graphics 600 | BMAX MaxBook Y11 H1M6 Intel Celeron N4100, Intel UHD Graphics 600 | XIDU PhilBook Max Intel Celeron J3355, Intel HD Graphics 500 | Asus Vivobook 15 F512DA-SH31 AMD Ryzen 3 3200U, AMD Radeon RX Vega 3 | |
|---|---|---|---|---|---|---|---|
| Heat | 8% | 13% | 2% | 15% | 9% | 10% | |
| Maximum Upper Side * (°C) | 39.7 | 39.3 1% | 37.4 6% | 41.8 -5% | 37 7% | 44.3 -12% | 33 17% |
| Maximum Bottom * (°C) | 47.4 | 42 11% | 41.4 13% | 42.8 10% | 38 20% | 42.8 10% | 41.4 13% |
| Idle Upper Side * (°C) | 30.9 | 28.4 8% | 27.2 12% | 33 -7% | 27 13% | 26.4 15% | 29 6% |
| Idle Bottom * (°C) | 34.1 | 30.4 11% | 27 21% | 31 9% | 27 21% | 26.4 23% | 32.4 5% |
* ... smaller is better
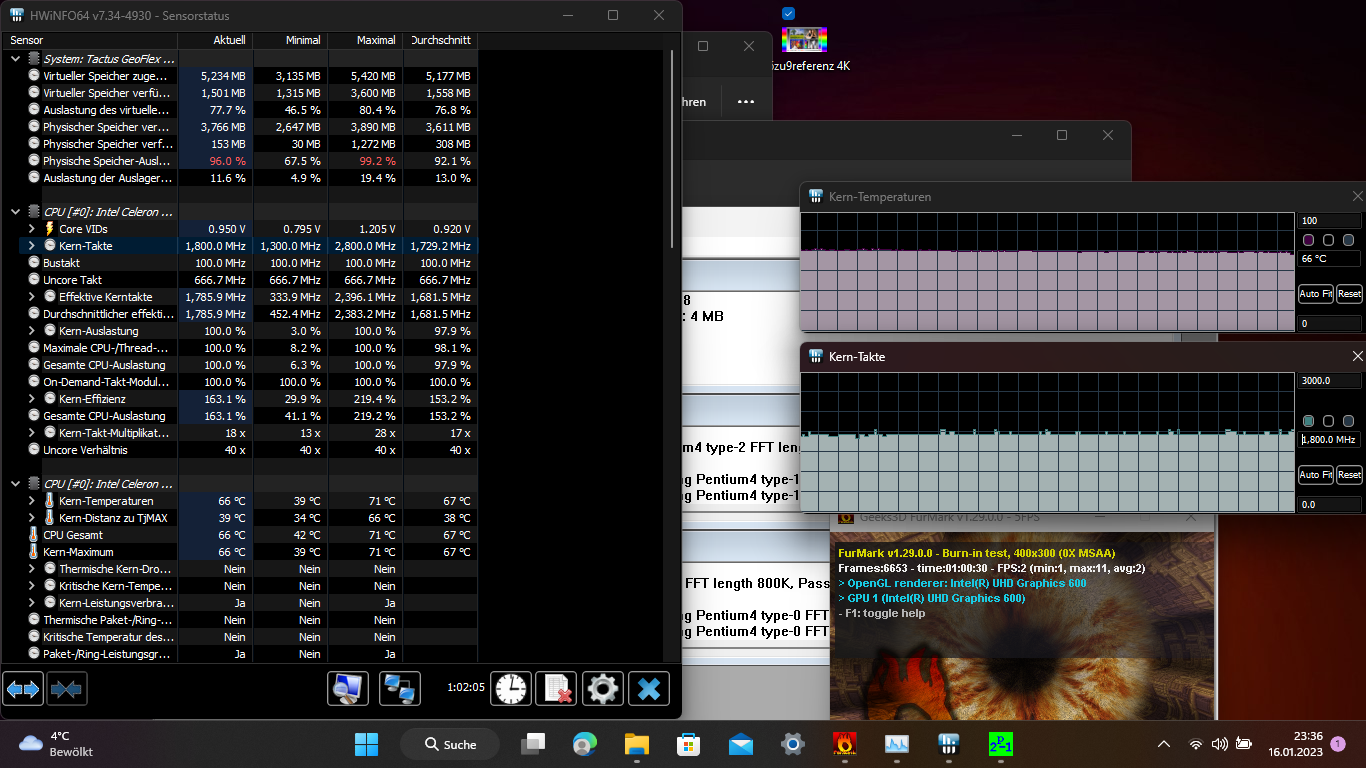
压力测试
二合一笔记本电脑可以在整个压力测试中保持其性能。虽然这很低,但不会导致过热。以其6瓦的功率,处理器加热到约70℃(158°F)。
演讲者
GeoFlex 140的扬声器是可以接受的,除了低音之外,听起来相对平衡。这里的低频简直太弱了,就像许多笔记本电脑一样。在80dB(A)时,敞篷车的扬声器不会太响,但听起来一点也不尖锐。
Geo Computers GeoFlex 140 audio analysis
(±) | speaker loudness is average but good (79.9 dB)
Bass 100 - 315 Hz
(-) | nearly no bass - on average 22.3% lower than median
(±) | linearity of bass is average (7.8% delta to prev. frequency)
Mids 400 - 2000 Hz
(±) | higher mids - on average 5.5% higher than median
(±) | linearity of mids is average (8.8% delta to prev. frequency)
Highs 2 - 16 kHz
(±) | higher highs - on average 5.8% higher than median
(±) | linearity of highs is average (9.5% delta to prev. frequency)
Overall 100 - 16.000 Hz
(±) | linearity of overall sound is average (21.7% difference to median)
Compared to same class
» 59% of all tested devices in this class were better, 10% similar, 31% worse
» The best had a delta of 6%, average was 20%, worst was 57%
Compared to all devices tested
» 61% of all tested devices were better, 7% similar, 31% worse
» The best had a delta of 4%, average was 24%, worst was 134%
Lenovo IdeaPad Flex 3 11IGL05 audio analysis
(-) | not very loud speakers (71.1 dB)
Bass 100 - 315 Hz
(-) | nearly no bass - on average 18.6% lower than median
(±) | linearity of bass is average (9.7% delta to prev. frequency)
Mids 400 - 2000 Hz
(+) | balanced mids - only 4.7% away from median
(±) | linearity of mids is average (10.2% delta to prev. frequency)
Highs 2 - 16 kHz
(+) | balanced highs - only 0.9% away from median
(+) | highs are linear (3.8% delta to prev. frequency)
Overall 100 - 16.000 Hz
(±) | linearity of overall sound is average (20.1% difference to median)
Compared to same class
» 51% of all tested devices in this class were better, 6% similar, 44% worse
» The best had a delta of 6%, average was 20%, worst was 57%
Compared to all devices tested
» 52% of all tested devices were better, 8% similar, 40% worse
» The best had a delta of 4%, average was 24%, worst was 134%
电源管理--节能笔记本电脑
消耗功率
笔记本电脑不需要太多的电力。附带的24瓦电源只需要在短时间内超过其规定的功率限制。在负载情况下,经过短暂的升压时间,耗电量约为15瓦。空闲时,GeoFlex 140需要6瓦。与大多数转换器相比,这些都是非常低的功耗,但采用英特尔赛扬处理器的笔记本电脑和转换器可以更加节能。所有采用赛扬处理器的对比设备所需的能量都明显较少。
| Off / Standby | |
| Idle | |
| Load |
|
Key:
min: | |
| Geo Computers GeoFlex 140 Celeron N4020, UHD Graphics 600, SCY C500 SNS1N3G12800D M.2 SATA, TN, 1366x768, 14.1" | Asus BR1100FKA-BP0109RA Celeron N4500, UHD Graphics (Jasper Lake 16 EU), 64 GB eMMC Flash, IPS, 1366x768, 11.6" | Lenovo IdeaPad Flex 3 11IGL05 Celeron N4020, UHD Graphics 600, SanDisk DA4064, IPS LED, 1366x768, 11.6" | Chuwi Hi10 X Celeron N4100, UHD Graphics 600, SanDisk DF4128, IPS, 1920x1200, 10.1" | BMAX MaxBook Y11 H1M6 Celeron N4100, UHD Graphics 600, FORESEE 256GB, IPS, 1920x1080, 11.6" | XIDU PhilBook Max Celeron J3355, HD Graphics 500, FORESEE 128GB O1229B, IPS, 1920x1080, 14.1" | Asus Vivobook 15 F512DA-SH31 R3 3200U, Vega 3, SanDisk X600 SD9SN8W-128G, IPS, 1920x1080, 15.6" | Average Intel UHD Graphics 600 | Average of class Convertible | |
|---|---|---|---|---|---|---|---|---|---|
| Power Consumption | 48% | 42% | 27% | 12% | 10% | -33% | 26% | -65% | |
| Idle Minimum * (Watt) | 5.2 | 2.5 52% | 2.4 54% | 3.7 29% | 4.1 21% | 4.6 12% | 3.2 38% | 3.47 ? 33% | 4.29 ? 17% |
| Idle Average * (Watt) | 8.8 | 4.6 48% | 4.5 49% | 6.3 28% | 7.7 12% | 6.4 27% | 6.8 23% | 5.61 ? 36% | 7.08 ? 20% |
| Idle Maximum * (Watt) | 9.8 | 5.3 46% | 4.6 53% | 6.7 32% | 9 8% | 8.7 11% | 7.7 21% | 6.6 ? 33% | 8.68 ? 11% |
| Load Average * (Watt) | 14.6 | 12.8 12% | 14 4% | 14.5 1% | 16.2 -11% | 30.3 -108% | 13.6 ? 7% | 44 ? -201% | |
| Witcher 3 ultra * (Watt) | 14.7 | 28.2 -92% | |||||||
| Load Maximum * (Watt) | 24.9 | 13.4 46% | 14.3 43% | 14.5 42% | 21 16% | 22 12% | 44.4 -78% | 20.2 ? 19% | 67.3 ? -170% |
* ... smaller is better
Energy consumption Witcher 3 / Stress test
电池寿命
GeoFlex 140的电池容量为41.8Wh,明显大于其他竞争设备的电池,除了华硕BR1100FKA之外。华硕BR1100FKA.然而,更慷慨的电池似乎并没有提供更长的电池寿命。在Wi-Fi网上冲浪测试中,这款廉价的笔记本电脑可以保持五到六个小时的活动。
| Geo Computers GeoFlex 140 Celeron N4020, UHD Graphics 600, 41.8 Wh | Asus BR1100FKA-BP0109RA Celeron N4500, UHD Graphics (Jasper Lake 16 EU), 42 Wh | Lenovo IdeaPad Flex 3 11IGL05 Celeron N4020, UHD Graphics 600, 37.5 Wh | Chuwi Hi10 X Celeron N4100, UHD Graphics 600, 24 Wh | BMAX MaxBook Y11 H1M6 Celeron N4100, UHD Graphics 600, 26.6 Wh | XIDU PhilBook Max Celeron J3355, HD Graphics 500, 36.1 Wh | Asus Vivobook 15 F512DA-SH31 R3 3200U, Vega 3, 37 Wh | Average of class Convertible | |
|---|---|---|---|---|---|---|---|---|
| Battery runtime | 35% | 63% | -2% | -23% | 0% | 5% | 37% | |
| WiFi v1.3 (h) | 5.7 | 7.7 35% | 9.3 63% | 5.6 -2% | 4.1 -28% | 5.7 0% | 6 5% | 11.9 ? 109% |
| Load (h) | 2.8 | 2.3 -18% | 1.779 ? -36% | |||||
| H.264 (h) | 4.5 | 15.3 ? |
Pros
Cons
结论 - 可用的最低限度的PC

归根结底,问题在于你到底需要多少性能。如果我们想把事情简单化,我们也许可以在这里得出一个毁灭性的结论。屏幕、处理器和图形性能根本是低端的。但GeoFlex 140的低价位实际上比预期的要好。如果你只是为冲浪、流媒体或办公应用寻找一台笔记本电脑,你不需要比这台敞篷车能提供的更多性能。那些期望从笔记本电脑中获得更多,并且仍在寻找低价的人,可能最好寻找配备英特尔酷睿i3或AMD Ryzen 3的笔记本电脑。另外,二手市场也提供一些具有更强处理器的笔记本电脑,价格约为200欧元(约218美元)。然而,它们通常不符合Windows 11的要求。
与许多更强大的笔记本电脑相比,GeoFlex 140有一个优势。它的耗电量非常低。在日常使用中,GeoFlex 140可以毫无问题地使用,而且它的耗电量有时只有配备Core i5或Ryzen 5的笔记本电脑的一半。那么,强大的笔记本电脑对每个用户都有意义吗?
GeoFlex 140很苗条,提供了一个现代的外观,但在所有技术方面只显示了低性能。
应该很清楚,照片或视频编辑、3D程序和更多的东西都不能由英特尔赛扬来完成,或者在相当长的时间支出下只能在有限的范围内完成。但是,Chromebook 方法,即许多应用程序被转移到云端,也适用于Windows电脑。现在很多事情都可以通过云端应用方便地完成。
不幸的是,我们也不得不注意到,会有几个地方制造商可以用很少的努力来改善设备。在现有的USB-C端口中提供电源,一个半途校准的屏幕,以及一个HDMI端口而不是迷你HDMI,将大大改善GeoFlex 140的可用性。特别是缺少USB-PD,不必要地限制了可转换的电源适配器,因为大多数现代智能手机的电源适配器都能输出12伏和2安培的电压。为此,我们甚至很乐意不使用附带的电源适配器。
最后,如果与400至800欧元(约435至870美元)价格范围内的笔记本电脑和可转换设备相比,任何一个对比设备上可能都不会留下一根好头发。在许多基准测试中,太明显了,配备赛扬处理器的笔记本电脑只能达到最弱的Ryzen或酷睿处理器所提供性能的一半。除了内存以外,联想IdeaPad Flex 3在大多数基准测试中都比GeoFlex 140表现更好,但它的购买成本也至少高出120欧元(约131美元)。该BMAX MaxBook Y11现在也在300欧元(约326美元)的范围内,它的屏幕比我们的测试设备好得多,但有质量问题,在紧急情况下没有保修。这款敞篷车只在德国通过中国邮购公司出售。
最终,GeoFlex 140几乎是200欧元(约218美元)以下笔记本电脑的唯一选择。GeoBook 140是另一个选择,价格比敞篷车低50欧元(约54美元),也提供微软365和英特尔赛扬N4020。
价格和可用性
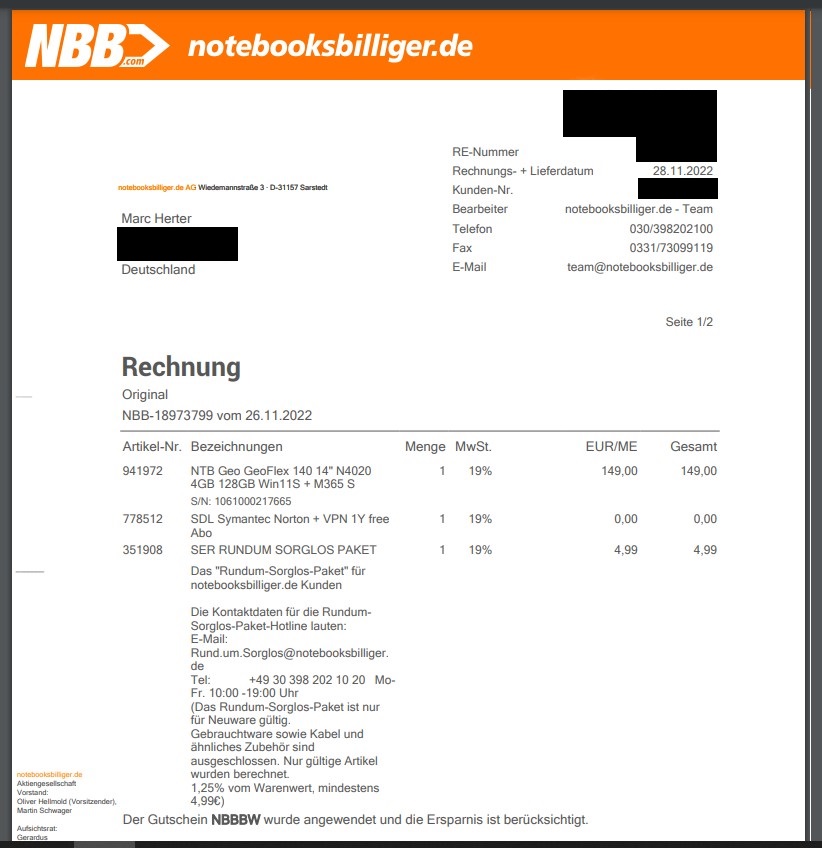
在研究时,Notebooksbilliger.de对GeoFlex 140的收费约为200欧元(约218美元)。.你经常可以在这里找到促销活动,从购买价格中再扣除50欧元(约54美元)。除此之外,在Notebooksbilliger也有一些其他便宜的Geo电脑。.GeoFlex 110、GeoBook 140和GeoBook 110比GeoFlex 140更便宜,但使用同样的硬件。
Geo Computers GeoFlex 140
- 01/17/2023 v7 (old)
Marc Herter
Price comparison
