




宏碁掠夺者 BiFrost Arc A750 OC 台式机 GPU 评测--英特尔第二强游戏显卡仅配备 8 GB VRAM
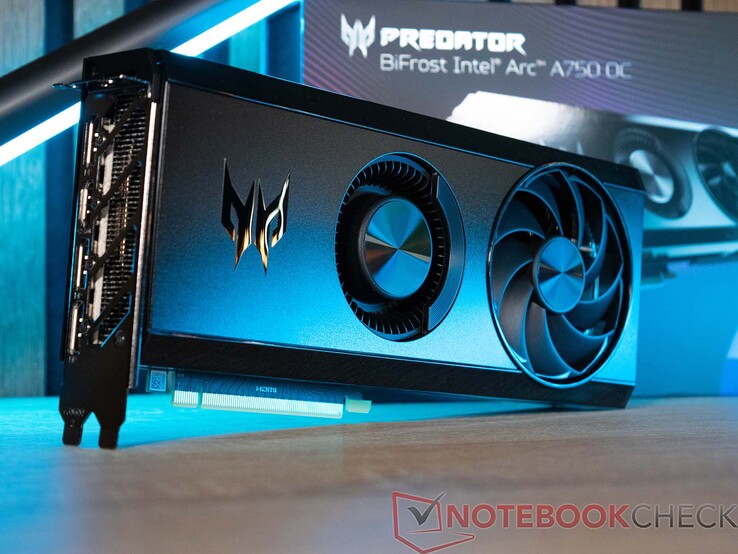
我们最近测试了英特尔显卡中的佼佼者。在我们对宏碁掠夺者 BiFrost Arc A770 OC的评测中,我们对英特尔当前型号的工作性能感到惊讶。在驱动程序持续更新的帮助下,英特尔已经提供了一款很好的产品,并可以在未来继续扩展。然而,我们还远远没有听到英特尔下一代 GPU 的发布日期。在本次评测中,我们将重点关注 Arc 系列中速度第二快的型号 Intel Arc A750。在测试中,我们使用了宏碁的另一款显卡(宏碁掠夺者 BiFrost Arc A750 OC)。
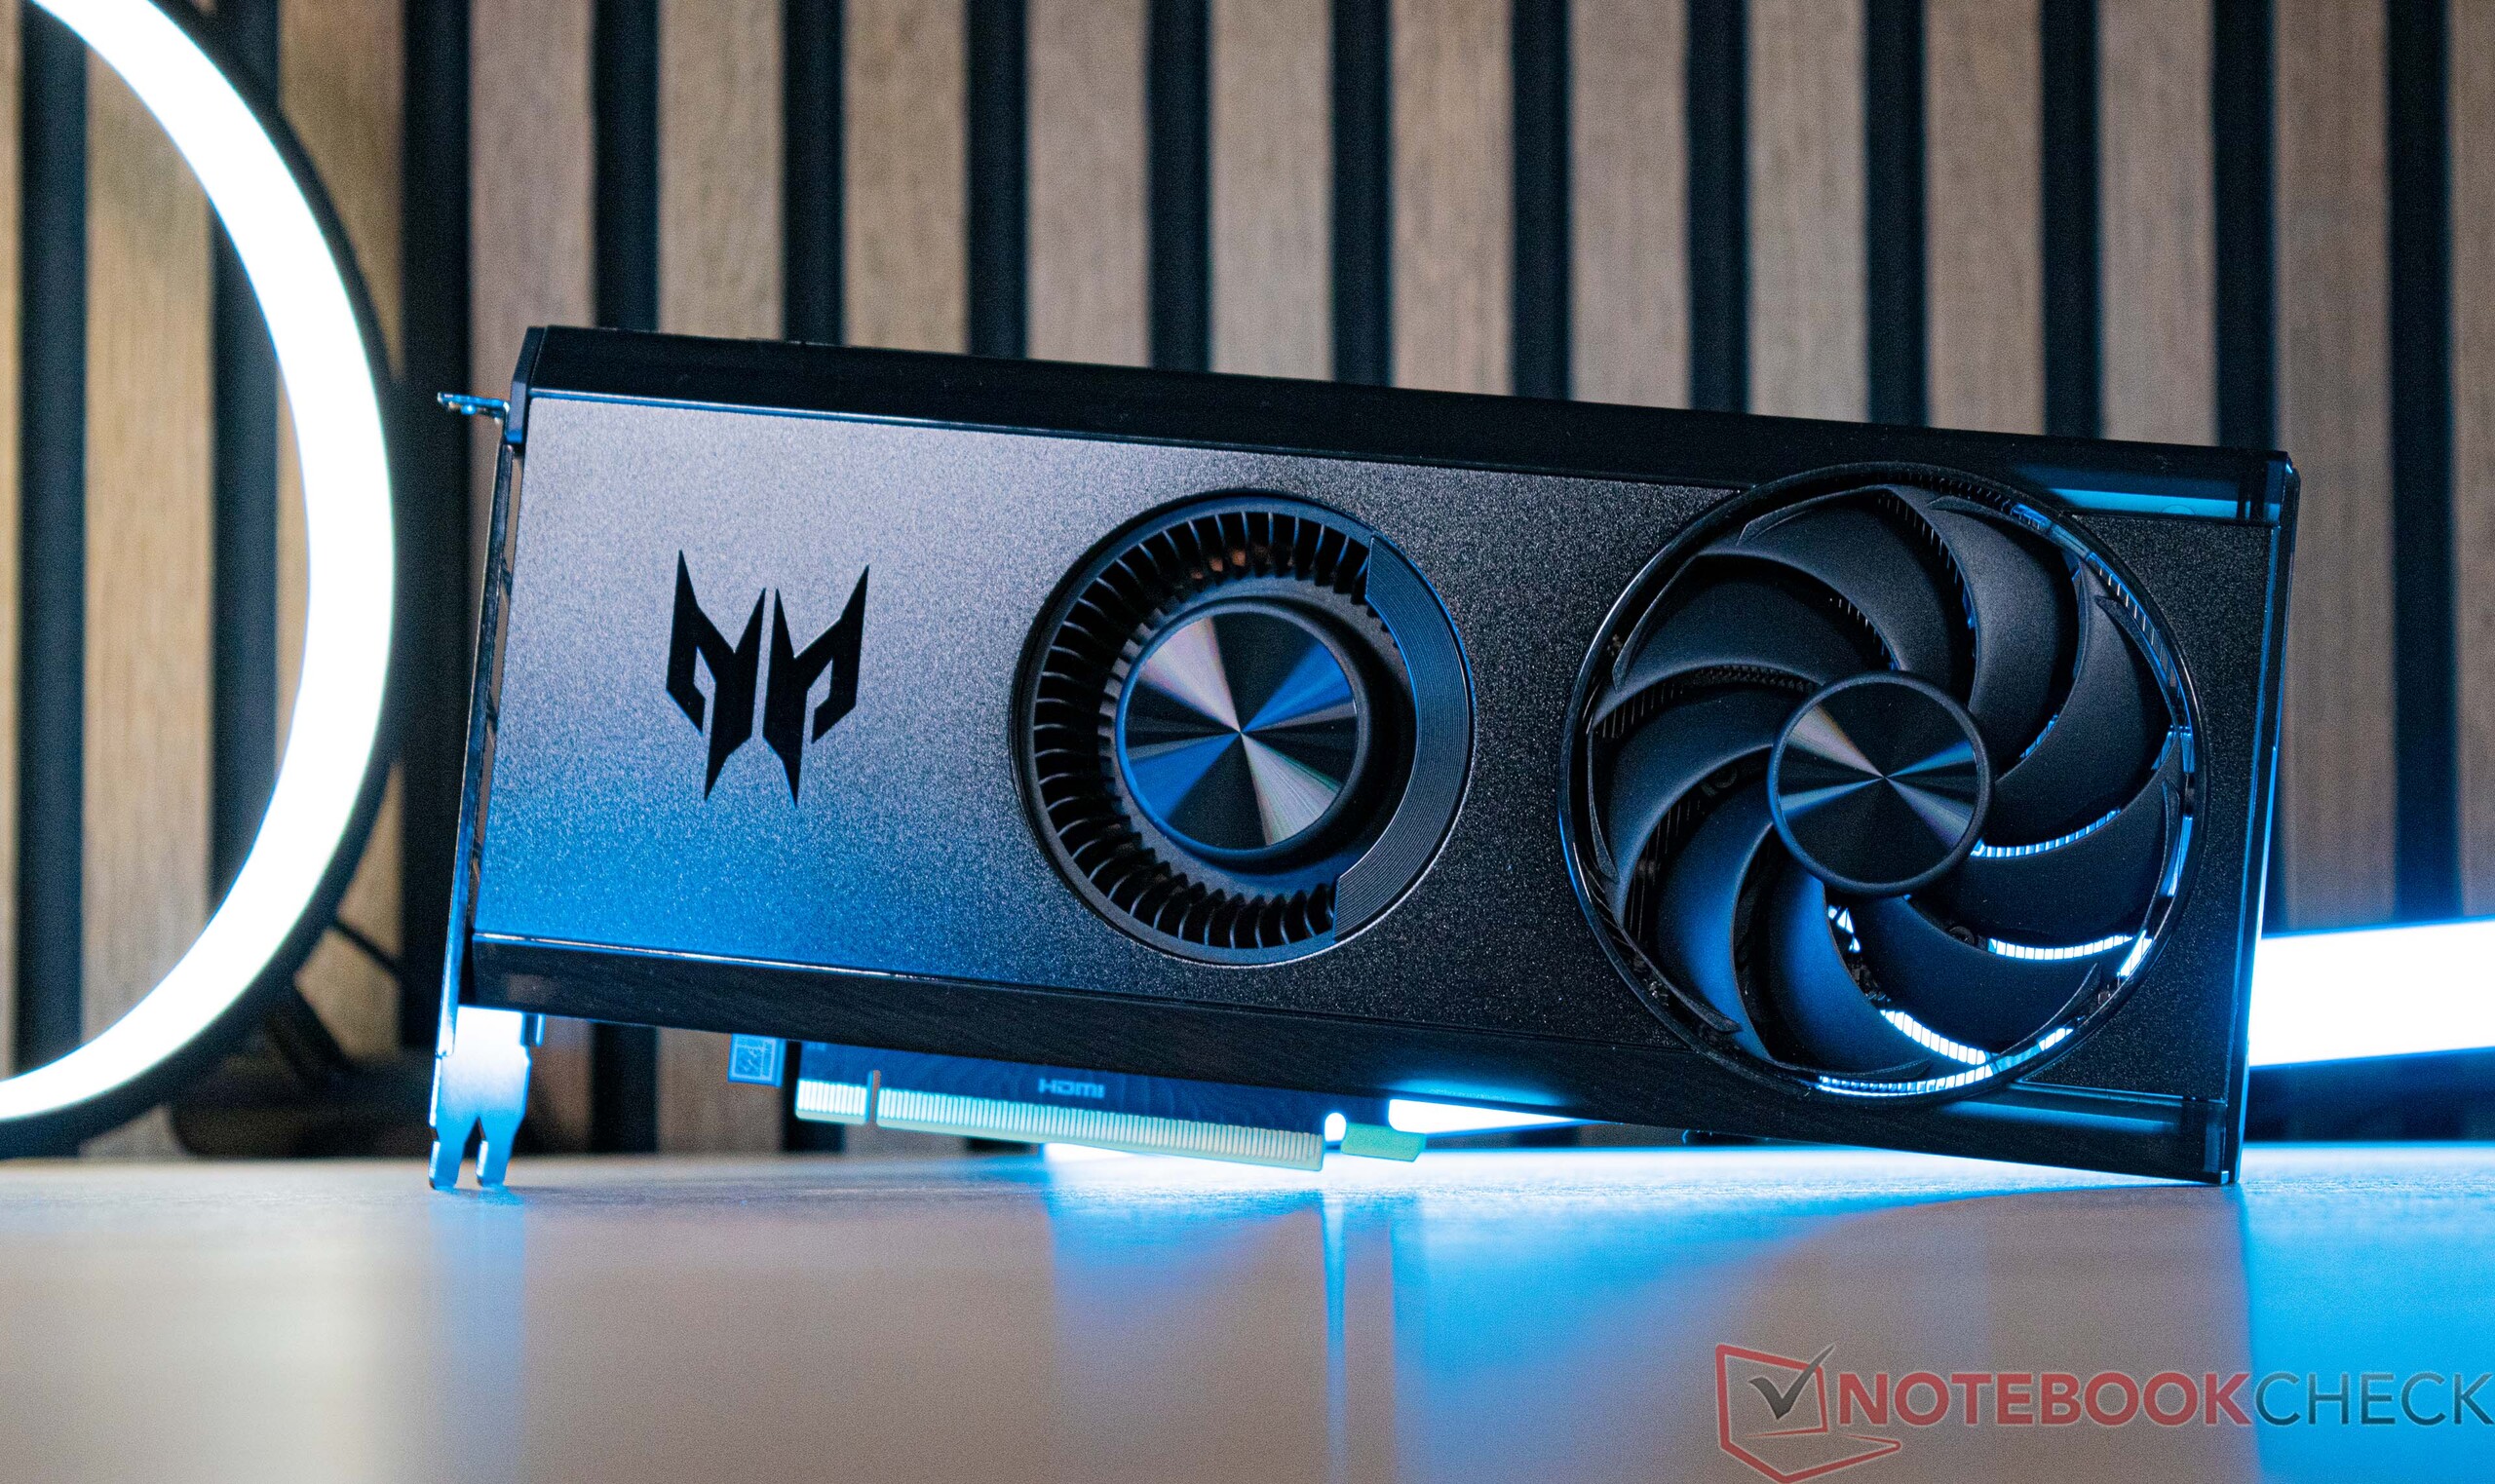
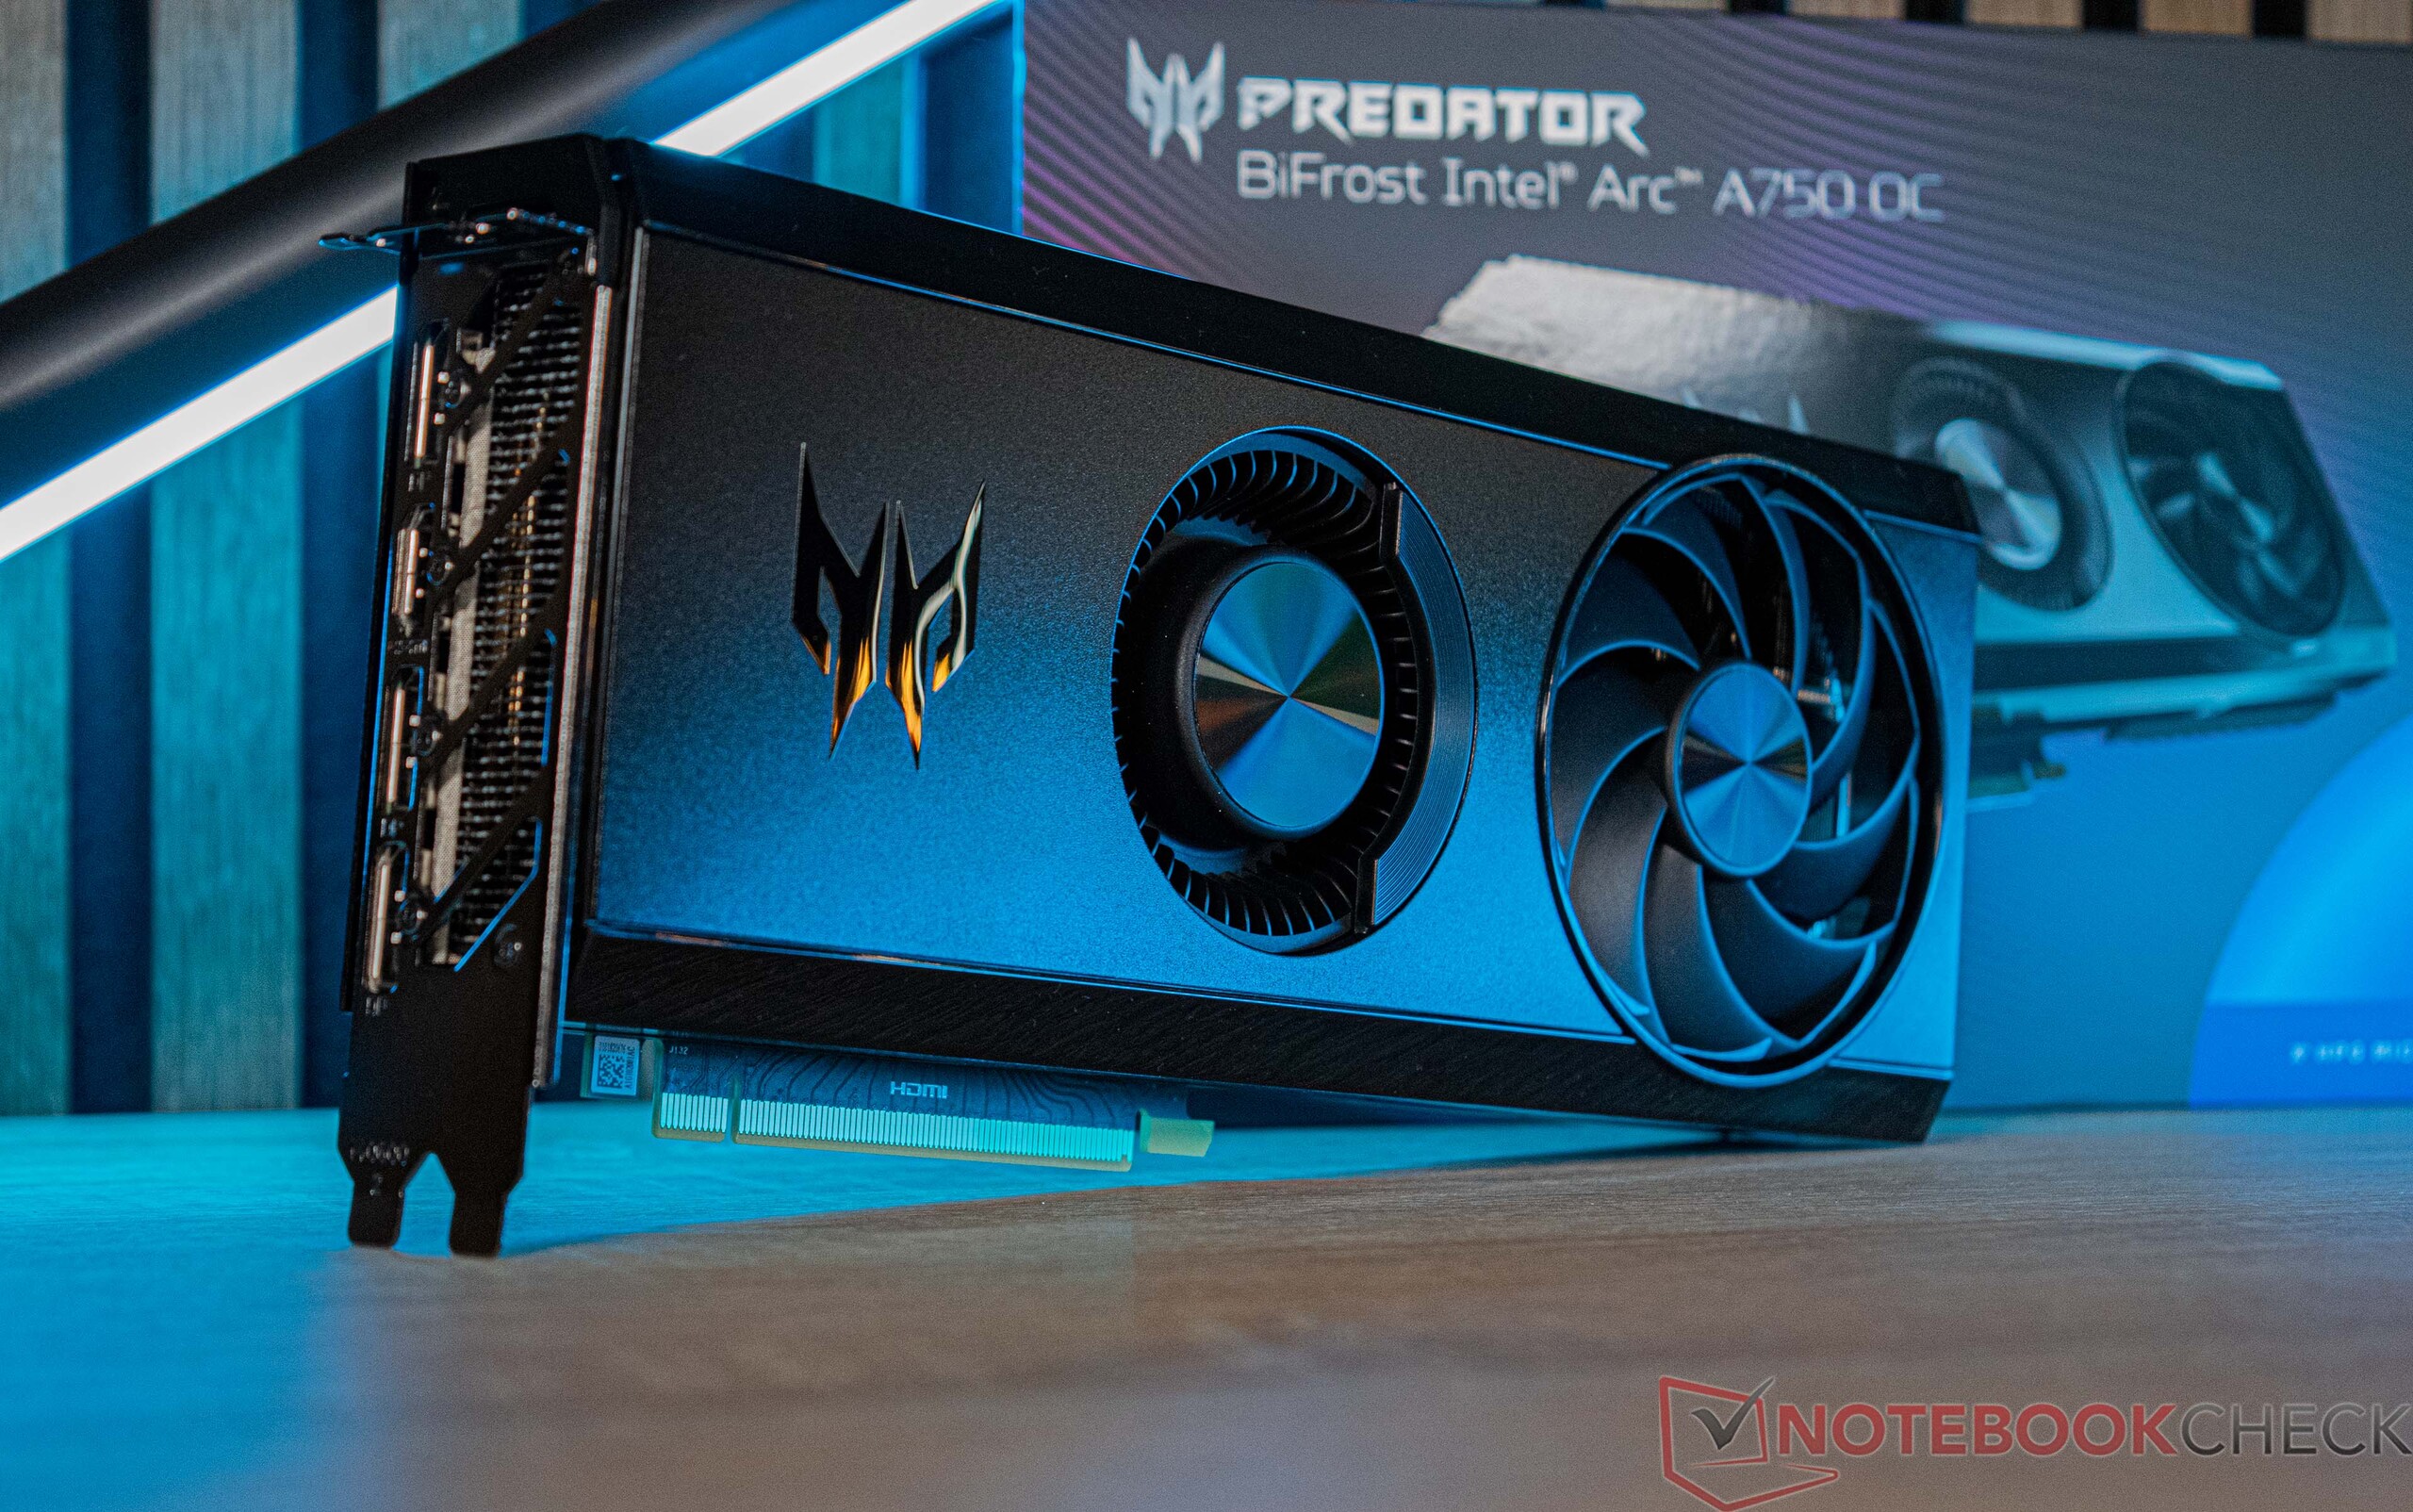
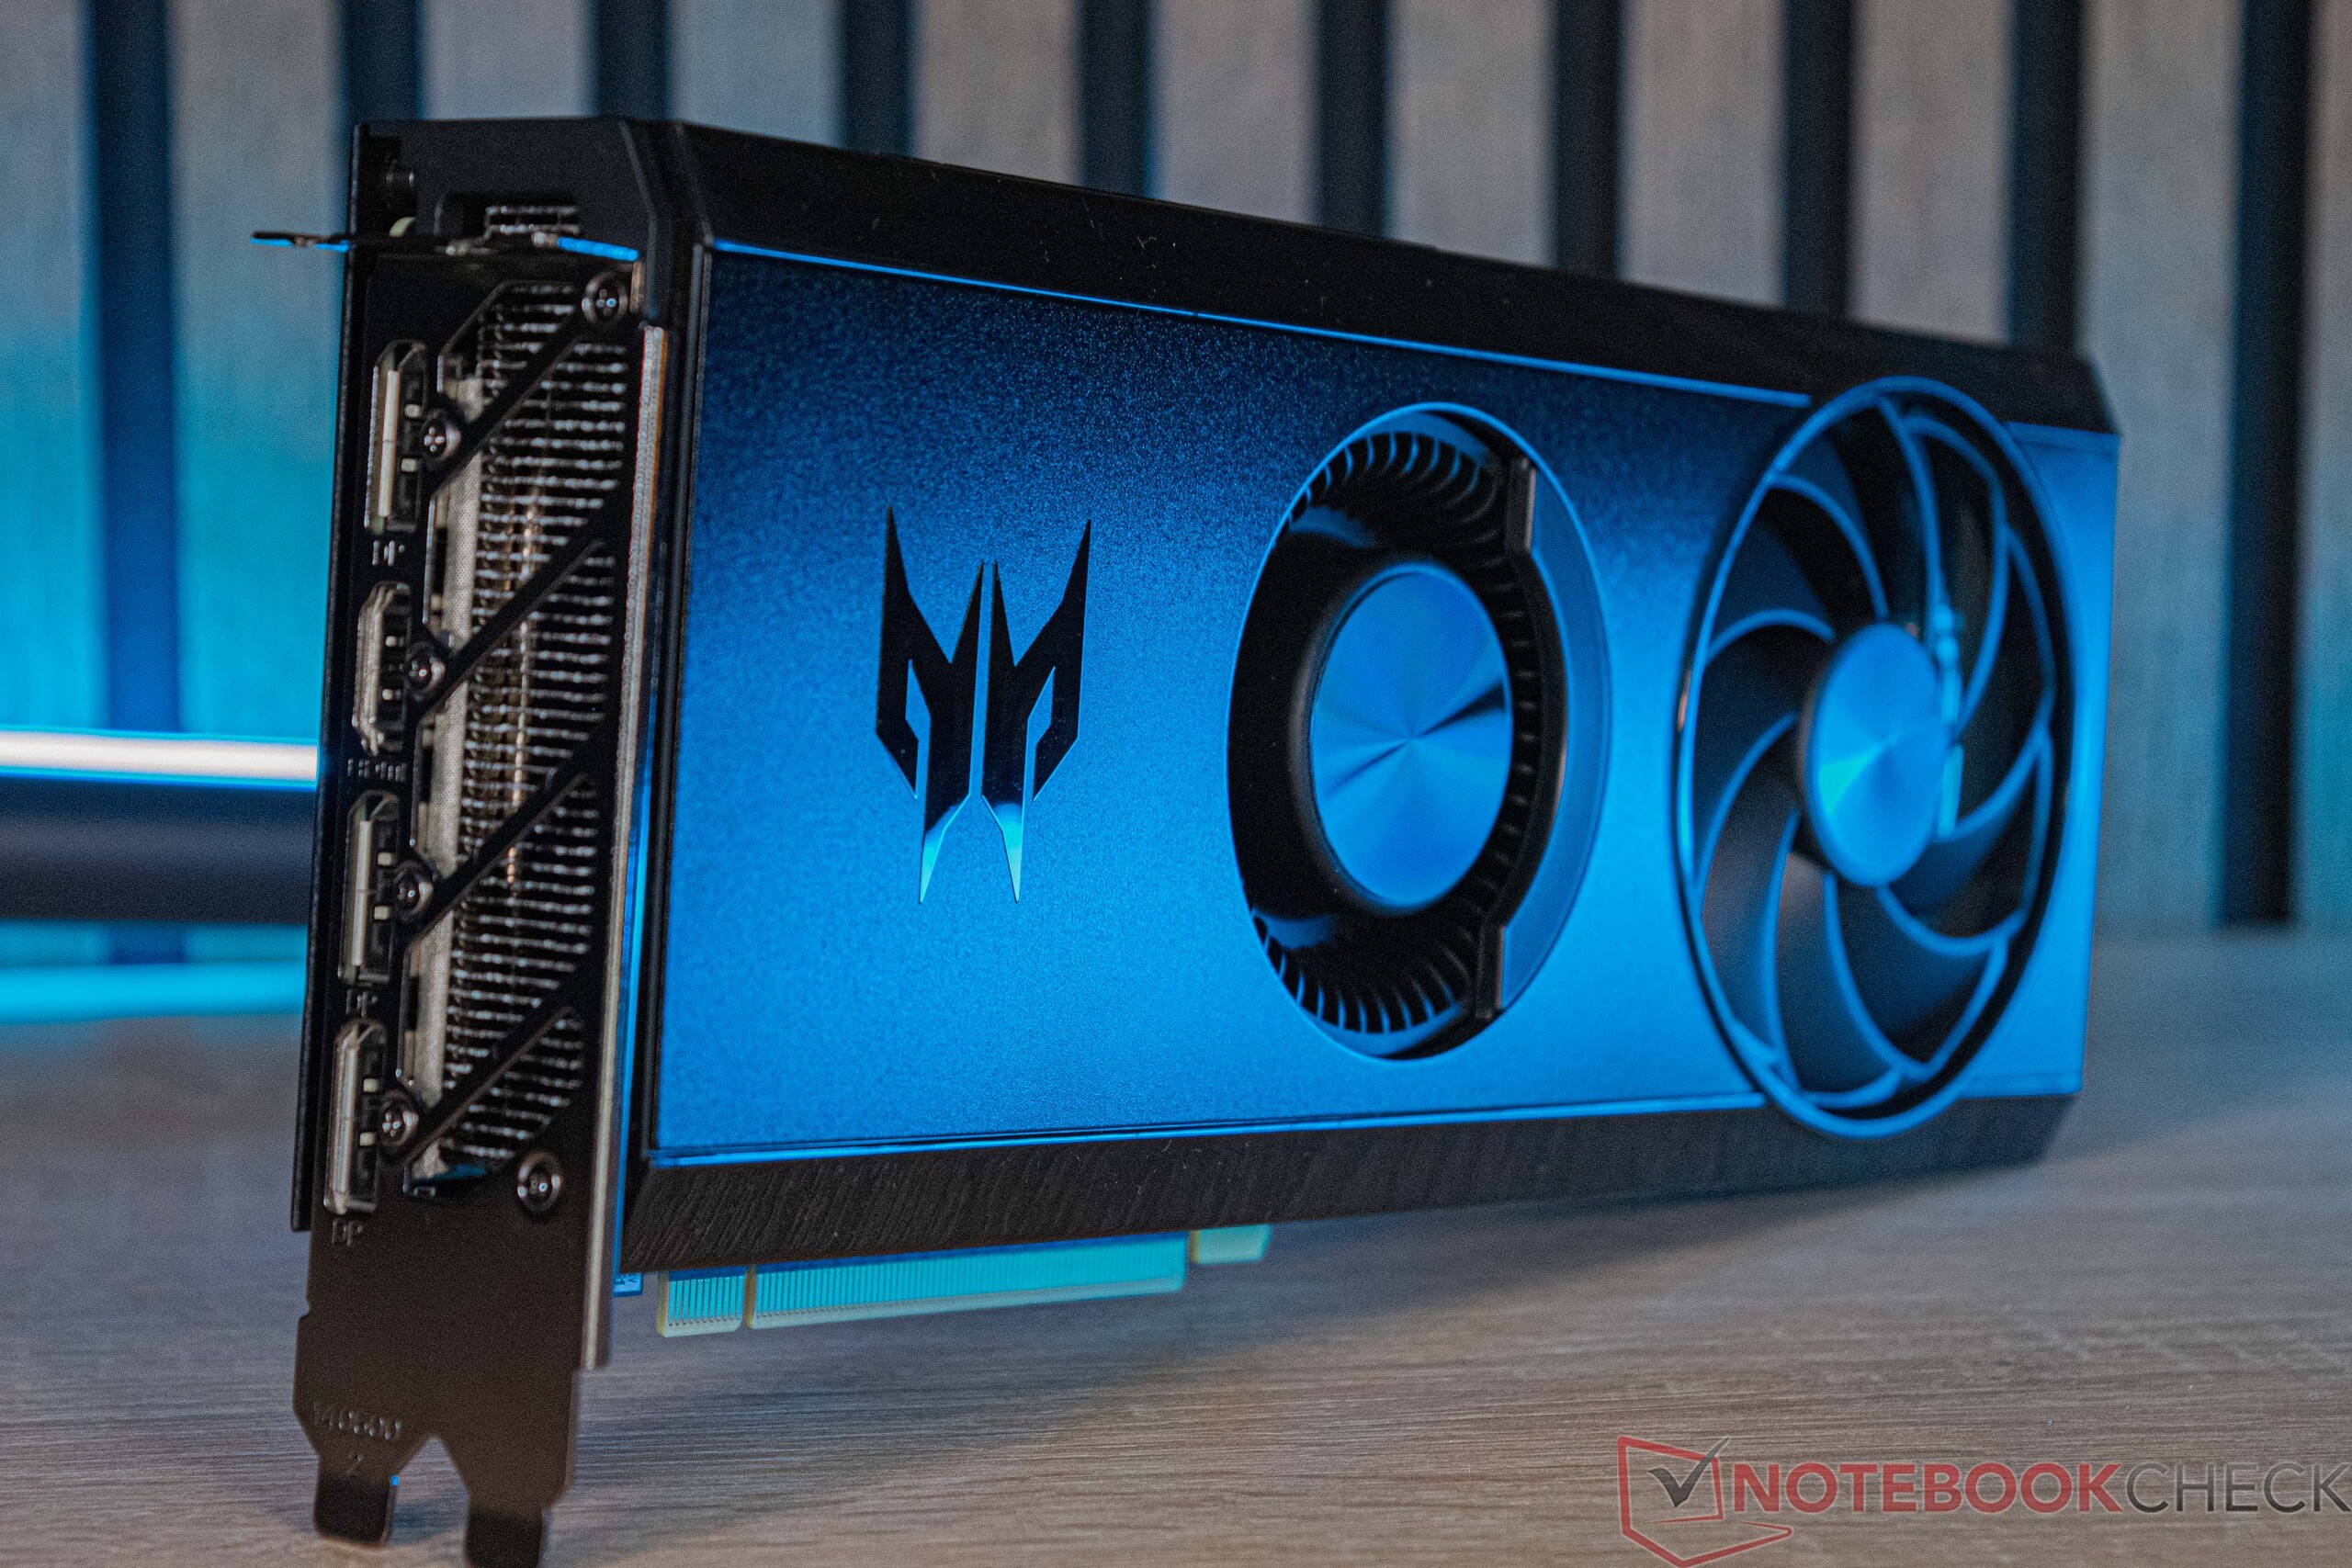
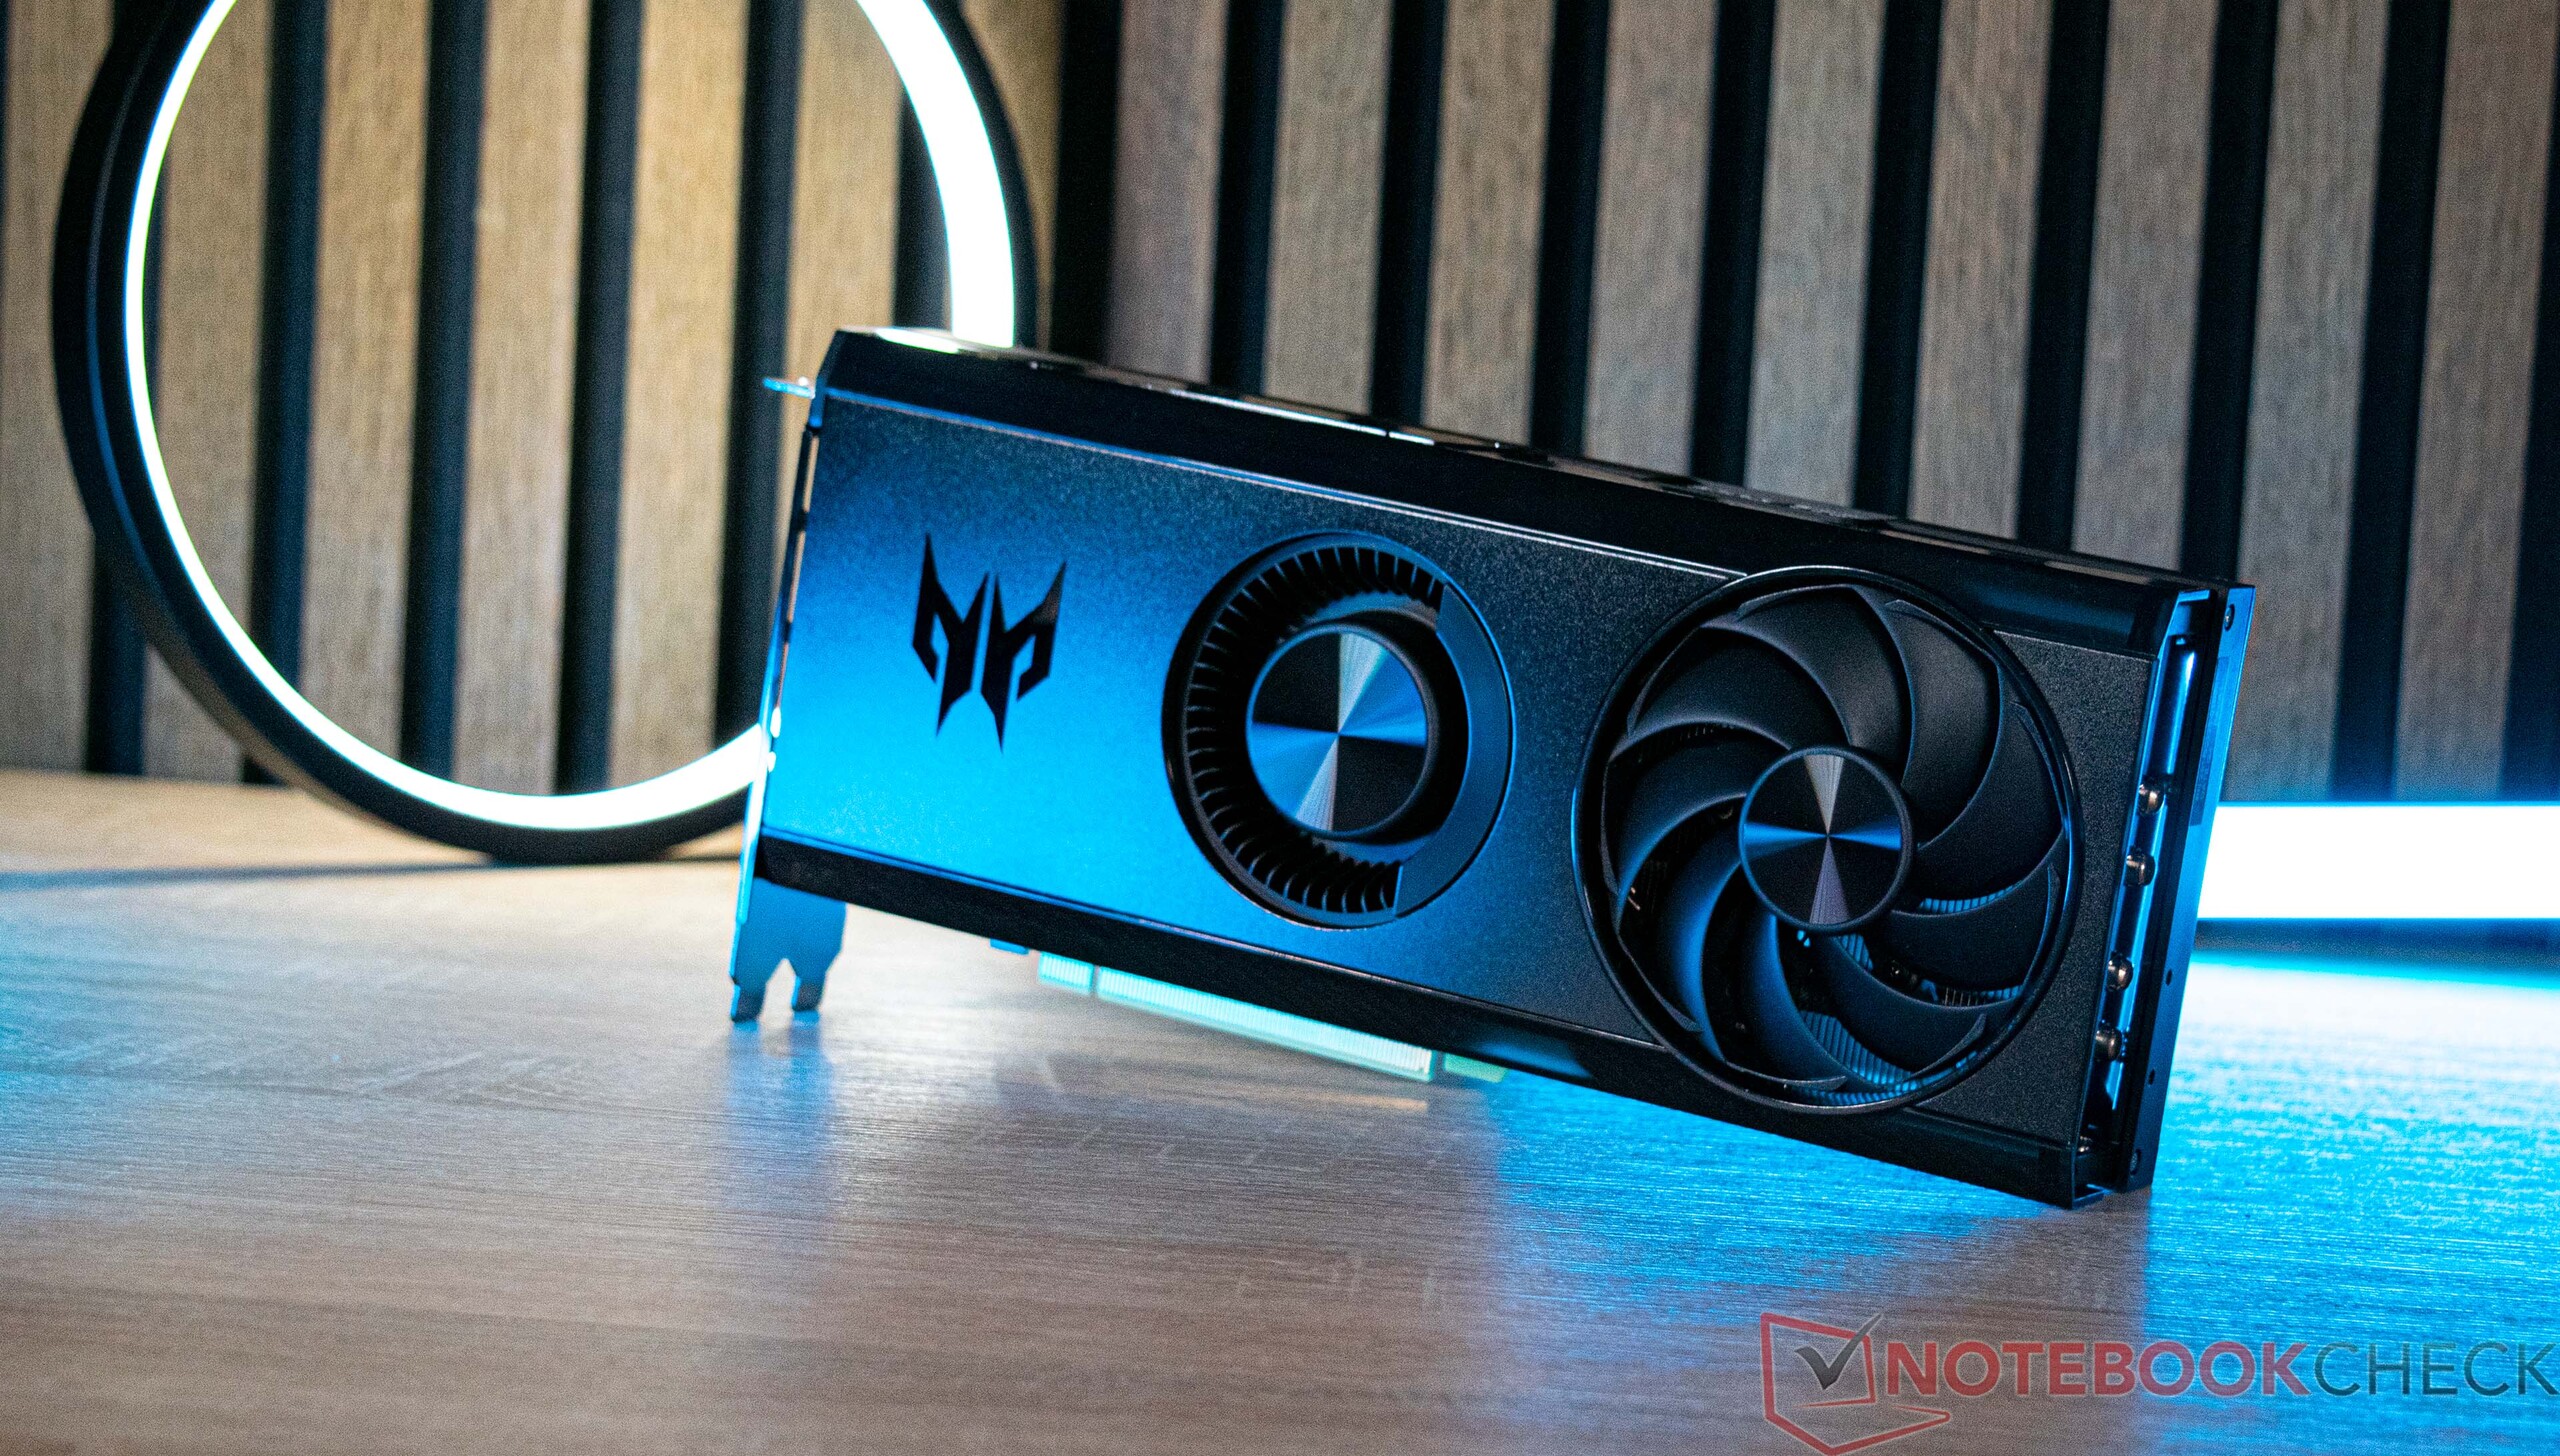
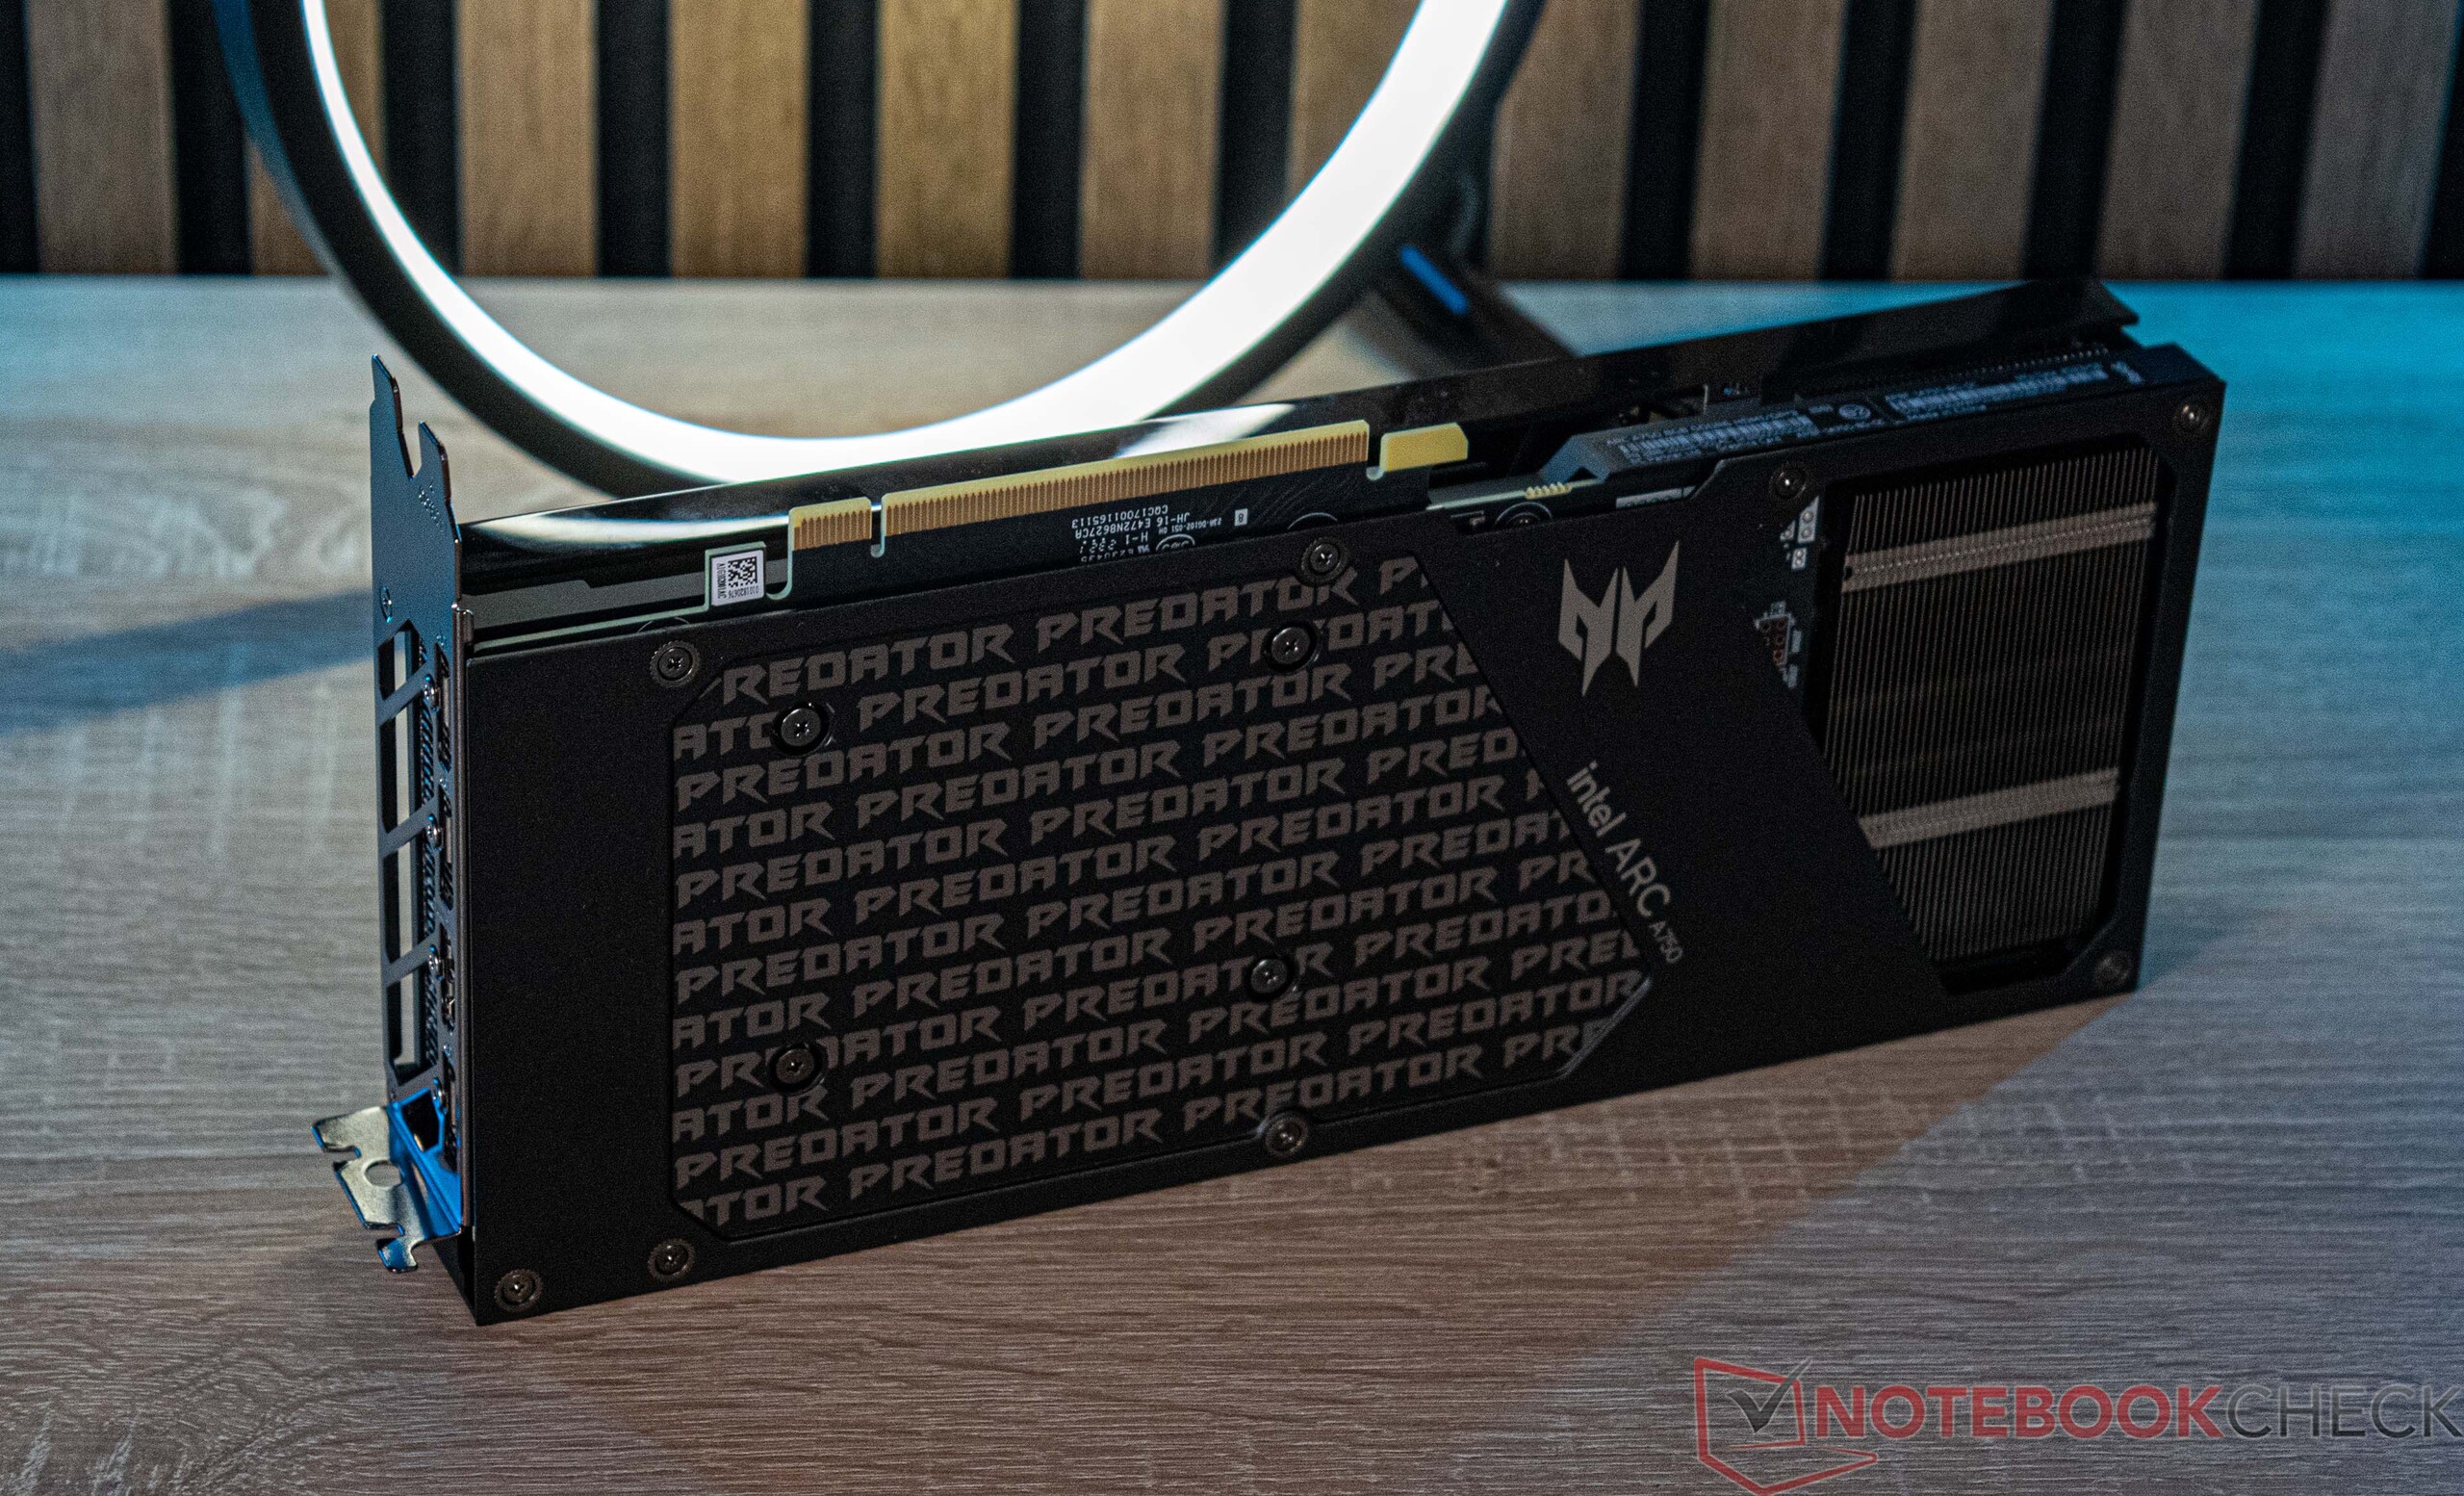
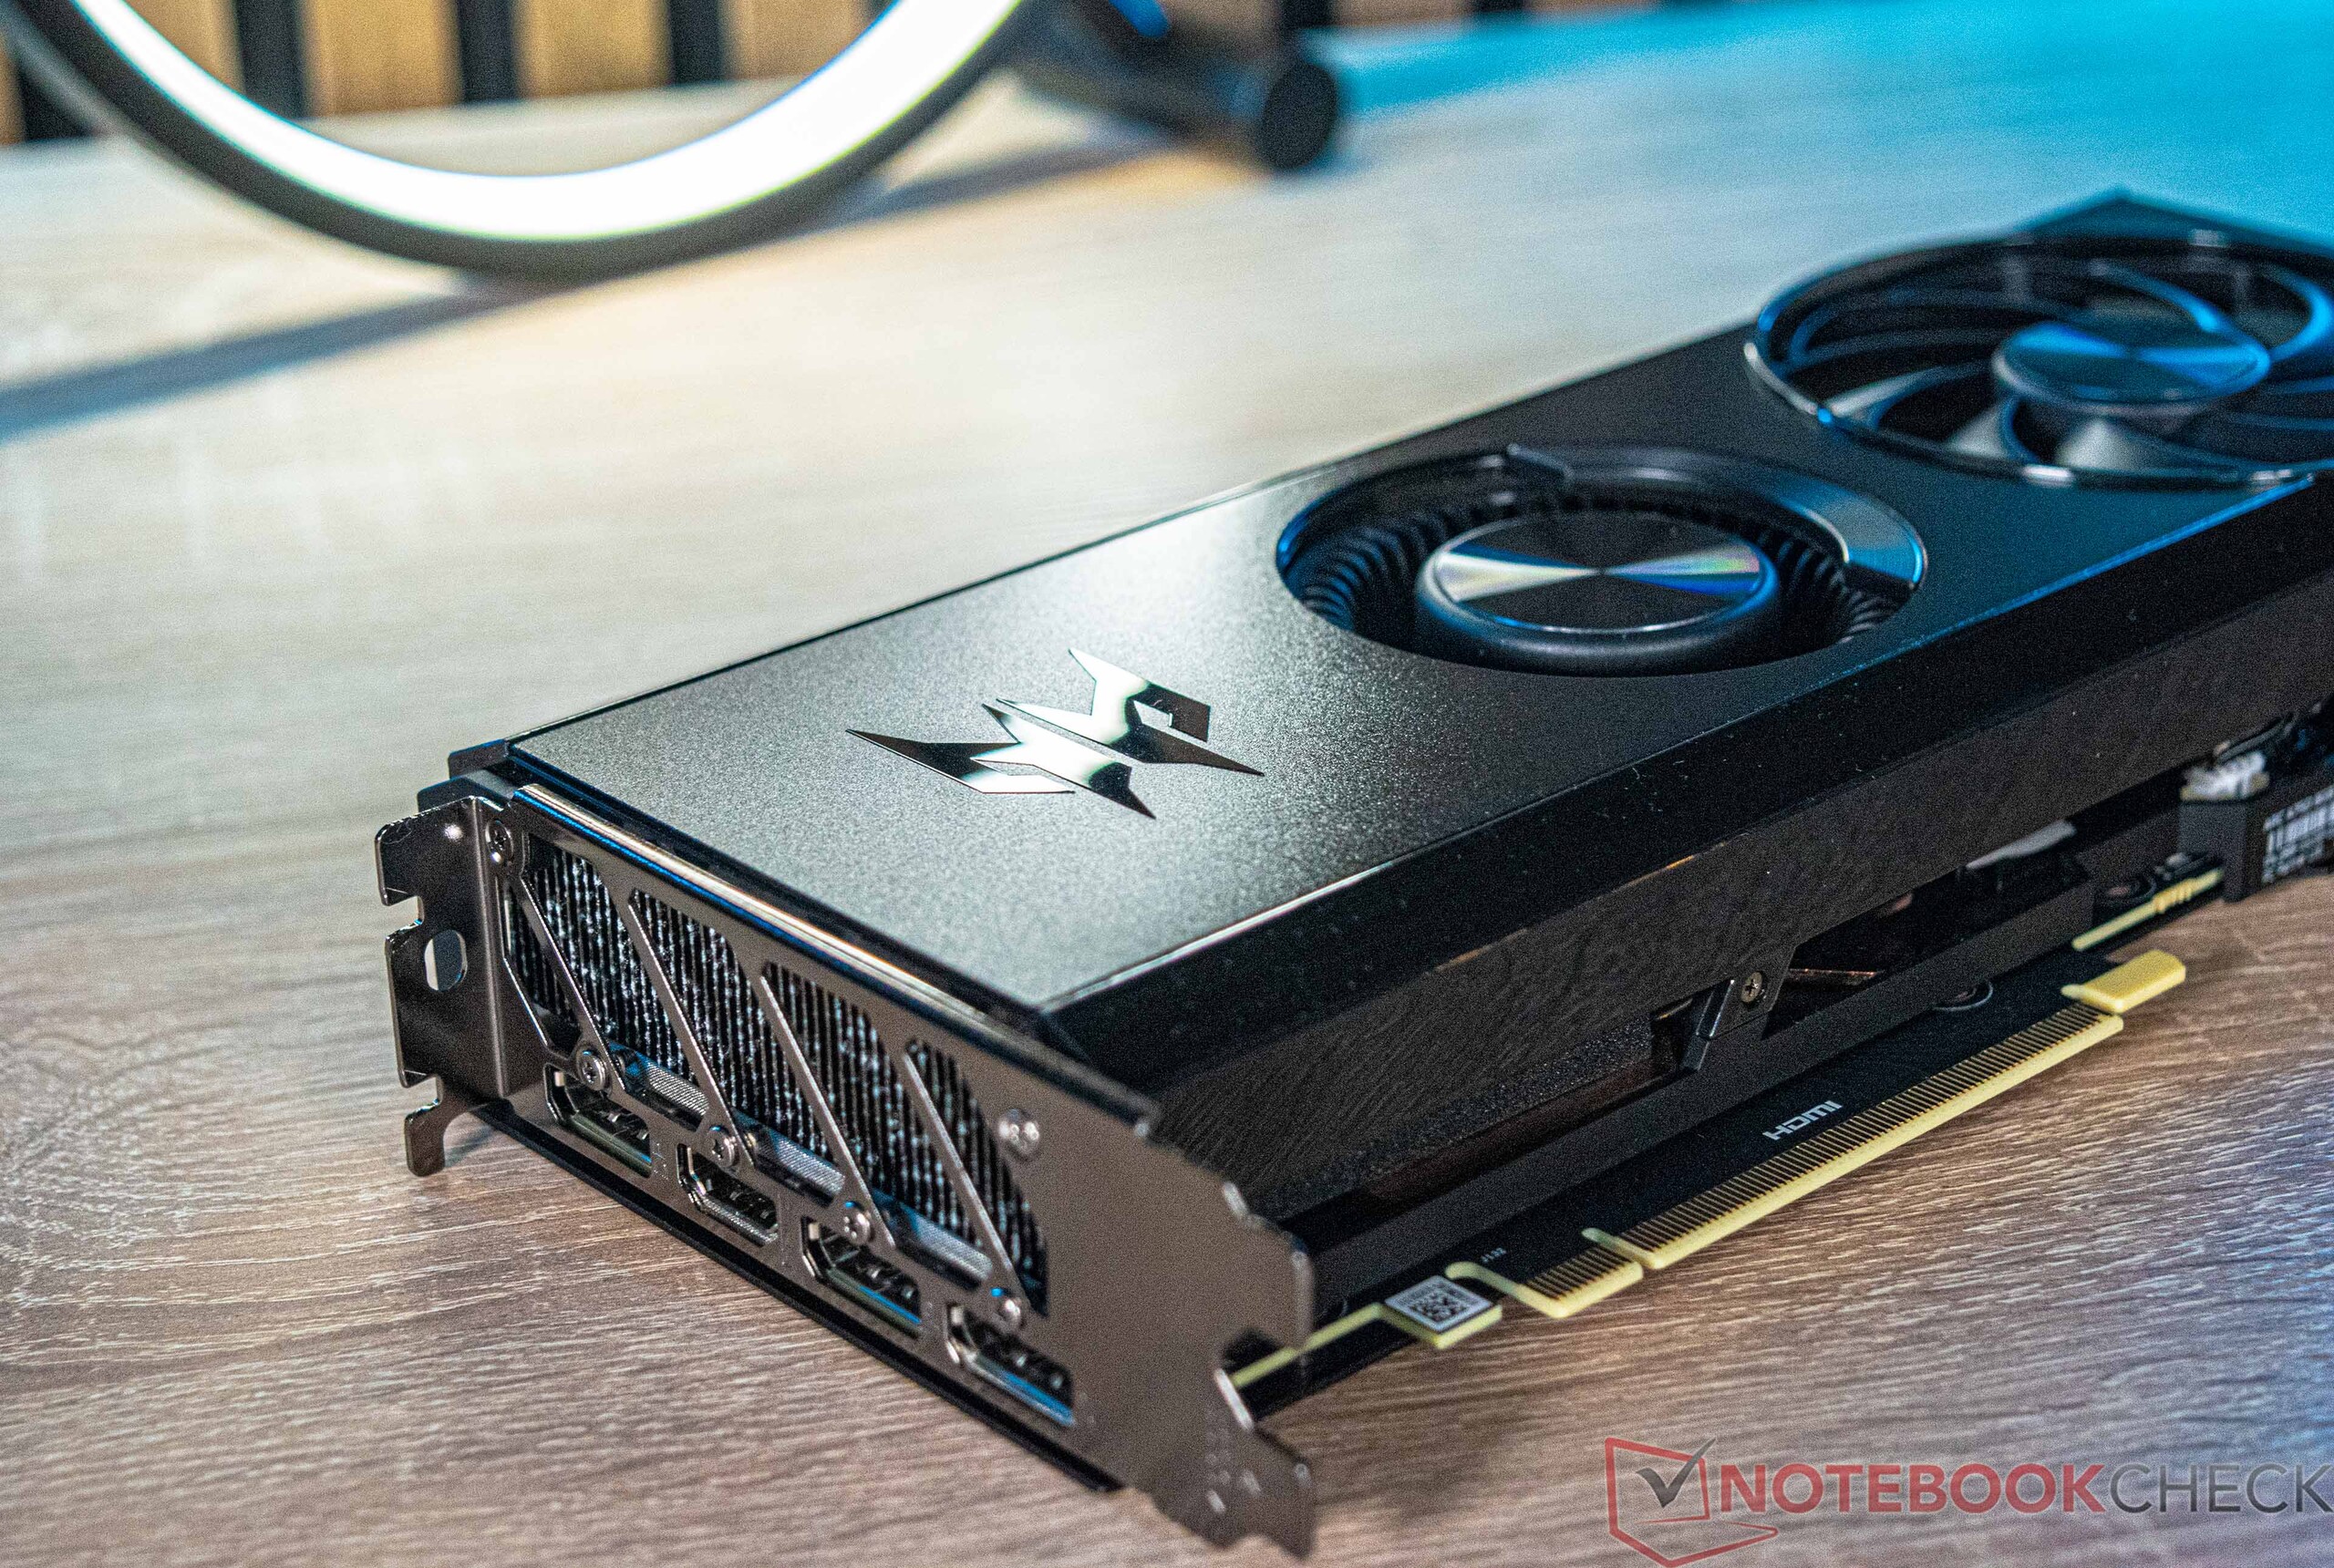
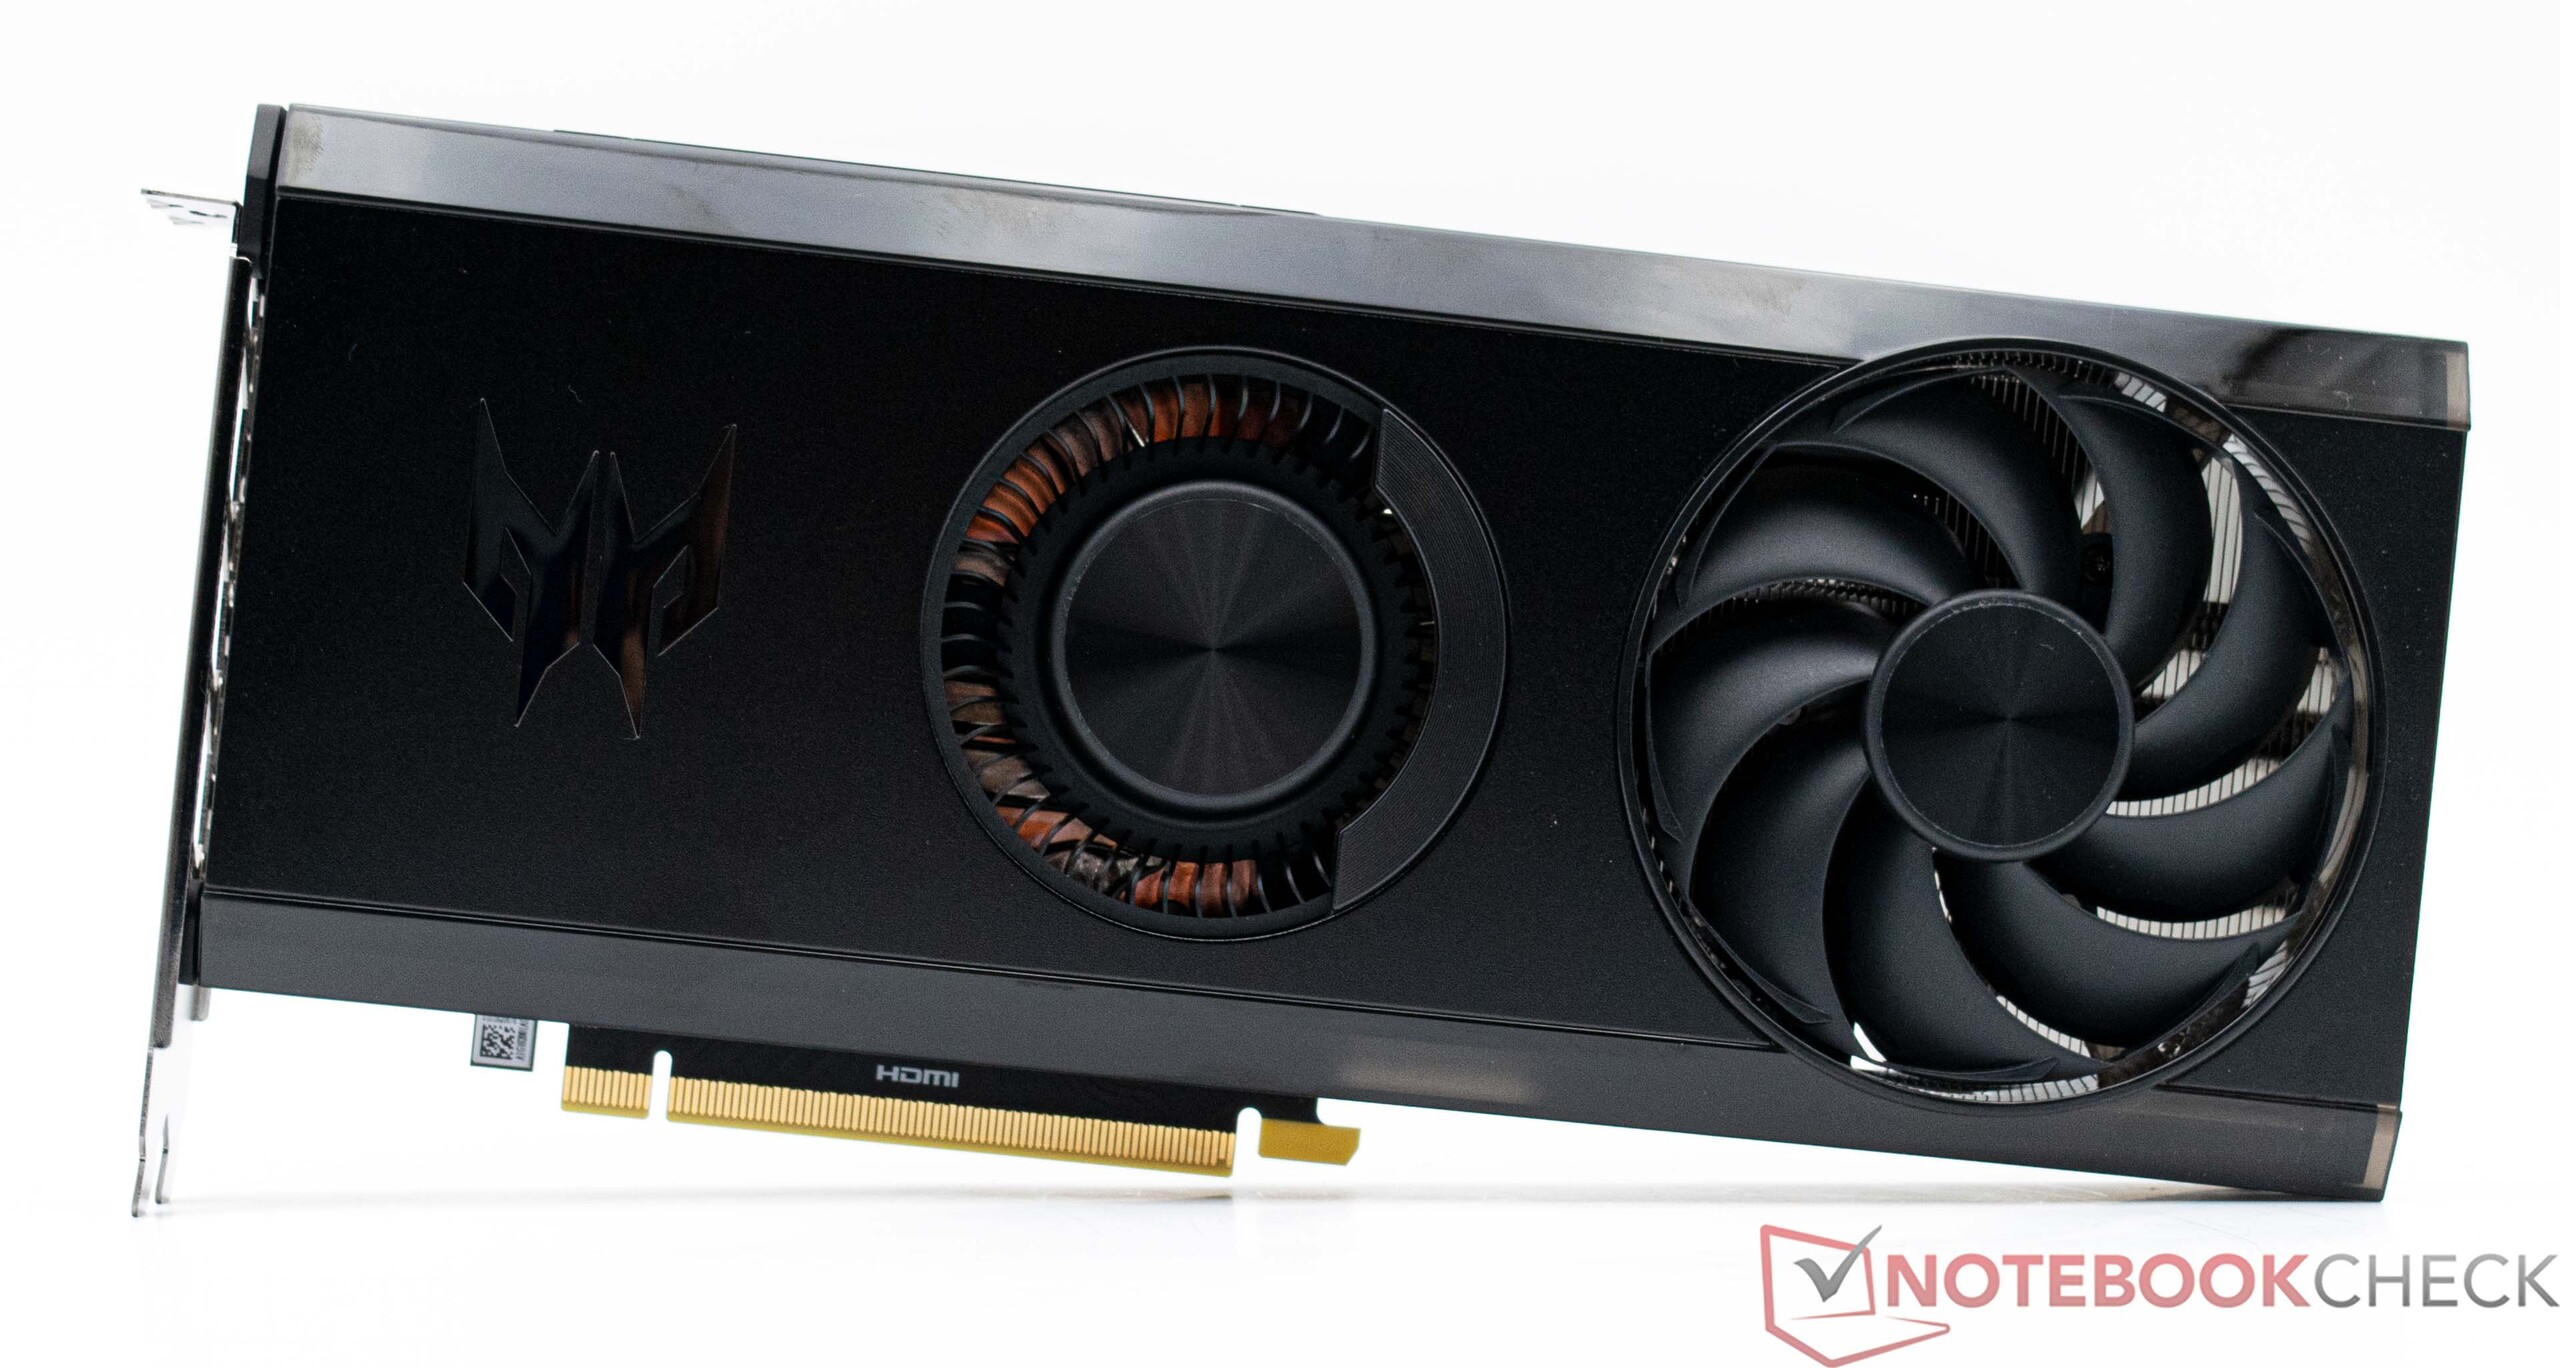
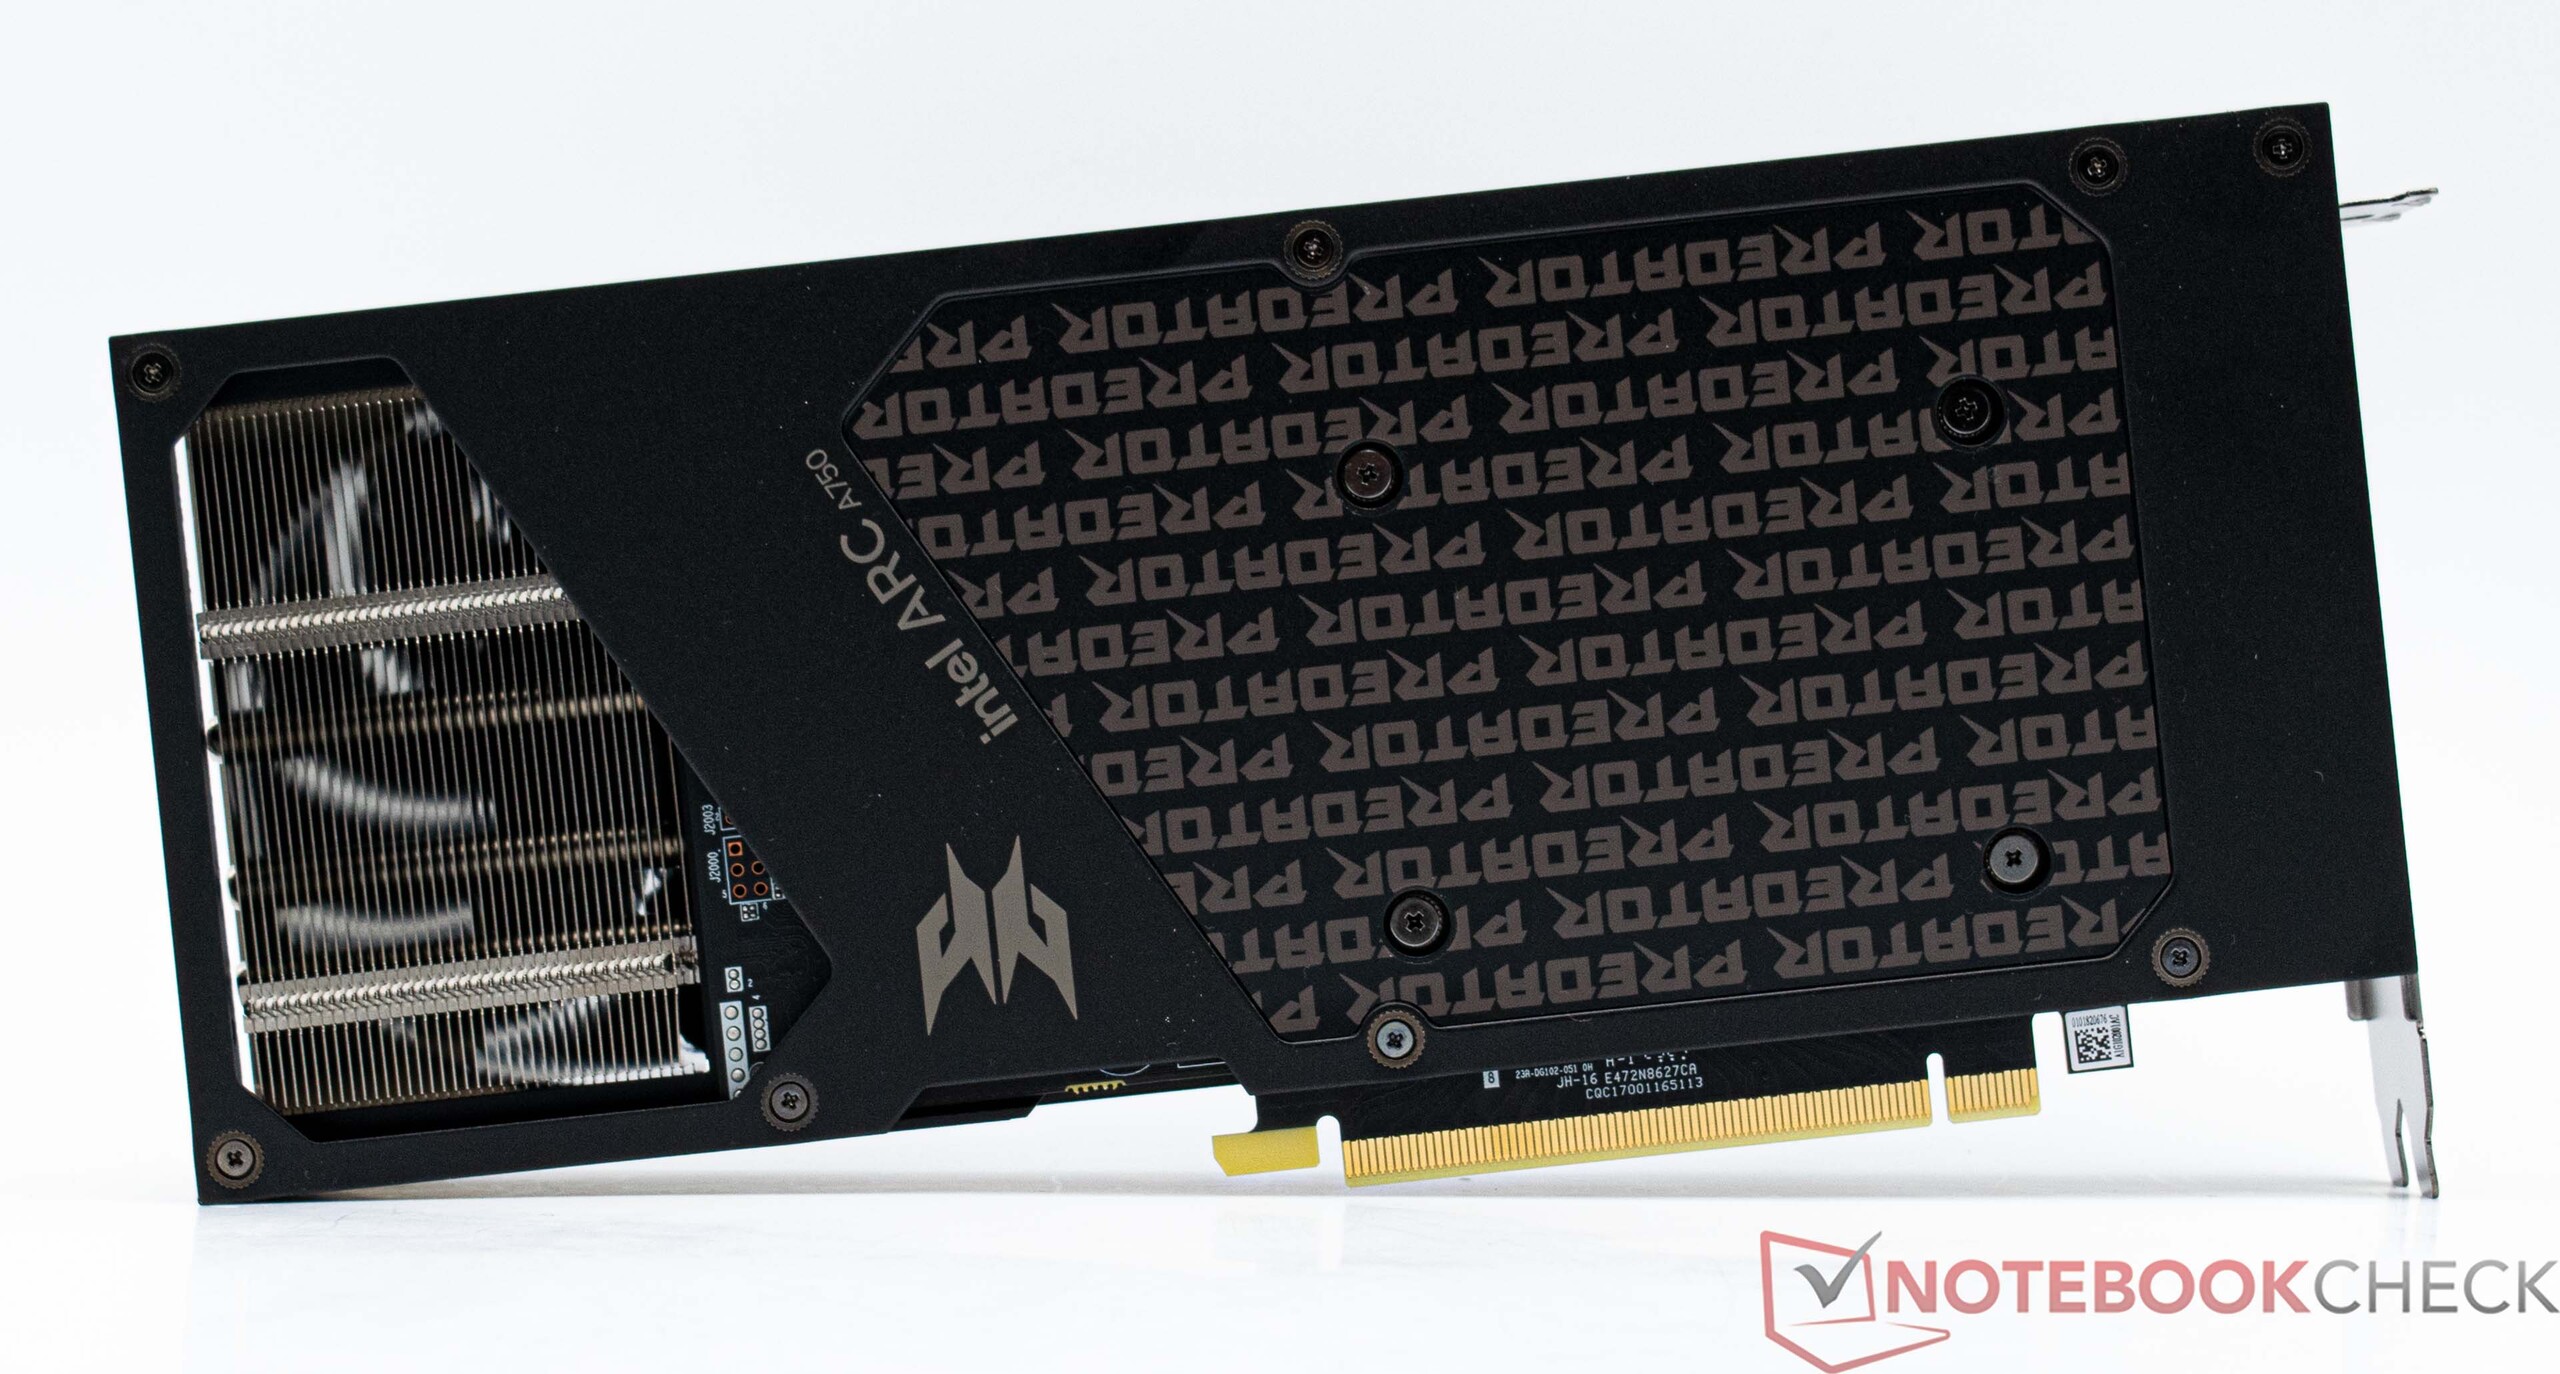
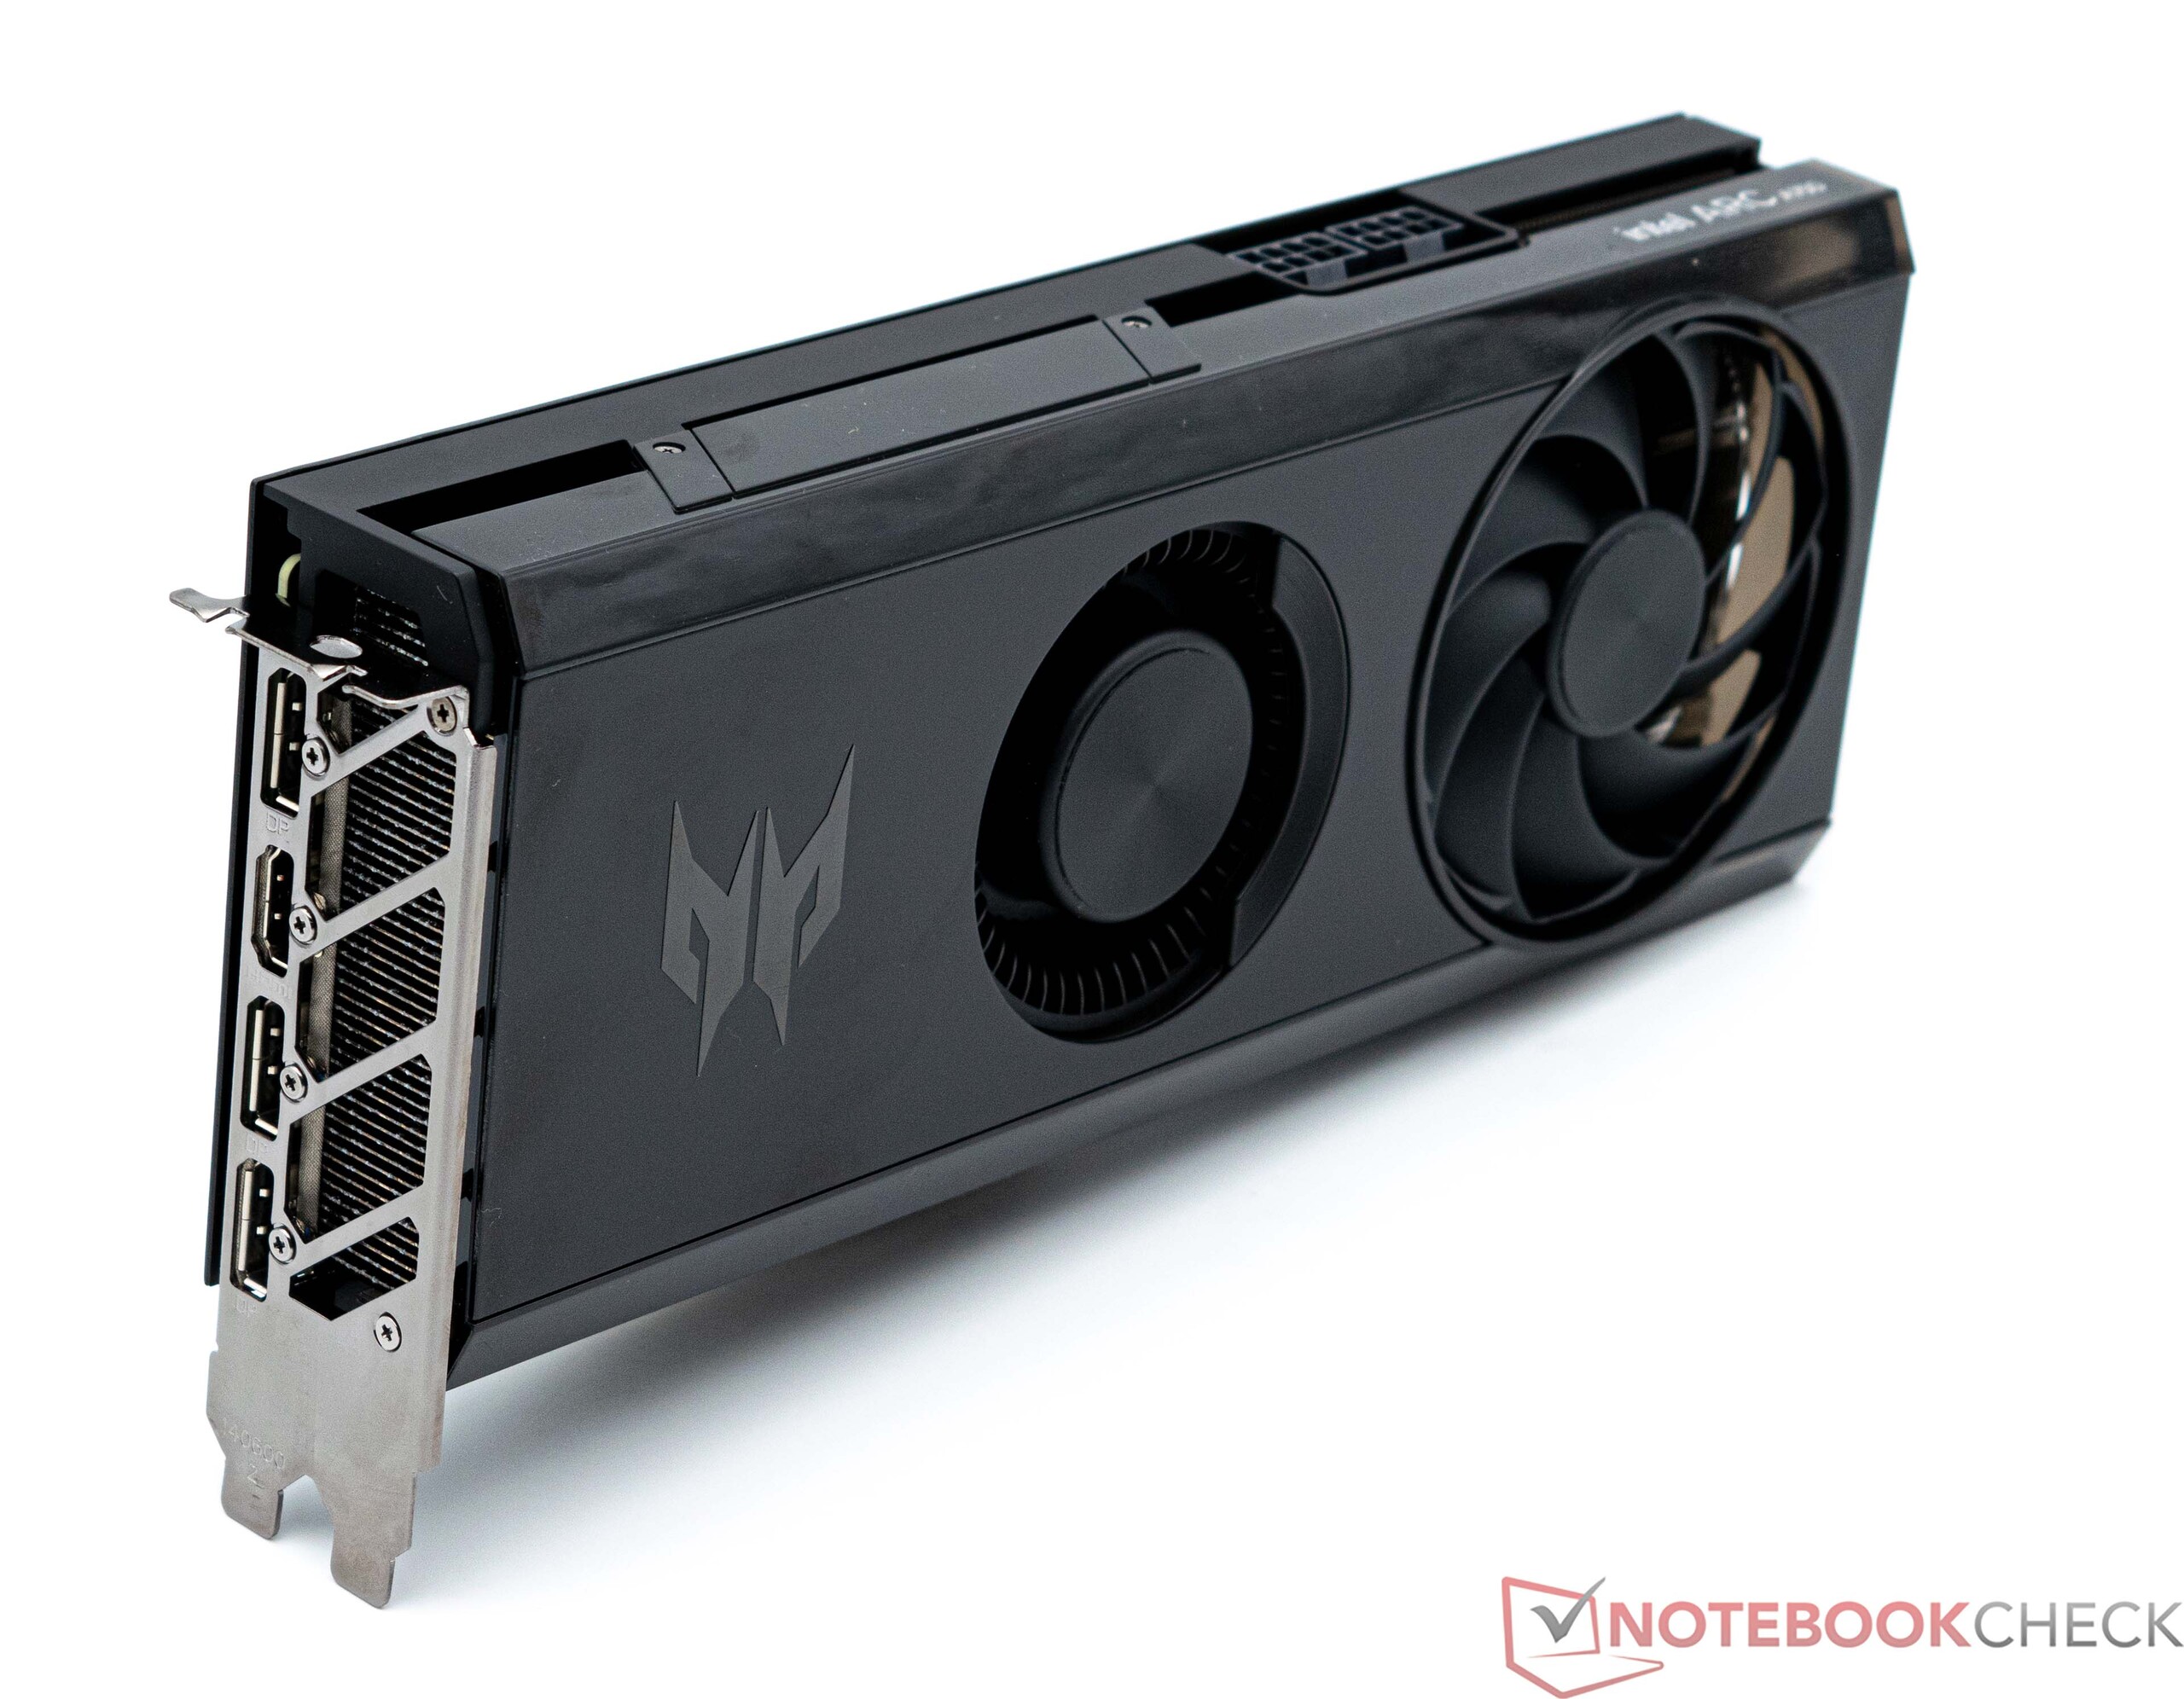
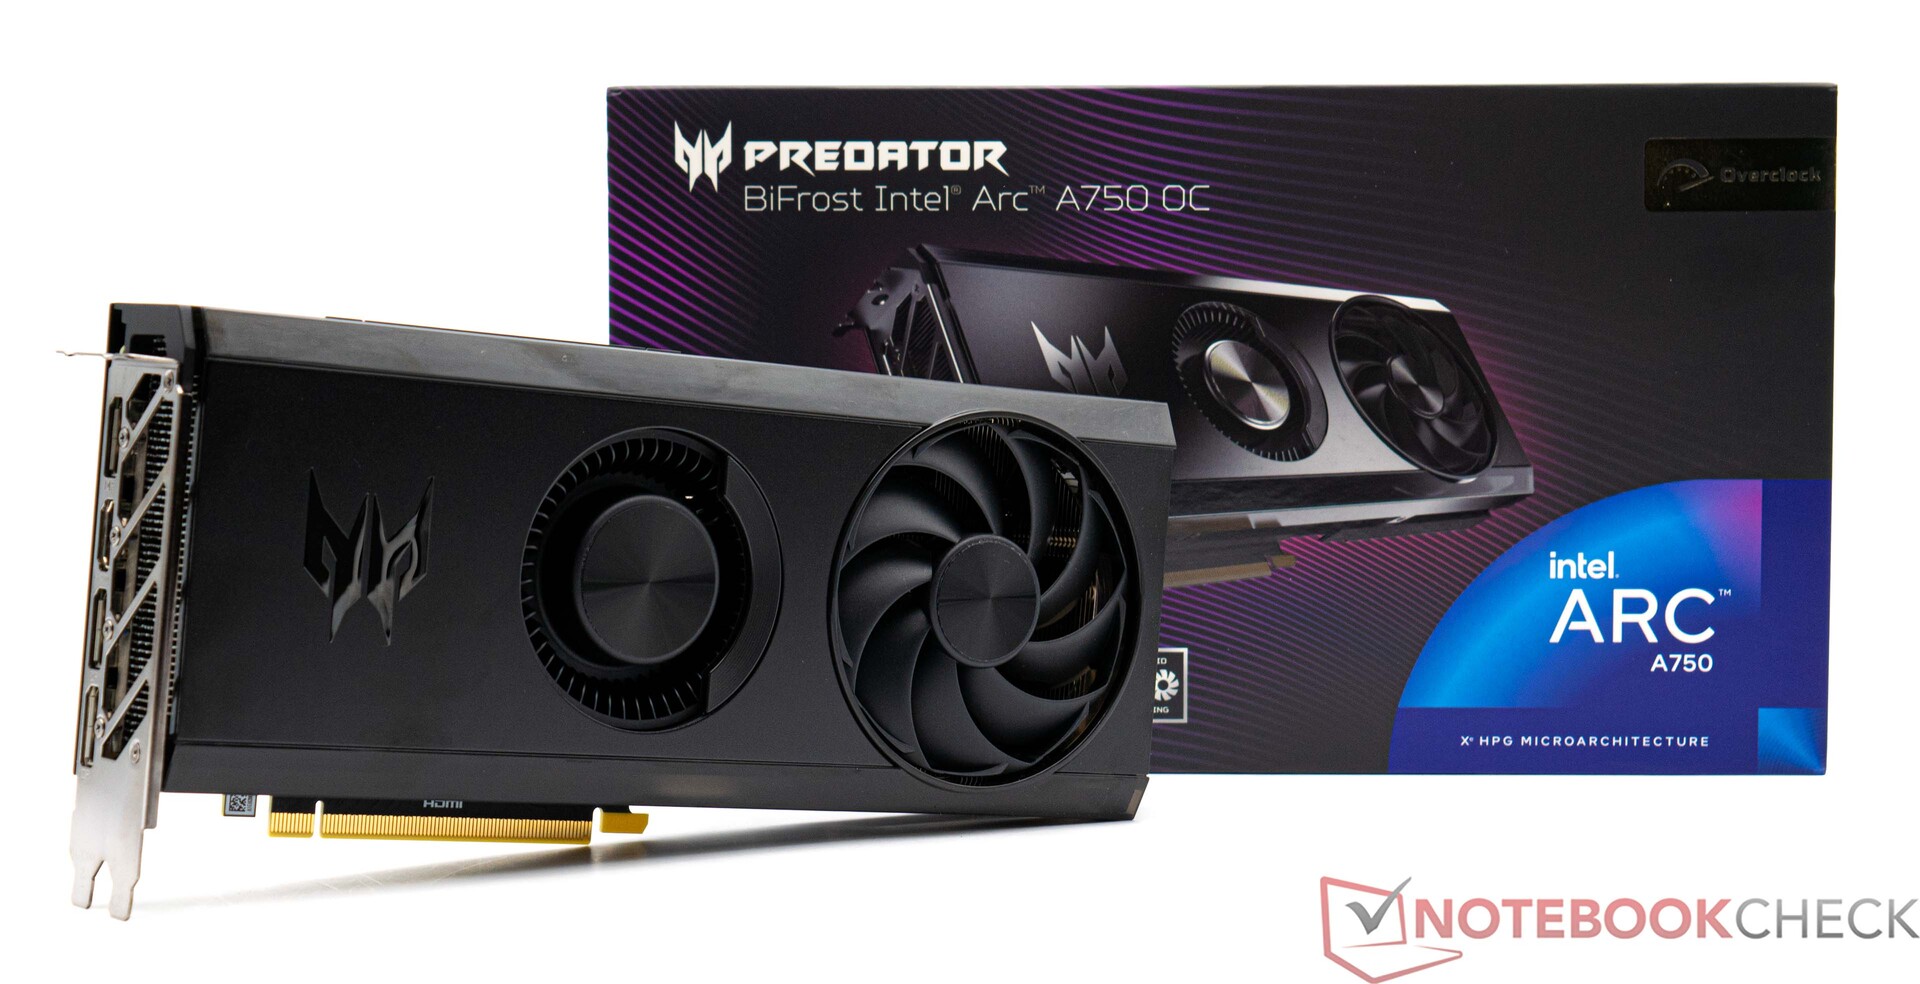
从外观上看,这两款宏碁显卡乍一看差别不大。一方面,它没有使用任何复杂的 RGB 灯光,因为只有侧面的 Predator 字样会亮起。另一方面,它的散热器盖采用了更多的塑料材质。因此,我们注意到宏碁掠夺者 BiFrost Arc A750 OC 的触感要差得多。不过,我们不会将其归类为廉价感。宏碁掠夺者 BiFrost Arc A750 OC 拥有 8GB 显存,比顶级型号的显存略少,这意味着这款显卡在显示 1440p 以上的高分辨率时会更快地达到极限。我们稍后将仔细研究其影响。
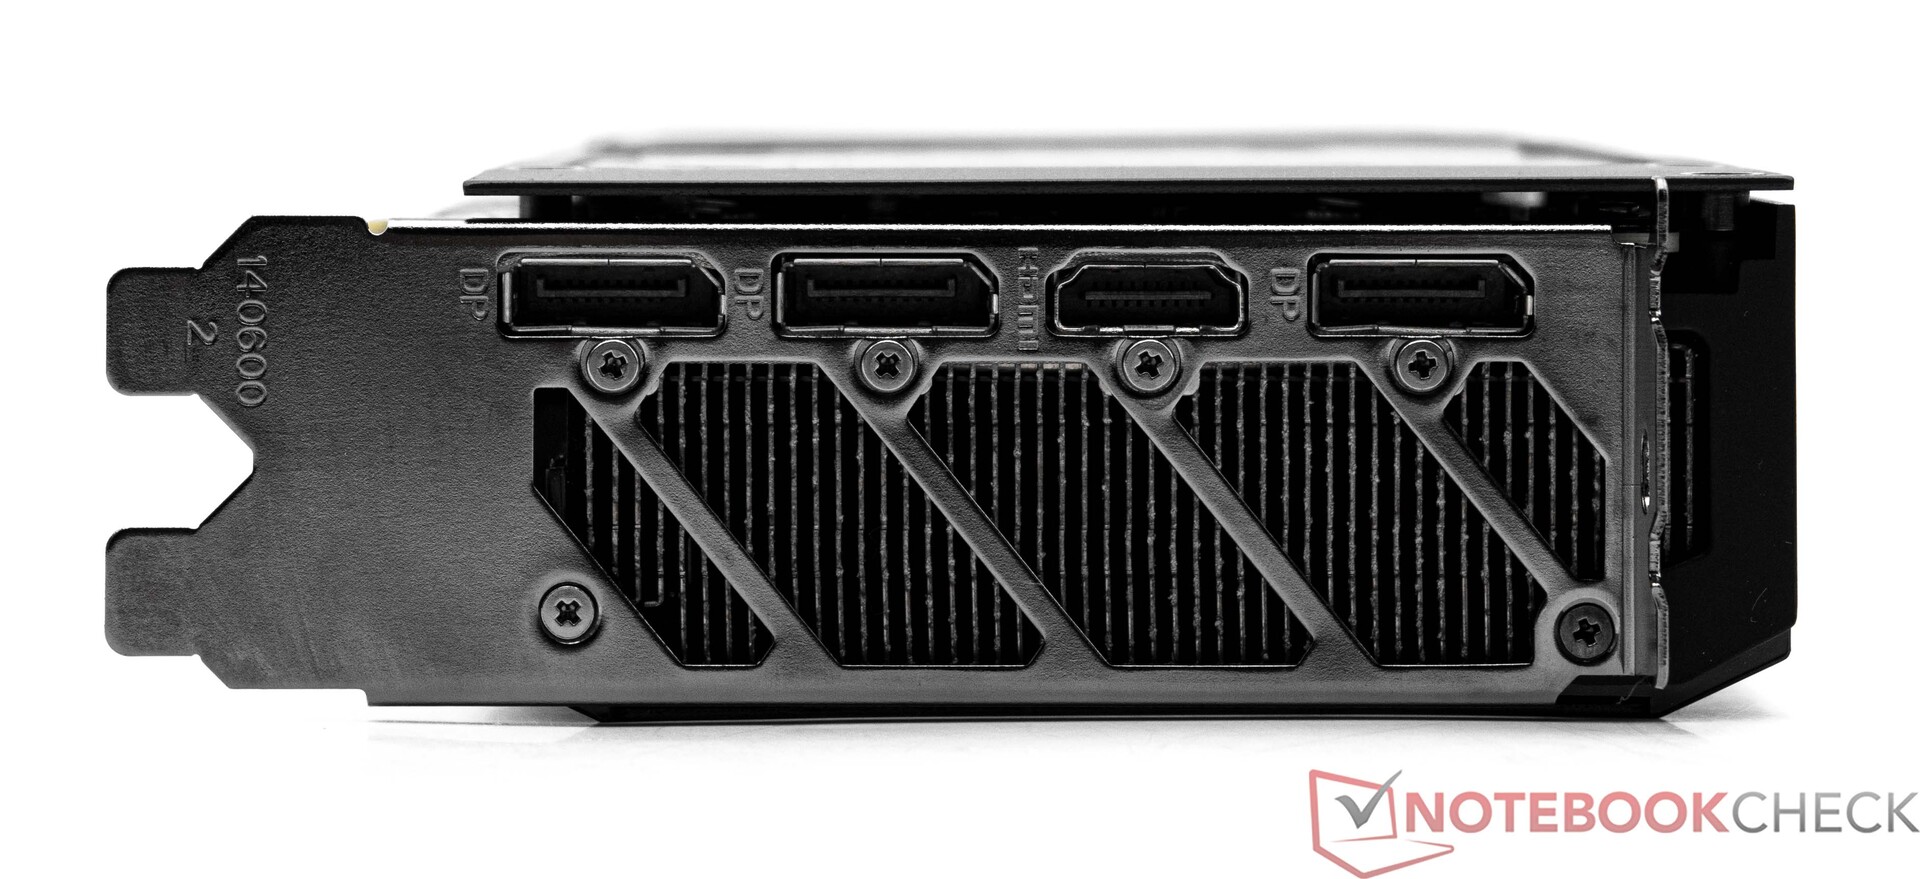
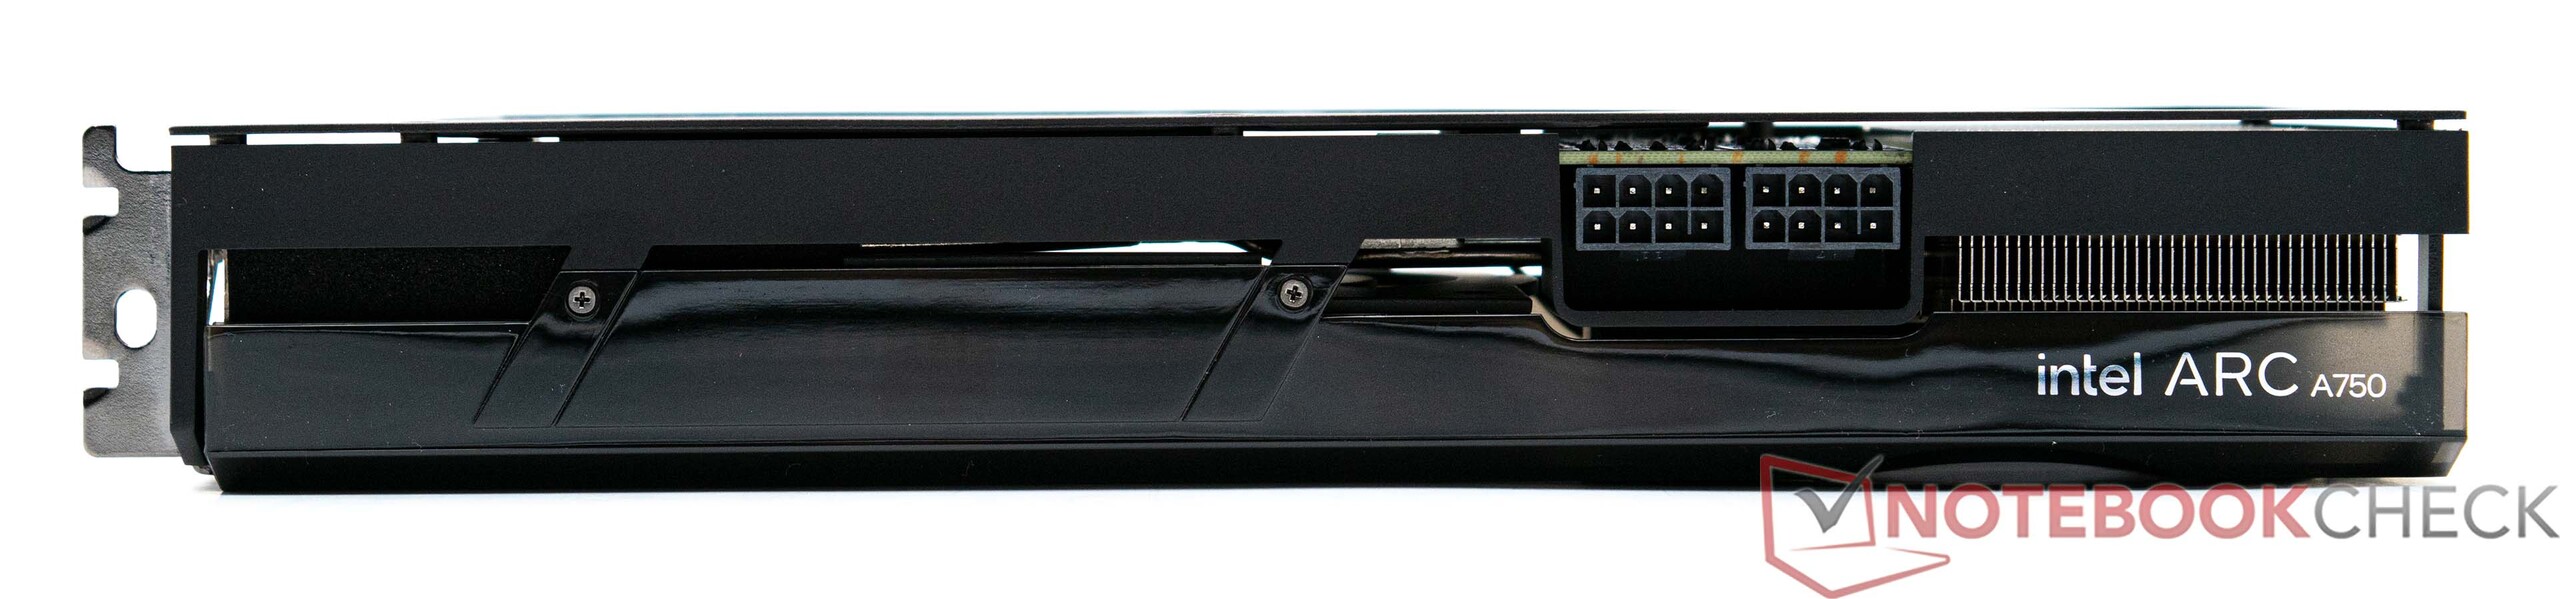
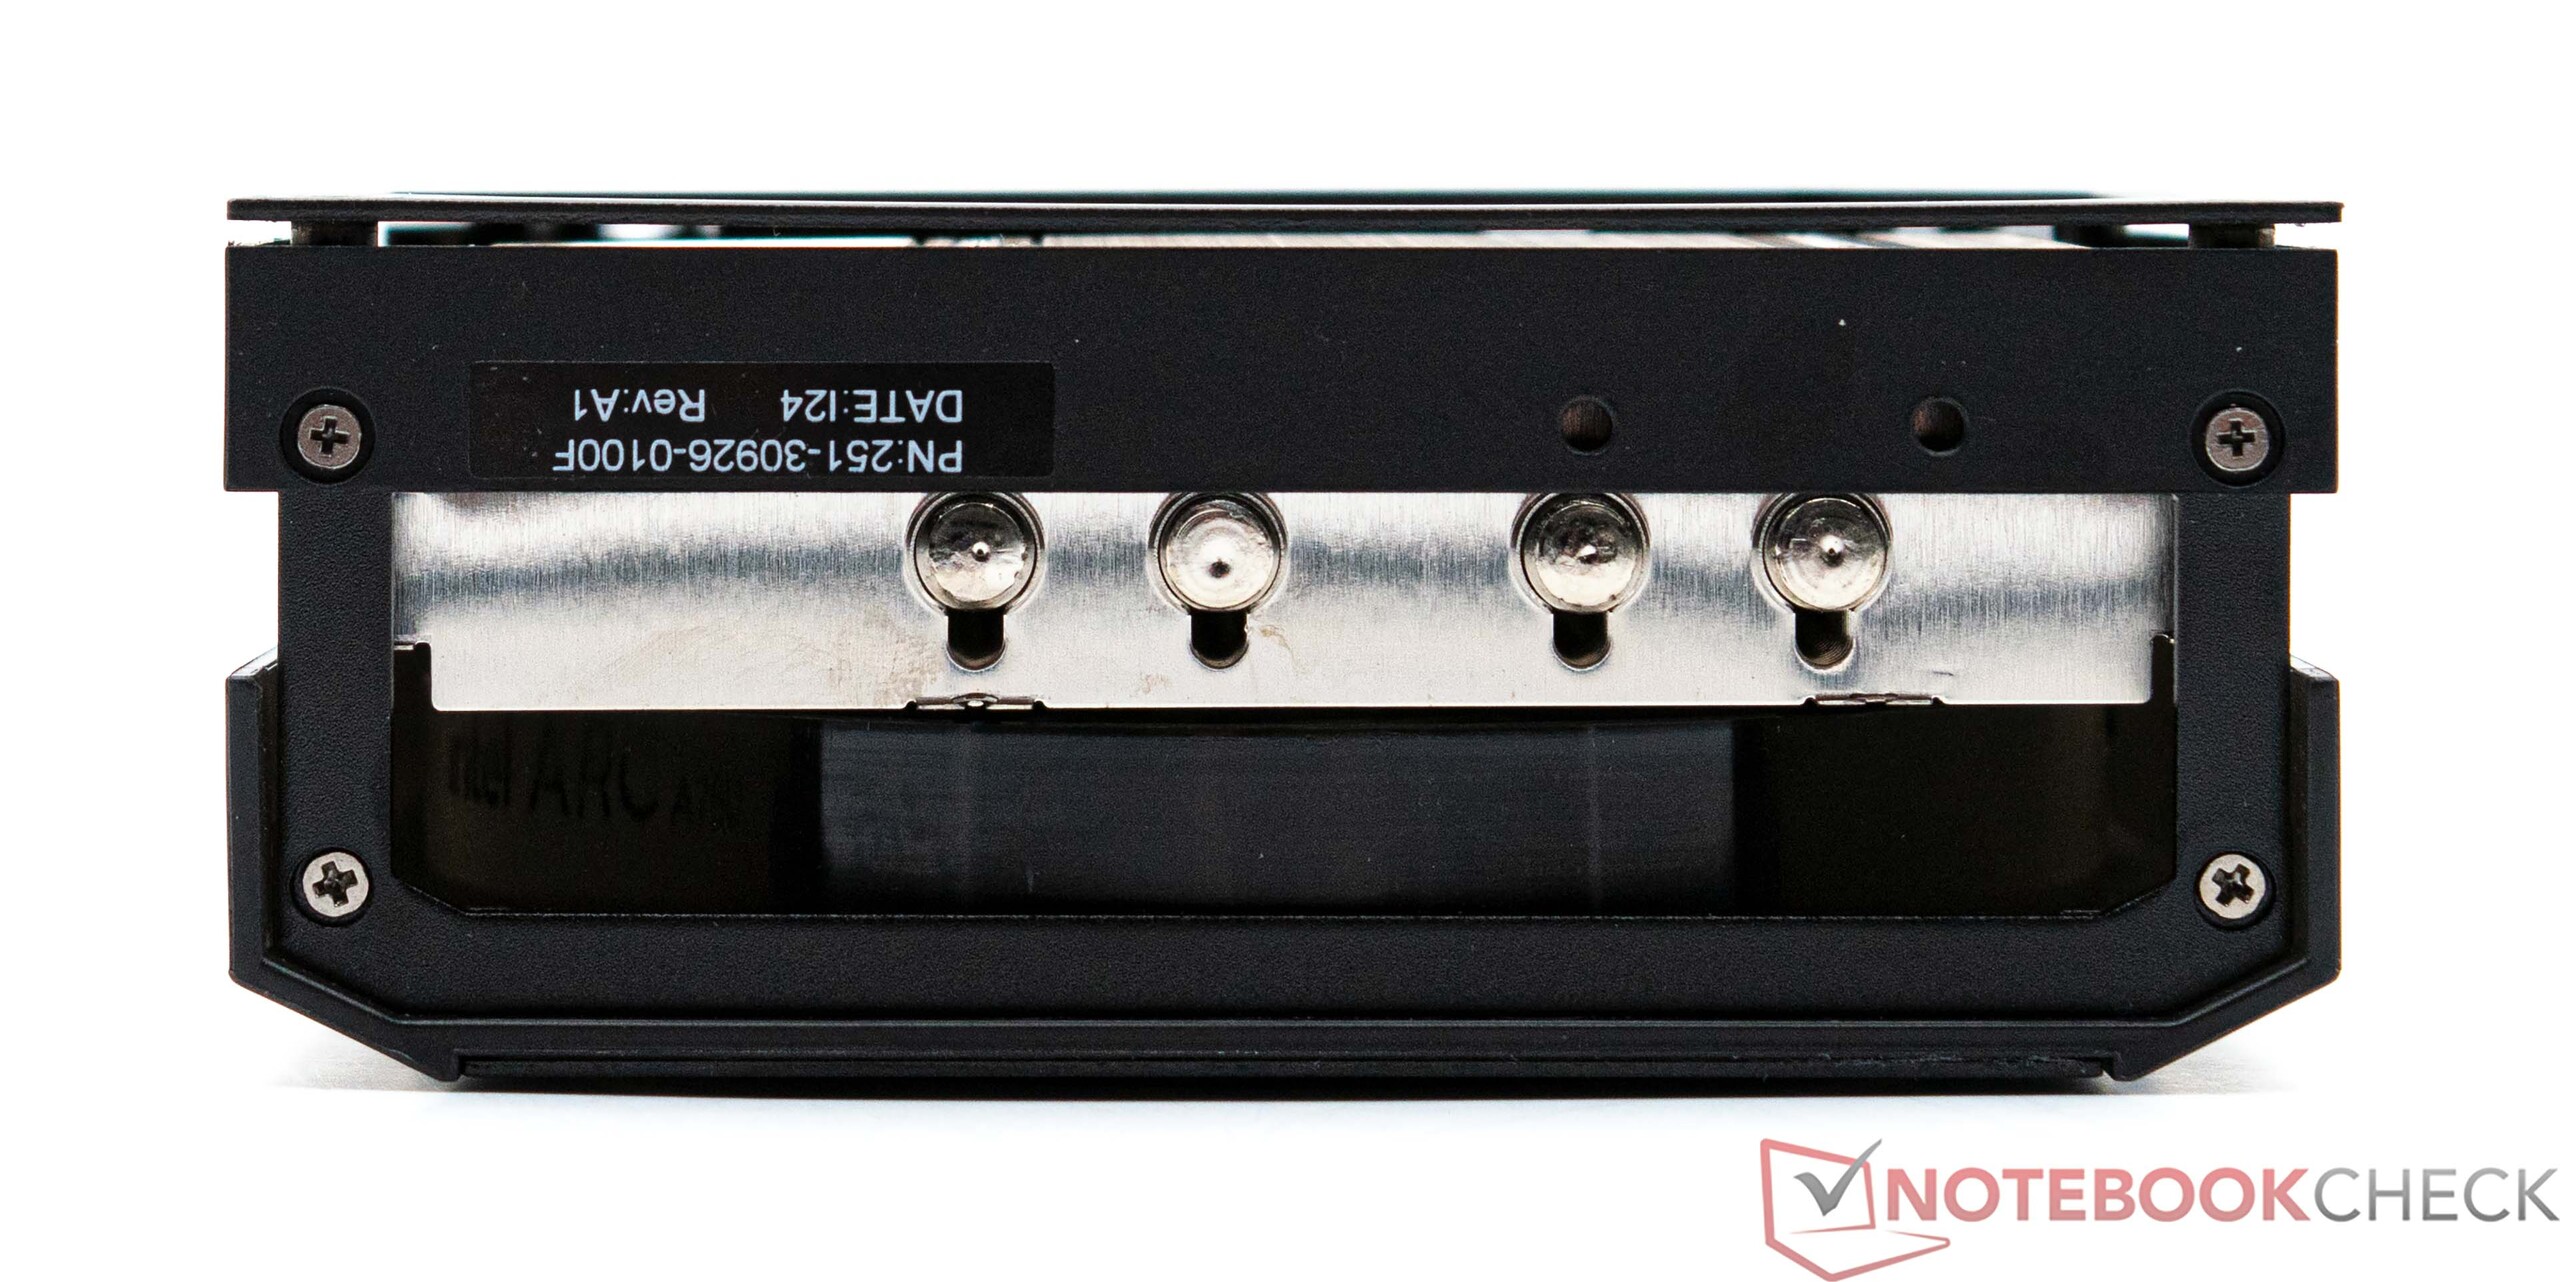
与宏碁掠夺者 BiFrost Arc A770 OC 相比,掠夺者 BiFrost Arc A750 OC 的散热器设计本身没有任何不同。安装的风扇看起来都不一样,这在目前许多显卡上并不多见。中间的小风扇完全由金属制成,叶片非常薄。 根据 Aeroblade 的设计,我们可以看到一些与我们在笔记本电脑上遇到的各种风扇设计相似的地方。宏碁掠夺者 BiFrost Arc A750 OC 还配备了两个 6+2 针 PCIe 电源插座,通过 PCIe 4.0 x16 插槽提供小范围供电。在外部端口方面,我们注意到了一次 HDMI 2.1 和三次 DisplayPort 2.0,这意味着宏碁掠夺者 BiFrost Arc A750 OC 比 Nvidia 最新机型提供了更多现代连接选项。与此同时,AMD 是目前 RX-7000 型号中唯一提供 DisplayPort 2.1 的厂商,因此,它提供了最先进的连接功能。
关于我们测试系统的信息
宏碁掠夺者 BiFrost Arc A750 OC 详细介绍
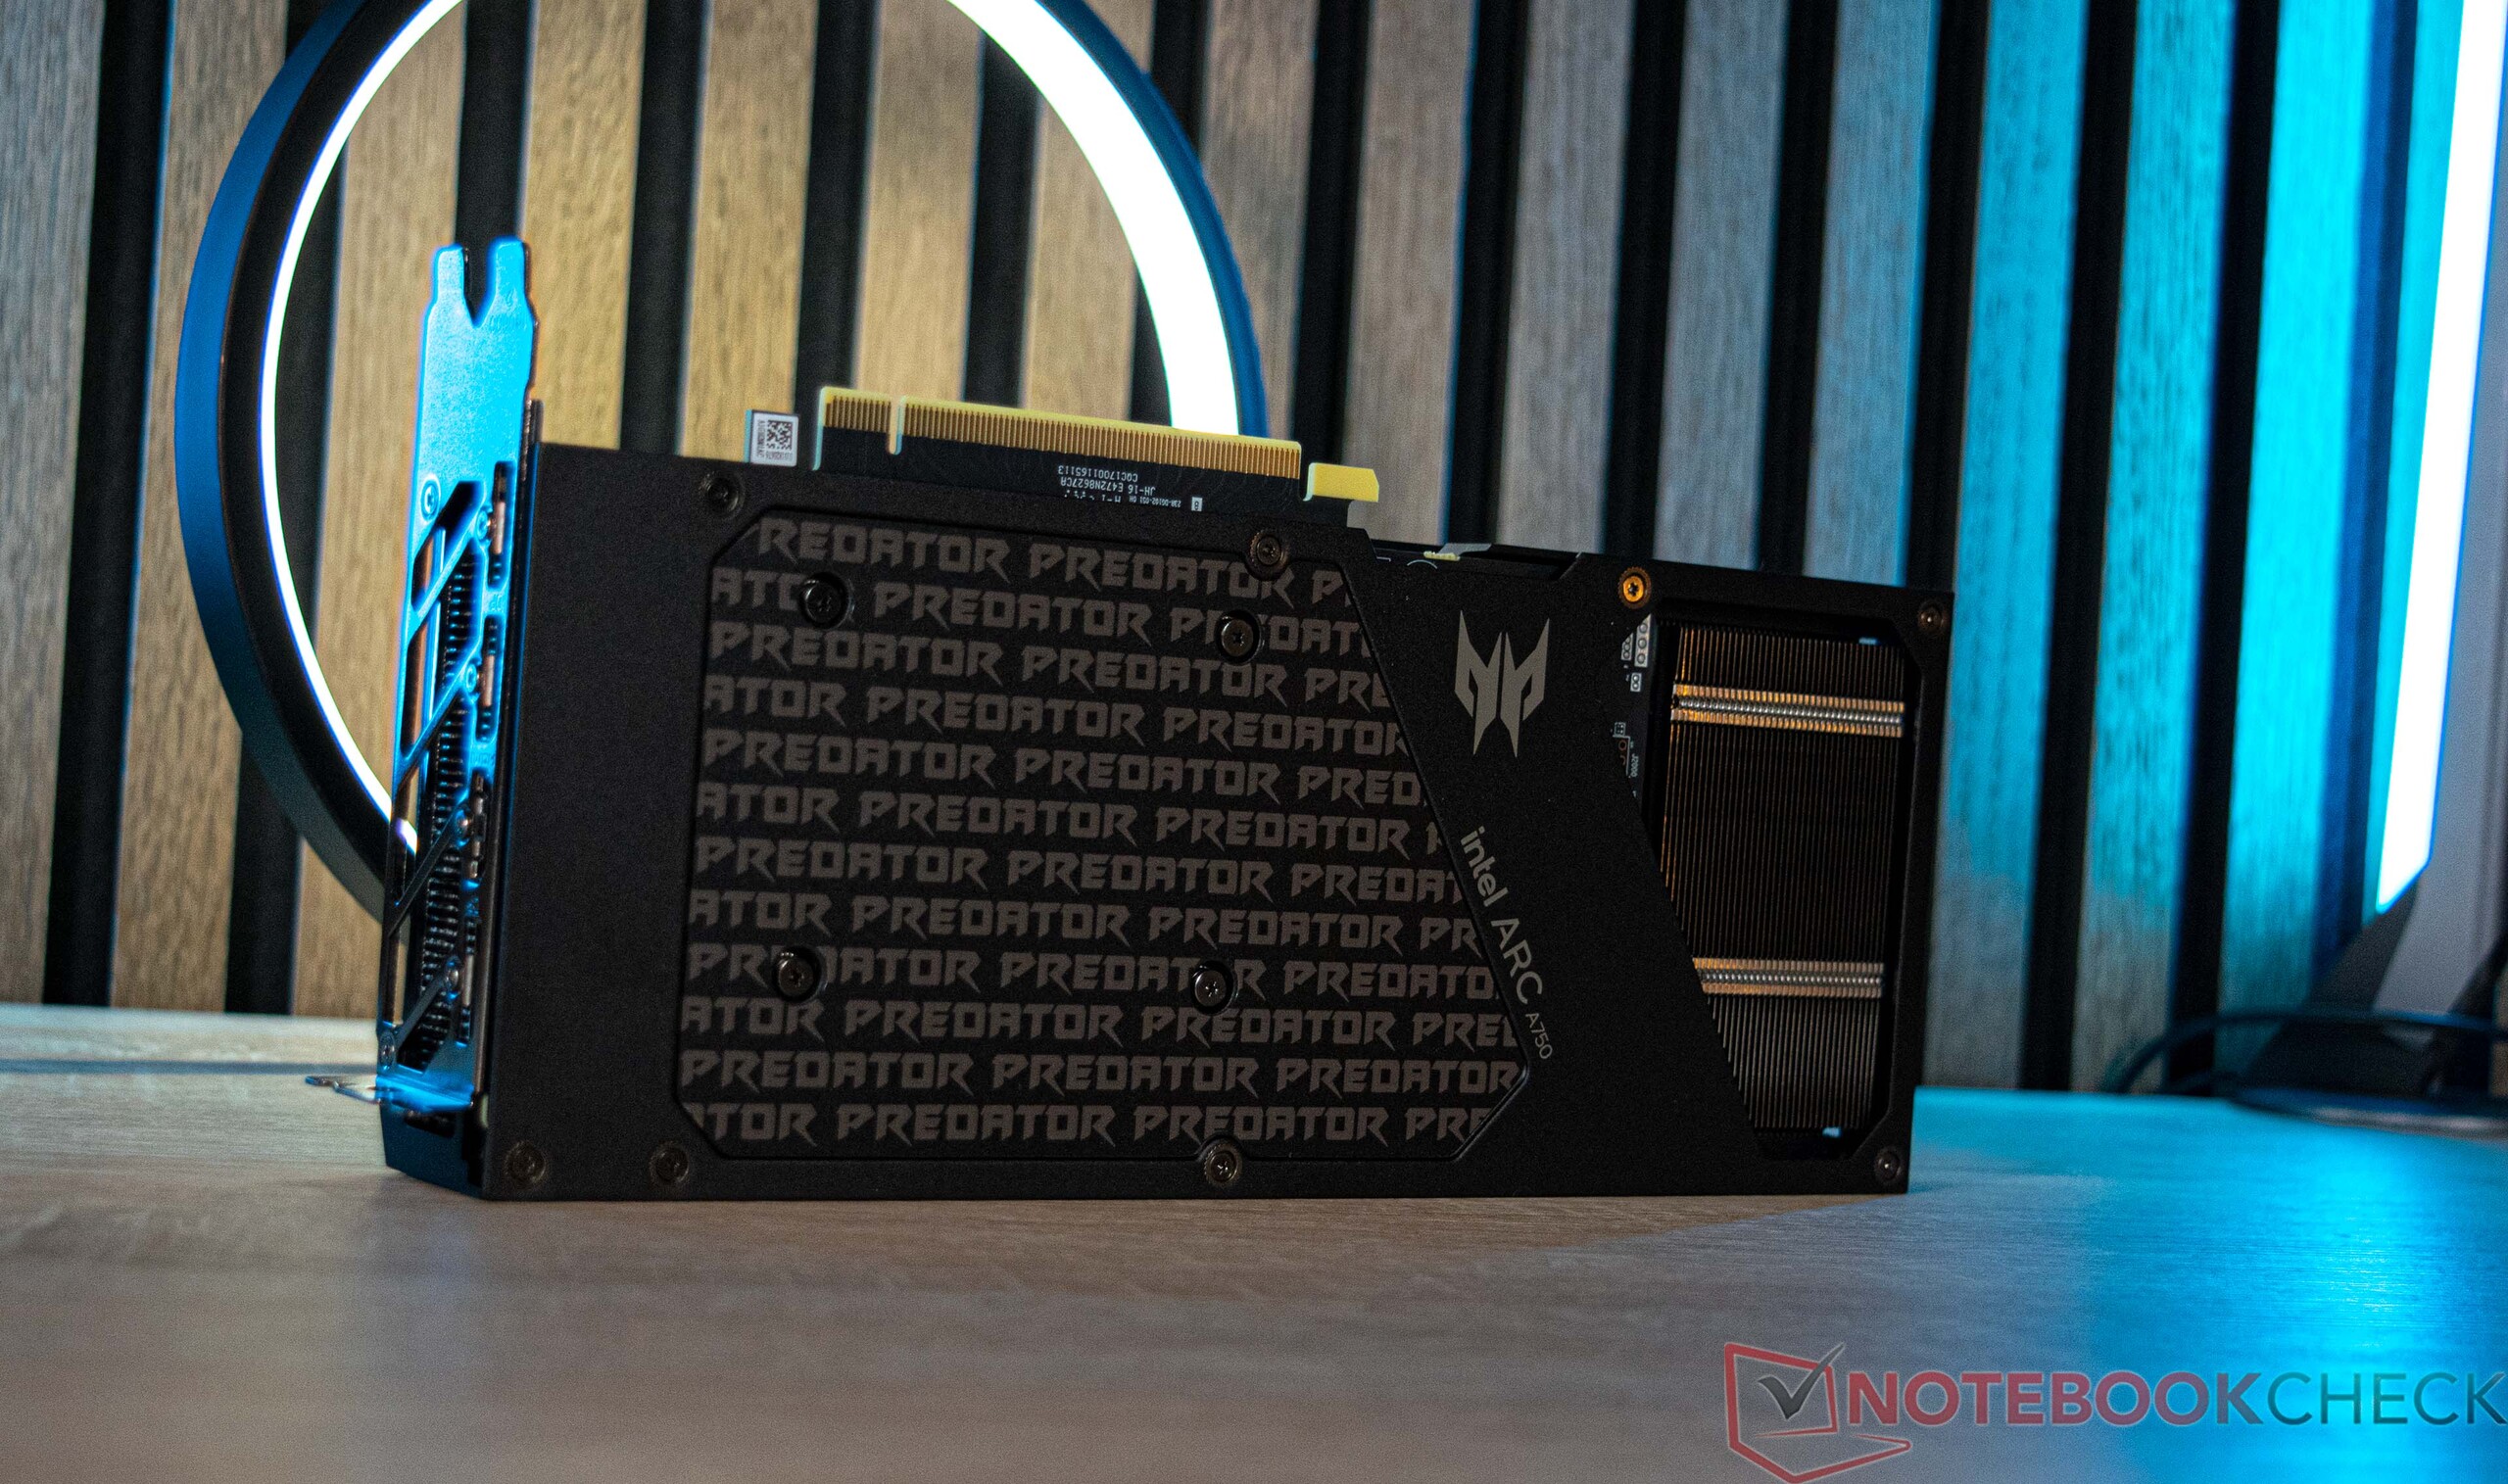
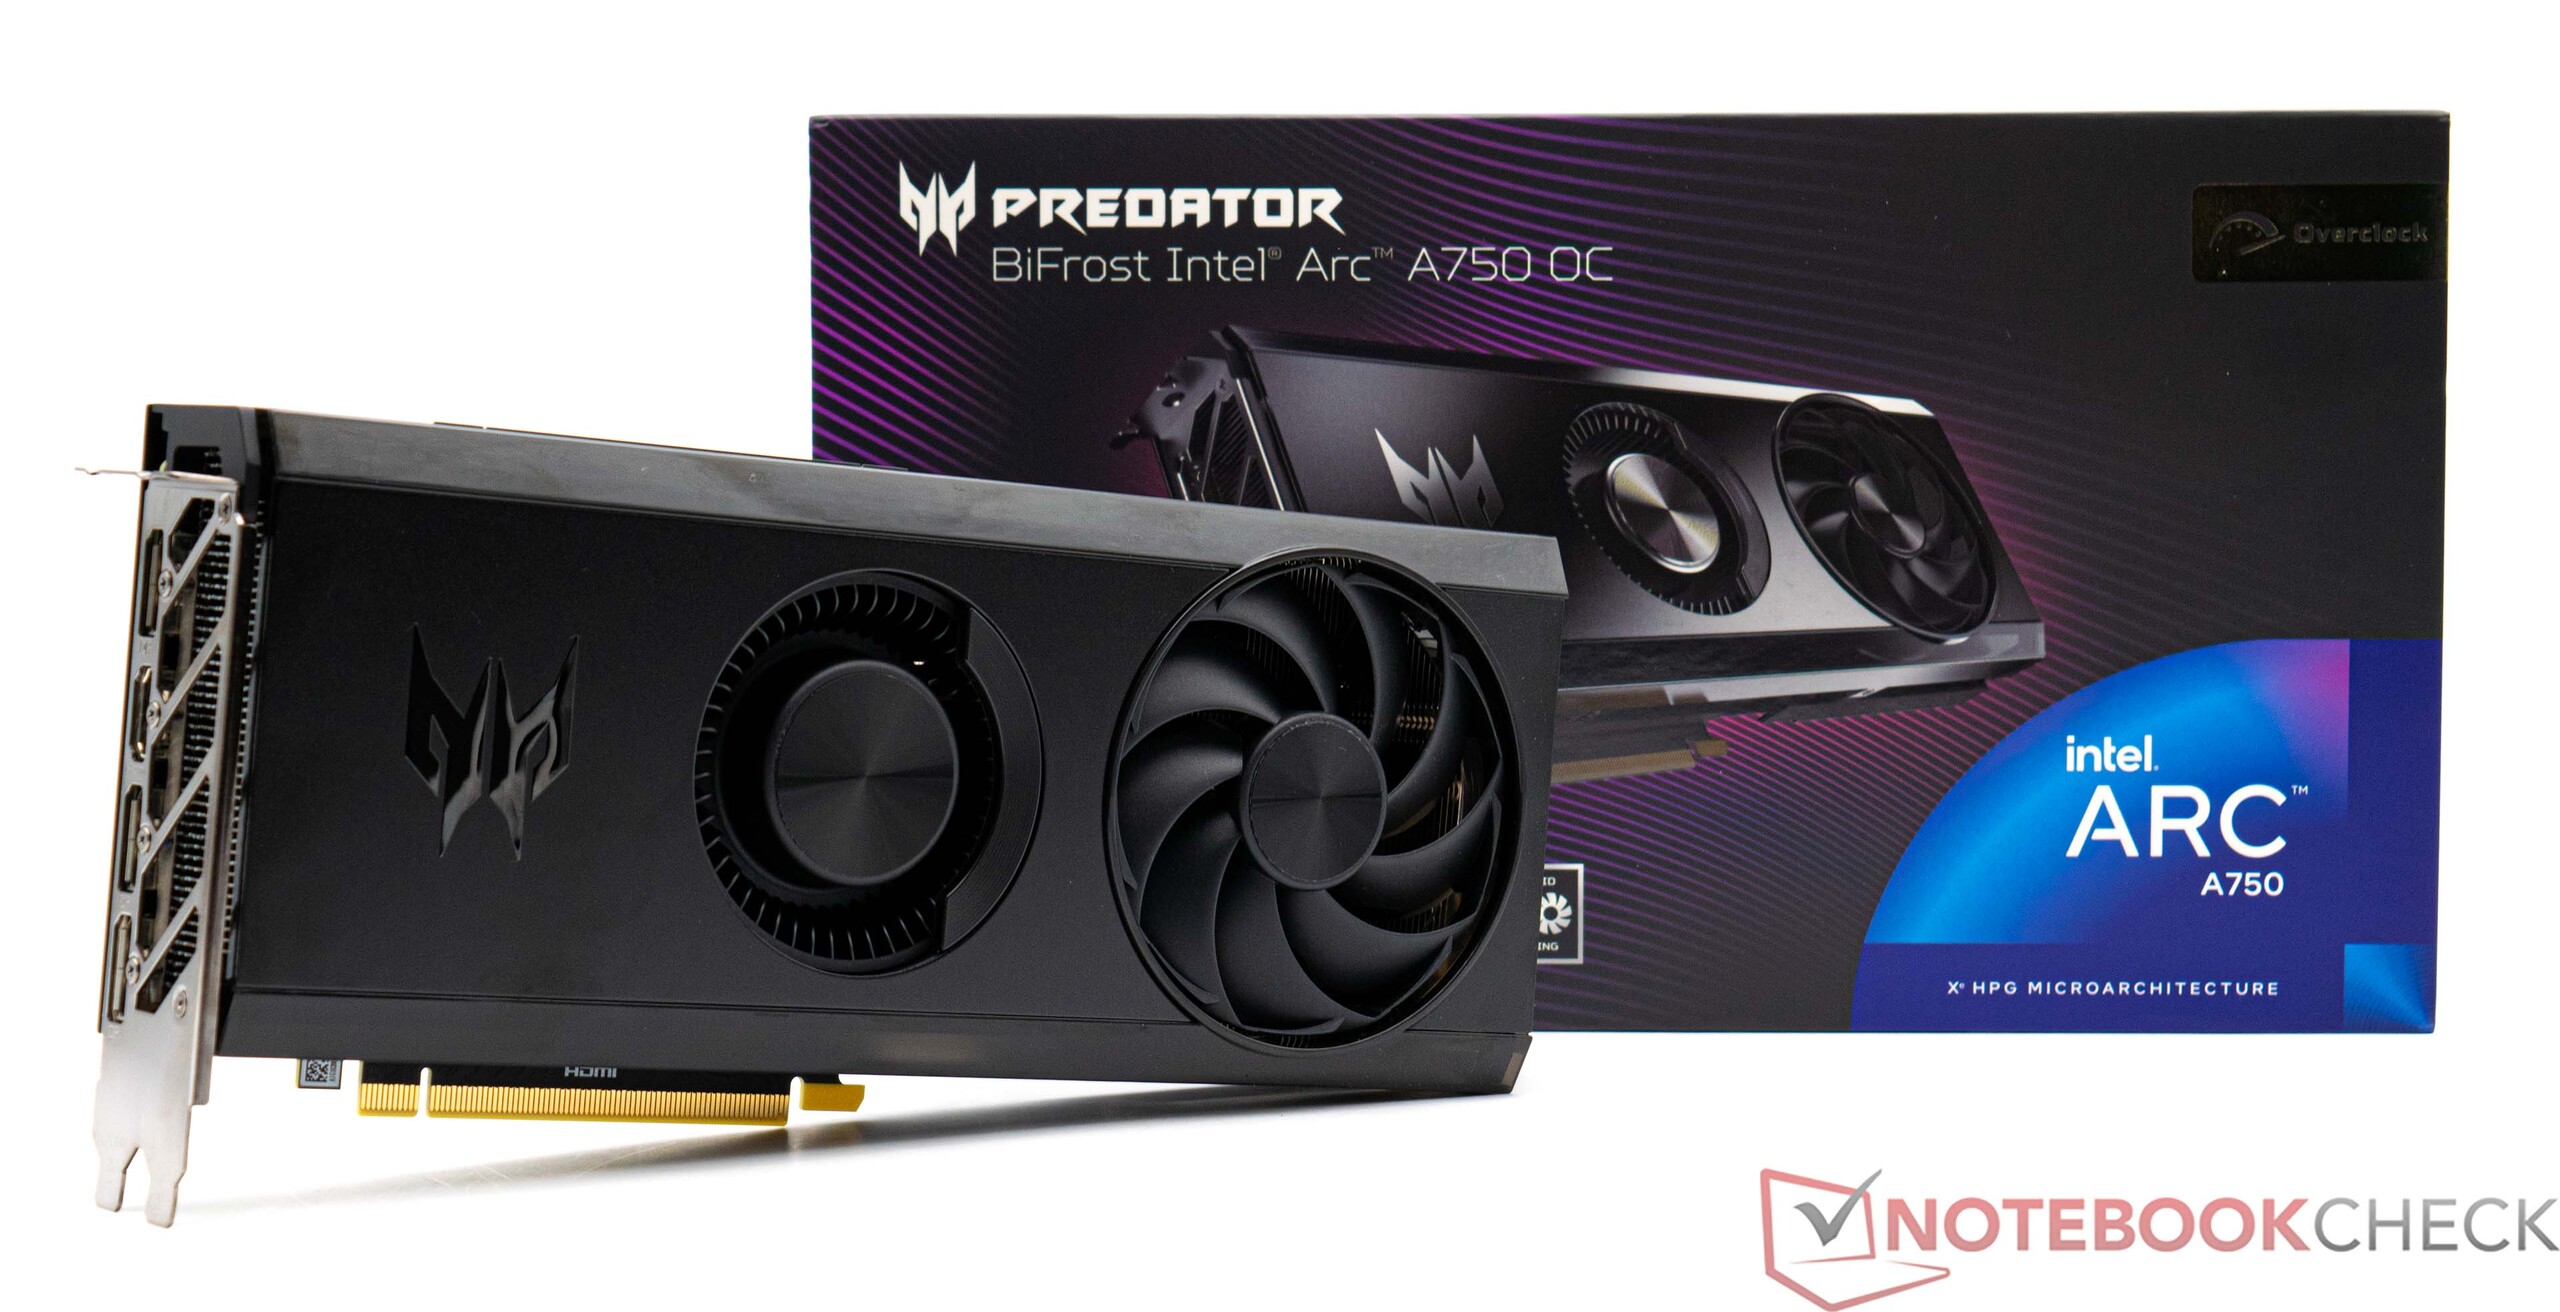
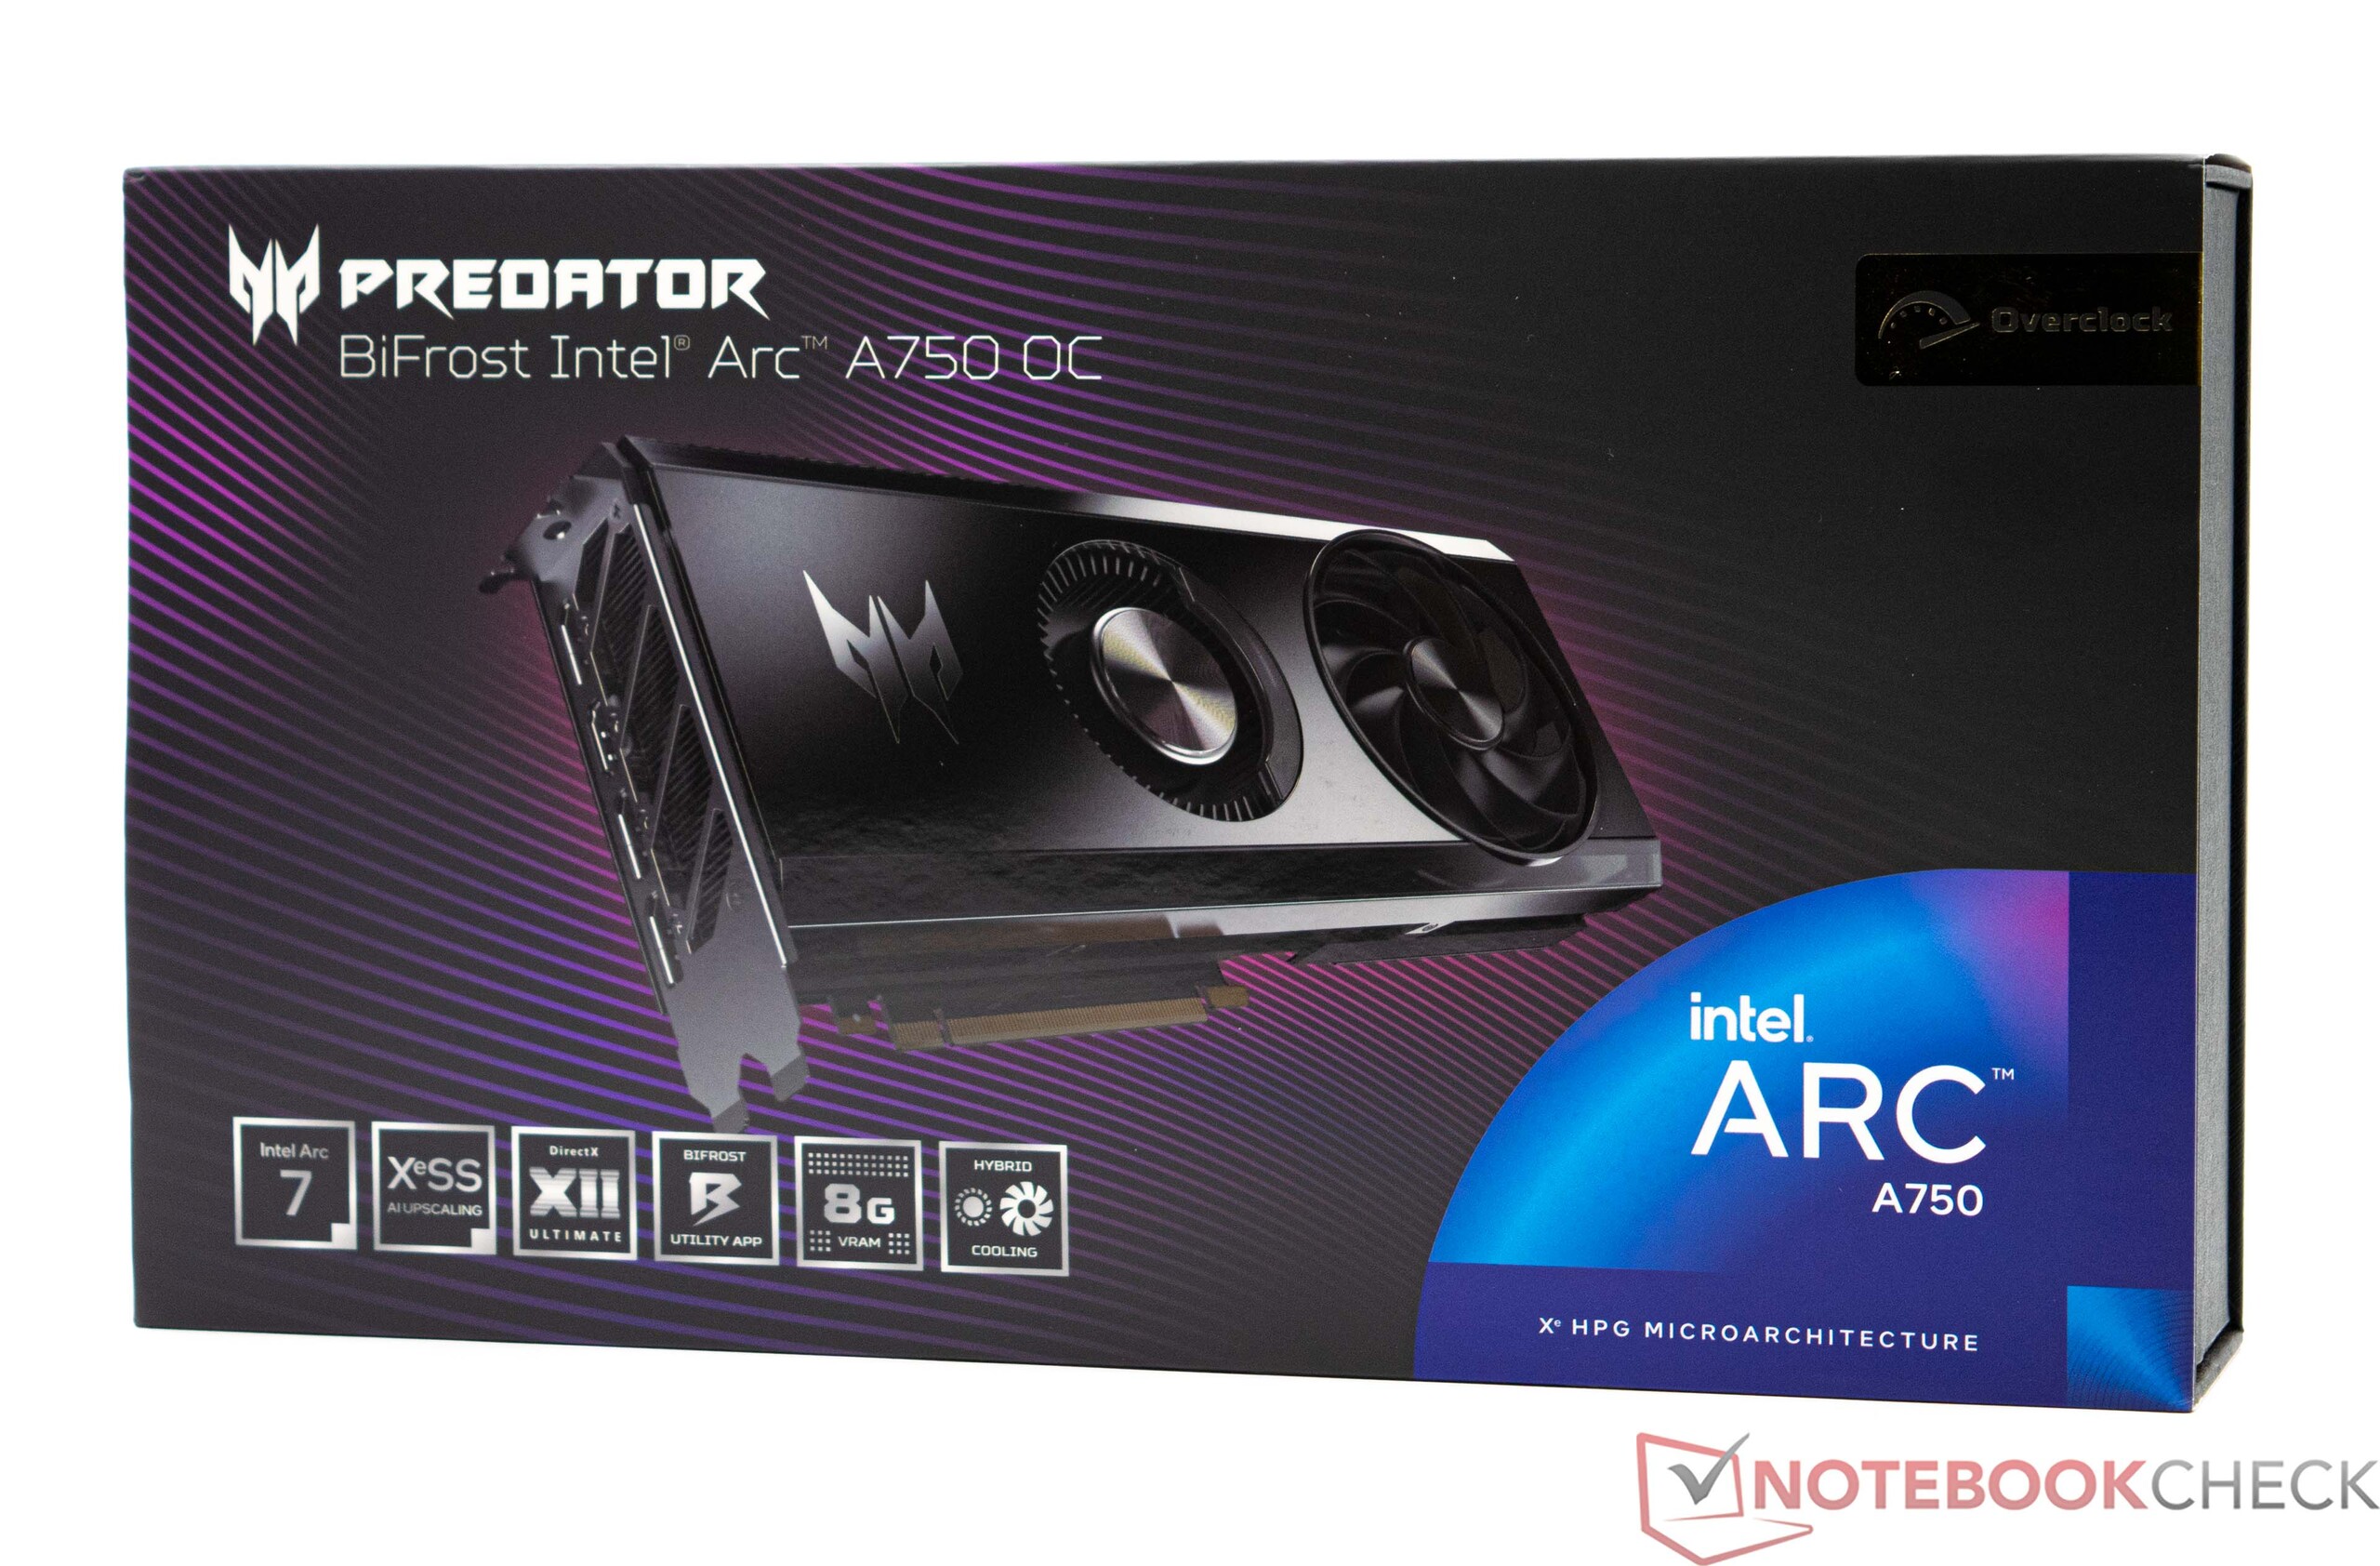
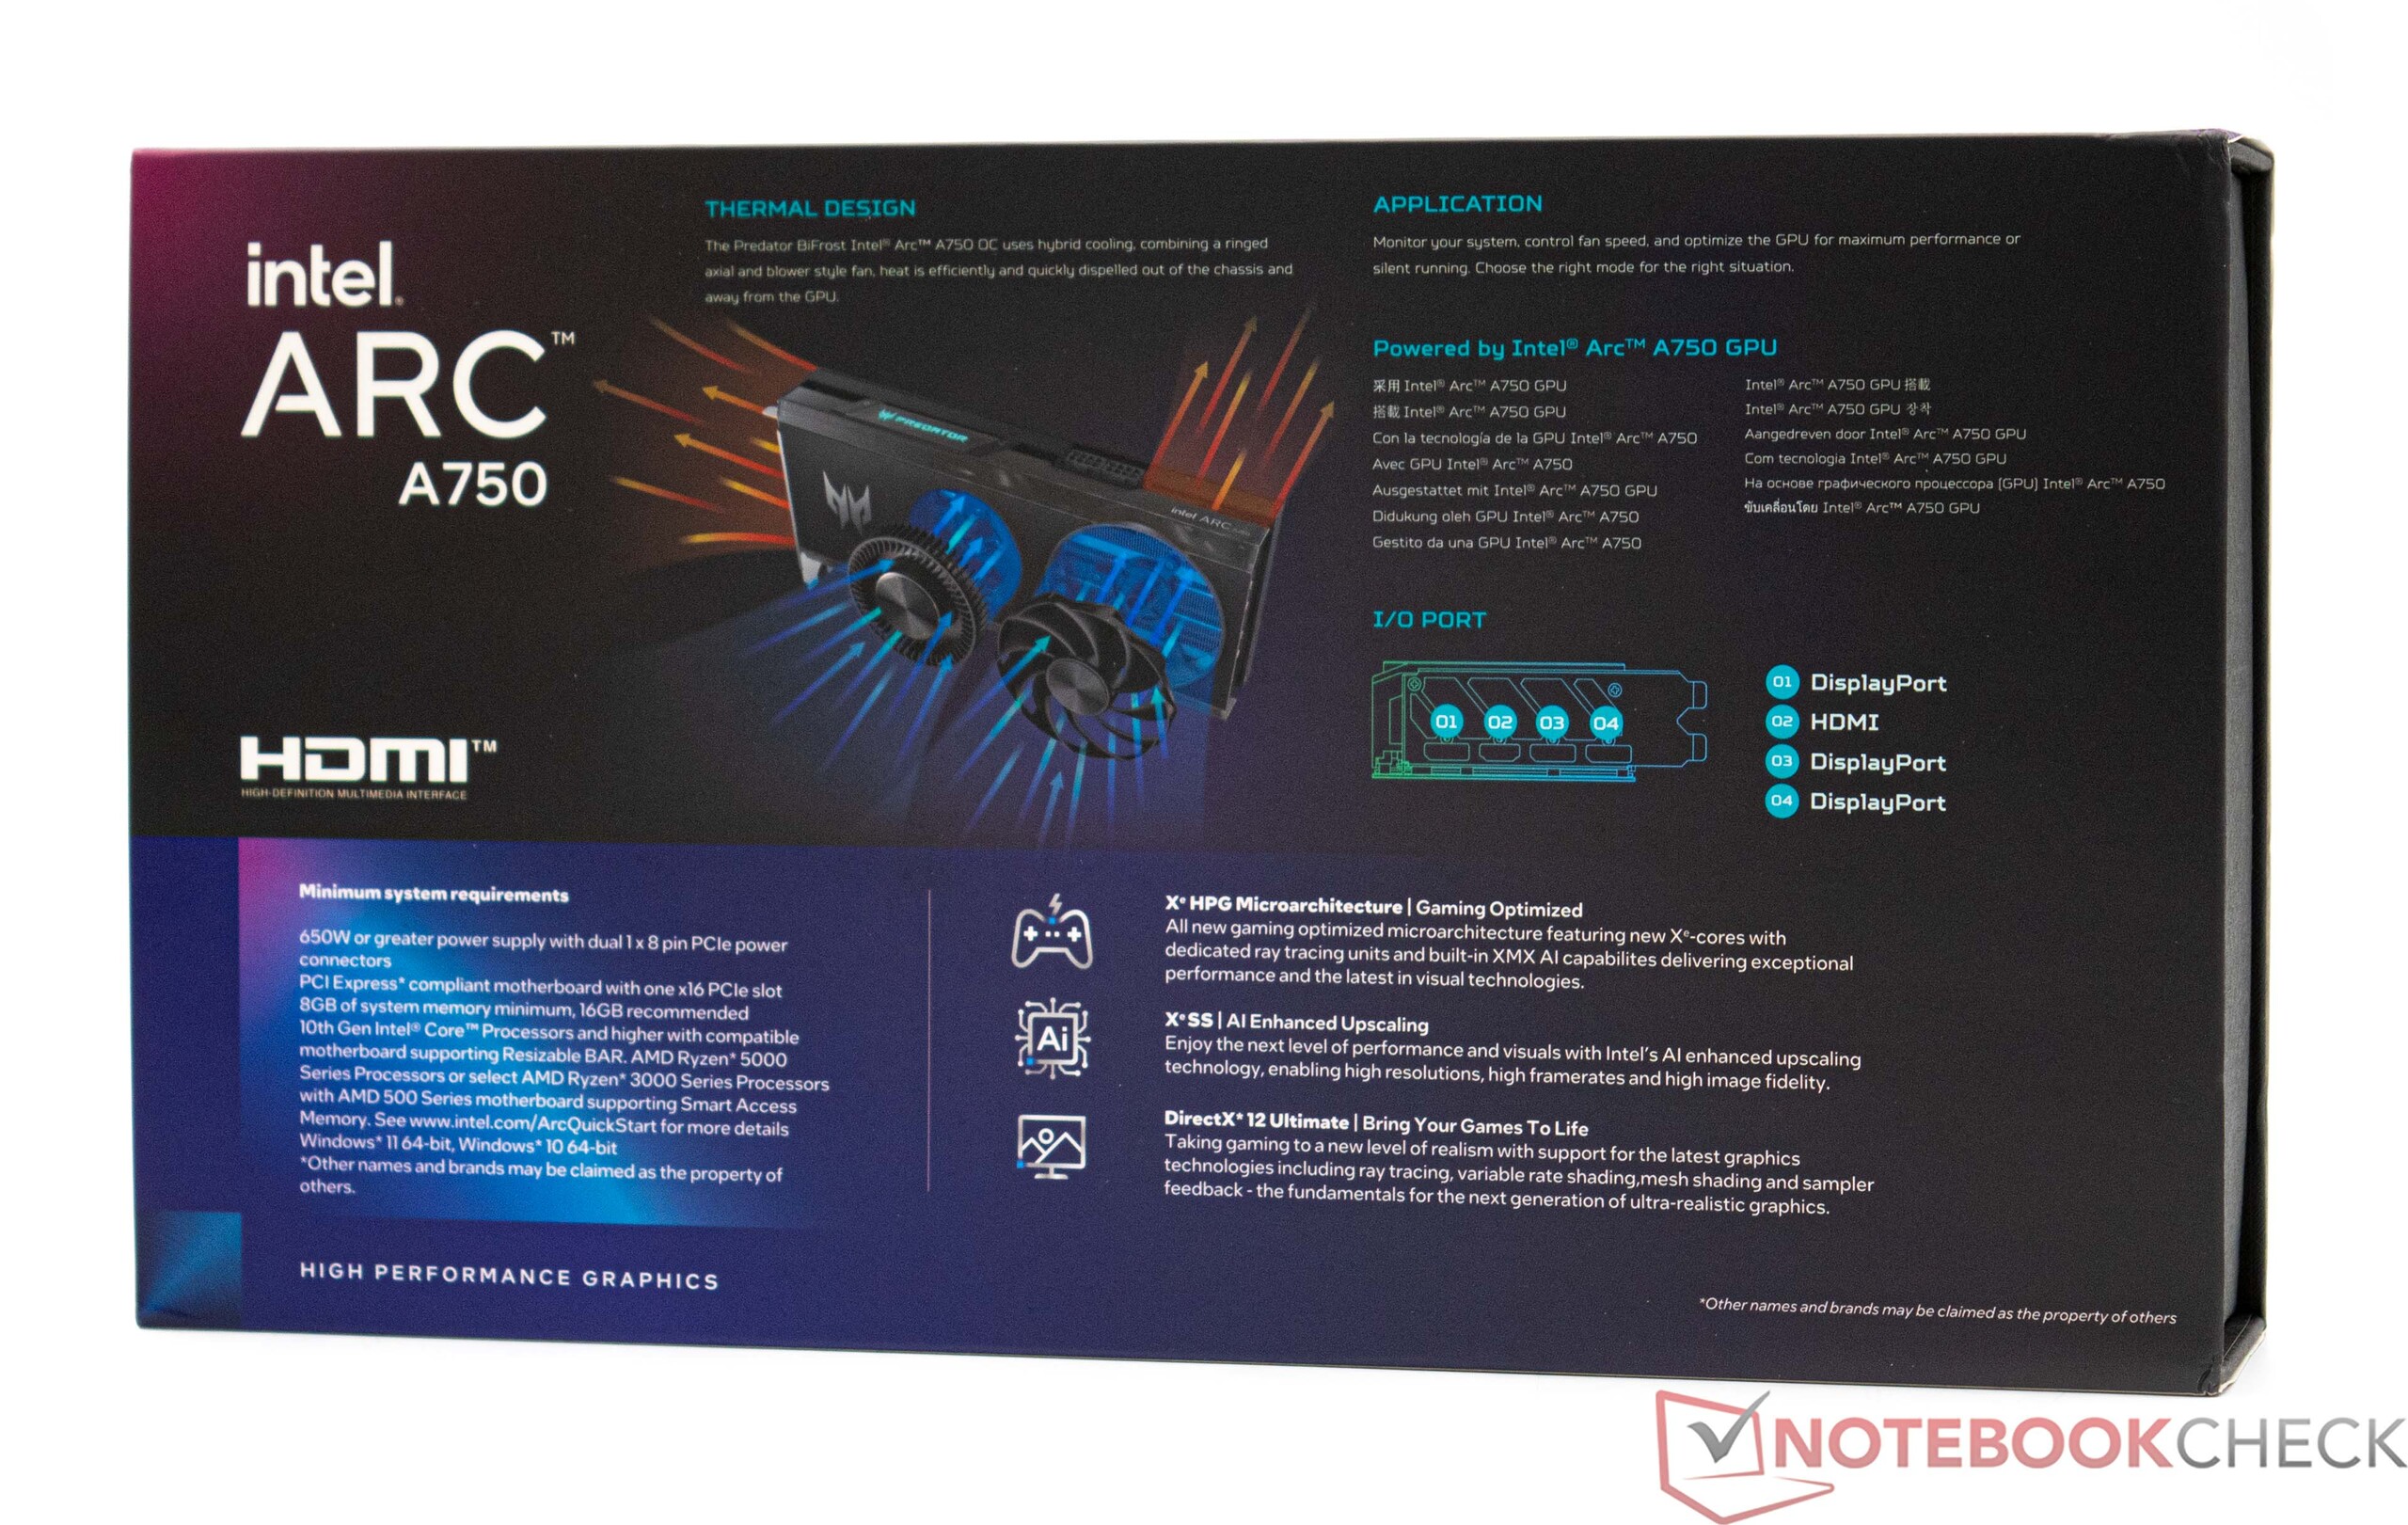
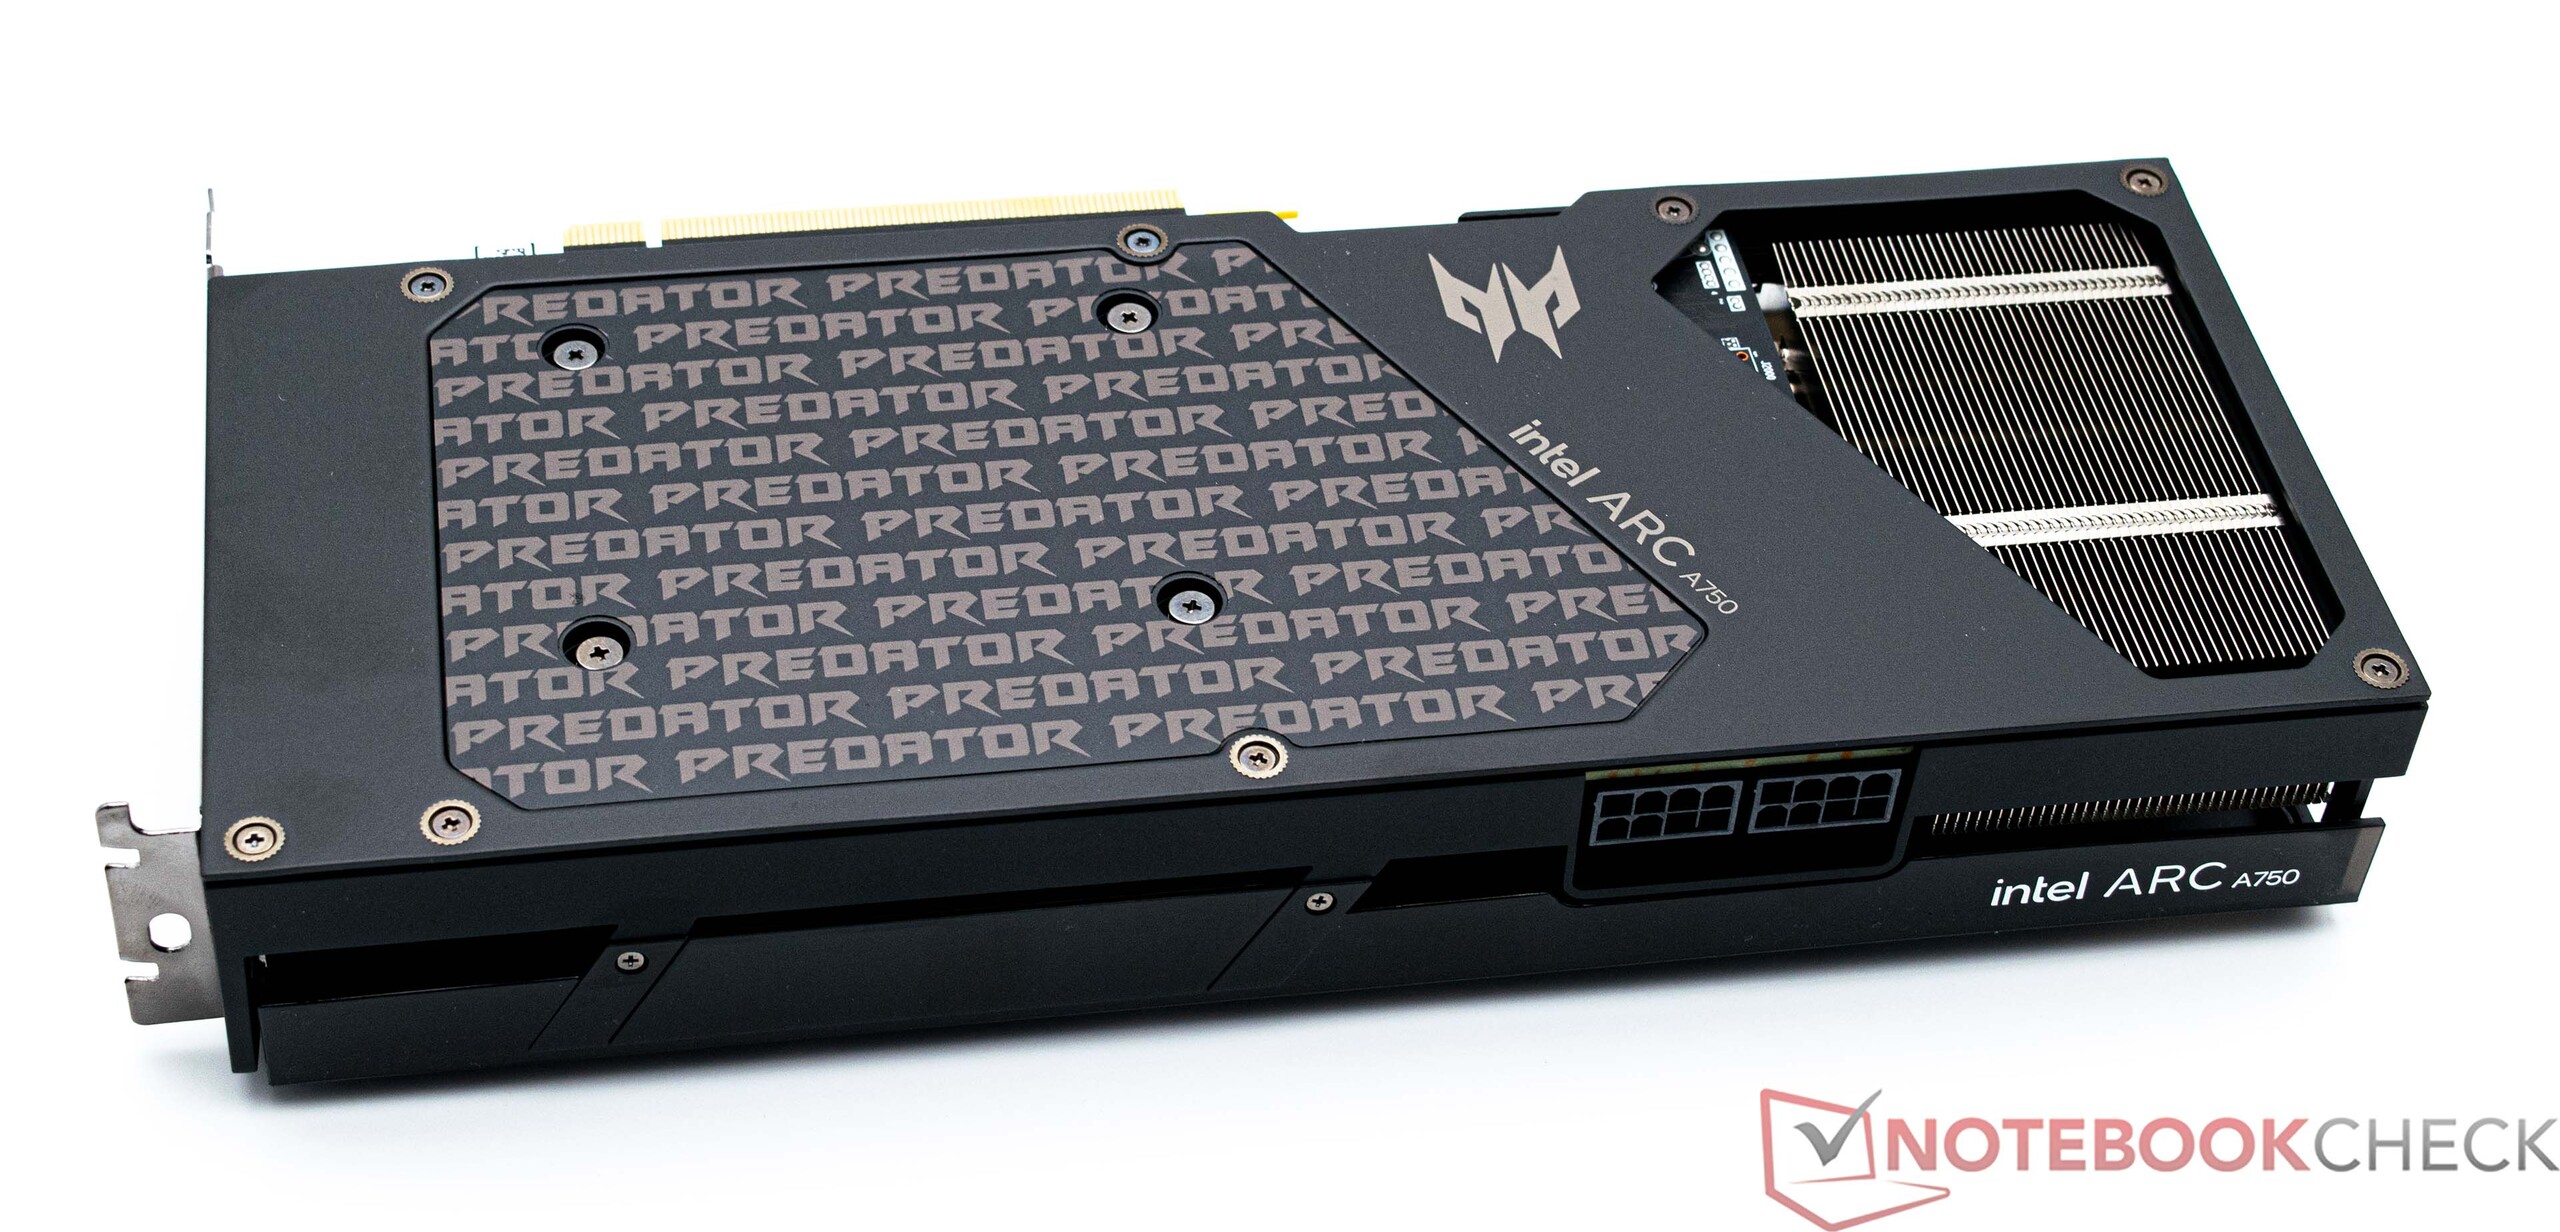
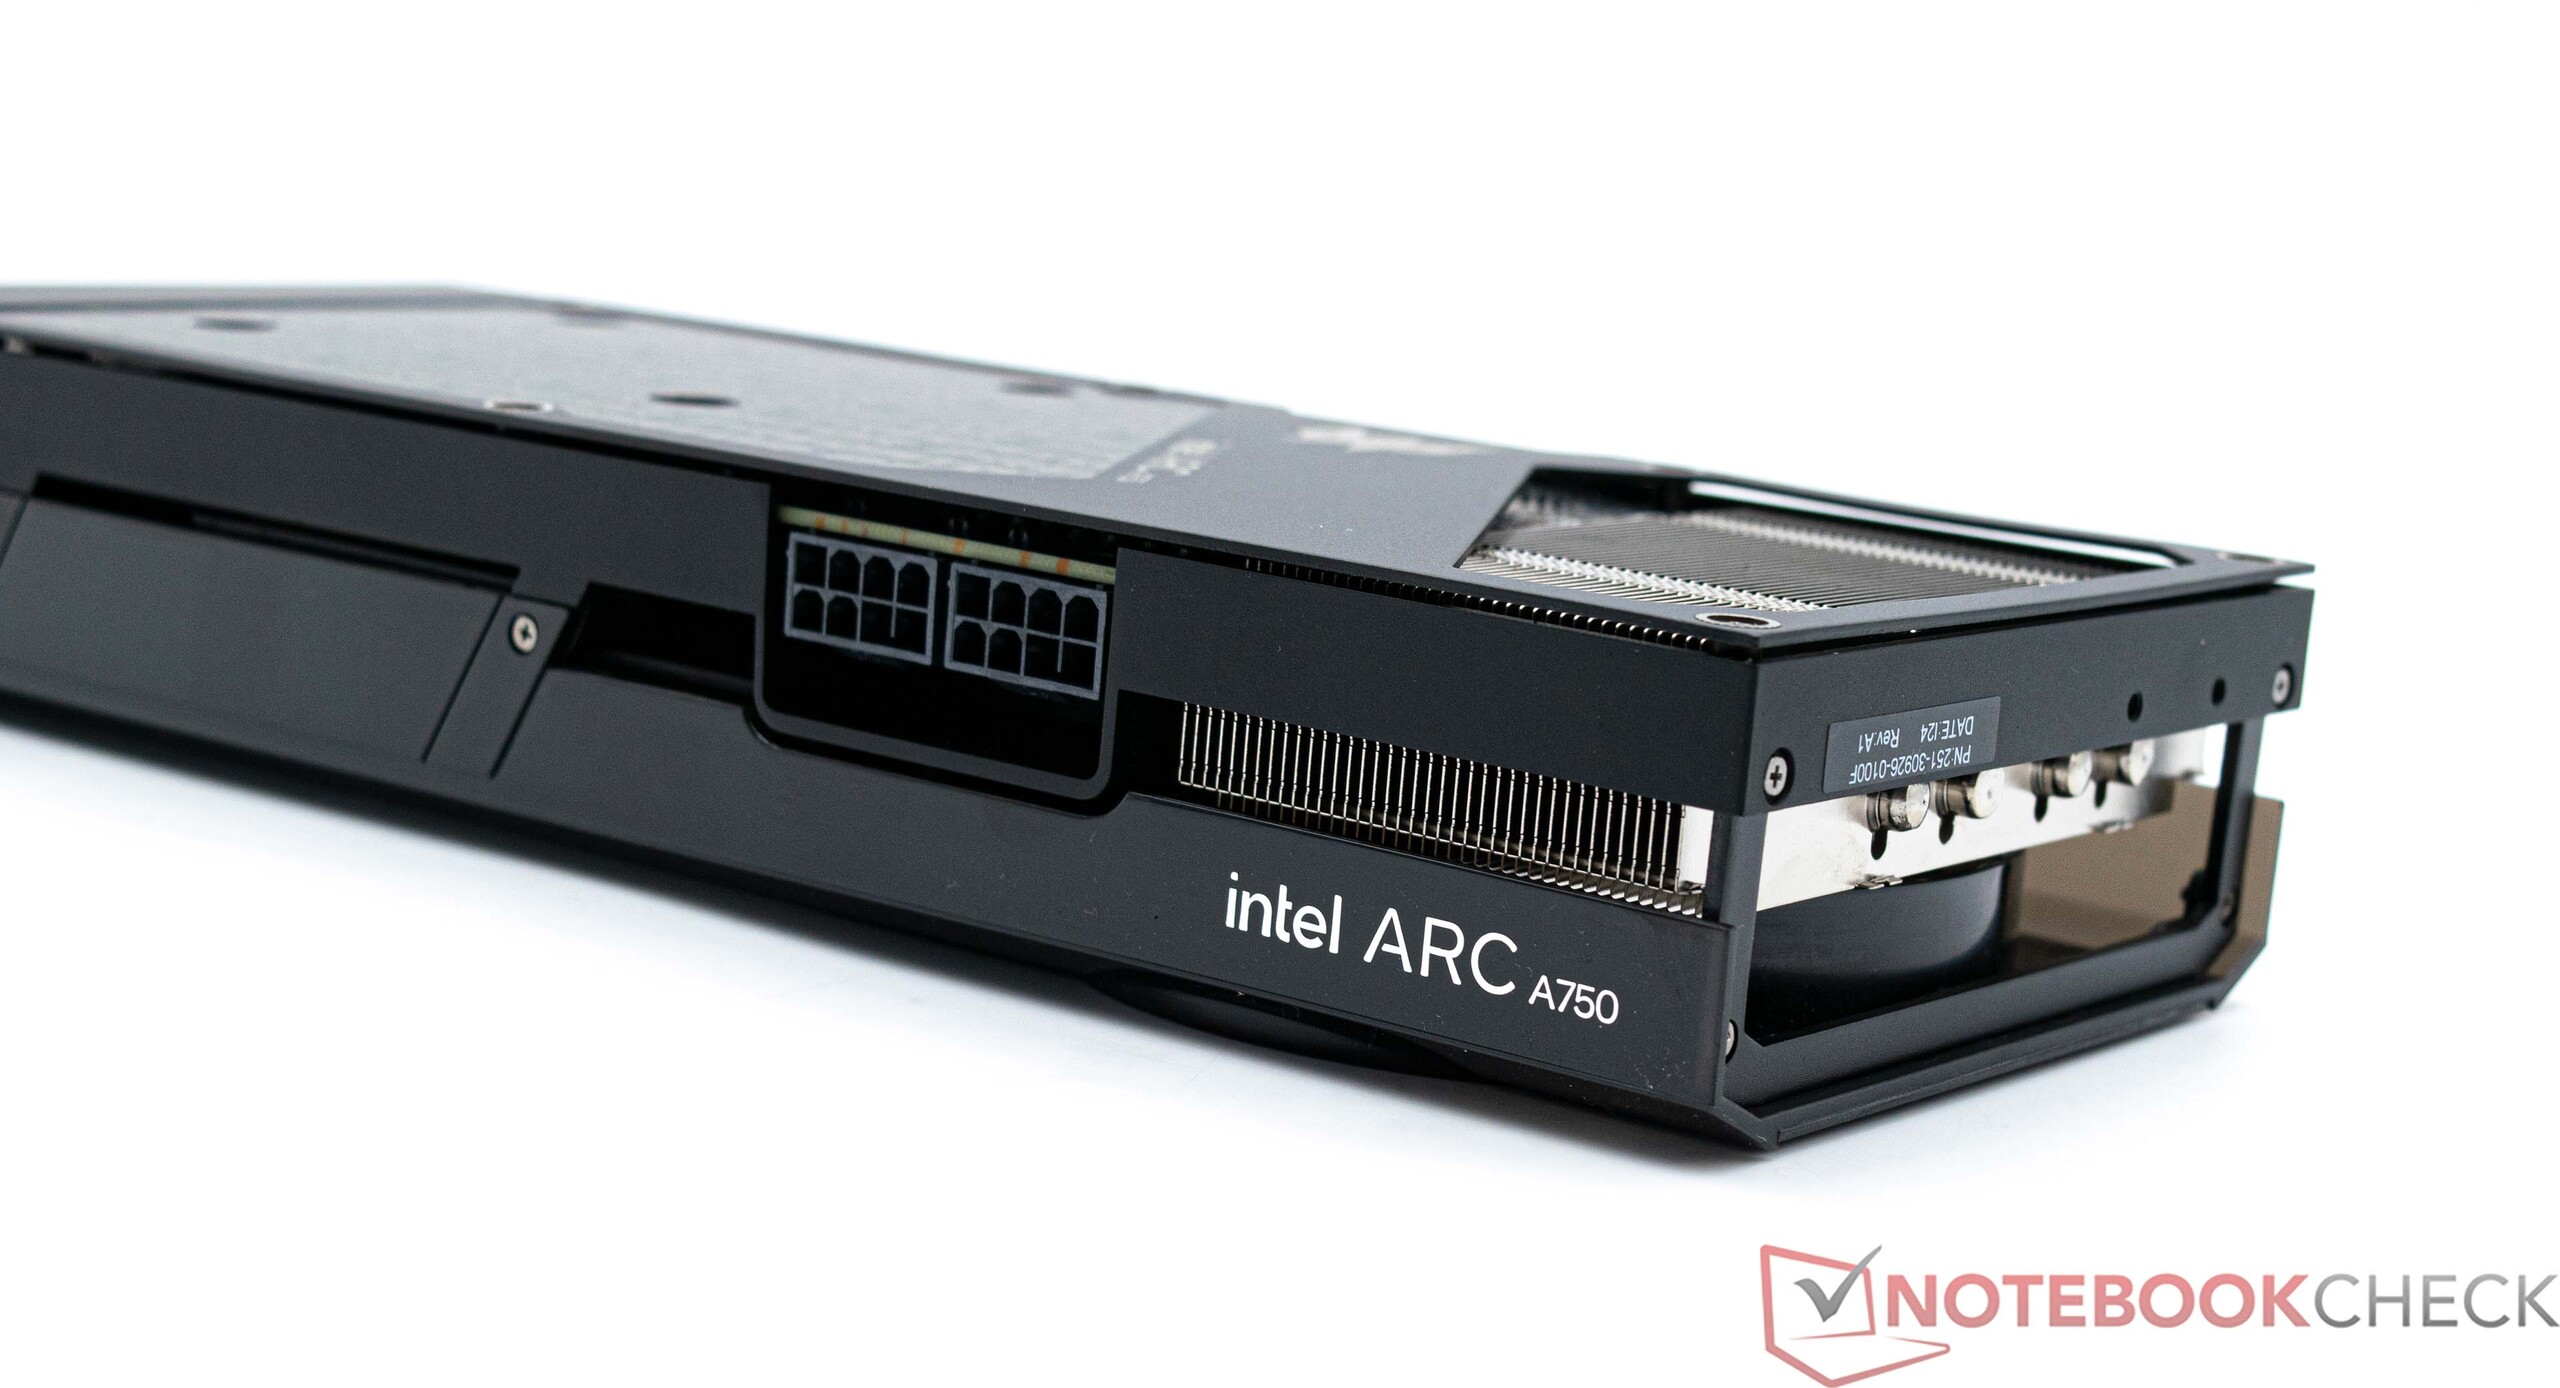
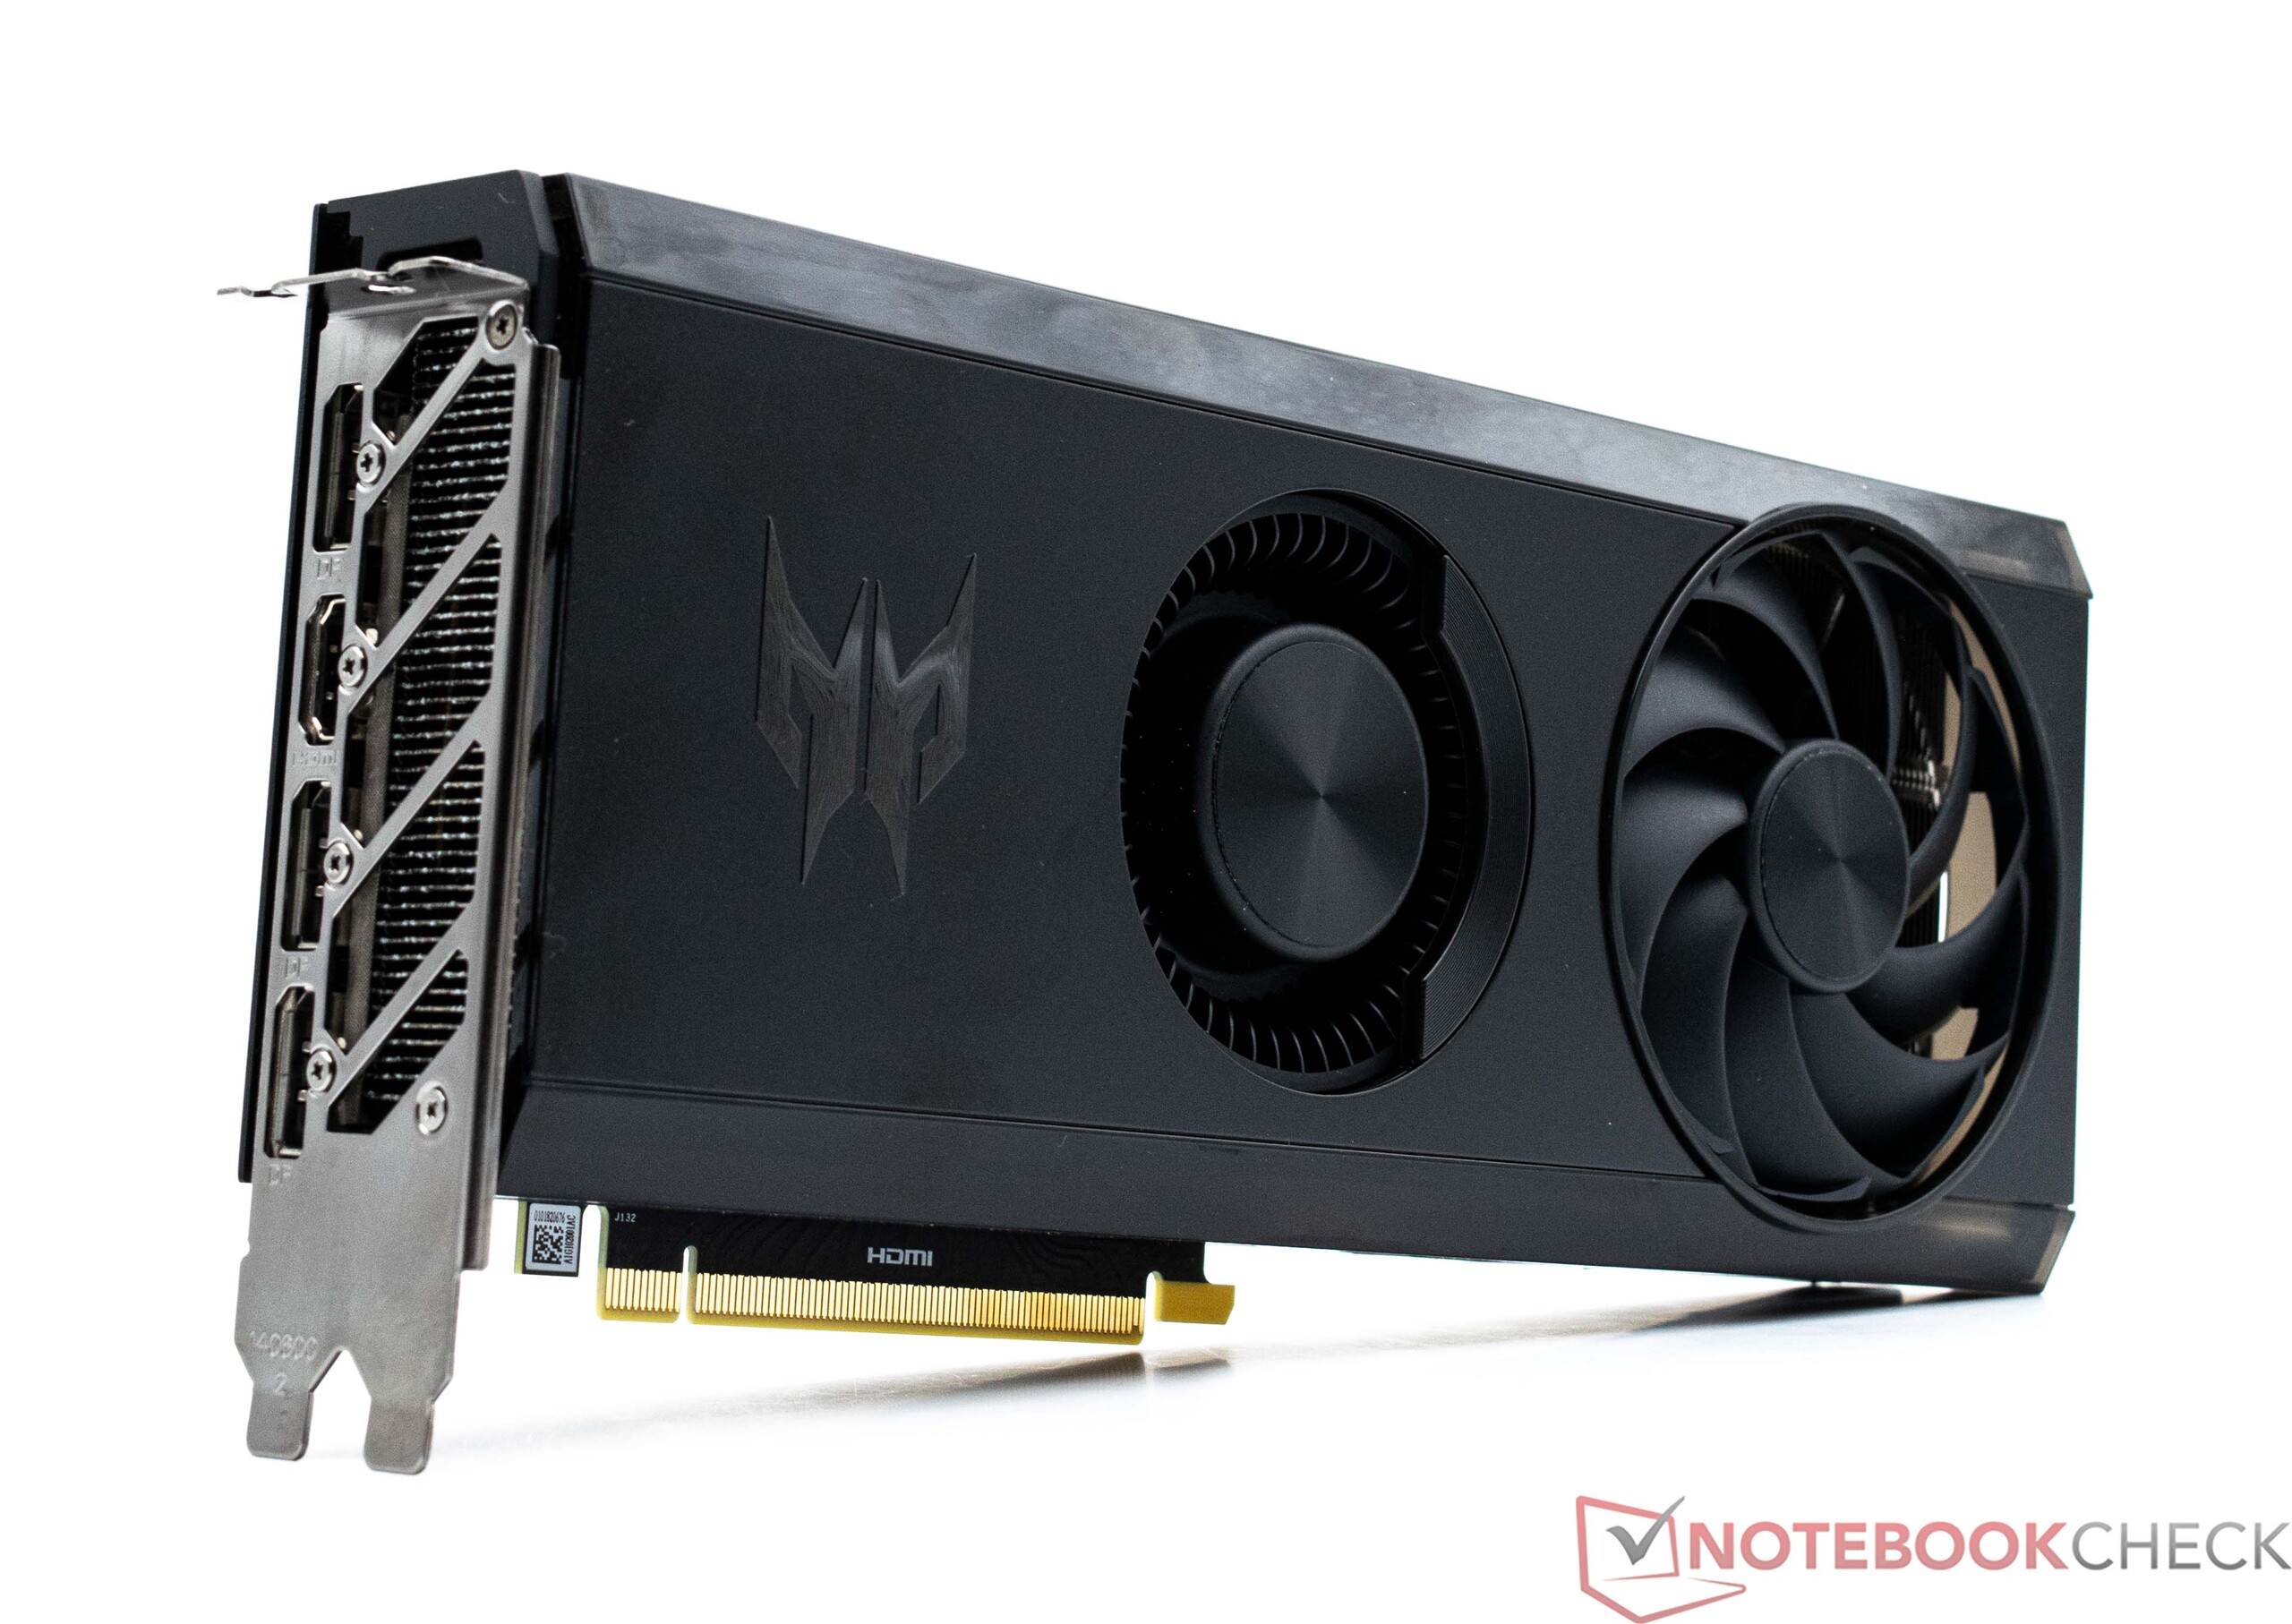
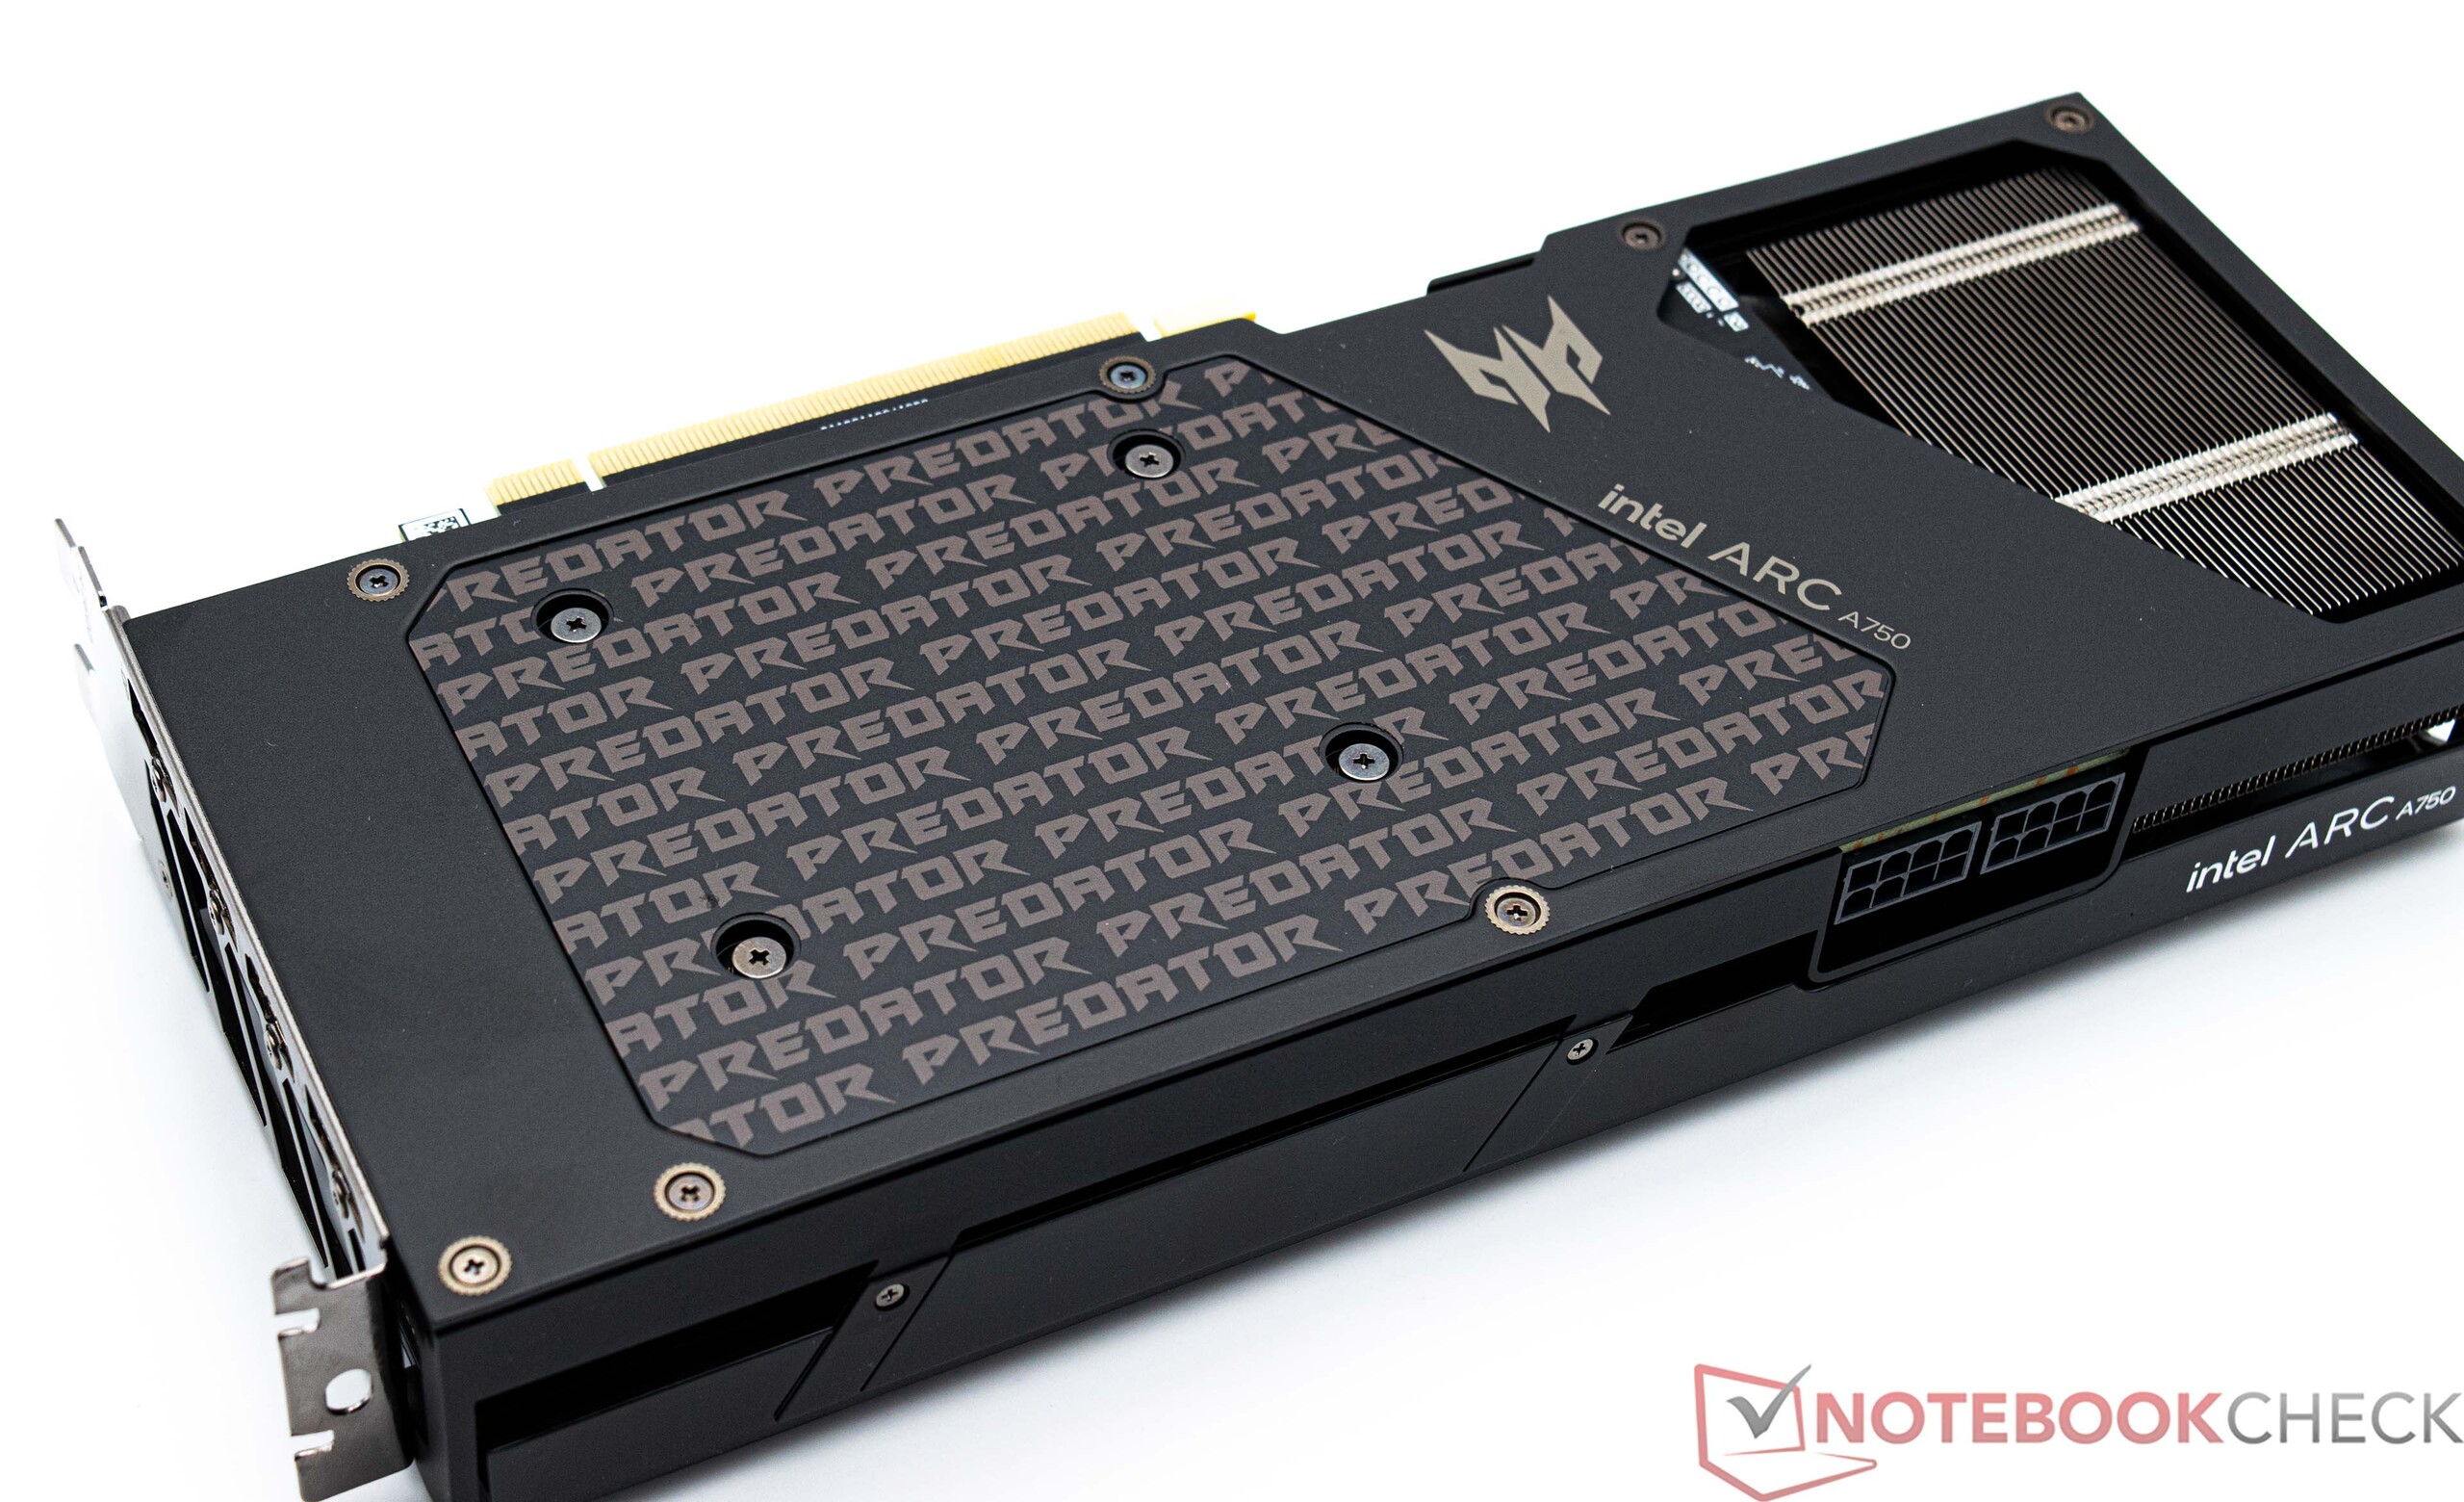
技术数据比较
| 规格 | Intel Arc A770 | Intel Arc A750 | Intel Arc A580 | Intel Arc A380 | Radeon RX 7700 XT | Radeon RX 7600 | RTX 4060 Ti | RTX 4060 |
| GPU | DG2-512 | DG2-512 | DG2-512 | DG2-128 | Navi 32 XL | Navi 33 XL | AD106 | AD107 |
| 制造工艺 | 6 纳米 | 6 纳米 | 6 纳米 | 6 纳米 | 5/6 纳米 | 6 纳米 | TSMC 4N | TSMC 4N |
| 着色单元 | 4.096 | 3,584 | 3,072 | 1,024 | 3,456 | 2,048 | 4,352 | 3,072 |
| 纹理映射单元 | 256 | 224 | 192 | 64 | 216 | 128 | 136 | 96 |
| 光线加速器 | 32 | 28 | 24 | 8 | 54 | 32 | 34 | 24 |
| 基本时钟 | 2,100 MHz | 2,050 MHz | 1,700 MHz | 2,000 MHz | 1,700 MHz | 1,720 MHz | 2,310 MHz | 1,830 MHz |
| 游戏时钟 | - | - | - | - | 2,171 MHz | - | - | 1,815 MHz |
| 提升时钟 | 2,400 MHz | 2,400MHz | 2,000 MHz | 2,050 MHz | 2,544 MHz | 2,535 MHz | 2,460 MHz | 2,105 MHz |
| 高速缓存 | 16 MB | 16MB | 8 MB | 4 MB | 48 MB | 32 MB | 32 MB | 24 MB |
| 内存总线宽度 | 256 位 | 256 位 | 256 位 | 96 位 | 256 位 | 128 位 | 128 位 | 128 位 |
| 内存带宽 | 560 GB/s | 512 GB/s | 512 GB/s | 186 GB/s | 432 GB/s | 288 GB/s | 288 GB/s | 272 GB/s |
| 内存大小 | 16 GB GDDR6 | 8 GB GDDR6 | 8 GB GDDR6 | 6 GB GDDR6 | 12 GB | 8 GB GDDR6 | 8 GB GDDR6 | 8 GB GDDR6 |
| TBP | 225 W | 225W | 175 W | 75 W | 245 W | 165 W | 160 W | 115 W |
宏碁掠夺者 BiFrost Arc A750 OC 的时钟频率
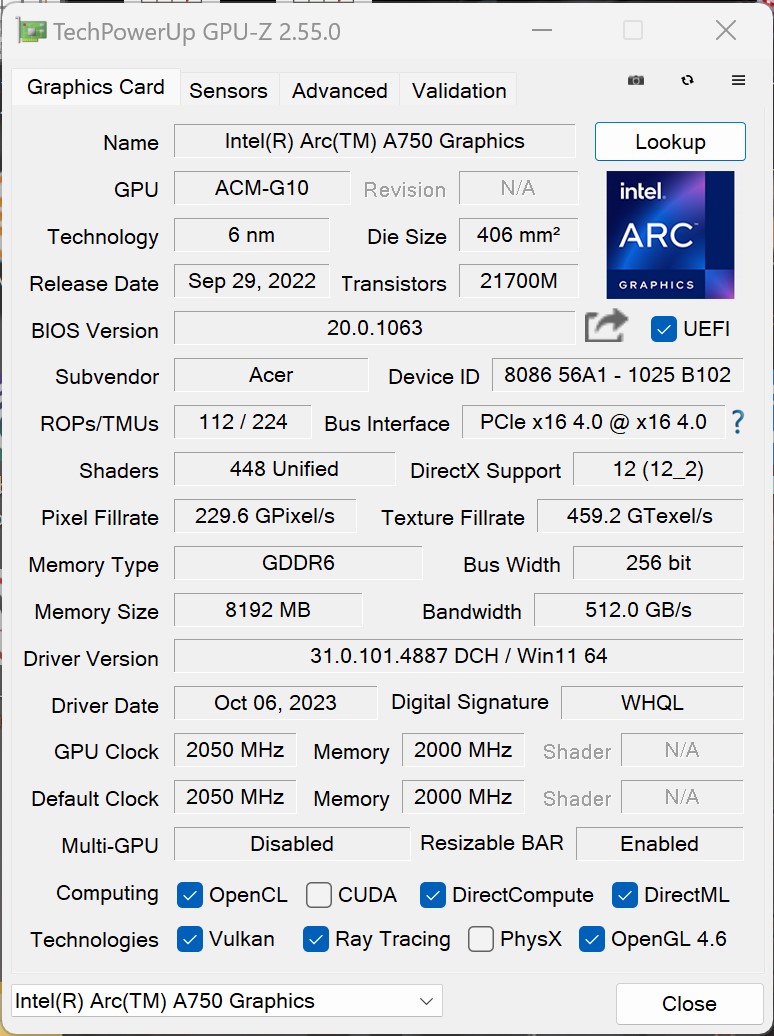
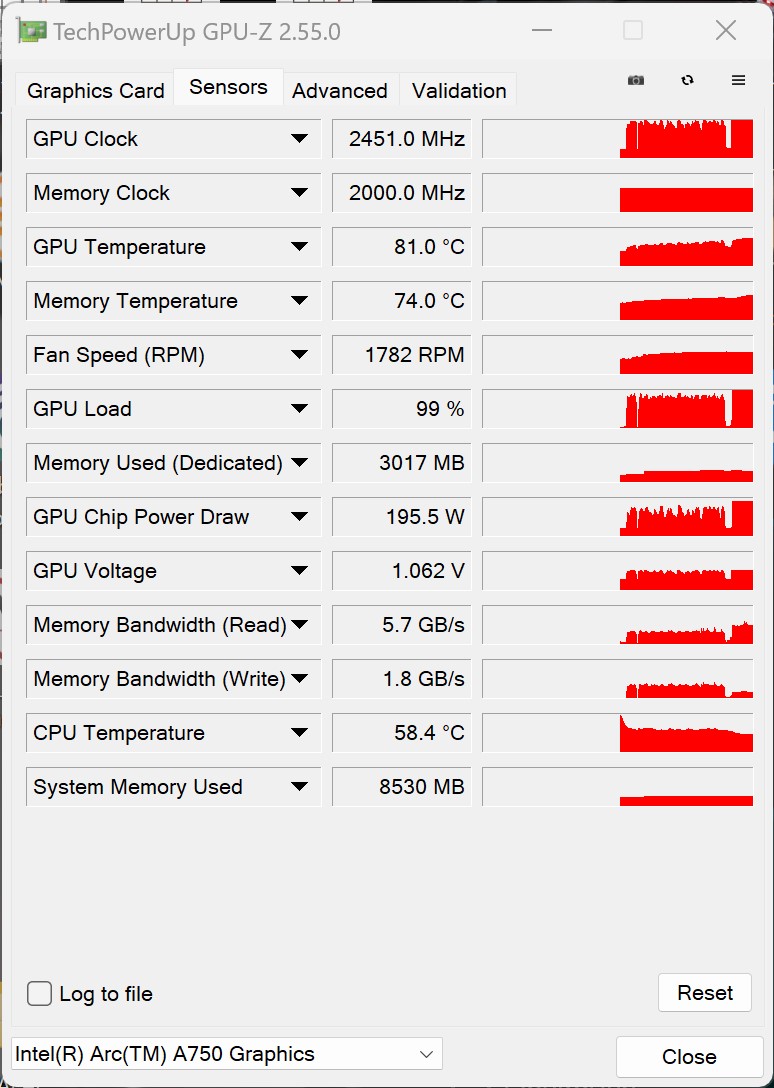
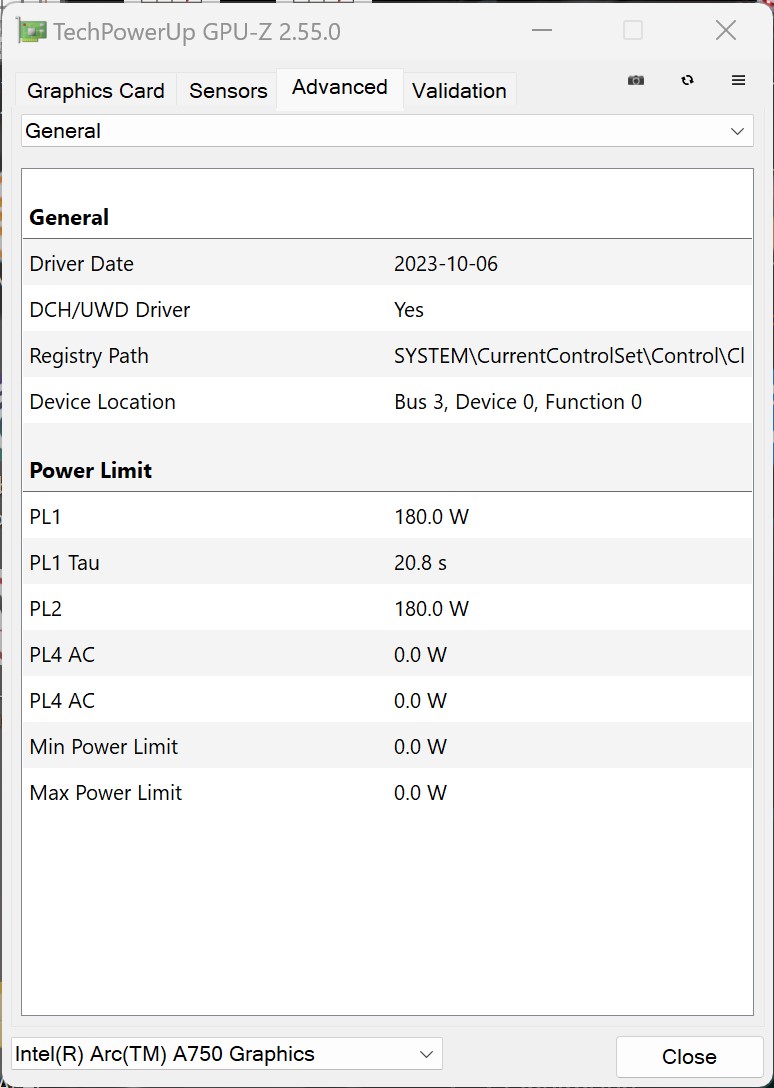
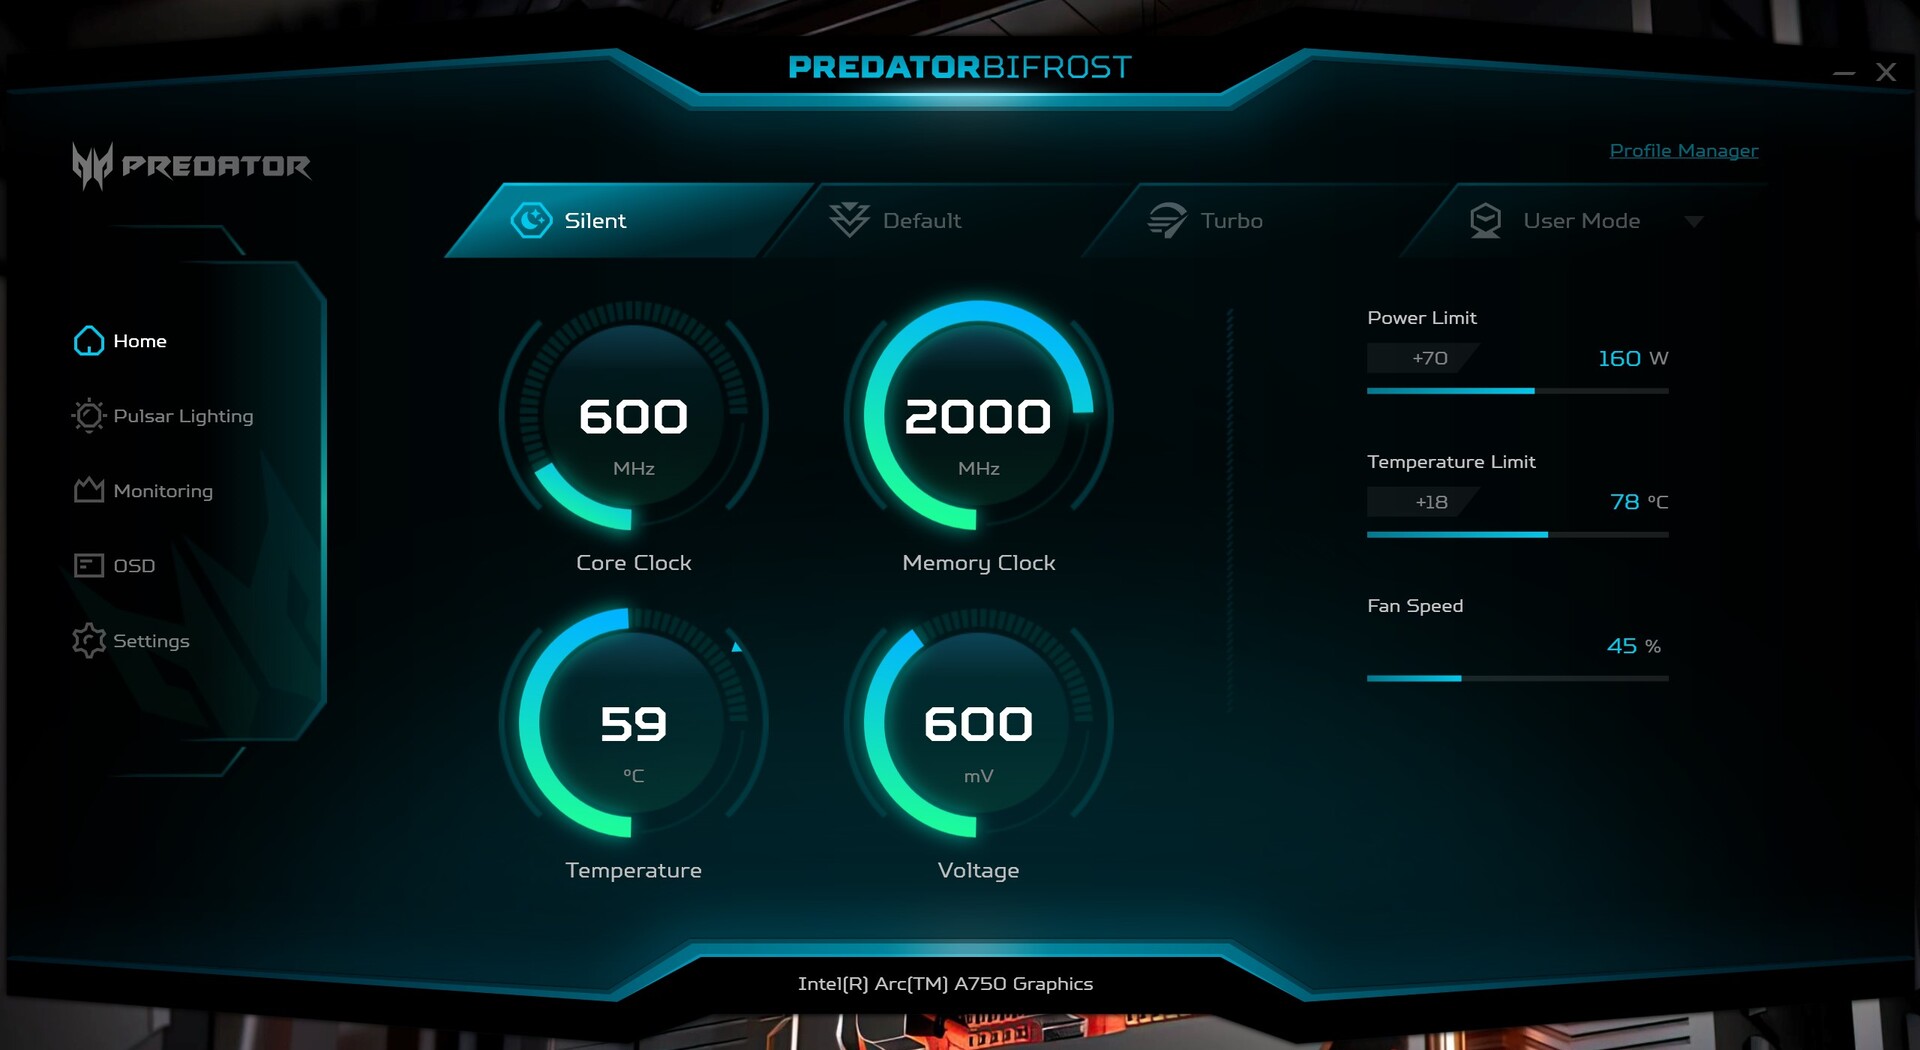
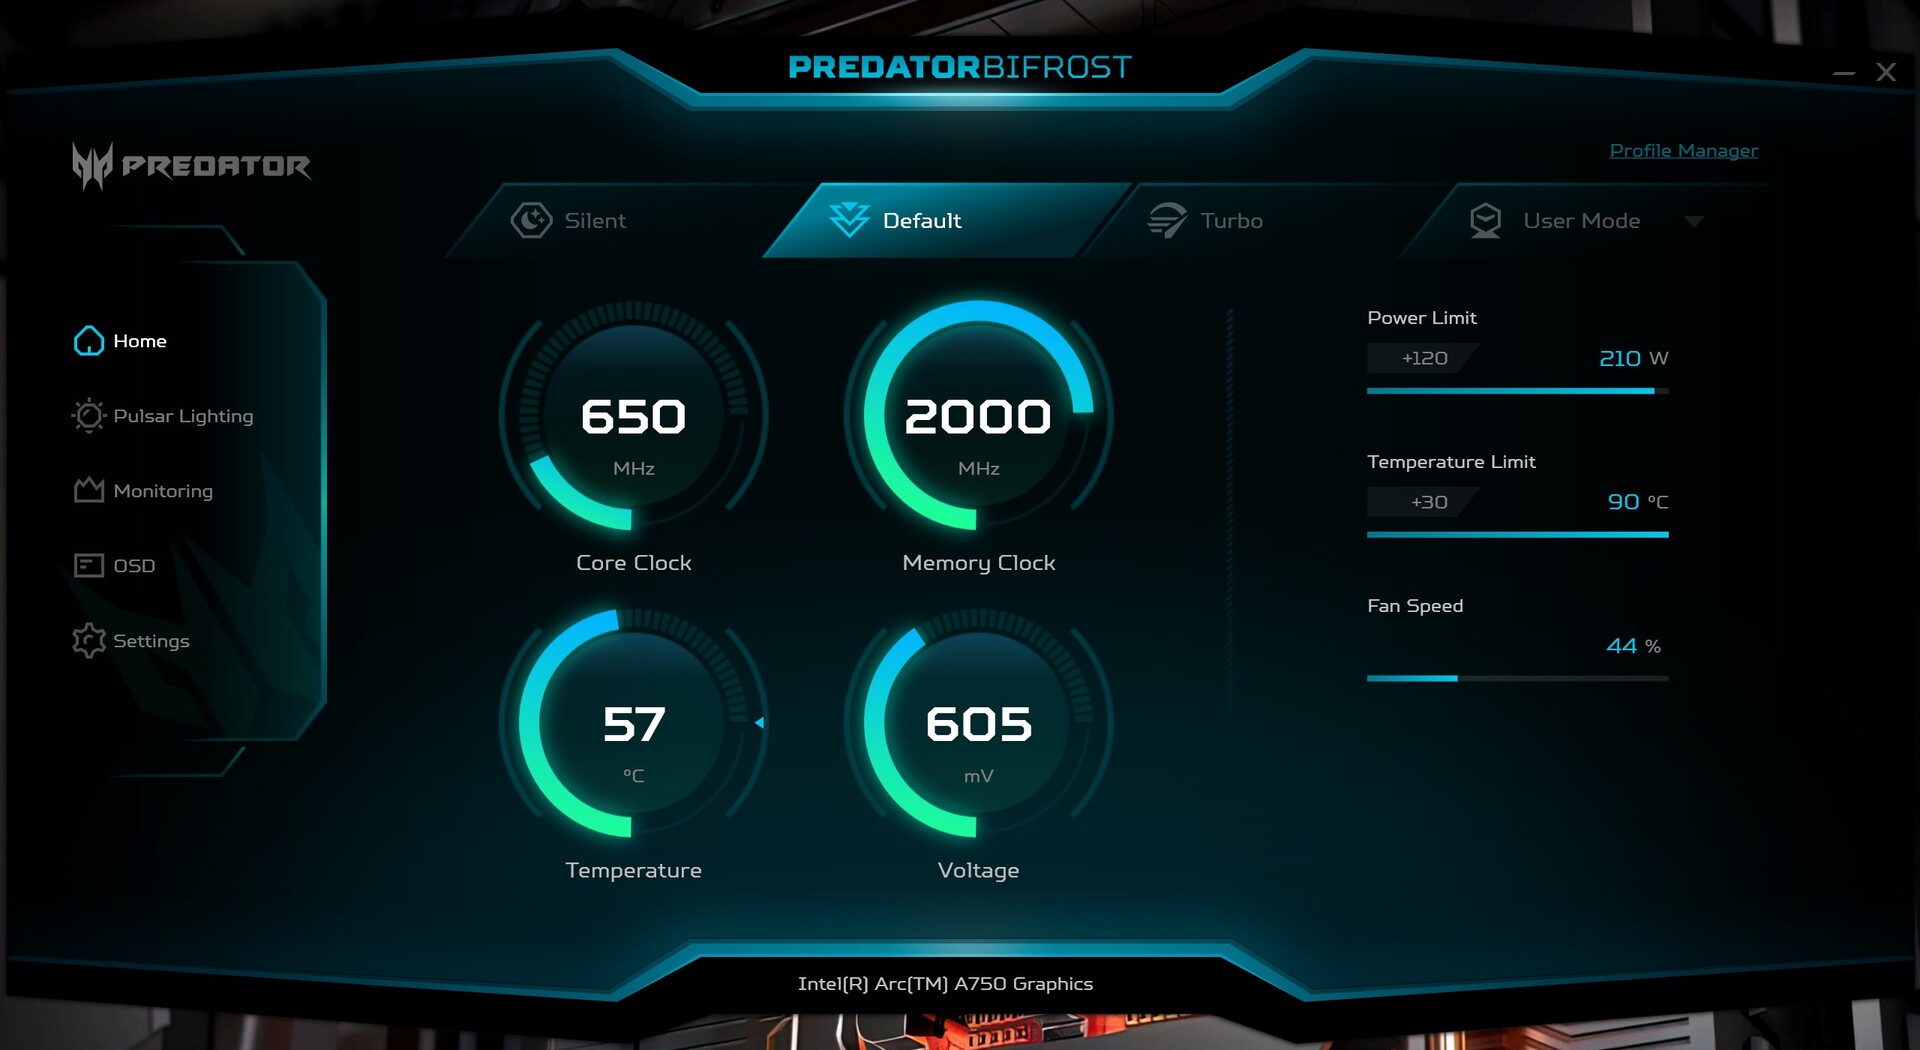
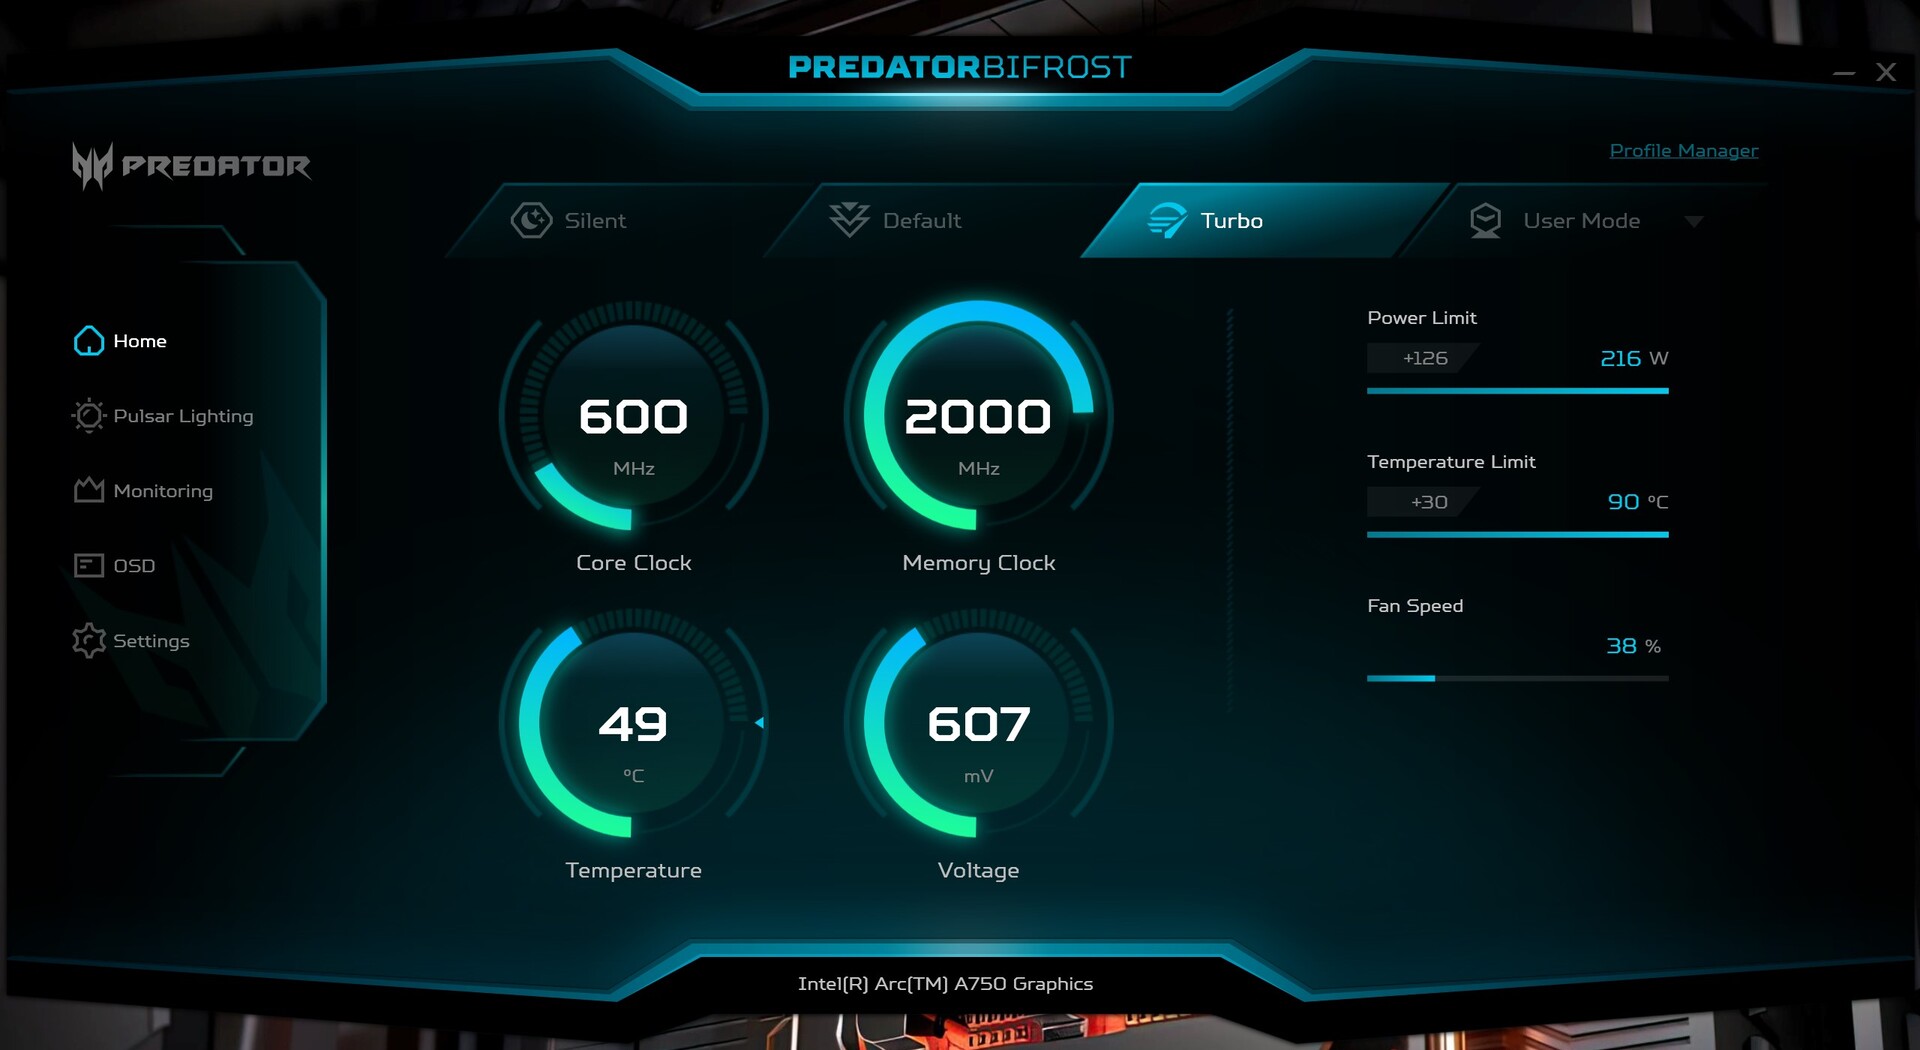
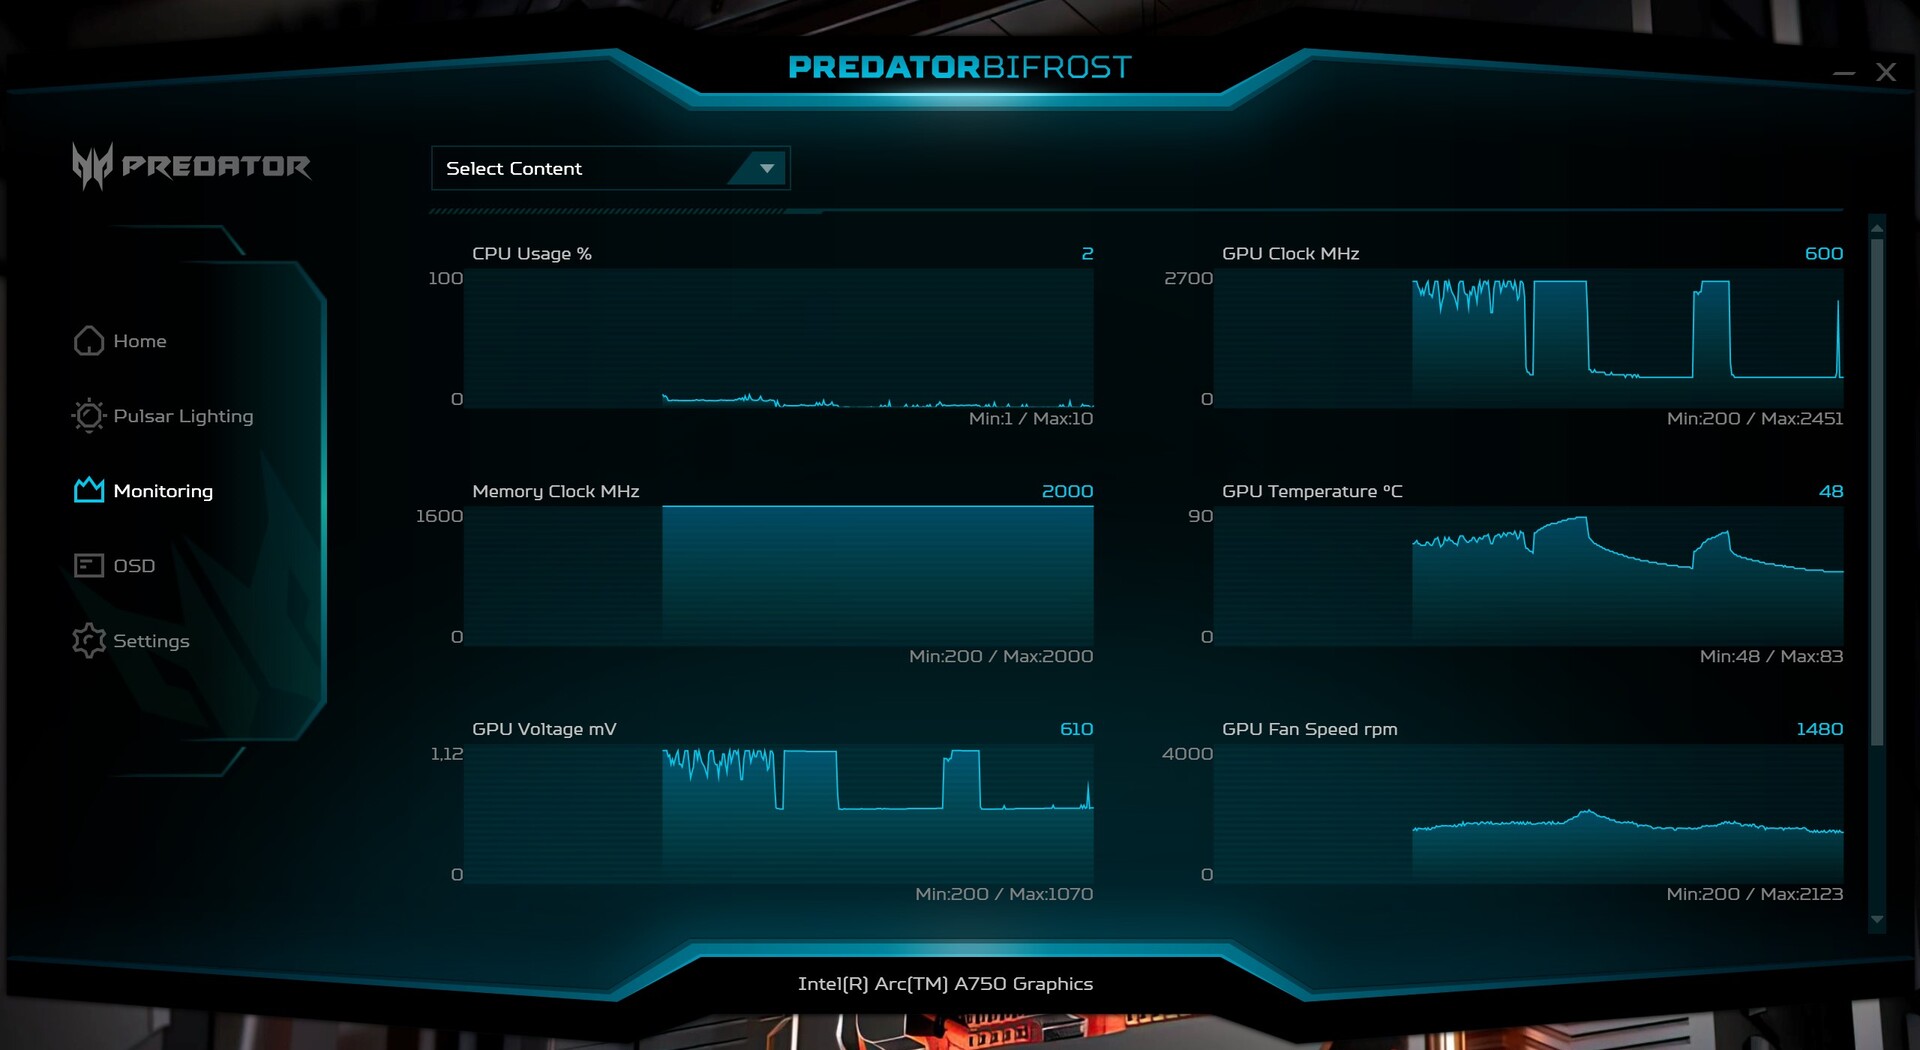
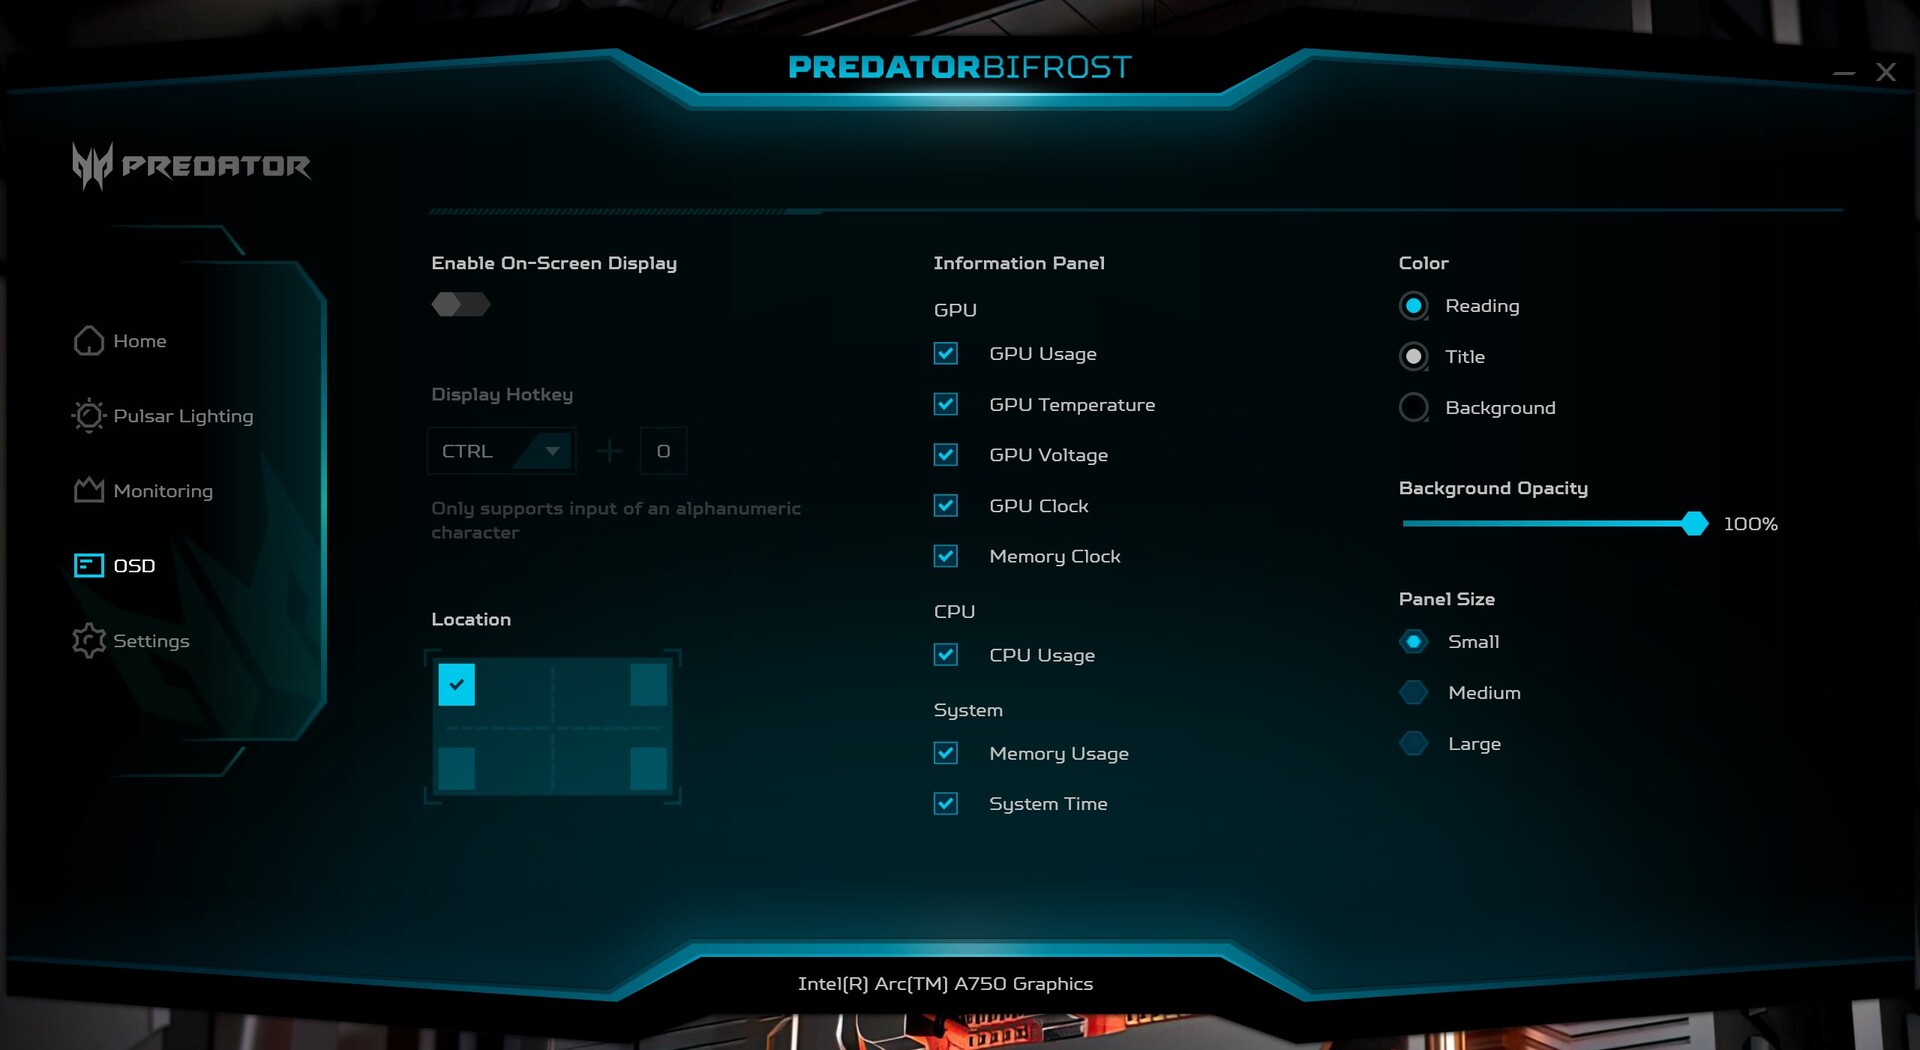
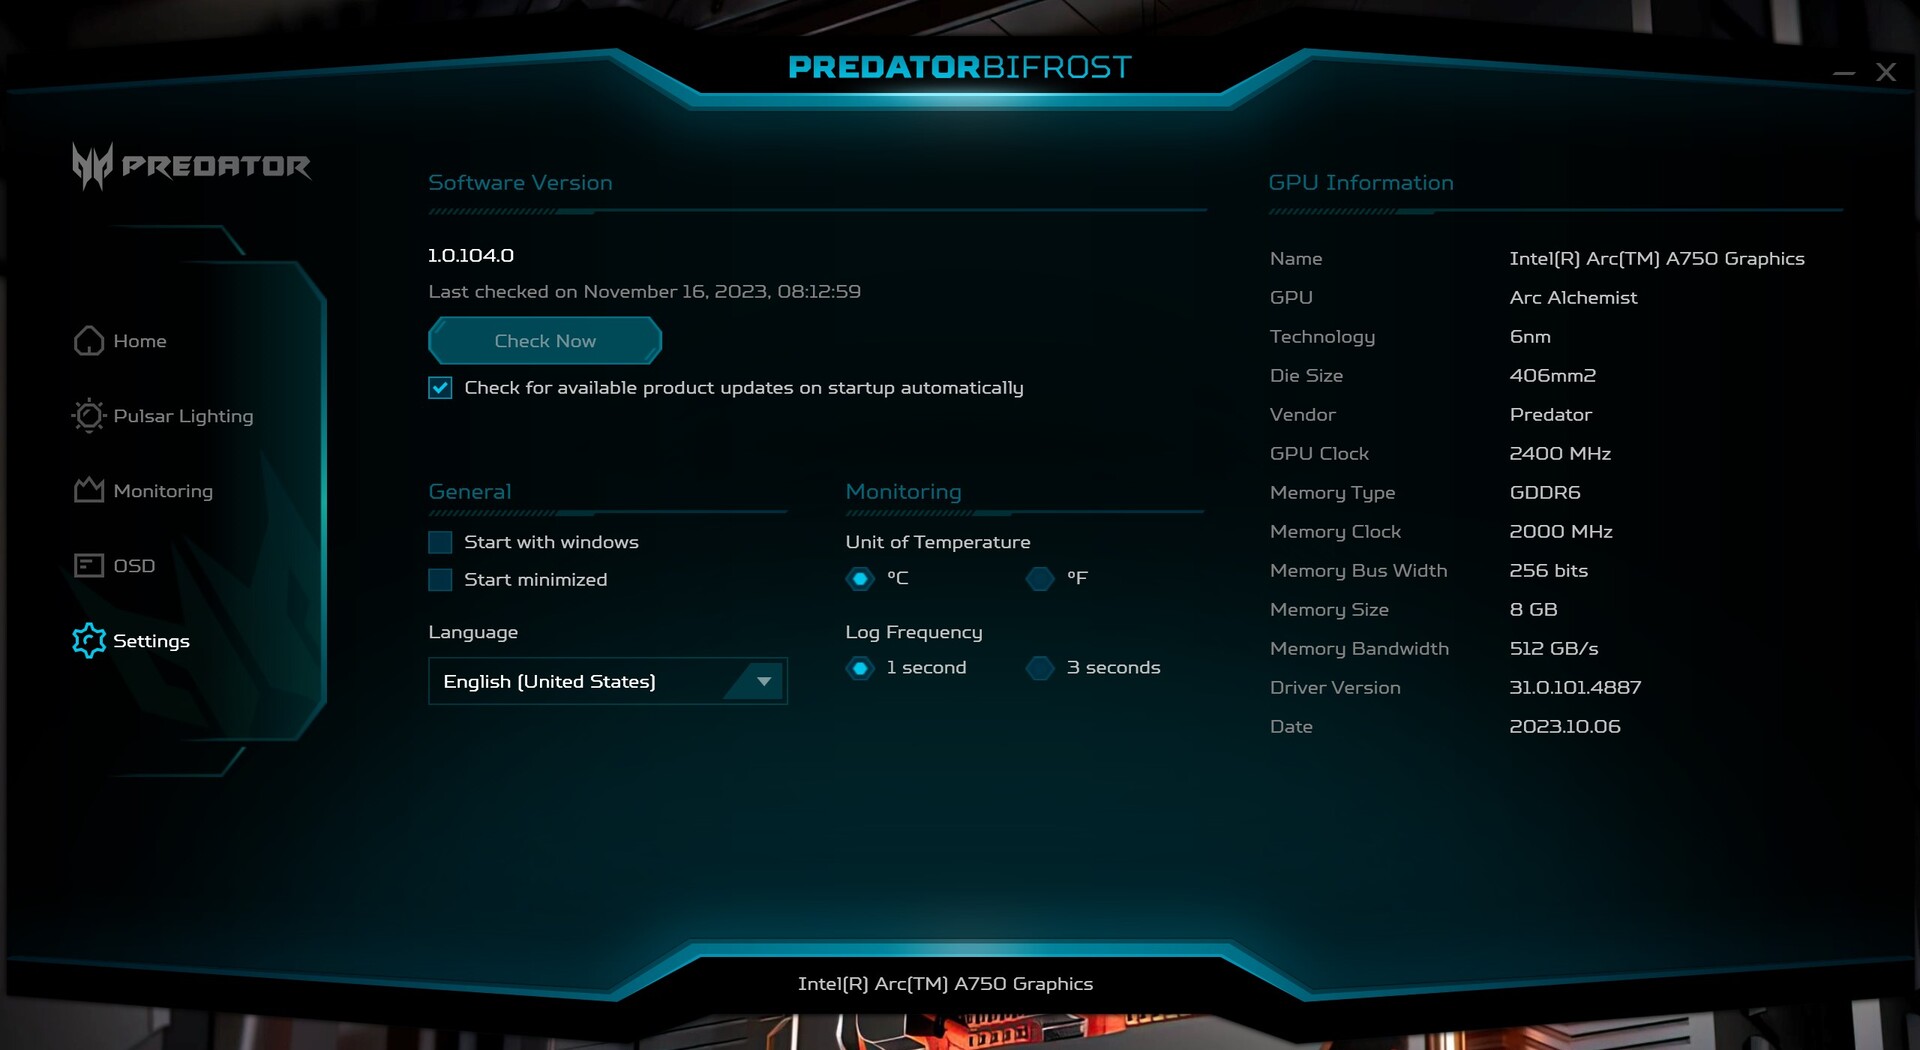
宏碁掠夺者 BiFrost Arc A750 OC 的图形芯片基本时钟频率为 2,050 MHz。在玩游戏时,我们经常注意到频率高达 2,450 MHz。显存时钟频率为 2,000 MHz,显存带宽为 512 GB/s。这比英特尔 Arc A770 略低,但仍比其直接竞争对手如AMD Radeon RX 7700 XT或NvidiaGeForce RTX 4060 Ti.我们的测试样本显示功耗为 210 瓦--这是在正常使用的情况下。另外,你还可以将宏碁掠夺者 BiFrost Arc A750 OC 设置为静音模式(160 瓦)或涡轮增压模式(216 瓦)。不过,我们使用默认模式(210 瓦)进行了所有测试。
合成基准
不出所料,宏碁掠夺者 BiFrost Arc A750 OC 紧随其后。宏碁掠夺者 BiFrost Arc A770 OC.中场被许多型号占据,它们的表现都非常相似。英特尔 Arc A750 的表现不及英伟达GeForce RTX 4060虽然它的平均性能并不落后。与宏碁掠夺者 BiFrost Arc A770 OC 相比,性能要差 10%左右。另一方面,如果你看一下 LuxMark 的基准测试结果,你会发现宏碁掠夺者 BiFrost Arc A750 OC 的表现要好得多,仅略低于AMD Radeon RX 7800 XT.
| Performance rating - Percent | |
| KFA2 GeForce RTX 4070 Ti EX Gamer | |
| AMD Radeon RX 7900 GRE | |
| AMD Radeon RX 7800 XT | |
| KFA2 GeForce RTX 4070 EX Gamer | |
| Sapphire Pulse Radeon RX 7700 XT | |
| Sapphire Pulse Radeon RX 6750 XT | |
| AMD Radeon RX 6700 XT | |
| KFA2 GeForce RTX 4060 Ti EX, 16GB GDDR6 | |
| Acer Predator BiFrost Arc A770 OC, 16GB GDDR6 | |
| XFX Speedster QICK 308 Radeon RX 7600 Black Edition | |
| Sapphire Nitro+ Radeon RX 6650 XT | |
| Nvidia GeForce RTX 2070 Super | |
| KFA2 GeForce RTX 4060 1-Click-OC 2X | |
| Acer Predator BiFrost Arc A750 OC | |
| Nvidia GeForce RTX 2060 Super | |
| Sapphire Pulse Radeon RX 6600 | |
| LuxMark v2.0 64Bit | |
| Room GPUs-only | |
| NVIDIA GeForce RTX 4070 Ti | |
| NVIDIA GeForce RTX 4070 | |
| NVIDIA GeForce RTX 4060 Ti 16G | |
| NVIDIA GeForce RTX 4060 | |
| AMD Radeon RX 7900 GRE | |
| AMD Radeon RX 7800 XT | |
| Intel Arc A750 | |
| Intel Arc A770 | |
| AMD Radeon RX 7700 XT | |
| AMD Radeon RX 6700 XT | |
| AMD Radeon RX 6750 XT | |
| AMD Radeon RX 7600 | |
| AMD Radeon RX 6650 XT | |
| AMD Radeon RX 6600 | |
| Sala GPUs-only | |
| NVIDIA GeForce RTX 4070 Ti | |
| NVIDIA GeForce RTX 4070 | |
| AMD Radeon RX 7900 GRE | |
| NVIDIA GeForce RTX 4060 Ti 16G | |
| Intel Arc A770 | |
| Intel Arc A750 | |
| AMD Radeon RX 7800 XT | |
| NVIDIA GeForce RTX 4060 | |
| AMD Radeon RX 7700 XT | |
| AMD Radeon RX 6700 XT | |
| AMD Radeon RX 6750 XT | |
| AMD Radeon RX 7600 | |
| AMD Radeon RX 6650 XT | |
| AMD Radeon RX 6600 | |
| Affinity Photo 2 - Combined (Single / Multi GPU) | |
| NVIDIA GeForce RTX 4070 | |
| NVIDIA GeForce RTX 4070 Ti | |
| AMD Radeon RX 7800 XT | |
| NVIDIA GeForce RTX 2070 Super (Desktop) | |
| AMD Radeon RX 7900 GRE | |
| NVIDIA GeForce RTX 2060 Super (Desktop) | |
| AMD Radeon RX 7700 XT | |
| AMD Radeon RX 6750 XT | |
| NVIDIA GeForce RTX 3060 Ti | |
| NVIDIA GeForce RTX 4060 | |
| NVIDIA GeForce RTX 4060 Ti 16G | |
| AMD Radeon RX 7600 | |
| Intel Arc A770 | |
| Intel Arc A750 | |
| AMD Radeon RX 6650 XT | |
| AMD Radeon RX 6700 XT | |
| AMD Radeon RX 6600 | |
| 3DMark 06 Standard Score | 57748 points | |
| 3DMark Vantage P Result | 98837 points | |
| 3DMark 11 Performance | 33184 points | |
| 3DMark Ice Storm Standard Score | 242873 points | |
| 3DMark Cloud Gate Standard Score | 66624 points | |
| 3DMark Fire Strike Score | 28476 points | |
| 3DMark Fire Strike Extreme Score | 13726 points | |
| 3DMark Time Spy Score | 12671 points | |
Help | ||
专业用途
AMD 和 Nvidia 都有专为专业用途设计的显卡,但就其性能而言,目前的消费级游戏显卡有时会被证明是一种廉价的替代品。通过直接比较可以看出,宏碁掠夺者 BiFrost Arc A750 OC 紧随速度更快的内部型号之后。不过,与 AMD 和 Nvidia 相比,英特尔在这方面显然更具优势。
| Intel Arc A750 R9 7950X | Intel Arc A770 R9 7950X | NVIDIA GeForce RTX 2060 Super (Desktop) R9 7950X | NVIDIA GeForce RTX 2070 Super (Desktop) R9 7950X | NVIDIA GeForce RTX 3060 Ti R9 7950X | NVIDIA GeForce RTX 4060 R9 7950X | NVIDIA GeForce RTX 4060 Ti 16G R9 7950X | NVIDIA GeForce RTX 4070 R9 7950X | NVIDIA GeForce RTX 4070 Ti R9 7950X | AMD Radeon RX 7600 R9 7950X | AMD Radeon RX 7700 XT R9 7950X | AMD Radeon RX 7800 XT R9 7950X | AMD Radeon RX 7900 GRE R9 7950X | AMD Radeon RX 6600 R9 7950X | AMD Radeon RX 6650 XT R9 7950X | AMD Radeon RX 6700 XT R9 7950X | AMD Radeon RX 6750 XT R9 7950X | Average of class | |
|---|---|---|---|---|---|---|---|---|---|---|---|---|---|---|---|---|---|---|
| SPECviewperf 12 | 5% | 60% | 78% | 99% | 101% | 159% | 241% | 356% | 221% | 316% | 378% | 403% | 249% | 311% | 351% | 298% | 89% | |
| 1900x1060 3ds Max (3dsmax-05) (fps) | 166 | 179 8% | 220 33% | 247 49% | 297 79% | 251 51% | 290 75% | 382 130% | 436 163% | 279 68% | 373 125% | 427 157% | 444 167% | 258 55% | 310 87% | 363 119% | 377 127% | 206 ? 24% |
| 1900x1060 Catia (catia-04) (fps) | 166 | 174 5% | 84.5 -49% | 114 -31% | 114 -31% | 113 -32% | 128 -23% | 161 -3% | 192 16% | 273 64% | 351 111% | 386 133% | 448 170% | 256 54% | 314 89% | 339 104% | 360 117% | 113.6 ? -32% |
| 1900x1060 Creo (creo-01) (fps) | 45.7 | 45.3 -1% | 58.8 29% | 65.7 44% | 65.2 43% | 60.6 33% | 73.4 61% | 89.1 95% | 99.4 118% | 115 152% | 123 169% | 148 224% | 155 239% | 133 191% | 142 211% | 152 233% | 154 237% | 66.6 ? 46% |
| 1900x1060 Energy (energy-01) (fps) | 2.25 | 2.44 8% | 11.6 416% | 12.4 451% | 14.4 540% | 15.9 607% | 22.6 904% | 31.7 1309% | 48 2033% | 25.5 1033% | 33.4 1384% | 38.4 1607% | 40.3 1691% | 31.3 1291% | 37.6 1571% | 40.6 1704% | 30.1 1238% | 16.9 ? 651% |
| 1900x1060 Maya (maya-04) (fps) | 177 | 183 3% | 200 13% | 225 27% | 251 42% | 233 32% | 257 45% | 284 60% | 287 62% | 236 33% | 283 60% | 304 72% | 323 82% | 218 23% | 246 39% | 268 51% | 277 56% | 117.7 ? -34% |
| 1900x1060 Medical (medical-01) (fps) | 42.4 | 46.7 10% | 49.5 17% | 55.9 32% | 65.6 55% | 82.4 94% | 110 159% | 132 211% | 157 270% | 128 202% | 177 317% | 200 372% | 226 433% | 102 141% | 137 223% | 150 254% | 144 240% | 59.2 ? 40% |
| 1900x1060 Showcase (showcase-01) (fps) | 110 | 119 8% | 121 10% | 135 23% | 150 36% | 109 -1% | 132 20% | 190 73% | 244 122% | 127 15% | 179 63% | 235 114% | 222 102% | 125 14% | 151 37% | 176 60% | 186 69% | 103.7 ? -6% |
| 1900x1060 Solidworks (sw-03) (fps) | 72.6 | 73.4 1% | 79.7 10% | 95.1 31% | 93.5 29% | 91.2 26% | 95.1 31% | 109 50% | 118 63% | 221 204% | 288 297% | 322 344% | 319 339% | 232 220% | 242 233% | 275 279% | 290 299% | 89.4 ? 23% |
| SPECviewperf 13 | 6% | 19% | 38% | 48% | 41% | 70% | 115% | 159% | 132% | 213% | 263% | 282% | 85% | 119% | 158% | 183% | 42% | |
| 3ds Max (3dsmax-06) (fps) | 163 | 179 10% | 218 34% | 247 52% | 297 82% | 252 55% | 289 77% | 381 134% | 433 166% | 280 72% | 371 128% | 434 166% | 439 169% | 258 58% | 310 90% | 360 121% | 379 133% | 196.9 ? 21% |
| Catia (catia-05) (fps) | 249 | 260 4% | 119 -52% | 163 -35% | 167 -33% | 163 -35% | 189 -24% | 241 -3% | 290 16% | 410 65% | 529 112% | 588 136% | 661 165% | 387 55% | 482 94% | 528 112% | 565 127% | 211 ? -15% |
| Creo (creo-02) (fps) | 88.6 | 90 2% | 203 129% | 240 171% | 243 174% | 230 160% | 301 240% | 375 323% | 455 414% | 294 232% | 387 337% | 442 399% | 470 430% | 279 215% | 317 258% | 353 298% | 389 339% | 216 ? 144% |
| Energy (energy-02) (fps) | 19.3 | 22.5 17% | 21.9 13% | 23.8 23% | 26.1 35% | 34.6 79% | 45.3 135% | 54.2 181% | 72.8 277% | 82.9 330% | 115 496% | 139 620% | 150 677% | 44 128% | 59.8 210% | 74.3 285% | 80.6 318% | 39.7 ? 106% |
| Maya (maya-05) (fps) | 301 | 319 6% | 291 -3% | 344 14% | 372 24% | 343 14% | 403 34% | 510 69% | 591 96% | 333 11% | 487 62% | 548 82% | 580 93% | 348 16% | 403 34% | 462 53% | 482 60% | 278 ? -8% |
| Medical (medical-02) (fps) | 82.8 | 80.8 -2% | 54.2 -35% | 63.7 -23% | 74.3 -10% | 76.5 -8% | 85.1 3% | 112 35% | 132 59% | 226 173% | 300 262% | 332 301% | 372 349% | 88.8 7% | 105 27% | 148 79% | 202 144% | 88.4 ? 7% |
| Showcase (showcase-02) (fps) | 110 | 119 8% | 122 11% | 135 23% | 150 36% | 108 -2% | 133 21% | 191 74% | 244 122% | 127 15% | 179 63% | 234 113% | 221 101% | 125 14% | 151 37% | 176 60% | 186 69% | 126.2 ? 15% |
| Solidworks (sw-04) (fps) | 76.8 | 77.5 1% | 119 55% | 136 77% | 135 76% | 127 65% | 135 76% | 157 104% | 168 119% | 195 154% | 265 245% | 294 283% | 287 274% | 220 186% | 231 201% | 272 254% | 286 272% | 124.1 ? 62% |
| SPECviewperf 2020 | 2% | -2% | 7% | 29% | 15% | 41% | 82% | 118% | 72% | 139% | 199% | 211% | 20% | 47% | 81% | 103% | 45% | |
| 3840x2160 Medical (medical-03) (fps) | 20 | 22.3 12% | 10.3 -48% | 12 -40% | 11.9 -40% | 13.7 -31% | 16.5 -17% | 22.2 11% | 26.9 35% | 36.1 81% | 56.2 181% | 63.7 219% | 76.1 281% | 20.9 5% | 27.3 37% | 30.1 51% | 39.9 100% | 24 ? 20% |
| 3840x2160 Maya (maya-06) (fps) | 180 | 195 8% | 162 -10% | 185 3% | 235 31% | 196 9% | 237 32% | 305 69% | 372 107% | 178 -1% | 261 45% | 346 92% | 161 -11% | 192 7% | 258 43% | 279 55% | 221 ? 23% | |
| 3840x2160 Energy (energy-03) (fps) | 35 | 25 -29% | 22.9 -35% | 17.8 -49% | 31.2 -11% | 33.2 -5% | 44.9 28% | 57.6 65% | 75.7 116% | 67 91% | 95 171% | 111 217% | 133 280% | 29.5 -16% | 44.2 26% | 52.2 49% | 56.3 61% | 50 ? 43% |
| 3840x2160 Creo (creo-03) (fps) | 51.9 | 52.9 2% | 77.2 49% | 85.8 65% | 91.2 76% | 85.9 66% | 95.9 85% | 112 116% | 121 133% | 106 104% | 130 150% | 151 191% | 159 206% | 93.4 80% | 105 102% | 123 137% | 130 150% | 78.3 ? 51% |
| 3840x2160 CATIA (catia-06) (fps) | 38.9 | 38.9 0% | 30.5 -22% | 36.7 -6% | 40.5 4% | 34 -13% | 38.5 -1% | 51.6 33% | 61.2 57% | 68 75% | 88.8 128% | 101 160% | 107 175% | 60.8 56% | 70.1 80% | 77.2 98% | 83.8 115% | 48.9 ? 26% |
| 3840x2160 3ds Max (3dsmax-07) (fps) | 40.7 | 47.4 16% | 63.1 55% | 69.7 71% | 87 114% | 67.4 66% | 88.8 118% | 122 200% | 147 261% | 72.9 79% | 106 160% | 125 207% | 134 229% | 42.4 4% | 51.5 27% | 85.4 110% | 96.8 138% | 85 ? 109% |
| Total Average (Program / Settings) | 4% /
4% | 26% /
28% | 41% /
44% | 59% /
61% | 52% /
56% | 90% /
95% | 146% /
152% | 211% /
219% | 142% /
148% | 223% /
230% | 280% /
291% | 299% /
307% | 118% /
127% | 159% /
169% | 197% /
207% | 195% /
203% | 59% /
60% |
游戏性能
在性能方面,我们的测试样品也落后于宏碁掠夺者 BiFrost Arc A770 OC在我们的游戏测试中排名靠后。与速度更快的机型相比,差距往往小于 10%。与 AMD 相比,宏碁掠夺者 BiFrost Arc A750 OC 仍能成功运行许多游戏,而且性能更好。不过,我们的测试机型无法持续保持如此高的性能水平。另一方面,这种现象在我们评测宏碁掠夺者 BiFrost Arc A770 OC 时也很明显。这种情况今后可能会随着驱动程序的调整而改变。自英特尔 Arc 显卡发布以来,英特尔已经大幅提升了许多游戏的性能。
如果你购买宏碁掠夺者 BiFrost Arc A750 OC 主要是为了玩游戏,那么你可以期待它在 1080p 下一直保持良好的性能。我们的测试样本在Starfield 方面遇到了一些较大的问题。虽然英特尔 Arc A750 仅有 8GB VRAM,但显卡仍能在 1440p 下驾驭一些游戏。
在 P 值方面,我们的测试样本成功超越了AMD Radeon RX 7600的性能。在这方面,英特尔显卡似乎能更好地处理内存管理。不过,在进行平均比较时,它的表现只能排在最后一位。英特尔 Arc A770 的 16 GB 机型要好 20%左右。这说明了英特尔 Arc A750 VRAM 较低的问题。英特尔没有提供 16GB 型号的显卡。
| F1 2021 | |
| 2560x1440 Ultra High Preset + Raytracing AA:T AF:16x | |
| Palit GeForce RTX 4090 GameRock OC (874931) | |
| KFA2 GeForce RTX 4080 SG (874931) | |
| AMD Radeon RX 7900 XTX (874931) | |
| KFA2 GeForce RTX 4070 Ti EX Gamer (874931) | |
| AMD Radeon RX 7900 XT (874931) | |
| MSI Radeon RX 6950 XT Gaming X Trio (874931) | |
| NVIDIA GeForce RTX 3090 Founders Edition (874931) | |
| KFA2 GeForce RTX 4070 EX Gamer (874931) | |
| AMD Radeon RX 7900 GRE (874931) | |
| AMD Radeon RX 7800 XT (874931) | |
| KFA2 GeForce RTX 3070 Ti SG (874931) | |
| AMD Radeon RX 5700 XT (874931) | |
| AMD Radeon RX 6800 (874931) | |
| Nvidia Titan RTX (874931) | |
| ASUS Dual GeForce RTX 4060 Ti OC (874931) | |
| KFA2 GeForce RTX 4060 Ti EX, 16GB GDDR6 (874931) | |
| AMD Radeon RX 5700 (874931) | |
| Sapphire Pulse Radeon RX 6750 XT (874931) | |
| Nvidia GeForce RTX 3060 Ti FE (874931) | |
| Acer Predator BiFrost Arc A770 OC, 16GB GDDR6 (874931) | |
| XFX Speedster QICK 308 Radeon RX 7600 Black Edition (874931) | |
| Nvidia GeForce RTX 2070 Super (874931) | |
| Acer Predator BiFrost Arc A750 OC (874931) | |
| KFA2 GeForce GTX 1660 Super (874931) | |
| Sapphire Nitro+ Radeon RX 6650 XT (874931) | |
| PNY GeForce GTX 1660 (874931) | |
| Nvidia GeForce RTX 2060 Super (874931) | |
| Sapphire Pulse Radeon RX 6600 (874931) | |
| 1920x1080 Ultra High Preset + Raytracing AA:T AF:16x | |
| Palit GeForce RTX 4090 GameRock OC (874931) | |
| AMD Radeon RX 7900 XTX (874931) | |
| KFA2 GeForce RTX 4080 SG (874931) | |
| KFA2 GeForce RTX 4070 Ti EX Gamer (874931) | |
| AMD Radeon RX 7900 XT (874931) | |
| MSI Radeon RX 6950 XT Gaming X Trio (874931) | |
| NVIDIA GeForce RTX 3090 Founders Edition (874931) | |
| KFA2 GeForce RTX 4070 EX Gamer (874931) | |
| AMD Radeon RX 7900 GRE (874931) | |
| AMD Radeon RX 7800 XT (874931) | |
| KFA2 GeForce RTX 3070 Ti SG (874931) | |
| AMD Radeon RX 5700 XT (874931) | |
| KFA2 GeForce RTX 4060 Ti EX, 16GB GDDR6 (874931) | |
| ASUS Dual GeForce RTX 4060 Ti OC (874931) | |
| AMD Radeon RX 6800 (874931) | |
| Nvidia Titan RTX (874931) | |
| AMD Radeon RX 5700 (874931) | |
| Sapphire Pulse Radeon RX 6750 XT (874931) | |
| Nvidia GeForce RTX 3060 Ti FE (874931) | |
| XFX Speedster QICK 308 Radeon RX 7600 Black Edition (874931) | |
| Acer Predator BiFrost Arc A770 OC, 16GB GDDR6 (874931) | |
| Nvidia GeForce RTX 2070 Super (874931) | |
| Sapphire Nitro+ Radeon RX 6650 XT (874931) | |
| Acer Predator BiFrost Arc A750 OC (874931) | |
| KFA2 GeForce GTX 1660 Super (874931) | |
| Nvidia GeForce RTX 2060 Super (874931) | |
| PNY GeForce GTX 1660 (874931) | |
| Sapphire Pulse Radeon RX 6600 (874931) | |
| F1 22 | |
| 2560x1440 Ultra High Preset AA:T AF:16x | |
| Palit GeForce RTX 4090 GameRock OC (923662) | |
| KFA2 GeForce RTX 4080 SG (939134) | |
| AMD Radeon RX 7900 XTX (939134) | |
| KFA2 GeForce RTX 4070 Ti EX Gamer (959964) | |
| AMD Radeon RX 5700 XT (959964) | |
| AMD Radeon RX 7900 XT (939134) | |
| NVIDIA GeForce RTX 3090 Founders Edition (923650) | |
| AMD Radeon RX 5700 (959964) | |
| AMD Radeon RX 7900 GRE (959964) | |
| MSI Radeon RX 6950 XT Gaming X Trio (939134) | |
| KFA2 GeForce RTX 4070 EX Gamer (959964) | |
| KFA2 GeForce GTX 1660 Super (928484) | |
| AMD Radeon RX 7800 XT (959964) | |
| PNY GeForce GTX 1660 (928484) | |
| KFA2 GeForce RTX 3070 Ti SG (939134) | |
| Nvidia Titan RTX (923650) | |
| KFA2 GeForce RTX 4060 Ti EX, 16GB GDDR6 (959964) | |
| ASUS Dual GeForce RTX 4060 Ti OC (959964) | |
| AMD Radeon RX 6800 (928484) | |
| Nvidia GeForce RTX 3060 Ti FE (923650) | |
| Acer Predator BiFrost Arc A770 OC, 16GB GDDR6 (959964) | |
| Sapphire Pulse Radeon RX 6750 XT (959964) | |
| KFA2 GeForce RTX 4060 1-Click-OC 2X (959964) | |
| Acer Predator BiFrost Arc A750 OC (959964) | |
| Nvidia GeForce RTX 2070 Super (923662) | |
| XFX Speedster QICK 308 Radeon RX 7600 Black Edition (959964) | |
| Nvidia GeForce RTX 2060 Super (923662) | |
| Sapphire Nitro+ Radeon RX 6650 XT (946728) | |
| Sapphire Pulse Radeon RX 6600 (946728) | |
| 1920x1080 Ultra High Preset AA:T AF:16x | |
| Palit GeForce RTX 4090 GameRock OC | |
| KFA2 GeForce RTX 4080 SG (939134) | |
| AMD Radeon RX 7900 XTX (939134) | |
| KFA2 GeForce RTX 4070 Ti EX Gamer (959964) | |
| NVIDIA GeForce RTX 3090 Founders Edition (923650) | |
| AMD Radeon RX 7900 XT (939134) | |
| AMD Radeon RX 5700 XT (959964) | |
| MSI Radeon RX 6950 XT Gaming X Trio (939134) | |
| KFA2 GeForce RTX 4070 EX Gamer (959964) | |
| AMD Radeon RX 7900 GRE (959964) | |
| AMD Radeon RX 7800 XT (959964) | |
| AMD Radeon RX 5700 (959964) | |
| KFA2 GeForce GTX 1660 Super (928484) | |
| KFA2 GeForce RTX 3070 Ti SG (939134) | |
| PNY GeForce GTX 1660 (928484) | |
| Nvidia Titan RTX (923650) | |
| KFA2 GeForce RTX 4060 Ti EX, 16GB GDDR6 (959964) | |
| ASUS Dual GeForce RTX 4060 Ti OC (959964) | |
| Nvidia GeForce RTX 3060 Ti FE (923650) | |
| AMD Radeon RX 6800 | |
| Acer Predator BiFrost Arc A770 OC, 16GB GDDR6 (959964) | |
| Sapphire Pulse Radeon RX 6750 XT (959964) | |
| KFA2 GeForce RTX 4060 1-Click-OC 2X (959964) | |
| Acer Predator BiFrost Arc A750 OC (959964) | |
| XFX Speedster QICK 308 Radeon RX 7600 Black Edition (959964) | |
| Nvidia GeForce RTX 2070 Super (923662) | |
| Nvidia GeForce RTX 2060 Super (923662) | |
| Sapphire Nitro+ Radeon RX 6650 XT (946728) | |
| Sapphire Pulse Radeon RX 6600 (946728) | |
| GRID Legends | |
| 2560x1440 Ultra Preset | |
| AMD Radeon RX 7900 XTX (643827) | |
| Palit GeForce RTX 4090 GameRock OC (591708) | |
| AMD Radeon RX 7900 XT (643827) | |
| MSI Radeon RX 6950 XT Gaming X Trio (643827) | |
| KFA2 GeForce RTX 4080 SG (643827) | |
| KFA2 GeForce RTX 4070 Ti EX Gamer (712825) | |
| NVIDIA GeForce RTX 3090 Founders Edition (591708) | |
| AMD Radeon RX 7900 GRE (800660) | |
| AMD Radeon RX 6800 (643827) | |
| KFA2 GeForce RTX 3070 Ti SG (643827) | |
| AMD Radeon RX 7800 XT (800660) | |
| KFA2 GeForce RTX 4070 EX Gamer (712825) | |
| Sapphire Pulse Radeon RX 6750 XT (712825) | |
| Nvidia Titan RTX (591708) | |
| ASUS Dual GeForce RTX 4060 Ti OC (800660) | |
| KFA2 GeForce RTX 4060 Ti EX, 16GB GDDR6 (800660) | |
| Nvidia GeForce RTX 3060 Ti FE (591708) | |
| XFX Speedster QICK 308 Radeon RX 7600 Black Edition (800660) | |
| Sapphire Nitro+ Radeon RX 6650 XT (643827) | |
| KFA2 GeForce RTX 4060 1-Click-OC 2X (800660) | |
| Nvidia GeForce RTX 2070 Super (591708) | |
| AMD Radeon RX 5700 XT (712825) | |
| Nvidia GeForce RTX 2060 Super (623651) | |
| Sapphire Pulse Radeon RX 6600 (683088) | |
| AMD Radeon RX 5700 (712825) | |
| Acer Predator BiFrost Arc A770 OC, 16GB GDDR6 (800660) | |
| Acer Predator BiFrost Arc A750 OC (800660) | |
| KFA2 GeForce GTX 1660 Super (623651) | |
| PNY GeForce GTX 1660 (623651) | |
| 1920x1080 Ultra Preset | |
| AMD Radeon RX 7900 XTX (643827) | |
| MSI Radeon RX 6950 XT Gaming X Trio (643827) | |
| AMD Radeon RX 7900 XT (643827) | |
| Palit GeForce RTX 4090 GameRock OC (591708) | |
| KFA2 GeForce RTX 4080 SG (643827) | |
| AMD Radeon RX 6800 (643827) | |
| KFA2 GeForce RTX 4070 Ti EX Gamer (712825) | |
| NVIDIA GeForce RTX 3090 Founders Edition (591708) | |
| KFA2 GeForce RTX 4070 EX Gamer (712825) | |
| AMD Radeon RX 7900 GRE (800660) | |
| Sapphire Pulse Radeon RX 6750 XT (712825) | |
| AMD Radeon RX 7800 XT (800660) | |
| KFA2 GeForce RTX 3070 Ti SG (643827) | |
| Nvidia Titan RTX (591708) | |
| Nvidia GeForce RTX 3060 Ti FE (591708) | |
| Sapphire Nitro+ Radeon RX 6650 XT (643827) | |
| ASUS Dual GeForce RTX 4060 Ti OC (800660) | |
| KFA2 GeForce RTX 4060 Ti EX, 16GB GDDR6 (800660) | |
| XFX Speedster QICK 308 Radeon RX 7600 Black Edition (800660) | |
| KFA2 GeForce RTX 4060 1-Click-OC 2X (800660) | |
| Nvidia GeForce RTX 2070 Super (591708) | |
| Sapphire Pulse Radeon RX 6600 (683088) | |
| AMD Radeon RX 5700 XT (712825) | |
| Nvidia GeForce RTX 2060 Super (623651) | |
| AMD Radeon RX 5700 (712825) | |
| KFA2 GeForce GTX 1660 Super (623651) | |
| Acer Predator BiFrost Arc A770 OC, 16GB GDDR6 (800660) | |
| Acer Predator BiFrost Arc A750 OC (800660) | |
| PNY GeForce GTX 1660 (623651) | |
| Final Fantasy XV Benchmark | |
| 1920x1080 High Quality | |
| Palit GeForce RTX 4090 GameRock OC (1.3) | |
| KFA2 GeForce RTX 4080 SG (1.3) | |
| AMD Radeon RX 7900 XTX (1.3) | |
| KFA2 GeForce RTX 4070 Ti EX Gamer (1.3) | |
| AMD Radeon RX 7900 XT (1.3) | |
| MSI Radeon RX 6950 XT Gaming X Trio (1.3) | |
| NVIDIA GeForce RTX 3090 Founders Edition (1.3) | |
| KFA2 GeForce RTX 4070 EX Gamer (1.3) | |
| AMD Radeon RX 7900 GRE (1.3) | |
| AMD Radeon RX 7800 XT (1.3) | |
| AMD Radeon RX 6800 (1.3) | |
| Nvidia Titan RTX (1.3) | |
| KFA2 GeForce RTX 3070 Ti SG (1.3) | |
| ASUS Dual GeForce RTX 4060 Ti OC (1.3) | |
| Sapphire Pulse Radeon RX 6750 XT (1.3) | |
| Nvidia GeForce RTX 3060 Ti FE (1.3) | |
| KFA2 GeForce RTX 4060 Ti EX, 16GB GDDR6 (1.3) | |
| KFA2 GeForce RTX 4060 1-Click-OC 2X (1.3) | |
| Nvidia GeForce RTX 2070 Super (1.3) | |
| XFX Speedster QICK 308 Radeon RX 7600 Black Edition (1.3) | |
| Sapphire Nitro+ Radeon RX 6650 XT (1.3) | |
| Nvidia GeForce RTX 2060 Super (1.3) | |
| AMD Radeon RX 5700 XT (1.3) | |
| Sapphire Pulse Radeon RX 6600 (1.3) | |
| AMD Radeon RX 5700 (1.3) | |
| KFA2 GeForce GTX 1660 Super (1.3) | |
| PNY GeForce GTX 1660 (1.3) | |
| Acer Predator BiFrost Arc A770 OC, 16GB GDDR6 (1.3) | |
| Acer Predator BiFrost Arc A750 OC (1.3) | |
| 2560x1440 High Quality | |
| Palit GeForce RTX 4090 GameRock OC (1.3) | |
| KFA2 GeForce RTX 4080 SG (1.3) | |
| AMD Radeon RX 7900 XTX (1.3) | |
| KFA2 GeForce RTX 4070 Ti EX Gamer (1.3) | |
| MSI Radeon RX 6950 XT Gaming X Trio (1.3) | |
| AMD Radeon RX 7900 XT (1.3) | |
| NVIDIA GeForce RTX 3090 Founders Edition (1.3) | |
| KFA2 GeForce RTX 4070 EX Gamer (1.3) | |
| AMD Radeon RX 7900 GRE (1.3) | |
| AMD Radeon RX 7800 XT (1.3) | |
| AMD Radeon RX 6800 (1.3) | |
| KFA2 GeForce RTX 3070 Ti SG (1.3) | |
| Nvidia Titan RTX (1.3) | |
| ASUS Dual GeForce RTX 4060 Ti OC (1.3) | |
| Sapphire Pulse Radeon RX 6750 XT (1.3) | |
| Nvidia GeForce RTX 3060 Ti FE (1.3) | |
| KFA2 GeForce RTX 4060 Ti EX, 16GB GDDR6 (1.3) | |
| KFA2 GeForce RTX 4060 1-Click-OC 2X (1.3) | |
| Nvidia GeForce RTX 2070 Super (1.3) | |
| XFX Speedster QICK 308 Radeon RX 7600 Black Edition (1.3) | |
| Sapphire Nitro+ Radeon RX 6650 XT (1.3) | |
| Nvidia GeForce RTX 2060 Super (1.3) | |
| AMD Radeon RX 5700 XT (1.3) | |
| AMD Radeon RX 5700 (1.3) | |
| Sapphire Pulse Radeon RX 6600 (1.3) | |
| KFA2 GeForce GTX 1660 Super (1.3) | |
| Acer Predator BiFrost Arc A770 OC, 16GB GDDR6 (1.3) | |
| Acer Predator BiFrost Arc A750 OC (1.3) | |
| PNY GeForce GTX 1660 (1.3) | |
| F1 23 | |
| 1920x1080 Ultra High Preset AA:T AF:16x | |
| Palit GeForce RTX 4090 GameRock OC (1022189) | |
| AMD Radeon RX 5700 XT (1022189) | |
| AMD Radeon RX 5700 (1022189) | |
| KFA2 GeForce RTX 4070 EX Gamer | |
| AMD Radeon RX 7900 GRE (1016022) | |
| MSI Radeon RX 6950 XT Gaming X Trio (1016022) | |
| AMD Radeon RX 7800 XT (1022189) | |
| KFA2 GeForce GTX 1660 Super (1016022) | |
| ASUS Dual GeForce RTX 4060 Ti OC (1012607) | |
| KFA2 GeForce RTX 4060 Ti EX, 16GB GDDR6 (1022189) | |
| Nvidia Titan RTX (1021115) | |
| PNY GeForce GTX 1660 (1016022) | |
| Nvidia GeForce RTX 3060 Ti FE (1021115) | |
| AMD Radeon RX 6800 (1016022) | |
| Acer Predator BiFrost Arc A770 OC, 16GB GDDR6 (1026791) | |
| KFA2 GeForce RTX 4060 1-Click-OC 2X (1008687) | |
| Sapphire Pulse Radeon RX 6750 XT (1016022) | |
| Acer Predator BiFrost Arc A750 OC (1042581) | |
| Nvidia GeForce RTX 2070 Super (1021115) | |
| XFX Speedster QICK 308 Radeon RX 7600 Black Edition (1016022) | |
| Nvidia GeForce RTX 2060 Super (1021115) | |
| Sapphire Nitro+ Radeon RX 6650 XT (1016022) | |
| Sapphire Pulse Radeon RX 6600 (1016022) | |
| 2560x1440 Ultra High Preset AA:T AF:16x | |
| Palit GeForce RTX 4090 GameRock OC (1022189) | |
| AMD Radeon RX 5700 XT (1022189) | |
| AMD Radeon RX 5700 (1022189) | |
| KFA2 GeForce RTX 4070 EX Gamer | |
| AMD Radeon RX 7900 GRE (1016022) | |
| MSI Radeon RX 6950 XT Gaming X Trio (1016022) | |
| KFA2 GeForce GTX 1660 Super (1016022) | |
| PNY GeForce GTX 1660 (1016022) | |
| AMD Radeon RX 7800 XT (1022189) | |
| Nvidia Titan RTX (1021115) | |
| ASUS Dual GeForce RTX 4060 Ti OC (1012607) | |
| KFA2 GeForce RTX 4060 Ti EX, 16GB GDDR6 (1022189) | |
| Nvidia GeForce RTX 3060 Ti FE (1021115) | |
| Acer Predator BiFrost Arc A770 OC, 16GB GDDR6 (1026791) | |
| AMD Radeon RX 6800 (1016022) | |
| KFA2 GeForce RTX 4060 1-Click-OC 2X (1008687) | |
| Sapphire Pulse Radeon RX 6750 XT (1016022) | |
| Acer Predator BiFrost Arc A750 OC (1042581) | |
| Nvidia GeForce RTX 2070 Super (1021115) | |
| XFX Speedster QICK 308 Radeon RX 7600 Black Edition (1016022) | |
| Nvidia GeForce RTX 2060 Super (1021115) | |
| Sapphire Nitro+ Radeon RX 6650 XT (1016022) | |
| Sapphire Pulse Radeon RX 6600 (1016022) | |
P1 values of the Acer Predator BiFrost Arc A750 OC
光线追踪性能
由于英特尔的 Arc 显卡也支持光线追踪,因此我们还额外考察了它在这一领域的性能:我们的宏碁掠夺者 BiFrost Arc A750 OC 配备了 28 个光线加速器,其性能与 AMD Radeon RX 7600.我们的测试卡无法接近 Nvidia RTX 40 的光线追踪性能。 NvidiaGeForce RTX 4060.
| Spider-Man Miles Morales - 1920x0180 Very High Preset + Ray-Tracing AA:T | |
| KFA2 GeForce RTX 4070 Ti EX Gamer | |
| KFA2 GeForce RTX 4070 EX Gamer | |
| AMD Radeon RX 7800 XT | |
| MSI Radeon RX 6950 XT Gaming X Trio | |
| KFA2 GeForce RTX 3070 Ti SG | |
| AMD Radeon RX 7900 GRE | |
| ASUS Dual GeForce RTX 4060 Ti OC | |
| Sapphire Pulse Radeon RX 7700 XT | |
| AMD Radeon RX 6800 | |
| Nvidia GeForce RTX 3060 Ti FE | |
| Acer Predator BiFrost Arc A770 OC, 16GB GDDR6 | |
| KFA2 GeForce RTX 4060 1-Click-OC 2X | |
| Sapphire Pulse Radeon RX 6750 XT | |
| Nvidia GeForce RTX 2070 Super | |
| XFX Speedster QICK 308 Radeon RX 7600 Black Edition | |
| Acer Predator BiFrost Arc A750 OC | |
| Nvidia GeForce RTX 2060 Super | |
| Sapphire Nitro+ Radeon RX 6650 XT | |
| Sapphire Pulse Radeon RX 6600 | |
| Metro Exodus - 1920x1080 Ultra Quality DXR AF:16x | |
| KFA2 GeForce RTX 4070 Ti EX Gamer | |
| MSI Radeon RX 6950 XT Gaming X Trio | |
| KFA2 GeForce RTX 4070 EX Gamer | |
| AMD Radeon RX 7900 GRE | |
| AMD Radeon RX 7800 XT | |
| KFA2 GeForce RTX 3070 Ti SG | |
| Sapphire Pulse Radeon RX 7700 XT | |
| ASUS Dual GeForce RTX 4060 Ti OC | |
| Nvidia GeForce RTX 3060 Ti FE | |
| Acer Predator BiFrost Arc A770 OC, 16GB GDDR6 | |
| Sapphire Pulse Radeon RX 6750 XT | |
| KFA2 GeForce RTX 4060 1-Click-OC 2X | |
| Acer Predator BiFrost Arc A750 OC | |
| XFX Speedster QICK 308 Radeon RX 7600 Black Edition | |
| Nvidia GeForce RTX 2070 Super | |
| Nvidia GeForce RTX 2060 Super | |
| Sapphire Pulse Radeon RX 6600 | |
| Far Cry 6 - 1920x1080 Ultra Graphics Quality + HD Textures + DXR AA:T | |
| KFA2 GeForce RTX 4070 Ti EX Gamer | |
| AMD Radeon RX 7900 GRE | |
| MSI Radeon RX 6950 XT Gaming X Trio | |
| KFA2 GeForce RTX 4070 EX Gamer | |
| AMD Radeon RX 7800 XT | |
| AMD Radeon RX 6800 | |
| Sapphire Pulse Radeon RX 7700 XT | |
| Sapphire Pulse Radeon RX 6750 XT | |
| Acer Predator BiFrost Arc A770 OC, 16GB GDDR6 | |
| Acer Predator BiFrost Arc A750 OC | |
| XFX Speedster QICK 308 Radeon RX 7600 Black Edition | |
| KFA2 GeForce RTX 3070 Ti SG | |
| Nvidia GeForce RTX 2070 Super | |
| Nvidia GeForce RTX 2060 Super | |
| KFA2 GeForce RTX 4060 1-Click-OC 2X | |
| Cyberpunk 2077 1.6 - 1920x1080 Ray Tracing Ultra Preset (DLSS off) | |
| KFA2 GeForce RTX 4070 Ti EX Gamer | |
| KFA2 GeForce RTX 4070 EX Gamer | |
| AMD Radeon RX 7900 GRE (1.6) | |
| ASUS Dual GeForce RTX 4060 Ti OC (1.6) | |
| MSI Radeon RX 6950 XT Gaming X Trio (1.61) | |
| KFA2 GeForce RTX 3070 Ti SG (1.61) | |
| AMD Radeon RX 7800 XT (1.6) | |
| Nvidia GeForce RTX 3060 Ti FE (1.5) | |
| Sapphire Pulse Radeon RX 7700 XT (1.6) | |
| Sapphire Pulse Radeon RX 7700 XT (1.6) | |
| Sapphire Pulse Radeon RX 7700 XT (1.6) | |
| KFA2 GeForce RTX 4060 1-Click-OC 2X (1.6) | |
| AMD Radeon RX 6800 (1.61) | |
| Nvidia GeForce RTX 2070 Super (1.6) | |
| Acer Predator BiFrost Arc A770 OC, 16GB GDDR6 (1.6) | |
| Sapphire Pulse Radeon RX 6750 XT | |
| Acer Predator BiFrost Arc A750 OC (1.6) | |
| Nvidia GeForce RTX 2060 Super (1.6) | |
| XFX Speedster QICK 308 Radeon RX 7600 Black Edition (1.6) | |
| Sapphire Nitro+ Radeon RX 6650 XT (1.5) | |
| The Callisto Protocol - 1920x1080 Ultra Preset (without FSR Upscaling) + Full Ray-Tracing | |
| AMD Radeon RX 7800 XT | |
| AMD Radeon RX 7900 GRE | |
| KFA2 GeForce RTX 4070 Ti EX Gamer | |
| Sapphire Pulse Radeon RX 7700 XT | |
| ASUS Dual GeForce RTX 4060 Ti OC | |
| MSI Radeon RX 6950 XT Gaming X Trio | |
| Nvidia GeForce RTX 3060 Ti FE | |
| KFA2 GeForce RTX 4070 EX Gamer | |
| AMD Radeon RX 6800 | |
| XFX Speedster QICK 308 Radeon RX 7600 Black Edition | |
| KFA2 GeForce RTX 3070 Ti SG | |
| Acer Predator BiFrost Arc A770 OC, 16GB GDDR6 | |
| Acer Predator BiFrost Arc A750 OC | |
| Sapphire Nitro+ Radeon RX 6650 XT | |
| Nvidia GeForce RTX 2070 Super | |
| Sapphire Pulse Radeon RX 6600 | |
| Nvidia GeForce RTX 2060 Super | |
| Sapphire Pulse Radeon RX 6750 XT | |
| PNY GeForce GTX 1660 | |
| KFA2 GeForce GTX 1660 Super | |
| Guardians of the Galaxy - 1920x1080 Ultra Preset + Ultra Ray-Tracing | |
| KFA2 GeForce RTX 4070 Ti EX Gamer | |
| KFA2 GeForce RTX 4070 EX Gamer | |
| AMD Radeon RX 7900 GRE | |
| MSI Radeon RX 6950 XT Gaming X Trio | |
| ASUS Dual GeForce RTX 4060 Ti OC | |
| AMD Radeon RX 7800 XT | |
| Nvidia GeForce RTX 3060 Ti FE | |
| KFA2 GeForce RTX 4060 1-Click-OC 2X | |
| Sapphire Pulse Radeon RX 7700 XT | |
| Nvidia GeForce RTX 2070 Super | |
| Sapphire Pulse Radeon RX 6750 XT | |
| Acer Predator BiFrost Arc A770 OC, 16GB GDDR6 | |
| Nvidia GeForce RTX 2060 Super | |
| Acer Predator BiFrost Arc A750 OC | |
| XFX Speedster QICK 308 Radeon RX 7600 Black Edition | |
| Sapphire Nitro+ Radeon RX 6650 XT | |
| Returnal - 1920x1080 Epic Preset + Epic Ray-Tracing | |
| KFA2 GeForce RTX 4070 Ti EX Gamer | |
| KFA2 GeForce RTX 4070 EX Gamer | |
| AMD Radeon RX 7900 GRE | |
| AMD Radeon RX 7800 XT | |
| ASUS Dual GeForce RTX 4060 Ti OC | |
| Sapphire Pulse Radeon RX 7700 XT | |
| Nvidia GeForce RTX 3060 Ti FE | |
| AMD Radeon RX 6800 | |
| KFA2 GeForce RTX 4060 1-Click-OC 2X | |
| Nvidia GeForce RTX 2070 Super | |
| Sapphire Pulse Radeon RX 6750 XT | |
| Nvidia GeForce RTX 2060 Super | |
| XFX Speedster QICK 308 Radeon RX 7600 Black Edition | |
| Acer Predator BiFrost Arc A770 OC, 16GB GDDR6 | |
| Acer Predator BiFrost Arc A750 OC | |
| Sapphire Nitro+ Radeon RX 6650 XT | |
| F1 23 - 1920x1080 Ultra High Preset AA:T AF:16x | |
| KFA2 GeForce RTX 4070 EX Gamer | |
| AMD Radeon RX 7900 GRE (1016022) | |
| MSI Radeon RX 6950 XT Gaming X Trio (1016022) | |
| AMD Radeon RX 7800 XT (1022189) | |
| KFA2 GeForce GTX 1660 Super (1016022) | |
| ASUS Dual GeForce RTX 4060 Ti OC (1012607) | |
| PNY GeForce GTX 1660 (1016022) | |
| Sapphire Pulse Radeon RX 7700 XT (1026791) | |
| Nvidia GeForce RTX 3060 Ti FE (1021115) | |
| AMD Radeon RX 6800 (1016022) | |
| Acer Predator BiFrost Arc A770 OC, 16GB GDDR6 (1026791) | |
| KFA2 GeForce RTX 4060 1-Click-OC 2X (1008687) | |
| Sapphire Pulse Radeon RX 6750 XT (1016022) | |
| Acer Predator BiFrost Arc A750 OC (1042581) | |
| Nvidia GeForce RTX 2070 Super (1021115) | |
| XFX Speedster QICK 308 Radeon RX 7600 Black Edition (1016022) | |
| Nvidia GeForce RTX 2060 Super (1021115) | |
| Sapphire Nitro+ Radeon RX 6650 XT (1016022) | |
| Sapphire Pulse Radeon RX 6600 (1016022) | |
| Star Wars Jedi Survivor - 1920x1080 Epic Preset + Ray Tracing | |
| KFA2 GeForce RTX 4070 Ti EX Gamer | |
| MSI Radeon RX 6950 XT Gaming X Trio | |
| AMD Radeon RX 7900 GRE | |
| KFA2 GeForce RTX 4070 EX Gamer | |
| AMD Radeon RX 7800 XT | |
| Sapphire Pulse Radeon RX 7700 XT | |
| AMD Radeon RX 6800 | |
| Nvidia GeForce RTX 3060 Ti FE | |
| ASUS Dual GeForce RTX 4060 Ti OC | |
| Sapphire Pulse Radeon RX 6750 XT | |
| KFA2 GeForce RTX 4060 1-Click-OC 2X | |
| Nvidia GeForce RTX 2070 Super | |
| Acer Predator BiFrost Arc A770 OC, 16GB GDDR6 | |
| XFX Speedster QICK 308 Radeon RX 7600 Black Edition | |
| Sapphire Nitro+ Radeon RX 6650 XT | |
| Acer Predator BiFrost Arc A750 OC | |
| Nvidia GeForce RTX 2060 Super | |
| Sapphire Pulse Radeon RX 6600 | |
| Hogwarts Legacy - 1920x1080 Ultra Preset + Full Ray Tracing AA:High T | |
| KFA2 GeForce RTX 4070 EX Gamer | |
| KFA2 GeForce RTX 4070 Ti EX Gamer | |
| MSI Radeon RX 6950 XT Gaming X Trio | |
| AMD Radeon RX 7900 GRE | |
| ASUS Dual GeForce RTX 4060 Ti OC | |
| Nvidia GeForce RTX 3060 Ti FE | |
| Sapphire Pulse Radeon RX 7700 XT | |
| AMD Radeon RX 6800 | |
| KFA2 GeForce RTX 4060 1-Click-OC 2X | |
| Nvidia GeForce RTX 2070 Super | |
| Acer Predator BiFrost Arc A770 OC, 16GB GDDR6 | |
| Sapphire Pulse Radeon RX 6750 XT | |
| Nvidia GeForce RTX 2060 Super | |
| Sapphire Nitro+ Radeon RX 6650 XT | |
| Acer Predator BiFrost Arc A750 OC | |
| XFX Speedster QICK 308 Radeon RX 7600 Black Edition | |
| Ghostwire Tokyo - 1920x1080 Highest Settings + Maximum Ray Tracing | |
| KFA2 GeForce RTX 4070 Ti EX Gamer | |
| KFA2 GeForce RTX 4070 EX Gamer | |
| AMD Radeon RX 7900 GRE | |
| MSI Radeon RX 6950 XT Gaming X Trio | |
| AMD Radeon RX 7800 XT | |
| ASUS Dual GeForce RTX 4060 Ti OC | |
| Sapphire Pulse Radeon RX 7700 XT | |
| Nvidia GeForce RTX 3060 Ti FE | |
| KFA2 GeForce RTX 4060 1-Click-OC 2X | |
| Acer Predator BiFrost Arc A770 OC, 16GB GDDR6 | |
| Sapphire Pulse Radeon RX 6750 XT | |
| Acer Predator BiFrost Arc A750 OC | |
| Nvidia GeForce RTX 2070 Super | |
| XFX Speedster QICK 308 Radeon RX 7600 Black Edition | |
| Sapphire Nitro+ Radeon RX 6650 XT | |
| Nvidia GeForce RTX 2060 Super | |
| Sapphire Pulse Radeon RX 6600 | |
| low | med. | high | ultra | QHD | 4K | |
|---|---|---|---|---|---|---|
| GTA V (2015) | 188.1 | 187.1 | 137.3 | 60.2 | 41.1 | 44.8 |
| The Witcher 3 (2015) | 443 | 308 | 184.7 | 69.2 | 57 | 69.2 |
| Dota 2 Reborn (2015) | 140.2 | 124.1 | 113.8 | 121.3 | 89.9 | |
| Assassin´s Creed Origins (2017) | 78 | 65 | 63 | 56 | 50 | 37 |
| Final Fantasy XV Benchmark (2018) | 124.5 | 86.6 | 48.2 | 41.4 | 28.8 | |
| X-Plane 11.11 (2018) | 98.8 | 87.1 | 68.4 | 56.6 | ||
| Far Cry 5 (2018) | 152 | 111 | 102 | 98 | 76 | 45 |
| Strange Brigade (2018) | 623 | 285 | 239 | 198.6 | 144.9 | 83.5 |
| Shadow of the Tomb Raider (2018) | 265 | 130.9 | 122.2 | 108.4 | 78.9 | 44.2 |
| Forza Horizon 4 (2018) | 176 | 112 | 106 | 90 | 79 | 61 |
| Assassin´s Creed Odyssey (2018) | 76 | 62 | 55 | 45 | 38 | 28 |
| Apex Legends (2019) | 144 | 143.9 | 143.1 | 143.7 | 128.3 | 79.6 |
| Far Cry New Dawn (2019) | 143 | 116 | 110 | 99 | 86 | 52 |
| Metro Exodus (2019) | 198.9 | 139.6 | 96.5 | 78.7 | 65 | 43.1 |
| The Division 2 (2019) | 197 | 147 | 118 | 93 | 63 | 31 |
| Anno 1800 (2019) | 150.5 | 105 | 67.9 | 37 | 27 | 15.8 |
| Control (2019) | 195.3 | 99.2 | 81.6 | 59.4 | 31.6 | |
| Borderlands 3 (2019) | 126.5 | 110.5 | 93.2 | 78.4 | 60 | 33.1 |
| F1 2020 (2020) | 267 | 194.6 | 162.3 | 113.4 | 92.3 | 58.3 |
| Death Stranding (2020) | 179.9 | 132.8 | 126.2 | 121.6 | 92.4 | 55 |
| Horizon Zero Dawn (2020) | 136 | 115 | 104 | 93 | 74 | 42 |
| Watch Dogs Legion (2020) | 101 | 96 | 89 | 63 | 50 | 30 |
| Dirt 5 (2020) | 84.8 | 76.9 | 61.5 | 52.6 | 52.2 | 50.1 |
| Assassin´s Creed Valhalla (2020) | 116 | 90 | 76 | 69 | 54 | 30 |
| F1 2021 (2021) | 530 | 305 | 235 | 115.2 | 86.7 | 47.9 |
| Far Cry 6 (2021) | 193.9 | 126.7 | 110.1 | 83.7 | 70.9 | 41.9 |
| Guardians of the Galaxy (2021) | 167 | 118 | 116 | 109 | 83 | 48 |
| Forza Horizon 5 (2021) | 227 | 132 | 121 | 70 | 60 | 44 |
| Farming Simulator 22 (2021) | 356 | 219 | 192.4 | 165.8 | 128.2 | 80.7 |
| God of War (2022) | 84.2 | 76.7 | 65.6 | 51.4 | 44.4 | 31.2 |
| GRID Legends (2022) | 156.3 | 129.7 | 106.9 | 88.7 | 77.1 | 67.7 |
| Cyberpunk 2077 1.6 (2022) | 75.1 | 66.4 | 58.3 | 55 | 41.5 | 23.2 |
| Ghostwire Tokyo (2022) | 136 | 133.7 | 132.9 | 125.4 | 88.2 | 43.2 |
| Tiny Tina's Wonderlands (2022) | 188.1 | 149.8 | 104.9 | 85.8 | 59.2 | 30.9 |
| F1 22 (2022) | 280 | 249 | 201 | 65.4 | 40.9 | 18.4 |
| The Quarry (2022) | 116.7 | 90.9 | 74 | 56.9 | 39.5 | 20.3 |
| A Plague Tale Requiem (2022) | 94.9 | 77.2 | 60.9 | 47 | 36.7 | 21.9 |
| Uncharted Legacy of Thieves Collection (2022) | 57.4 | 55.6 | 52.8 | 49.1 | 37.2 | 19 |
| Spider-Man Miles Morales (2022) | 129.1 | 116 | 112.5 | 104.7 | 77.9 | 44.7 |
| The Callisto Protocol (2022) | 152.2 | 114.7 | 107.1 | 75.8 | 60.5 | 38.1 |
| Need for Speed Unbound (2022) | 108.6 | 96 | 75.3 | 74.8 | 56.6 | 32.5 |
| High On Life (2023) | 241 | 158.2 | 130.8 | 104.3 | 66.5 | 30.9 |
| Dead Space Remake (2023) | 70.8 | 71.2 | 63.9 | 63.8 | 44.7 | 16.7 |
| Hogwarts Legacy (2023) | 110.7 | 85.1 | 67.6 | 55.3 | 41.6 | 22.8 |
| Returnal (2023) | 85 | 84 | 77 | 67 | 53 | 32 |
| Atomic Heart (2023) | 163.6 | 122.6 | 89.3 | 64.6 | 51.8 | 30.5 |
| Company of Heroes 3 (2023) | 169.9 | 142.7 | 114.2 | 114.1 | 86.4 | 53.7 |
| Sons of the Forest (2023) | 65.5 | 51 | 50.5 | 49.7 | 36.7 | 21.7 |
| Resident Evil 4 Remake (2023) | 150.5 | 108.1 | 101.9 | 67.9 | 47.6 | 28.9 |
| The Last of Us (2023) | 49.5 | 36.4 | 46 | 38.7 | 28.4 | 12.7 |
| Dead Island 2 (2023) | 204 | 174 | 138.1 | 107.5 | 79 | 40.4 |
| Star Wars Jedi Survivor (2023) | 75.9 | 67.2 | 63.3 | 58.9 | 39 | 19.5 |
| Diablo 4 (2023) | 197 | 178.3 | 162 | 136.1 | 87.1 | 47.2 |
| F1 23 (2023) | 274 | 239 | 170.5 | 55.2 | 34.9 | 16.2 |
| Ratchet & Clank Rift Apart (2023) | 85.4 | 74.3 | 59.9 | 53.7 | 43.5 | 30.5 |
| Atlas Fallen (2023) | 126.6 | 122.3 | 115.2 | 83.3 | 63.9 | 33.1 |
| Immortals of Aveum (2023) | 53.8 | 46.8 | 41.8 | 29.7 | 9.87 | |
| Armored Core 6 (2023) | 75 | 73.9 | 71.5 | 70.4 | 65.7 | 41.6 |
| Starfield (2023) | 44.1 | 38.5 | 32.9 | 27.2 | 16.5 | 11.2 |
| Lies of P (2023) | 156.9 | 138.4 | 121.4 | 112 | 77.9 | 40.4 |
| Baldur's Gate 3 (2023) | 119 | 100.9 | 90.3 | 87.9 | 58.9 | 29.8 |
| Cyberpunk 2077 (2023) | 90.7 | 87.9 | 76.3 | 74.9 | 54.2 | 27.6 |
| Counter-Strike 2 (2023) | 336 | 270 | 169.5 | 117.9 | 89 | 40.3 |
| EA Sports FC 24 (2023) | 191.8 | 176.2 | 136.5 | 127.2 | 105.7 | 67.7 |
| Assassin's Creed Mirage (2023) | 80 | 70 | 70 | 53 | 43 | 29 |
| Total War Pharaoh (2023) | 367.2 | 231.4 | 137 | 108.7 | 77.4 | 40.6 |
| Lords of the Fallen (2023) | 63.2 | 55.4 | 46.4 | 35.2 | 25.7 | 10.1 |
| Alan Wake 2 (2023) | 44.6 | 41.3 | 38 | 26.7 | 15.7 | |
| EA Sports WRC (2023) | 98.4 | 72.3 | 66 | 61 | 49 | 30.3 |
| Call of Duty Modern Warfare 3 2023 (2023) | 109 | 99 | 80 | 75 | 57 | 20 |
| Avatar Frontiers of Pandora (2023) | 59 | 55 | 47 | 38 | 27 | 12 |
| The Finals (2023) | 189.5 | 148.8 | 134.6 | 109.3 | 72.1 | 35.1 |
| Ready or Not (2023) | 185 | 173.1 | 166.8 | 118.5 | 73.9 | 31.9 |
排放 - 声音太大,功率要求太高
噪音排放
与宏碁掠夺者 BiFrost Arc A770 OCAcer Predator BiFrost Arc A750 OC 也配备了两个不同的风扇。遗憾的是,宏碁型号没有风扇停止模式,这意味着显卡始终保持声音。在空闲模式下,我们的测试样本可以听到 29 分贝(A)的噪音,而在低负载情况下,我们测得的噪音辐射为 35 分贝(A)。最多时,我们测得的噪音为 49.7 dB(A),相比之下还是相当大的。宏碁掠夺者 BiFrost Arc A750 OC 在玩游戏时的噪音也相当大,我们测得略高于 44 dB(A)。
Noise level
| Idle |
| 29 / 29.2 / 29.3 dB(A) |
| Load |
| 35.1 / 49.7 dB(A) |
 | ||
30 dB silent 40 dB(A) audible 50 dB(A) loud |
||
min:  , med: , med:  , max: , max:  Earthworks M23R (15 cm distance) environment noise: 25.4 dB(A) Earthworks M23R (15 cm distance) environment noise: 25.4 dB(A) | ||
| Acer Predator BiFrost Arc A750 OC | AMD Radeon RX 7800 XT | KFA2 GeForce RTX 4070 Ti EX Gamer | KFA2 GeForce RTX 4070 EX Gamer | KFA2 GeForce RTX 4060 1-Click-OC 2X | ASUS Dual GeForce RTX 4060 Ti OC | XFX Speedster QICK 308 Radeon RX 7600 Black Edition | Sapphire Pulse Radeon RX 7700 XT | Acer Predator BiFrost Arc A770 OC, 16GB GDDR6 | |
|---|---|---|---|---|---|---|---|---|---|
| Noise | 8% | 1% | -0% | 8% | 8% | 11% | 8% | -13% | |
| off / environment * (dB) | 25.4 | 24.7 3% | 30 -18% | 30 -18% | 25.8 -2% | 25.4 -0% | 25.4 -0% | 25 2% | 25.4 -0% |
| Idle Minimum * (dB) | 29 | 26.8 8% | 30.1 -4% | 30.2 -4% | 25.9 11% | 26.7 8% | 26.3 9% | 27.4 6% | 39 -34% |
| Idle Average * (dB) | 29.2 | 27.2 7% | 30.1 -3% | 30.2 -3% | 25.9 11% | 26.7 9% | 26.3 10% | 27.5 6% | 39 -34% |
| Idle Maximum * (dB) | 29.3 | 27.3 7% | 30.1 -3% | 30.2 -3% | 25.9 12% | 26.7 9% | 26.3 10% | 28 4% | 39 -33% |
| Load Average * (dB) | 35.1 | 30.7 13% | 30.2 14% | 31.8 9% | 30.3 14% | 29.3 17% | 29.6 16% | 32.6 7% | 39 -11% |
| Witcher 3 ultra * (dB) | 44.2 | 42.6 4% | 40.2 9% | 45.2 -2% | 42.5 4% | 39.6 10% | 42.1 5% | 41.5 6% | |
| Load Maximum * (dB) | 49.7 | 43 13% | 44.7 10% | 41.1 17% | 43.5 12% | 46 7% | 39.4 21% | 37.6 24% | 42.1 15% |
* ... smaller is better
温度和功耗
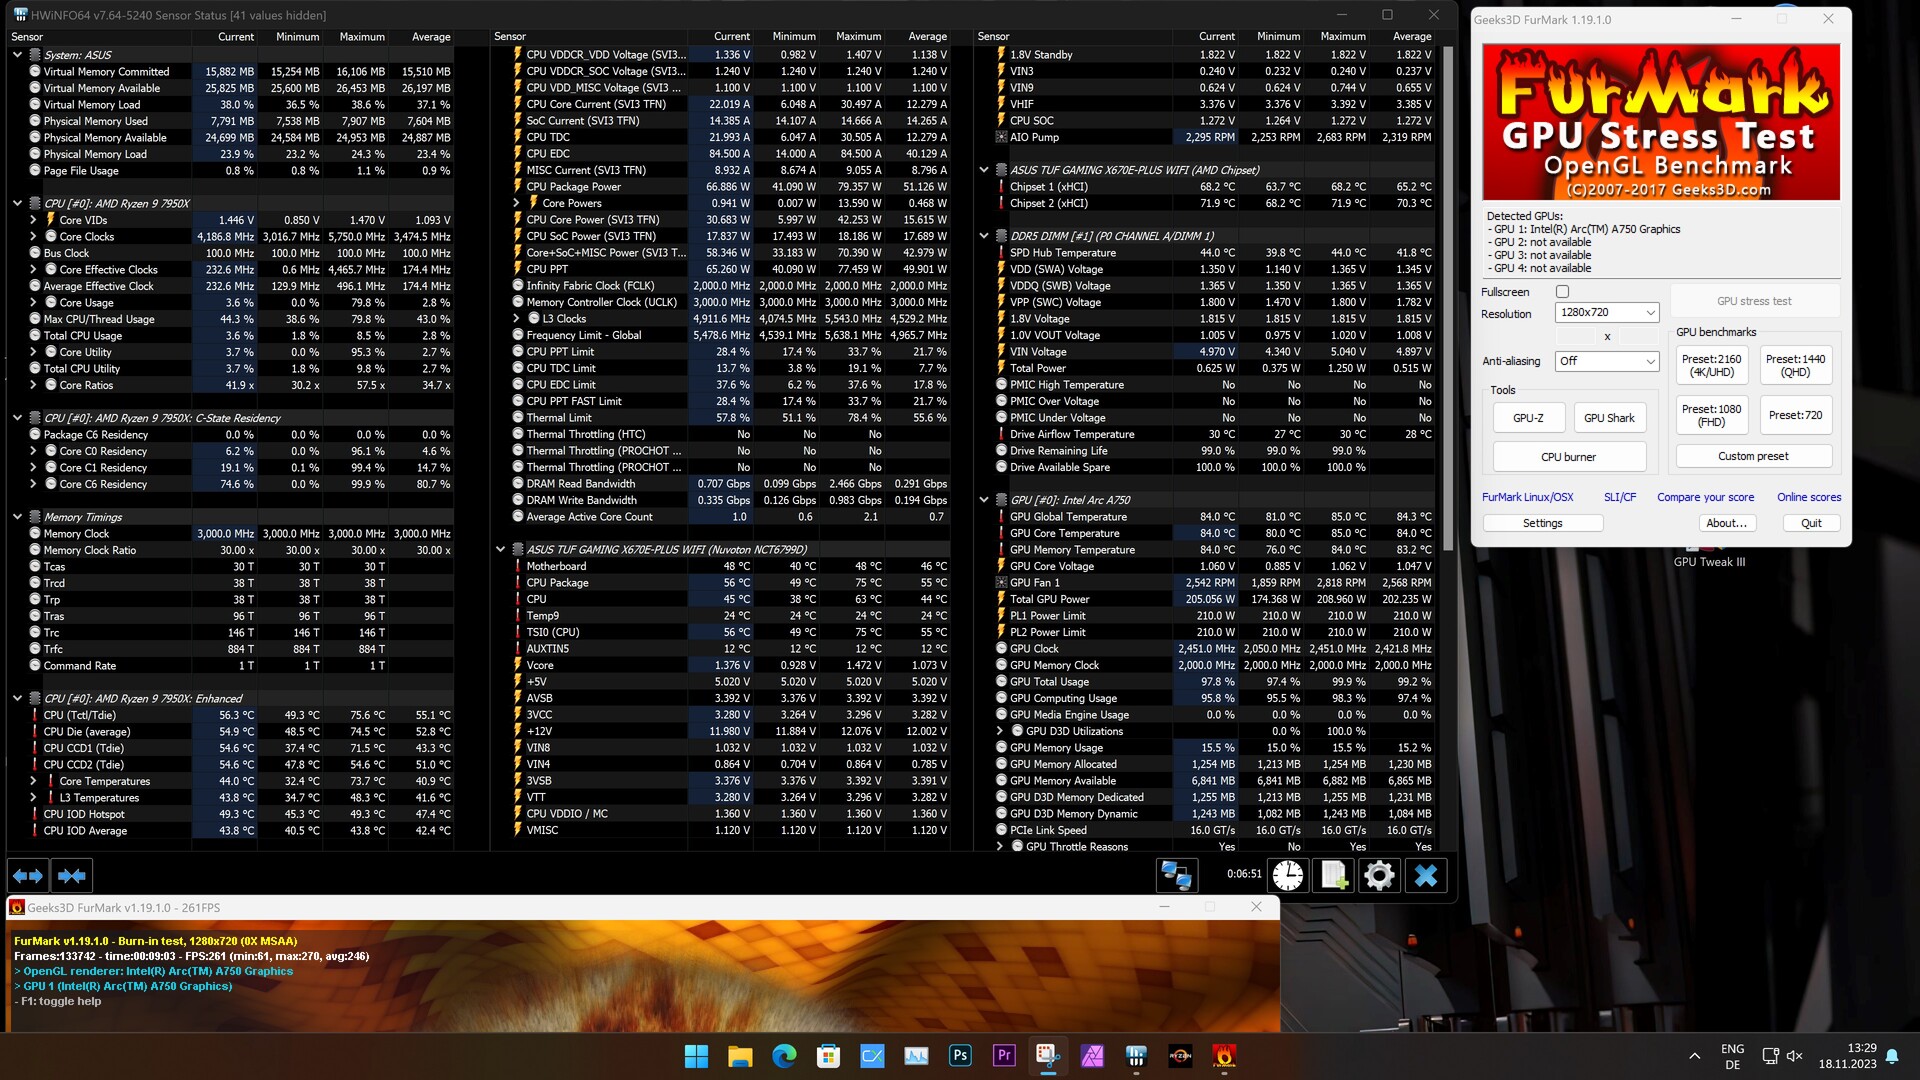
宏碁掠夺者 BiFrost Arc A750 OC 的散热装置在压力测试中达到了极限,这一点可以从其功耗值中看出。为了让足够的新鲜空气通过风扇,两个风扇都必须努力工作,这也导致显卡发出声音。在使用 FurMark 进行的压力测试中,我们注意到最高温度达到了 85 °C。在功耗方面,我们注意到显卡很容易就达到了功耗极限(210 瓦)。我们测得整个系统的功耗为 464 瓦。在玩游戏时,系统似乎更加节俭--我们测得的平均功率为 329 瓦。与宏碁掠夺者 BiFrost Arc A770 OC相比,我们的测试样本表现出人意料的糟糕。为了排除在测试宏碁掠夺者 BiFrost Arc A770 OC 时出现的任何误差宏碁掠夺者 BiFrost Arc A770 OC,我们重复进行了测量,结果相同。最后,我们不知道是什么原因导致了如此高的耗电量。我们不能排除驱动程序的问题。
随后,宏碁掠夺者 BiFrost Arc A750 OC 在效率方面也落后不少。宏碁为该机型推荐的电源功率为 650 瓦。我们认为,这是一个不错的选择,在配置时一定要牢记。
| Power Consumption / The Witcher 3 ultra (external Monitor) | |
| AMD Radeon RX 7900 XTX (Idle: 86.5 W) | |
| NVIDIA GeForce RTX 3090 Founders Edition | |
| Palit GeForce RTX 4090 GameRock OC | |
| KFA2 GeForce RTX 4080 SG (Idle: 86.4 W) | |
| AMD Radeon RX 7900 XT (Idle: 84.6 W) | |
| KFA2 GeForce RTX 3070 Ti SG (Idle: 88.9 W) | |
| AMD Radeon RX 7900 GRE | |
| KFA2 GeForce RTX 4070 Ti EX Gamer | |
| AMD Radeon RX 7800 XT | |
| Sapphire Pulse Radeon RX 6750 XT | |
| KFA2 GeForce RTX 4070 EX Gamer | |
| XFX Speedster QICK 308 Radeon RX 7600 Black Edition | |
| Sapphire Nitro+ Radeon RX 6650 XT | |
| Acer Predator BiFrost Arc A750 OC | |
| KFA2 GeForce RTX 4060 Ti EX | |
| Acer Predator BiFrost Arc A770 OC, 16GB GDDR6 | |
| KFA2 GeForce RTX 4060 1-Click-OC 2X | |
| Power Consumption / FurMark 1.19 GPU Stress Test (external Monitor) | |
| Palit GeForce RTX 4090 GameRock OC | |
| AMD Radeon RX 7900 XTX (Idle: 86.5 W) | |
| NVIDIA GeForce RTX 3090 Founders Edition | |
| AMD Radeon RX 7900 XT (Idle: 84.6 W) | |
| KFA2 GeForce RTX 3070 Ti SG (Idle: 88.9 W) | |
| KFA2 GeForce RTX 4080 SG (Idle: 86.4 W) | |
| Acer Predator BiFrost Arc A750 OC | |
| KFA2 GeForce RTX 4070 Ti EX Gamer | |
| AMD Radeon RX 7900 GRE | |
| Sapphire Pulse Radeon RX 6750 XT | |
| AMD Radeon RX 7800 XT | |
| Acer Predator BiFrost Arc A770 OC, 16GB GDDR6 | |
| XFX Speedster QICK 308 Radeon RX 7600 Black Edition | |
| Sapphire Nitro+ Radeon RX 6650 XT | |
| KFA2 GeForce RTX 4070 EX Gamer | |
| KFA2 GeForce RTX 4060 Ti EX | |
| KFA2 GeForce RTX 4060 1-Click-OC 2X | |
| Power Consumption / Witcher 3 ultra Efficiency (external Monitor) | |
| Palit GeForce RTX 4090 GameRock OC | |
| KFA2 GeForce RTX 4080 SG | |
| AMD Radeon RX 7900 XT | |
| AMD Radeon RX 7900 XTX | |
| KFA2 GeForce RTX 4070 Ti EX Gamer | |
| AMD Radeon RX 7900 GRE | |
| KFA2 GeForce RTX 4070 EX Gamer | |
| KFA2 GeForce RTX 4060 Ti EX | |
| AMD Radeon RX 7800 XT | |
| KFA2 GeForce RTX 4060 1-Click-OC 2X | |
| Sapphire Pulse Radeon RX 6750 XT | |
| NVIDIA GeForce RTX 3090 Founders Edition | |
| XFX Speedster QICK 308 Radeon RX 7600 Black Edition | |
| KFA2 GeForce RTX 3070 Ti SG | |
| Sapphire Nitro+ Radeon RX 6650 XT | |
| Acer Predator BiFrost Arc A770 OC, 16GB GDDR6 | |
| Acer Predator BiFrost Arc A750 OC | |
* ... smaller is better
Power consumption with external monitor
Pros
Cons
结论:英特尔 Arc A77 更好
如果你不想花费超过 240 美元,宏碁掠夺者 BiFrost Arc A750 OC 有可能成为一款出色的游戏桌面 GPU。该显卡拥有 8GB VRAM,与目前 Nvidia 和 AMD 的竞争对手一样提供了大量显存。在我们的实际测试中,宏碁掠夺者 BiFrost Arc A750 OC 可以流畅运行大多数游戏。宏碁的这款机型乍看之下似乎做工精细,但直接与宏碁掠夺者 BiFrost Arc A770 OC 相比,它就显得力不从心了。更实惠的机型感觉更便宜一些,而且配备了不同的散热器,在负载情况下声音更大。
宏碁掠夺者 BiFrost Arc A750 OC 是一款经济实惠的显卡,可以在 1080p 下玩现代游戏。遗憾的是,宏碁显卡的效率并不完全令人信服。
纯粹从性能角度来看,宏碁掠夺者 BiFrost Arc A750 OC 与松景 Speedster QICK 30C 相比并不占优势。松景 Speedster QICK 308 Radeon RX 7600或KFA2GeForce RTX 4060.也许英特尔会通过改进驱动程序来进一步提高 Arc A750 的性能。不过,由于这纯属猜测,我们无法给出客观的说法。毕竟,我们只能依靠本评测中的测量结果。宏碁掠夺者 BiFrost Arc A750 OC 的前景并不乐观,我们不建议购买。即便如此,如果你仍想购买英特尔的显卡,那么不妨看看配备 16GB VRAM 的英特尔 Arc A770。说到底,它是一款更全面的产品,而且 360 美元的价格也不贵。Nvidia 和 AMD 显卡的价格大致相同。
价格和供应情况
宏碁掠夺者 BiFrost Arc A750 OC 目前在亚马逊上的售价为 239.94 美元。
Transparency
The selection of devices to be reviewed is made by our editorial team. The test sample was freely purchased by the author at his/her own expense. The lender had no influence on this review, nor did the manufacturer receive a copy of this review before publication. There was no obligation to publish this review. As an independent media company, Notebookcheck is not subjected to the authority of manufacturers, retailers or publishers.
This is how Notebookcheck is testing
Every year, Notebookcheck independently reviews hundreds of laptops and smartphones using standardized procedures to ensure that all results are comparable. We have continuously developed our test methods for around 20 years and set industry standards in the process. In our test labs, high-quality measuring equipment is utilized by experienced technicians and editors. These tests involve a multi-stage validation process. Our complex rating system is based on hundreds of well-founded measurements and benchmarks, which maintains objectivity. Further information on our test methods can be found here.
 Add as a preferred source on Google