 Deutsch
 English
 Español
 Français
 Italiano
 Nederlands
 Polski
 Português
 Русский
 Türkçe
 Svenska
 Chinese
 Magyar
宏碁 Aspire F17 F5-771G (i5, GTX 950M) 笔记本电脑简短评测

| SD Card Reader | |
| average JPG Copy Test (av. of 3 runs) | |
| Lenovo ThinkPad E570-20H6S00000 | |
| Acer Aspire F5-771G-50RD | |
| Acer Aspire F15 F5-573G-53V1 | |
| Acer Aspire E5-575G-549D | |
| Asus F756UX-T7013T | |
| Medion Erazer P7644 | |
| maximum AS SSD Seq Read Test (1GB) | |
| Acer Aspire F5-771G-50RD | |
| Lenovo ThinkPad E570-20H6S00000 | |
| Acer Aspire E5-575G-549D | |
| Asus F756UX-T7013T | |
| Medion Erazer P7644 | |
| Networking | |
| iperf3 transmit AX12 | |
| Lenovo ThinkPad E570-20H6S00000 | |
| Acer Aspire F5-771G-50RD | |
| iperf3 receive AX12 | |
| Lenovo ThinkPad E570-20H6S00000 | |
| Acer Aspire F5-771G-50RD | |
| |||||||||||||||||||||||||
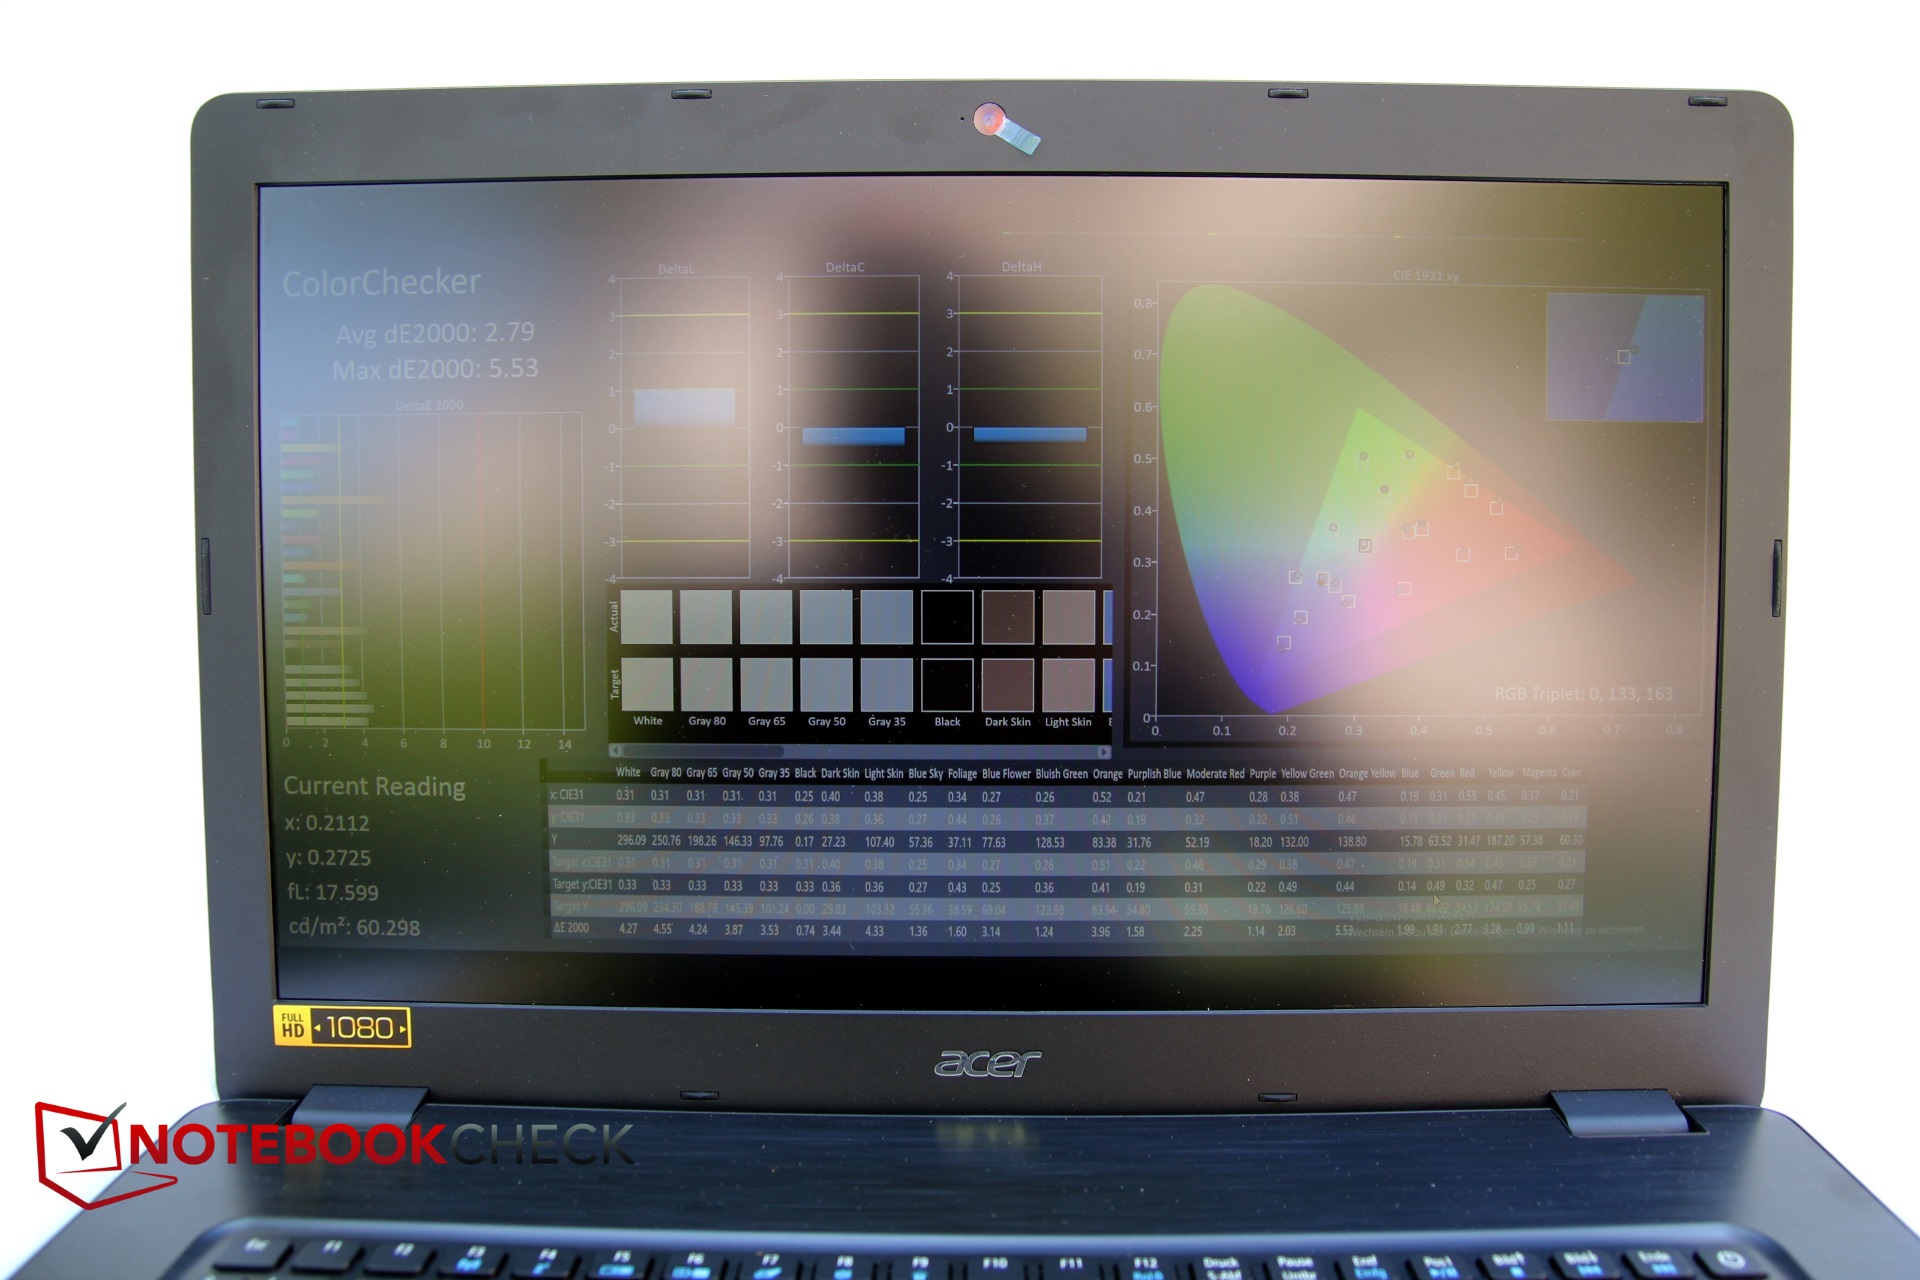
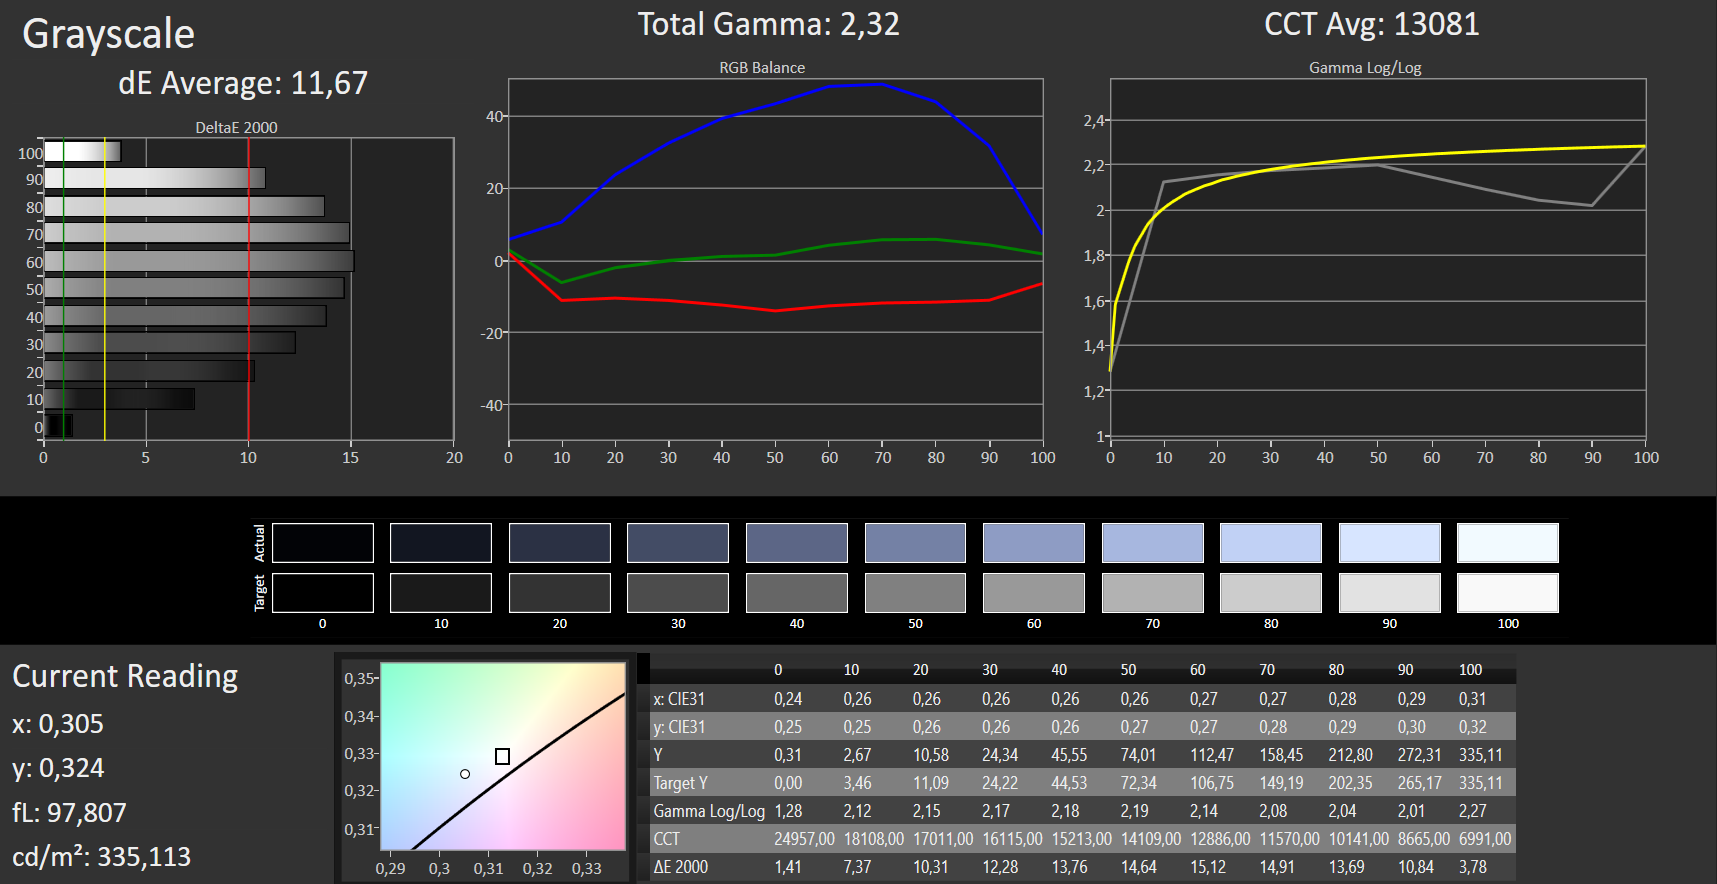
Brightness Distribution: 84 %
Center on Battery: 339 cd/m²
Contrast: 969:1 (Black: 0.35 cd/m²)
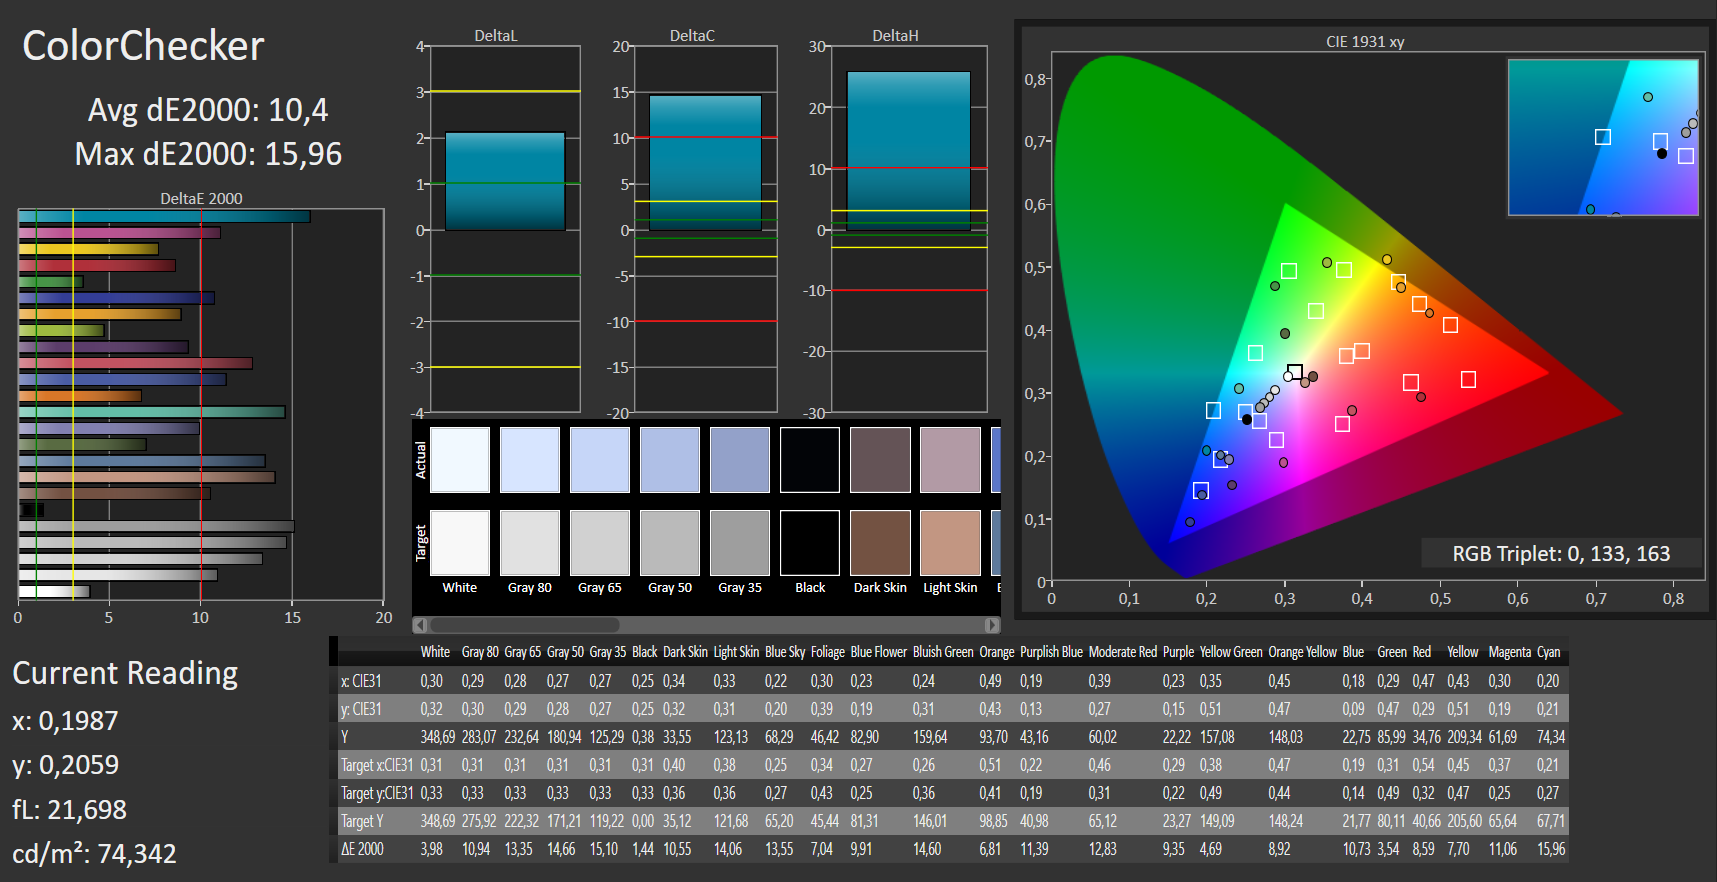
ΔE Color 10.4 | 0.5-29.43 Ø5
ΔE Greyscale 11.67 | 0.57-98 Ø5.3
91% sRGB (Argyll 1.6.3 3D)
60% AdobeRGB 1998 (Argyll 1.6.3 3D)
66.8% AdobeRGB 1998 (Argyll 2.2.0 3D)
91.2% sRGB (Argyll 2.2.0 3D)
69.7% Display P3 (Argyll 2.2.0 3D)
Gamma: 2.32
| Acer Aspire F5-771G-50RD AU Optronics B173HTN01.1, , 1920x1080, 17.30 | Acer Aspire E5-575G-549D Chi Mei CMN15C4, , 1920x1080, 15.60 | Acer Aspire F15 F5-573G-53V1 Innolux N156HGE-EAL, , 1920x1080, 15.60 | Lenovo ThinkPad E570-20H6S00000 AUO B156HAN04.4, , 1920x1080, 15.60 | Asus F756UX-T7013T Chi Mei CMN1735 / N173HGE-E11, , 1920x1080, 17.30 | Medion Erazer P7644 AU Optronics B173HAN01.0, , 1920x1080, 17.30 | |
|---|---|---|---|---|---|---|
| Display | -41% | 18% | -40% | -3% | -4% | |
| Display P3 Coverage | 69.7 | 38.57 -45% | 84.2 21% | 38.65 -45% | 63.9 -8% | 63.4 -9% |
| sRGB Coverage | 91.2 | 57.4 -37% | 99.7 9% | 58 -36% | 93.7 3% | 90.3 -1% |
| AdobeRGB 1998 Coverage | 66.8 | 39.89 -40% | 82.7 24% | 39.94 -40% | 64.6 -3% | 64.5 -3% |
| Response Times | -3% | -4% | -13% | 1% | -59% | |
| Response Time Grey 50% / Grey 80% * | 43 ? | 39 ? 9% | 44 ? -2% | 44.8 ? -4% | 42 ? 2% | 48 ? -12% |
| Response Time Black / White * | 21 ? | 24 ? -14% | 23 ? -10% | 25.6 ? -22% | 21 ? -0% | 36 ? -71% |
| PWM Frequency | 1000 ? | 1000 ? 0% | 1000 ? 0% | 50 ? -95% | ||
| Screen | -21% | -18% | 6% | 16% | 2% | |
| Brightness middle | 339 | 176 -48% | 234 -31% | 242 -29% | 268 -21% | 296 -13% |
| Brightness | 315 | 169 -46% | 219 -30% | 243 -23% | 255 -19% | 280 -11% |
| Brightness Distribution | 84 | 91 8% | 80 -5% | 75 -11% | 83 -1% | 87 4% |
| Black Level * | 0.35 | 0.47 -34% | 0.48 -37% | 0.24 31% | 0.17 51% | 0.48 -37% |
| Contrast | 969 | 374 -61% | 488 -50% | 1008 4% | 1576 63% | 617 -36% |
| Colorchecker dE 2000 * | 10.4 | 8.83 15% | 11.8 -13% | 4.65 55% | 7.18 31% | 4.71 55% |
| Colorchecker dE 2000 max. * | 15.96 | 14.01 12% | 20.69 -30% | 9.64 40% | 11.67 27% | |
| Greyscale dE 2000 * | 11.67 | 8.97 23% | 13.3 -14% | 3.39 71% | 7.97 32% | 5.17 56% |
| Gamma | 2.32 95% | 2.43 91% | 2.47 89% | 2.7 81% | 2.34 94% | 2.33 94% |
| CCT | 13081 50% | 10234 64% | 17098 38% | 6246 104% | 8541 76% | 7613 85% |
| Color Space (Percent of AdobeRGB 1998) | 60 | 36.8 -39% | 74 23% | 36.69 -39% | 59 -2% | 59 -2% |
| Color Space (Percent of sRGB) | 91 | 57.3 -37% | 100 10% | 57.66 -37% | 94 3% | 90 -1% |
| Total Average (Program / Settings) | -22% /
-22% | -1% /
-8% | -16% /
-6% | 5% /
10% | -20% /
-12% |
* ... smaller is better
Display Response Times
| ↔ Response Time Black to White | ||
|---|---|---|
| 21 ms ... rise ↗ and fall ↘ combined | ↗ 16 ms rise | 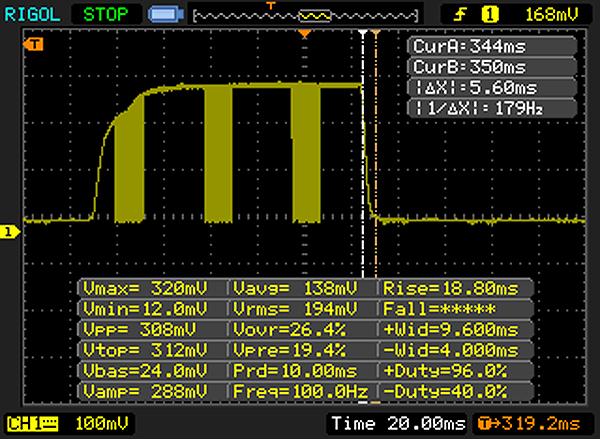 |
| ↘ 5 ms fall | ||
| The screen shows good response rates in our tests, but may be too slow for competitive gamers. In comparison, all tested devices range from 0.1 (minimum) to 240 (maximum) ms. » 41 % of all devices are better. This means that the measured response time is similar to the average of all tested devices (21.5 ms). | ||
| ↔ Response Time 50% Grey to 80% Grey | ||
| 43 ms ... rise ↗ and fall ↘ combined | ↗ 23 ms rise | 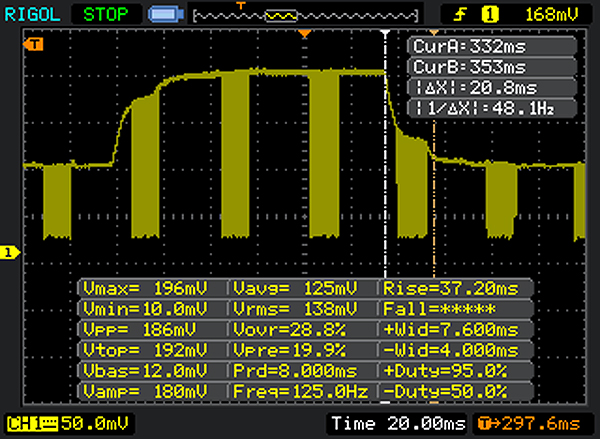 |
| ↘ 20 ms fall | ||
| The screen shows slow response rates in our tests and will be unsatisfactory for gamers. In comparison, all tested devices range from 0.2 (minimum) to 636 (maximum) ms. » 67 % of all devices are better. This means that the measured response time is worse than the average of all tested devices (33.7 ms). | ||
Screen Flickering / PWM (Pulse-Width Modulation)
| Screen flickering / PWM detected | 1000 Hz | ≤ 100 % brightness setting | 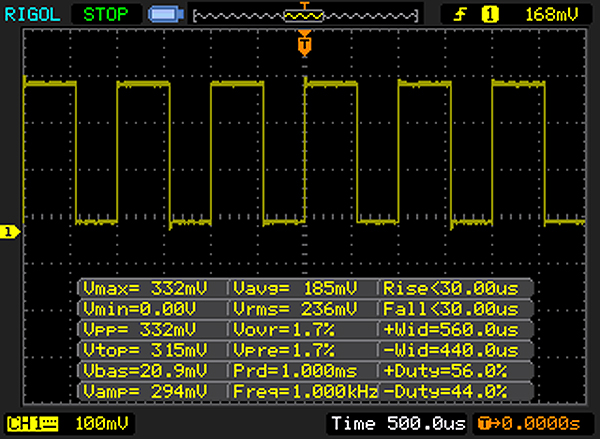 |
The display backlight flickers at 1000 Hz (worst case, e.g., utilizing PWM) Flickering detected at a brightness setting of 100 % and below. There should be no flickering or PWM above this brightness setting. The frequency of 1000 Hz is quite high, so most users sensitive to PWM should not notice any flickering. In comparison: 53 % of all tested devices do not use PWM to dim the display. If PWM was detected, an average of 17853 (minimum: 5 - maximum: 3846000) Hz was measured. | |||
| Cinebench R10 | |
| Rendering Single 32Bit | |
| Acer Aspire E5-575G-549D | |
| Acer Aspire F5-771G-50RD | |
| Medion Erazer P7644 | |
| Acer Aspire F15 F5-573G-53V1 | |
| Asus F756UX-T7013T | |
| Rendering Multiple CPUs 32Bit | |
| Acer Aspire E5-575G-549D | |
| Acer Aspire F5-771G-50RD | |
| Medion Erazer P7644 | |
| Acer Aspire F15 F5-573G-53V1 | |
| Asus F756UX-T7013T | |
| PCMark 8 Home Score Accelerated v2 | 3372 points | |
| PCMark 8 Work Score Accelerated v2 | 4205 points | |
Help | ||
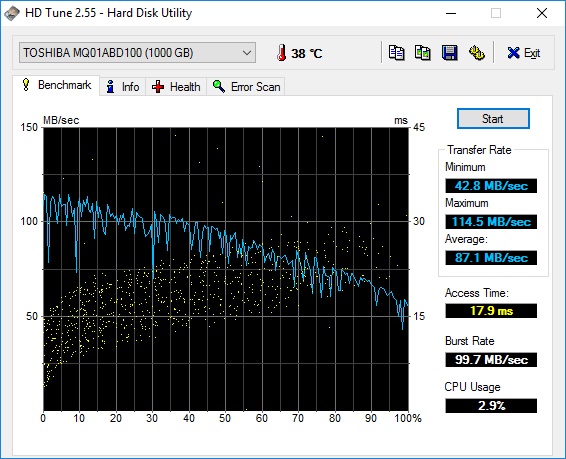
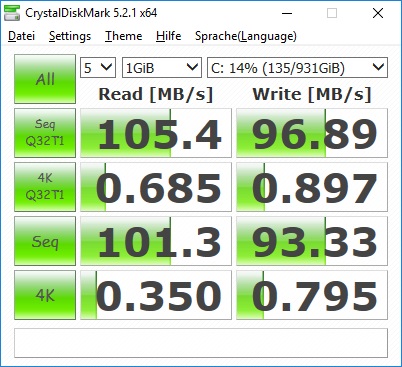
| Acer Aspire F5-771G-50RD Toshiba MQ01ABD100 | Acer Aspire E5-575G-549D Toshiba MQ01ABD100 | Acer Aspire F15 F5-573G-53V1 WDC Scorpio Blue WD10JPVX-22JC3T0 | Lenovo ThinkPad E570-20H6S00000 Toshiba THNSF5256GPUK | Asus F756UX-T7013T HGST Travelstar 5K1000 HTS541010A9E680 | Medion Erazer P7644 Phison 256GB PC3110-S10C | |
|---|---|---|---|---|---|---|
| CrystalDiskMark 3.0 | -6% | 21% | 18525% | 17% | 12918% | |
| Write 4k QD32 | 0.828 | 0.722 -13% | 0.884 7% | 319.2 38451% | 0.968 17% | 274.4 33040% |
| Read 4k QD32 | 0.666 | 0.647 -3% | 0.895 34% | 530 79480% | 0.812 22% | 305.7 45801% |
| Write 4k | 0.831 | 0.726 -13% | 0.9 8% | 123.4 14750% | 0.947 14% | 97.4 11621% |
| Read 4k | 0.331 | 0.366 11% | 0.413 25% | 34.3 10263% | 0.413 25% | 32.35 9673% |
| Write 512 | 27.34 | 25.93 -5% | 46.13 69% | 414 1414% | 39.12 43% | 389.1 1323% |
| Read 512 | 28.89 | 29.32 1% | 35.32 22% | 759 2527% | 33.33 15% | 384.5 1231% |
| Write Seq | 103.1 | 85.6 -17% | 105.6 2% | 468.1 354% | 105 2% | 393.3 281% |
| Read Seq | 107.1 | 95.3 -11% | 108.1 1% | 1140 964% | 105.8 -1% | 511 377% |

| 3DMark 11 - 1280x720 Performance GPU | |
| Acer Aspire E5-575G-549D | |
| Lenovo ThinkPad E570-20H6S00000 | |
| Acer Aspire F15 F5-573G-53V1 | |
| Acer Aspire F5-771G-50RD | |
| Medion Erazer P7644 | |
| Asus F756UX-T7013T | |
| 3DMark | |
| 1280x720 Cloud Gate Standard Graphics | |
| Acer Aspire E5-575G-549D | |
| Lenovo ThinkPad E570-20H6S00000 | |
| Acer Aspire F5-771G-50RD | |
| Acer Aspire F15 F5-573G-53V1 | |
| Medion Erazer P7644 | |
| Asus F756UX-T7013T | |
| 1920x1080 Fire Strike Graphics | |
| Acer Aspire E5-575G-549D | |
| Acer Aspire F15 F5-573G-53V1 | |
| Lenovo ThinkPad E570-20H6S00000 | |
| Acer Aspire F5-771G-50RD | |
| Medion Erazer P7644 | |
| Asus F756UX-T7013T | |
| 3DMark 11 Performance | 4228 points | |
| 3DMark Cloud Gate Standard Score | 10334 points | |
| 3DMark Fire Strike Score | 3218 points | |
Help | ||
| The Witcher 3 | |
| 1920x1080 Ultra Graphics & Postprocessing (HBAO+) | |
| Acer Aspire F5-771G-50RD | |
| 1920x1080 High Graphics & Postprocessing (Nvidia HairWorks Off) | |
| Asus F756UX-T7013T | |
| Acer Aspire F5-771G-50RD | |
| 1366x768 Medium Graphics & Postprocessing | |
| Acer Aspire F5-771G-50RD | |
| Asus F756UX-T7013T | |
| 1024x768 Low Graphics & Postprocessing | |
| Acer Aspire F5-771G-50RD | |
| Asus F756UX-T7013T | |
| Rise of the Tomb Raider | |
| 1920x1080 Very High Preset AA:FX AF:16x | |
| Acer Aspire F5-771G-50RD | |
| Acer Aspire F15 F5-573G-53V1 | |
| Acer Aspire E5-575G-549D | |
| 1920x1080 High Preset AA:FX AF:4x | |
| Acer Aspire F5-771G-50RD | |
| Lenovo ThinkPad E570-20H6S00000 | |
| Acer Aspire F15 F5-573G-53V1 | |
| Acer Aspire E5-575G-549D | |
| 1366x768 Medium Preset AF:2x | |
| Acer Aspire F5-771G-50RD | |
| Lenovo ThinkPad E570-20H6S00000 | |
| Acer Aspire F15 F5-573G-53V1 | |
| Acer Aspire E5-575G-549D | |
| 1024x768 Lowest Preset | |
| Lenovo ThinkPad E570-20H6S00000 | |
| Acer Aspire F5-771G-50RD | |
| Acer Aspire F15 F5-573G-53V1 | |
| Acer Aspire E5-575G-549D | |
| Dirt Rally | |
| 1920x1080 Ultra Preset AA:4x MS | |
| Acer Aspire F5-771G-50RD | |
| Acer Aspire E5-575G-549D | |
| Medion Erazer P7644 | |
| 1920x1080 High Preset | |
| Medion Erazer P7644 | |
| Acer Aspire E5-575G-549D | |
| Acer Aspire F5-771G-50RD | |
| 1366x768 Medium Preset | |
| Acer Aspire E5-575G-549D | |
| Medion Erazer P7644 | |
| Acer Aspire F5-771G-50RD | |
| 1024x768 Ultra Low Preset | |
| Acer Aspire E5-575G-549D | |
| Acer Aspire F5-771G-50RD | |
| Medion Erazer P7644 | |
| low | med. | high | ultra | |
| Dirt Rally (2015) | 137.2 | 77.7 | 40.05 | 25.1 |
| The Witcher 3 (2015) | 55.7 | 36.1 | 16.2 | 10.7 |
| Rise of the Tomb Raider (2016) | 71.4 | 40.98 | 23.08 | 20.33 |
Noise Level
| Idle |
| 31.5 / 31.5 / 31.6 dB(A) |
| HDD |
| 31.6 dB(A) |
| DVD |
| 34.4 / dB(A) |
| Load |
| 31.7 / 34.5 dB(A) |
 | ||
30 dB silent 40 dB(A) audible 50 dB(A) loud |
||
min: | ||
| Acer Aspire F5-771G-50RD GeForce GTX 950M, i5-7200U, Toshiba MQ01ABD100 | Acer Aspire E5-575G-549D GeForce GTX 950M, i5-7200U, Toshiba MQ01ABD100 | Acer Aspire F15 F5-573G-53V1 GeForce GTX 950M, 6200U, WDC Scorpio Blue WD10JPVX-22JC3T0 | Lenovo ThinkPad E570-20H6S00000 GeForce GTX 950M, i5-7200U, Toshiba THNSF5256GPUK | Asus F756UX-T7013T GeForce GTX 950M, 6200U, HGST Travelstar 5K1000 HTS541010A9E680 | Medion Erazer P7644 GeForce GTX 950M, 6500U, Phison 256GB PC3110-S10C | |
|---|---|---|---|---|---|---|
| Noise | -2% | -7% | 1% | -13% | -12% | |
| off / environment * | 30 | 28.9 4% | 31.2 -4% | 29 3% | 31.2 -4% | |
| Idle Minimum * | 31.5 | 30.8 2% | 32.4 -3% | 29 8% | 32.4 -3% | 33.4 -6% |
| Idle Average * | 31.5 | 30.8 2% | 33.5 -6% | 29 8% | 32.6 -3% | 33.4 -6% |
| Idle Maximum * | 31.6 | 30.8 3% | 33.5 -6% | 29 8% | 32.6 -3% | 33.4 -6% |
| Load Average * | 31.7 | 33.4 -5% | 35.2 -11% | 34.3 -8% | 42 -32% | 39.7 -25% |
| Witcher 3 ultra * | 31.4 | |||||
| Load Maximum * | 34.5 | 40.1 -16% | 38.7 -12% | 40.1 -16% | 45.2 -31% | 40.1 -16% |
* ... smaller is better
(±) The maximum temperature on the upper side is 41.9 °C / 107 F, compared to the average of 36.9 °C / 98 F, ranging from 21.1 to 71 °C for the class Multimedia.
(-) The bottom heats up to a maximum of 55.8 °C / 132 F, compared to the average of 39.1 °C / 102 F
(+) In idle usage, the average temperature for the upper side is 23.9 °C / 75 F, compared to the device average of 31.2 °C / 88 F.
(+) Playing The Witcher 3, the average temperature for the upper side is 28.4 °C / 83 F, compared to the device average of 31.2 °C / 88 F.
(±) The palmrests and touchpad can get very hot to the touch with a maximum of 37.5 °C / 99.5 F.
(-) The average temperature of the palmrest area of similar devices was 28.8 °C / 83.8 F (-8.7 °C / -15.7 F).
Acer Aspire F5-771G-50RD audio analysis
(±) | speaker loudness is average but good (78 dB)
Bass 100 - 315 Hz
(±) | reduced bass - on average 9.7% lower than median
(+) | bass is linear (6.5% delta to prev. frequency)
Mids 400 - 2000 Hz
(+) | balanced mids - only 3.6% away from median
(±) | linearity of mids is average (8.2% delta to prev. frequency)
Highs 2 - 16 kHz
(±) | higher highs - on average 8.7% higher than median
(±) | linearity of highs is average (8.5% delta to prev. frequency)
Overall 100 - 16.000 Hz
(±) | linearity of overall sound is average (20.7% difference to median)
Compared to same class
» 67% of all tested devices in this class were better, 9% similar, 25% worse
» The best had a delta of 5%, average was 18%, worst was 45%
Compared to all devices tested
» 50% of all tested devices were better, 8% similar, 42% worse
» The best had a delta of 4%, average was 25%, worst was 134%
Lenovo ThinkPad E570-20H6S00000 audio analysis
(±) | speaker loudness is average but good (80.7 dB)
Bass 100 - 315 Hz
(-) | nearly no bass - on average 16.8% lower than median
(-) | bass is not linear (16.4% delta to prev. frequency)
Mids 400 - 2000 Hz
(±) | higher mids - on average 5.1% higher than median
(±) | linearity of mids is average (9.5% delta to prev. frequency)
Highs 2 - 16 kHz
(+) | balanced highs - only 2.7% away from median
(+) | highs are linear (6.5% delta to prev. frequency)
Overall 100 - 16.000 Hz
(±) | linearity of overall sound is average (19.6% difference to median)
Compared to same class
» 60% of all tested devices in this class were better, 8% similar, 33% worse
» The best had a delta of 5%, average was 18%, worst was 45%
Compared to all devices tested
» 44% of all tested devices were better, 7% similar, 49% worse
» The best had a delta of 4%, average was 25%, worst was 134%
| Off / Standby | |
| Idle | |
| Load |
|
| Acer Aspire F5-771G-50RD i5-7200U, GeForce GTX 950M, Toshiba MQ01ABD100, TN, 1920x1080, 17.30 | Acer Aspire E5-575G-549D i5-7200U, GeForce GTX 950M, Toshiba MQ01ABD100, TN, 1920x1080, 15.60 | Acer Aspire F15 F5-573G-53V1 6200U, GeForce GTX 950M, WDC Scorpio Blue WD10JPVX-22JC3T0, TN WLED, 1920x1080, 15.60 | Lenovo ThinkPad E570-20H6S00000 i5-7200U, GeForce GTX 950M, Toshiba THNSF5256GPUK, IPS LED, 1920x1080, 15.60 | Asus F756UX-T7013T 6200U, GeForce GTX 950M, HGST Travelstar 5K1000 HTS541010A9E680, TN LED, 1920x1080, 17.30 | Medion Erazer P7644 6500U, GeForce GTX 950M, Phison 256GB PC3110-S10C, IPS, 1920x1080, 17.30 | |
|---|---|---|---|---|---|---|
| Power Consumption | 10% | -9% | 29% | 2% | -16% | |
| Idle Minimum * | 6.9 | 6 13% | 8.3 -20% | 2.8 59% | 5.8 16% | 8.9 -29% |
| Idle Average * | 13.6 | 8.1 40% | 12.1 11% | 6.3 54% | 11.2 18% | 13.3 2% |
| Idle Maximum * | 14.8 | 9.8 34% | 15.4 -4% | 6.9 53% | 11.9 20% | 14.1 5% |
| Load Average * | 41 | 52.5 -28% | 56 -37% | 51.6 -26% | 54 -32% | 60 -46% |
| Witcher 3 ultra * | 33 | |||||
| Load Maximum * | 75 | 81.6 -9% | 70 7% | 69.7 7% | 84 -12% | 83 -11% |
* ... smaller is better
| Acer Aspire F5-771G-50RD i5-7200U, GeForce GTX 950M, 40 Wh | Acer Aspire E5-575G-549D i5-7200U, GeForce GTX 950M, 62 Wh | Acer Aspire F15 F5-573G-53V1 6200U, GeForce GTX 950M, 62 Wh | Lenovo ThinkPad E570-20H6S00000 i5-7200U, GeForce GTX 950M, 41 Wh | Asus F756UX-T7013T 6200U, GeForce GTX 950M, 38 Wh | Medion Erazer P7644 6500U, GeForce GTX 950M, 48 Wh | |
|---|---|---|---|---|---|---|
| Battery Runtime | 44% | 58% | 75% | -6% | 7% | |
| Reader / Idle | 429 | 767 79% | 667 55% | 883 106% | 491 14% | |
| WiFi v1.3 | 268 | 451 68% | 386 44% | 462 72% | 217 -19% | 287 7% |
| Load | 87 | 75 -14% | 152 75% | 129 48% | 75 -14% | |
| H.264 | 460 | 335 |
Pros
Cons
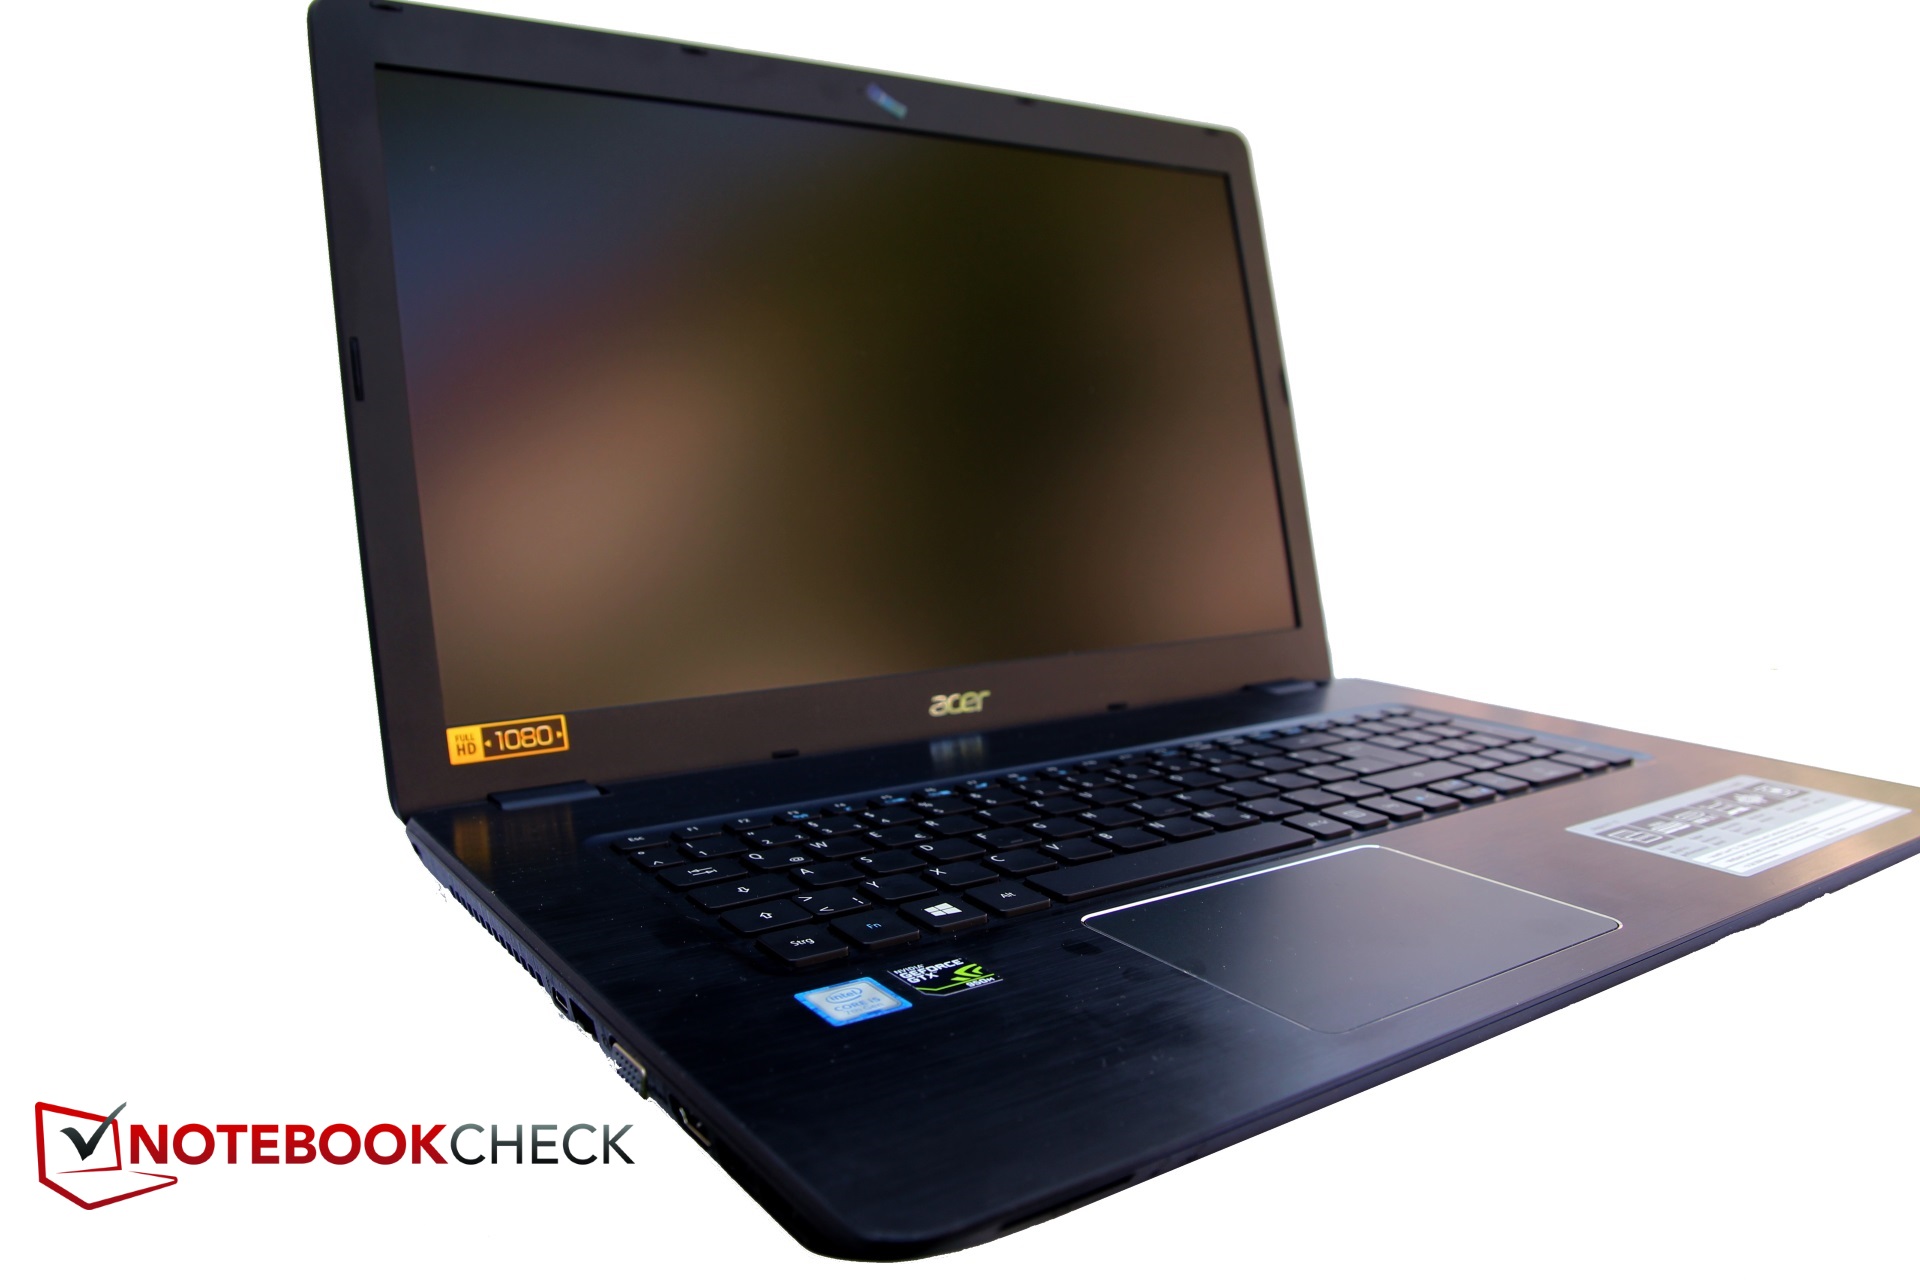
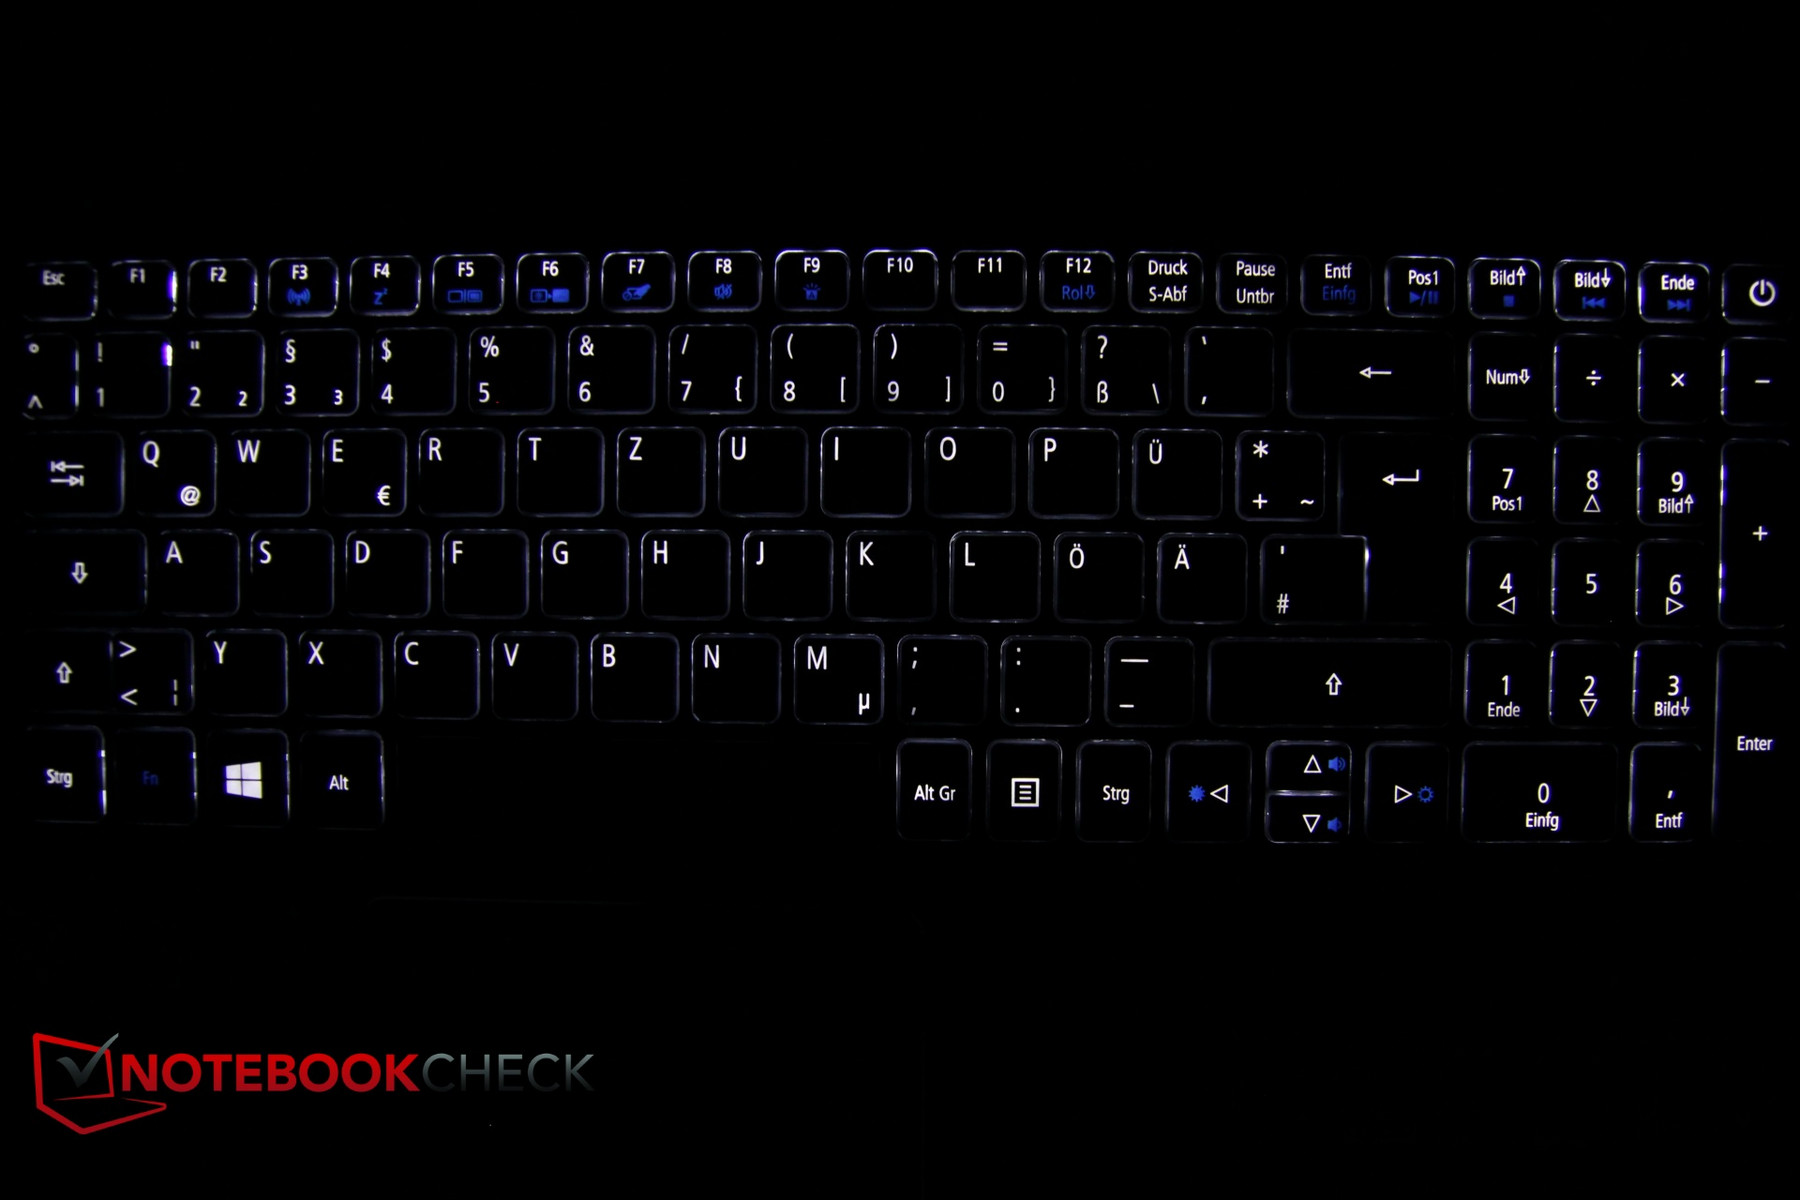
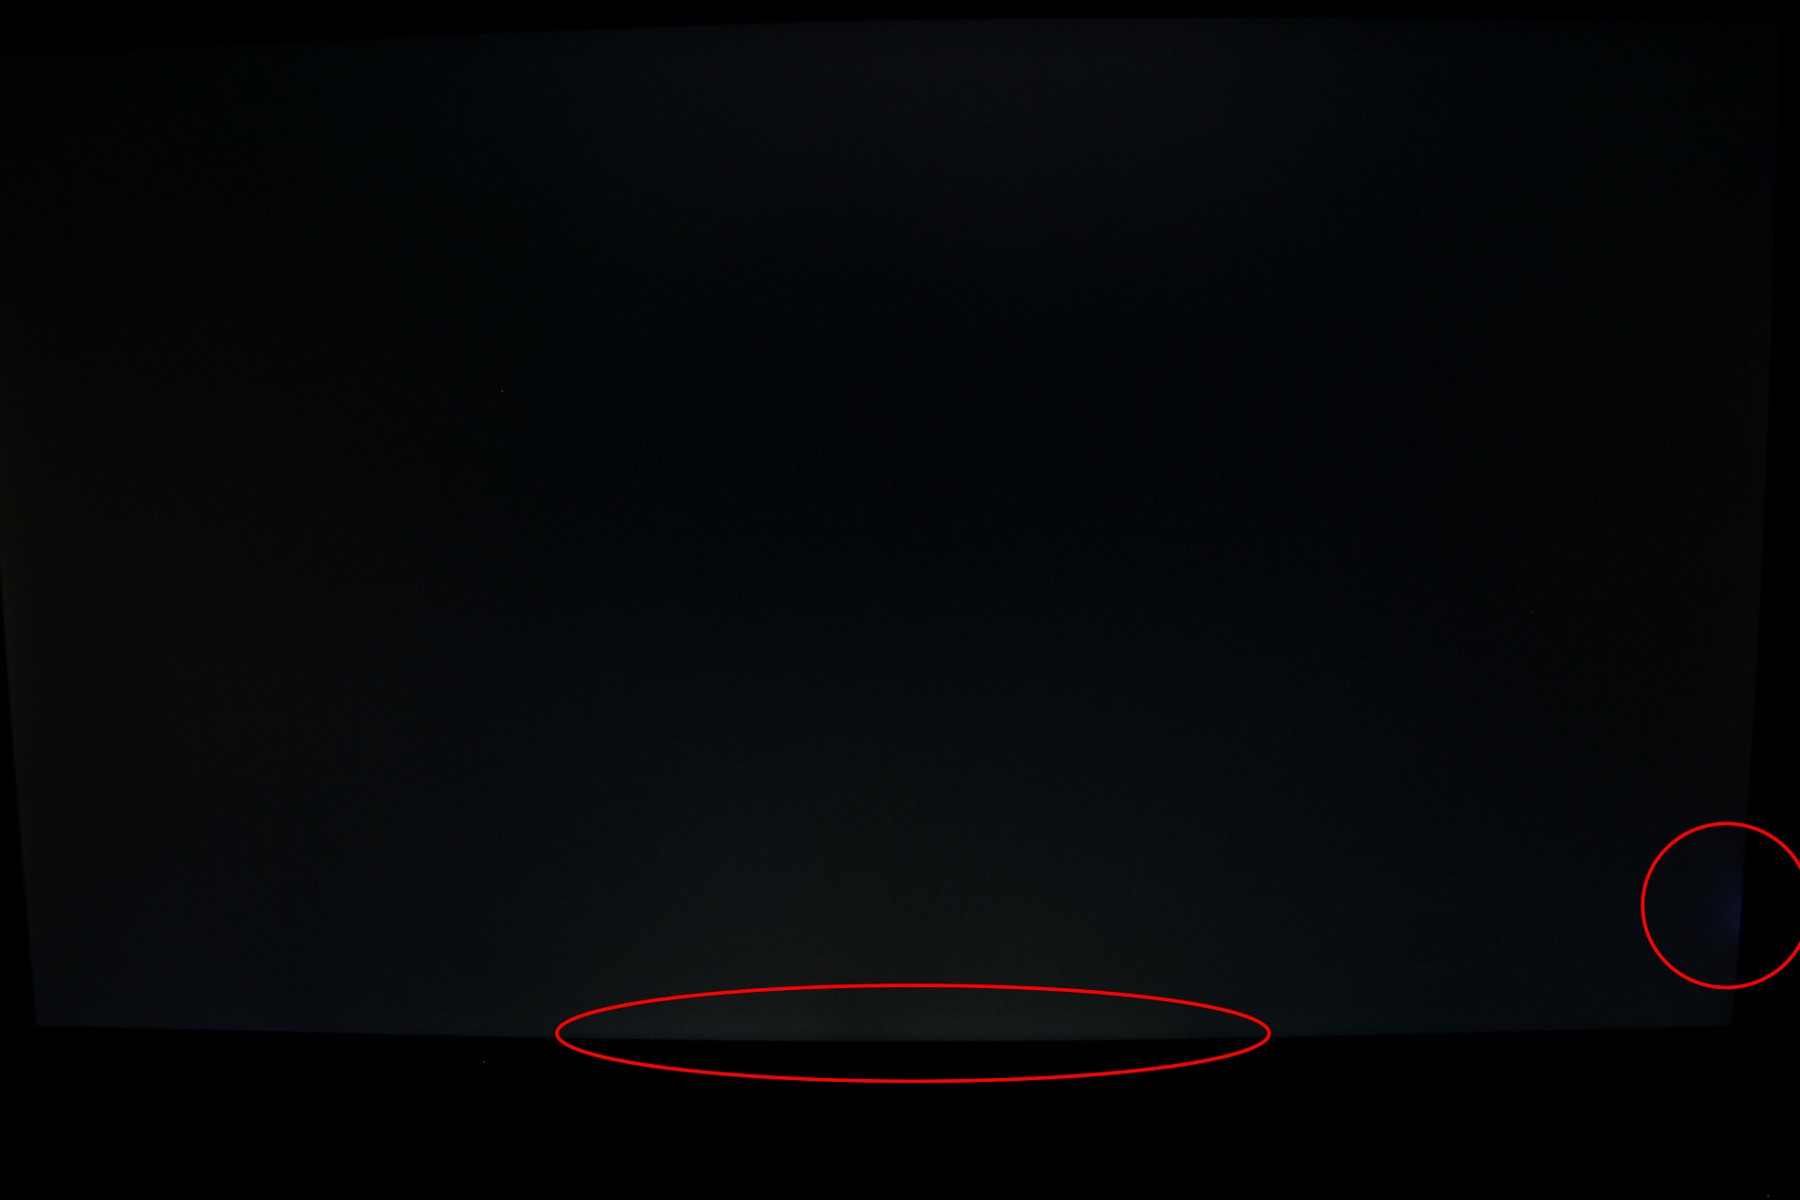
宏碁Aspire F17 F5-771G是一台价位实惠,品质优秀的全功能型设备,目前售价699欧元(约800美元)。不过,它的入门型号没有搭配高速固态硬盘,也没有预装操作系统,不过对于已经购买过Windows的用户来说并不是太大的问题。它的缺点包括屏幕的轻微漏光,容量较小的电池和按键较小的键盘。整体上,它的优势多于缺点。
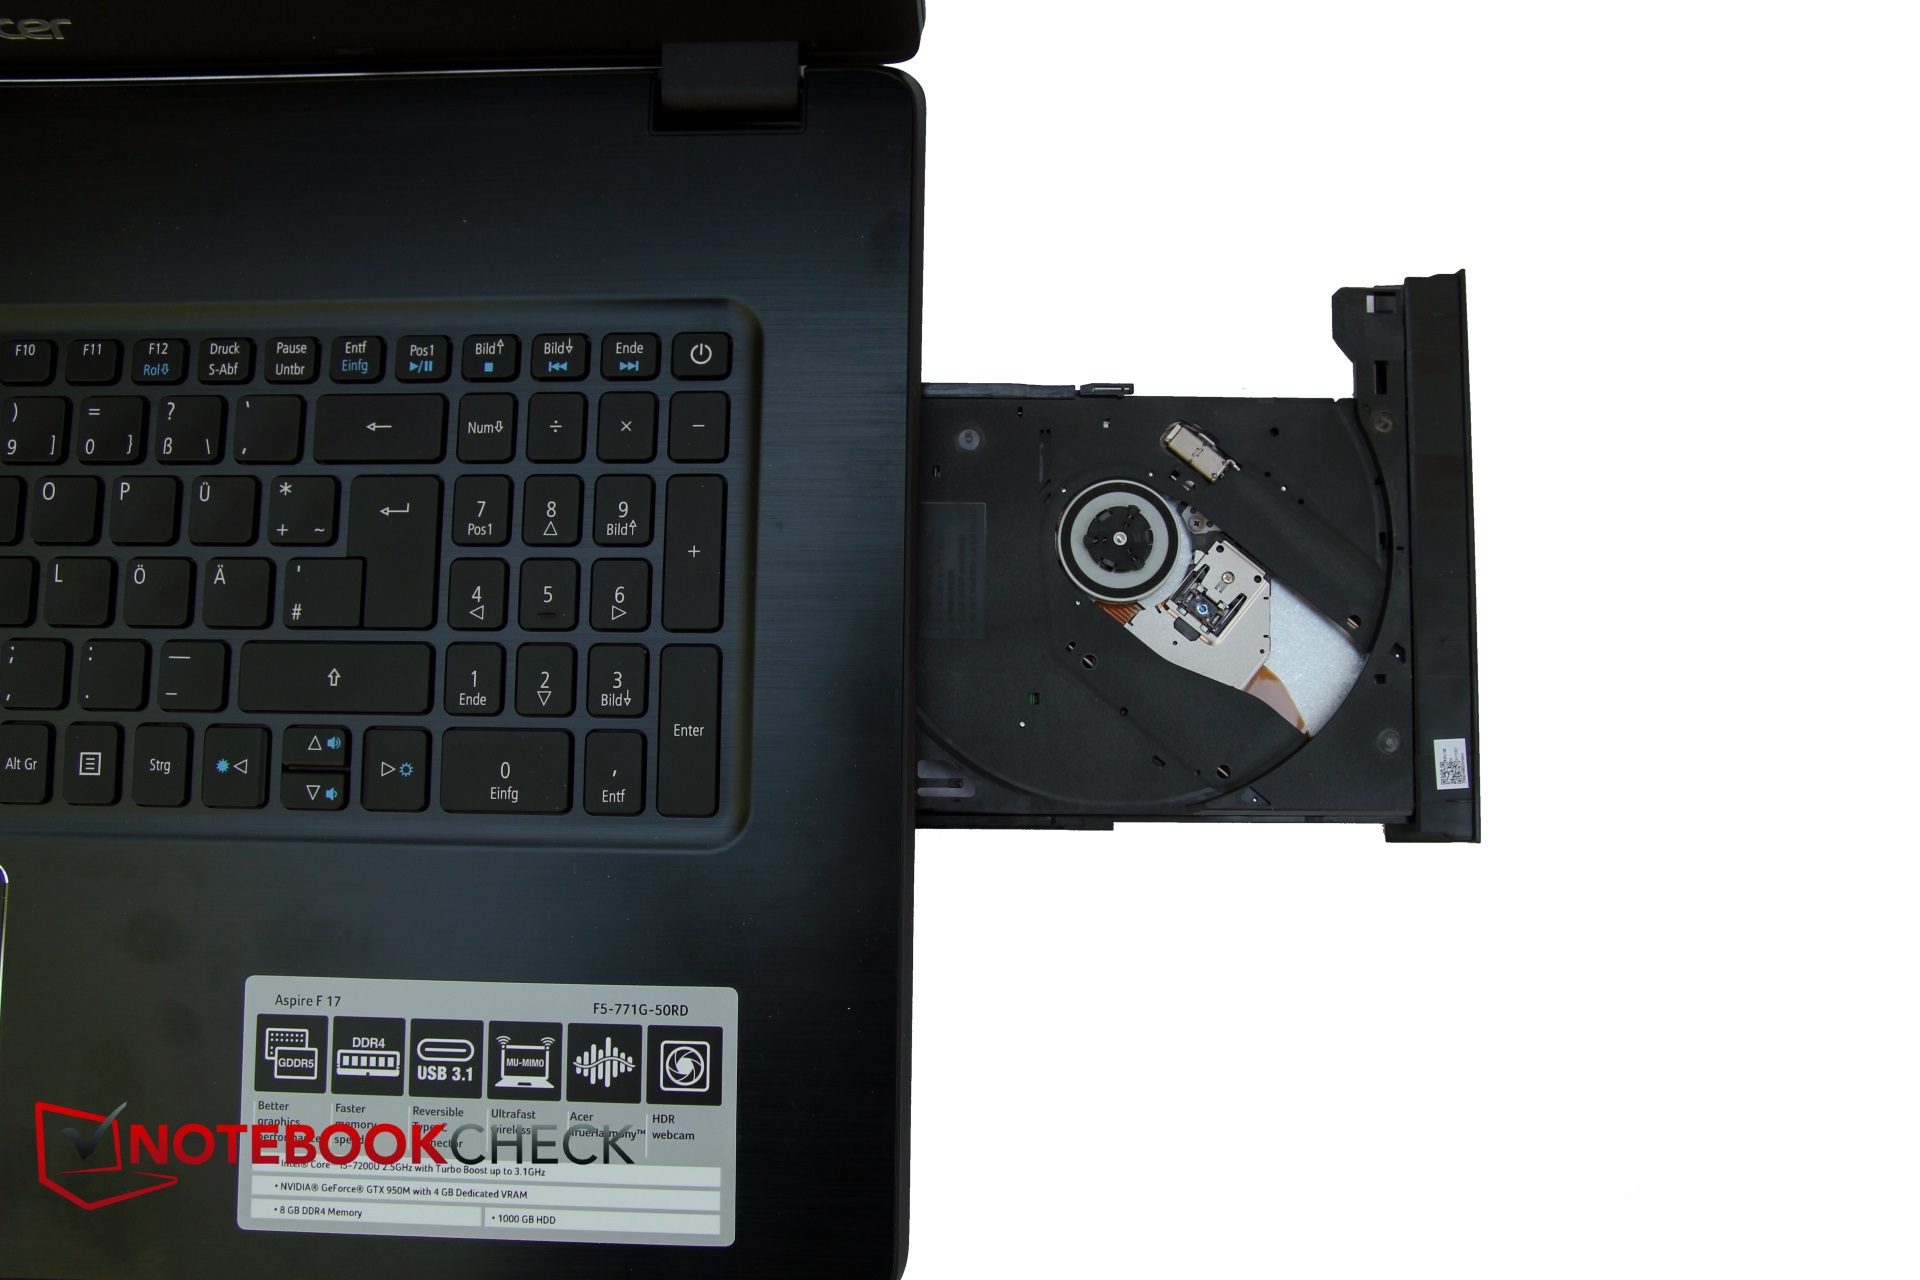
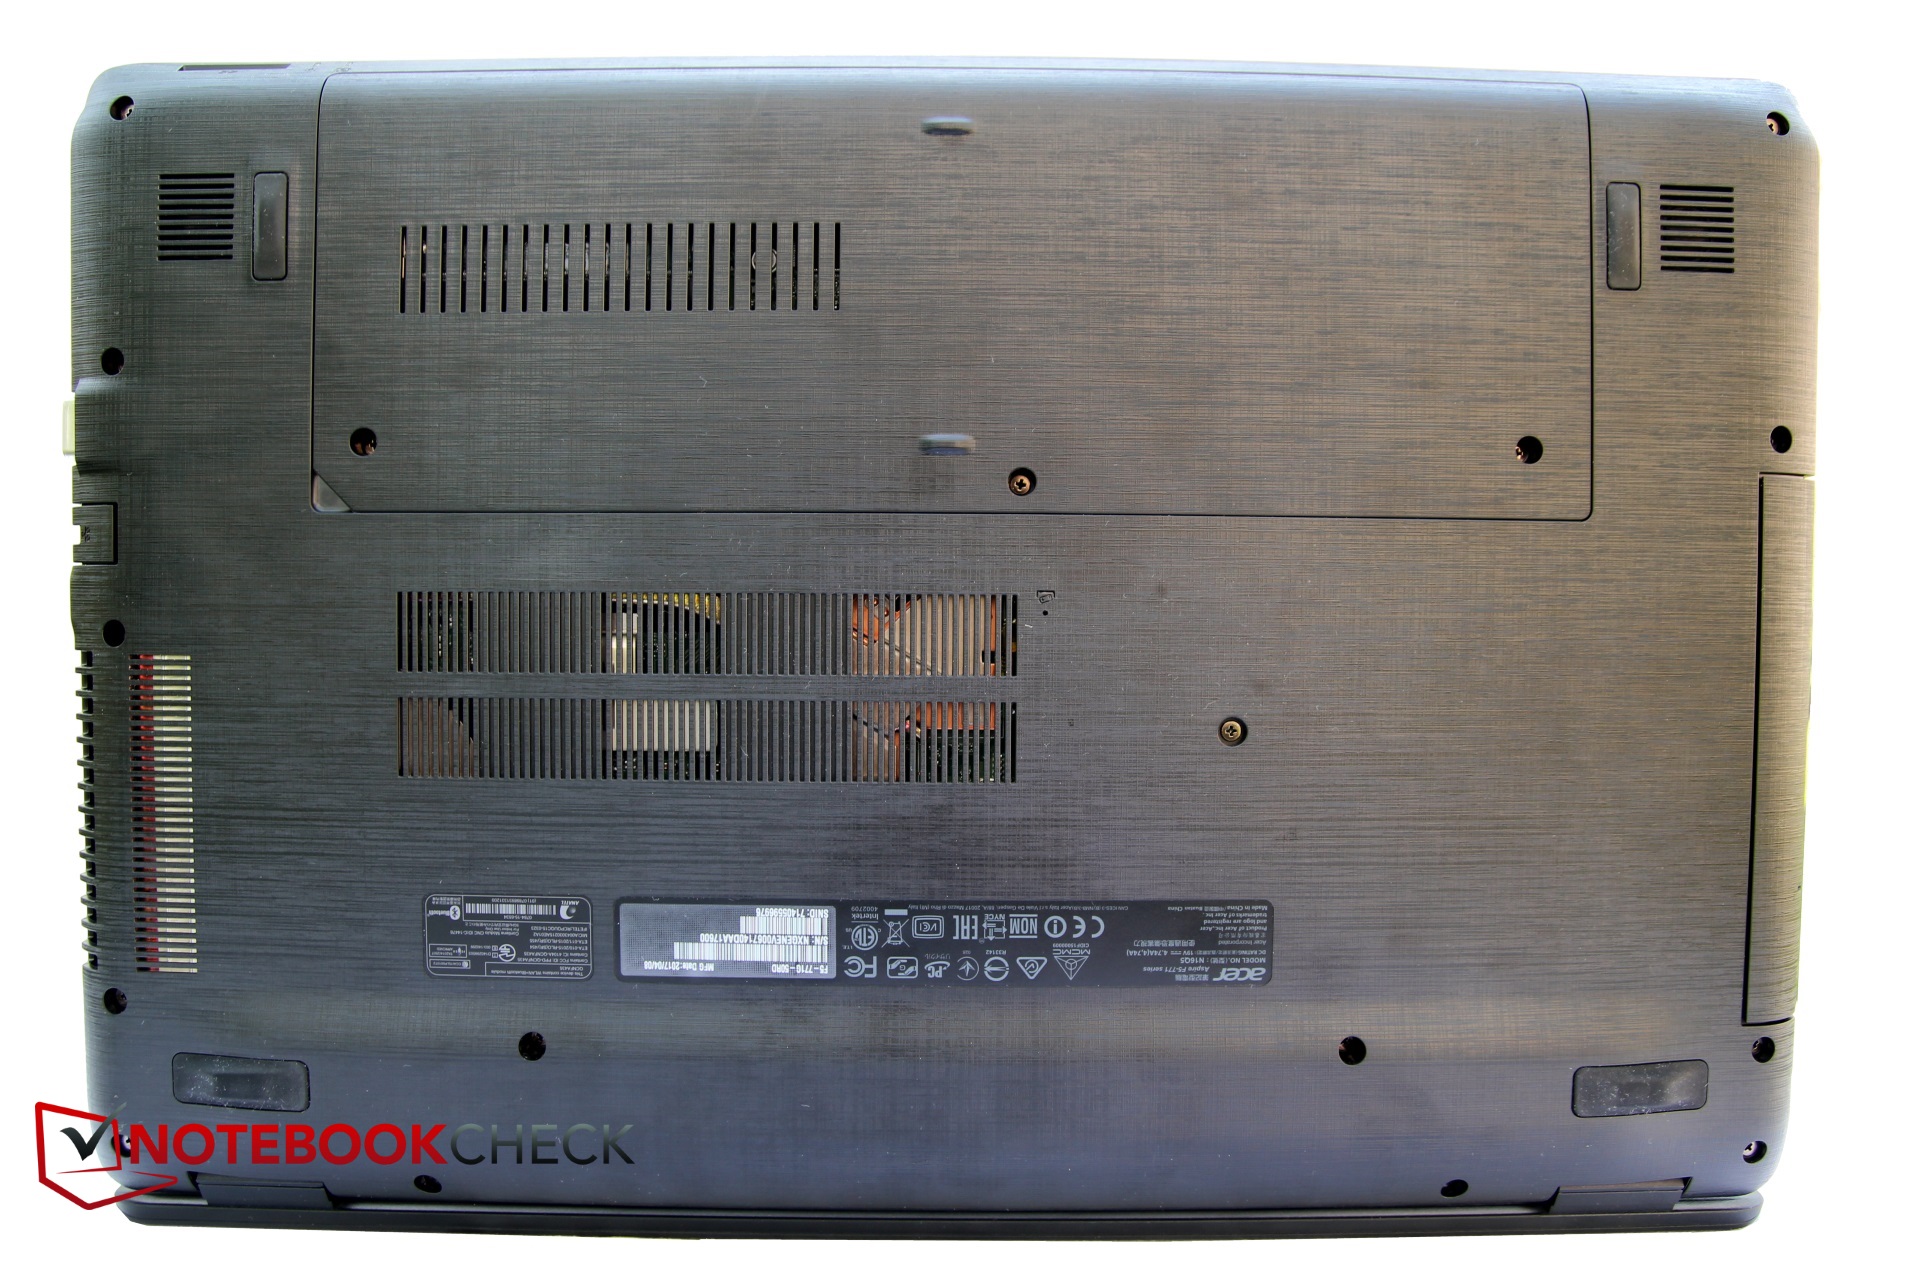
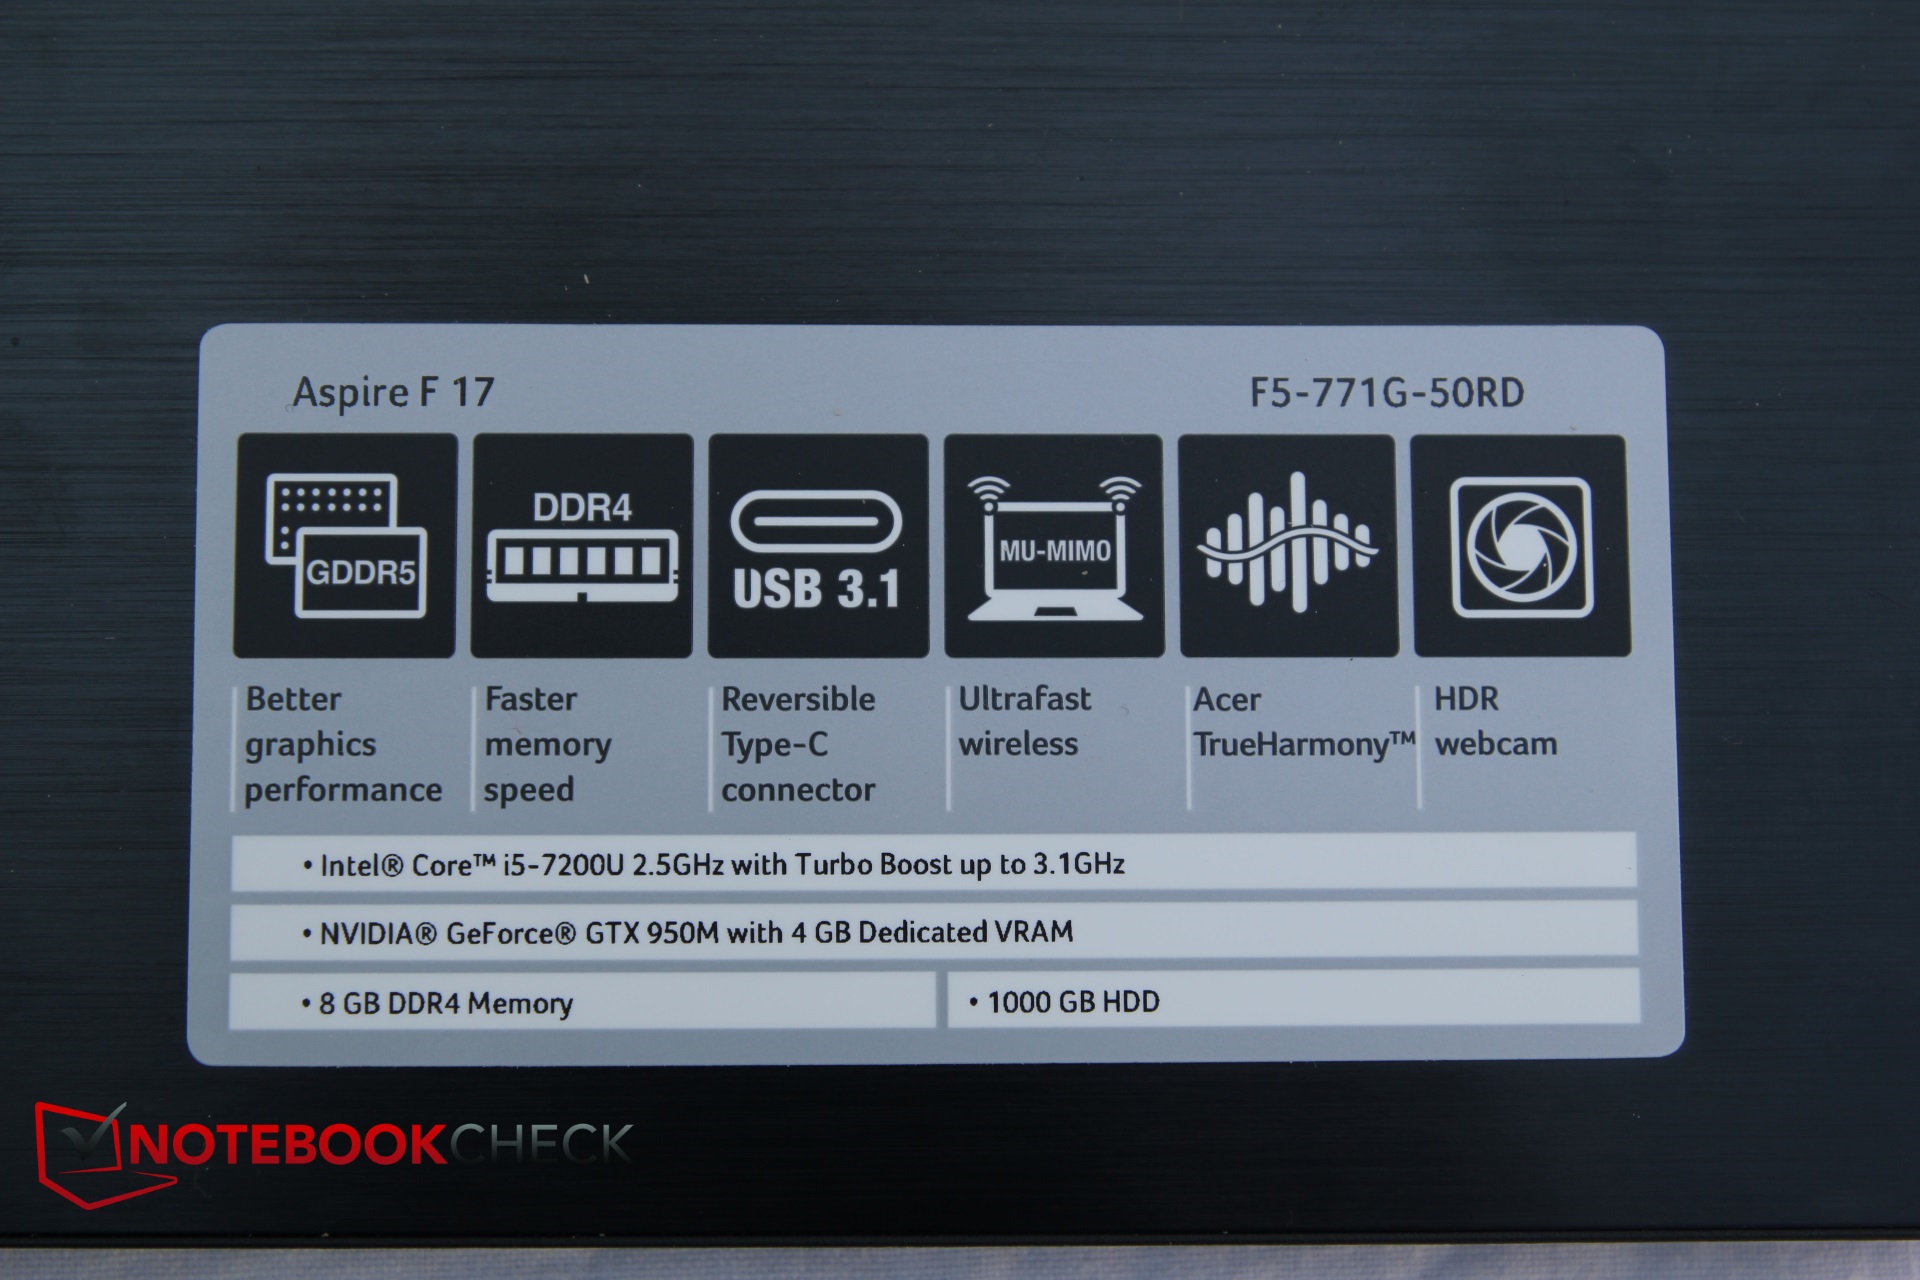
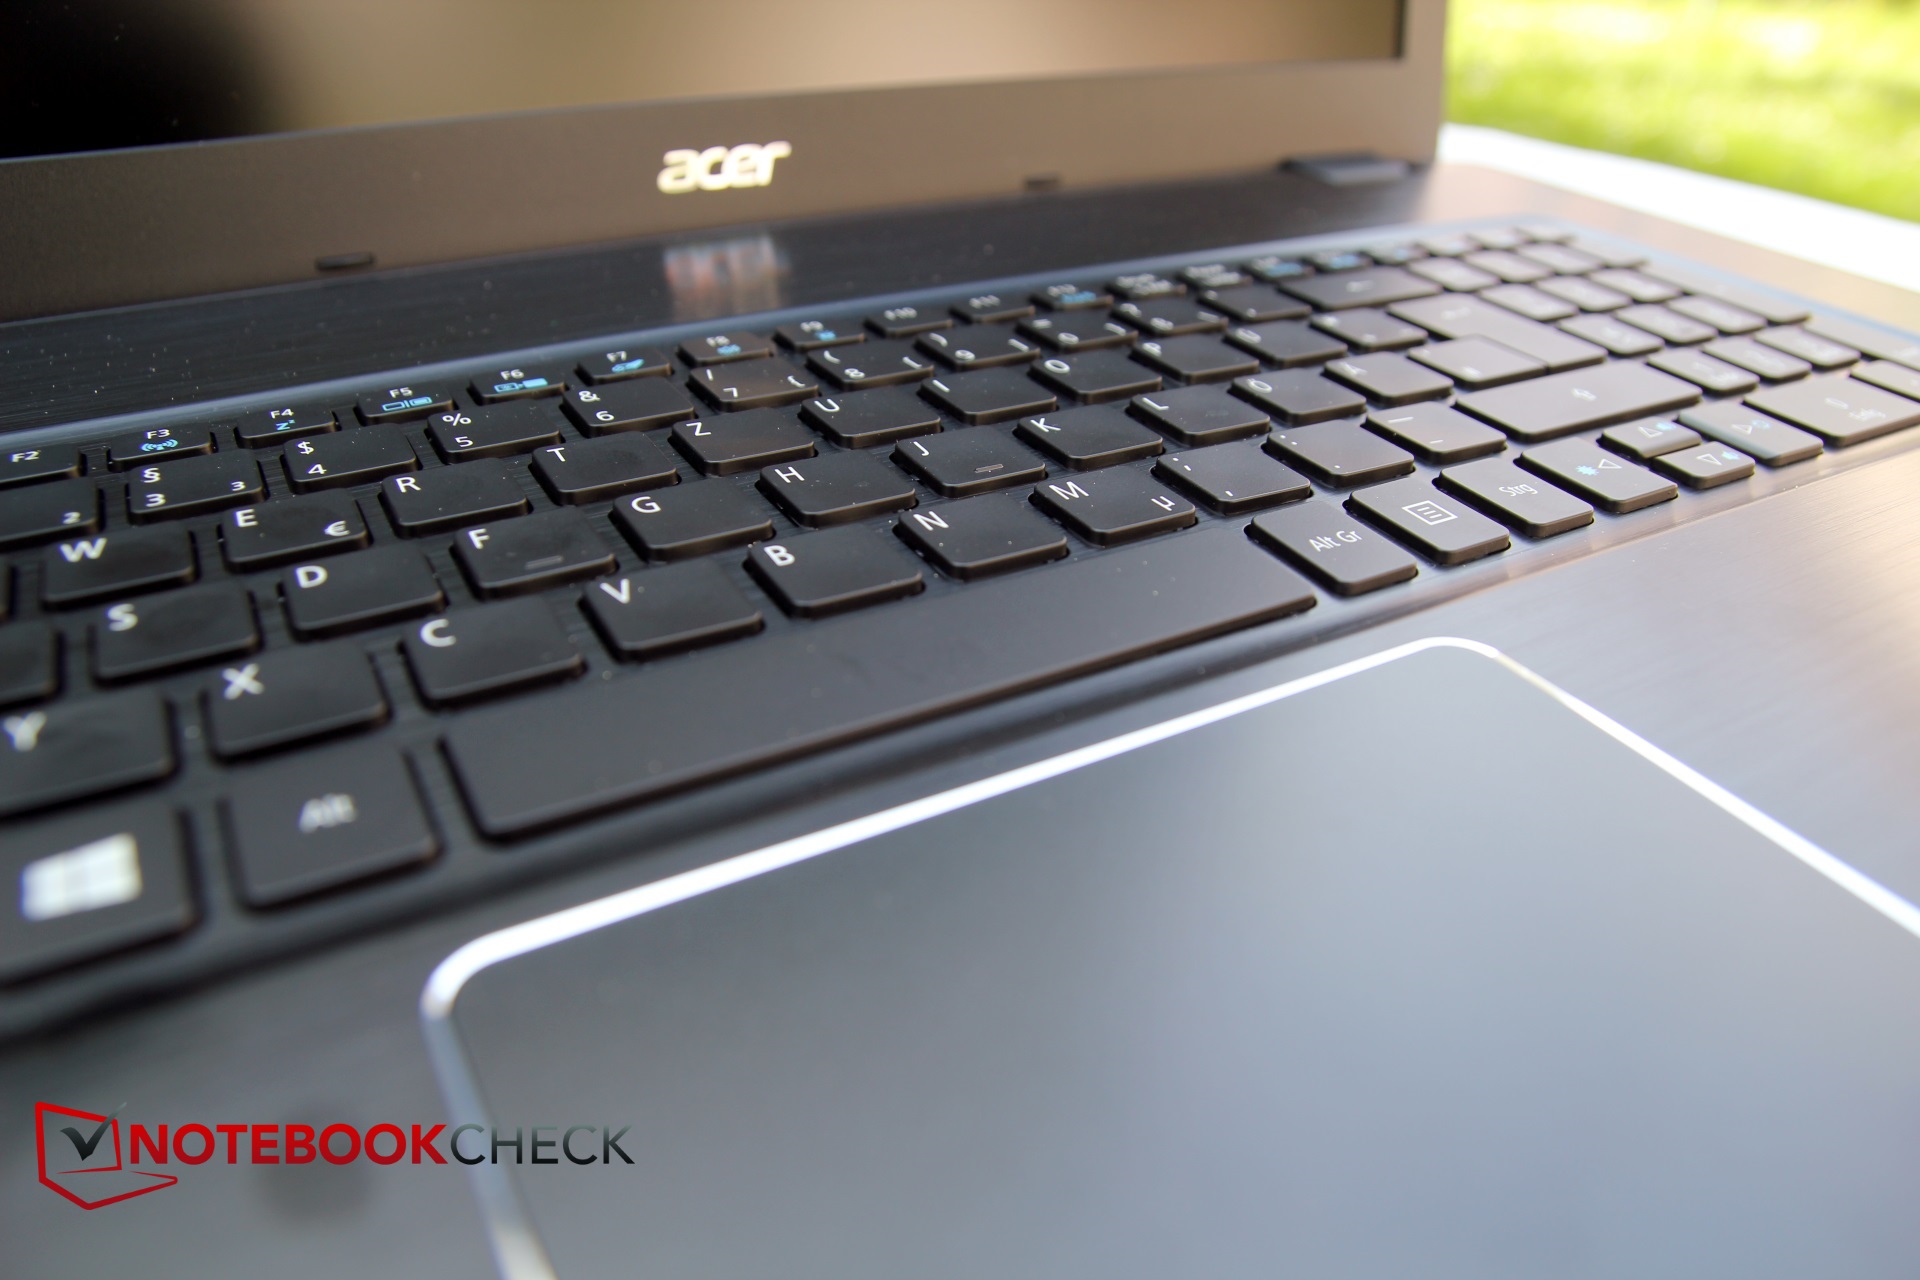
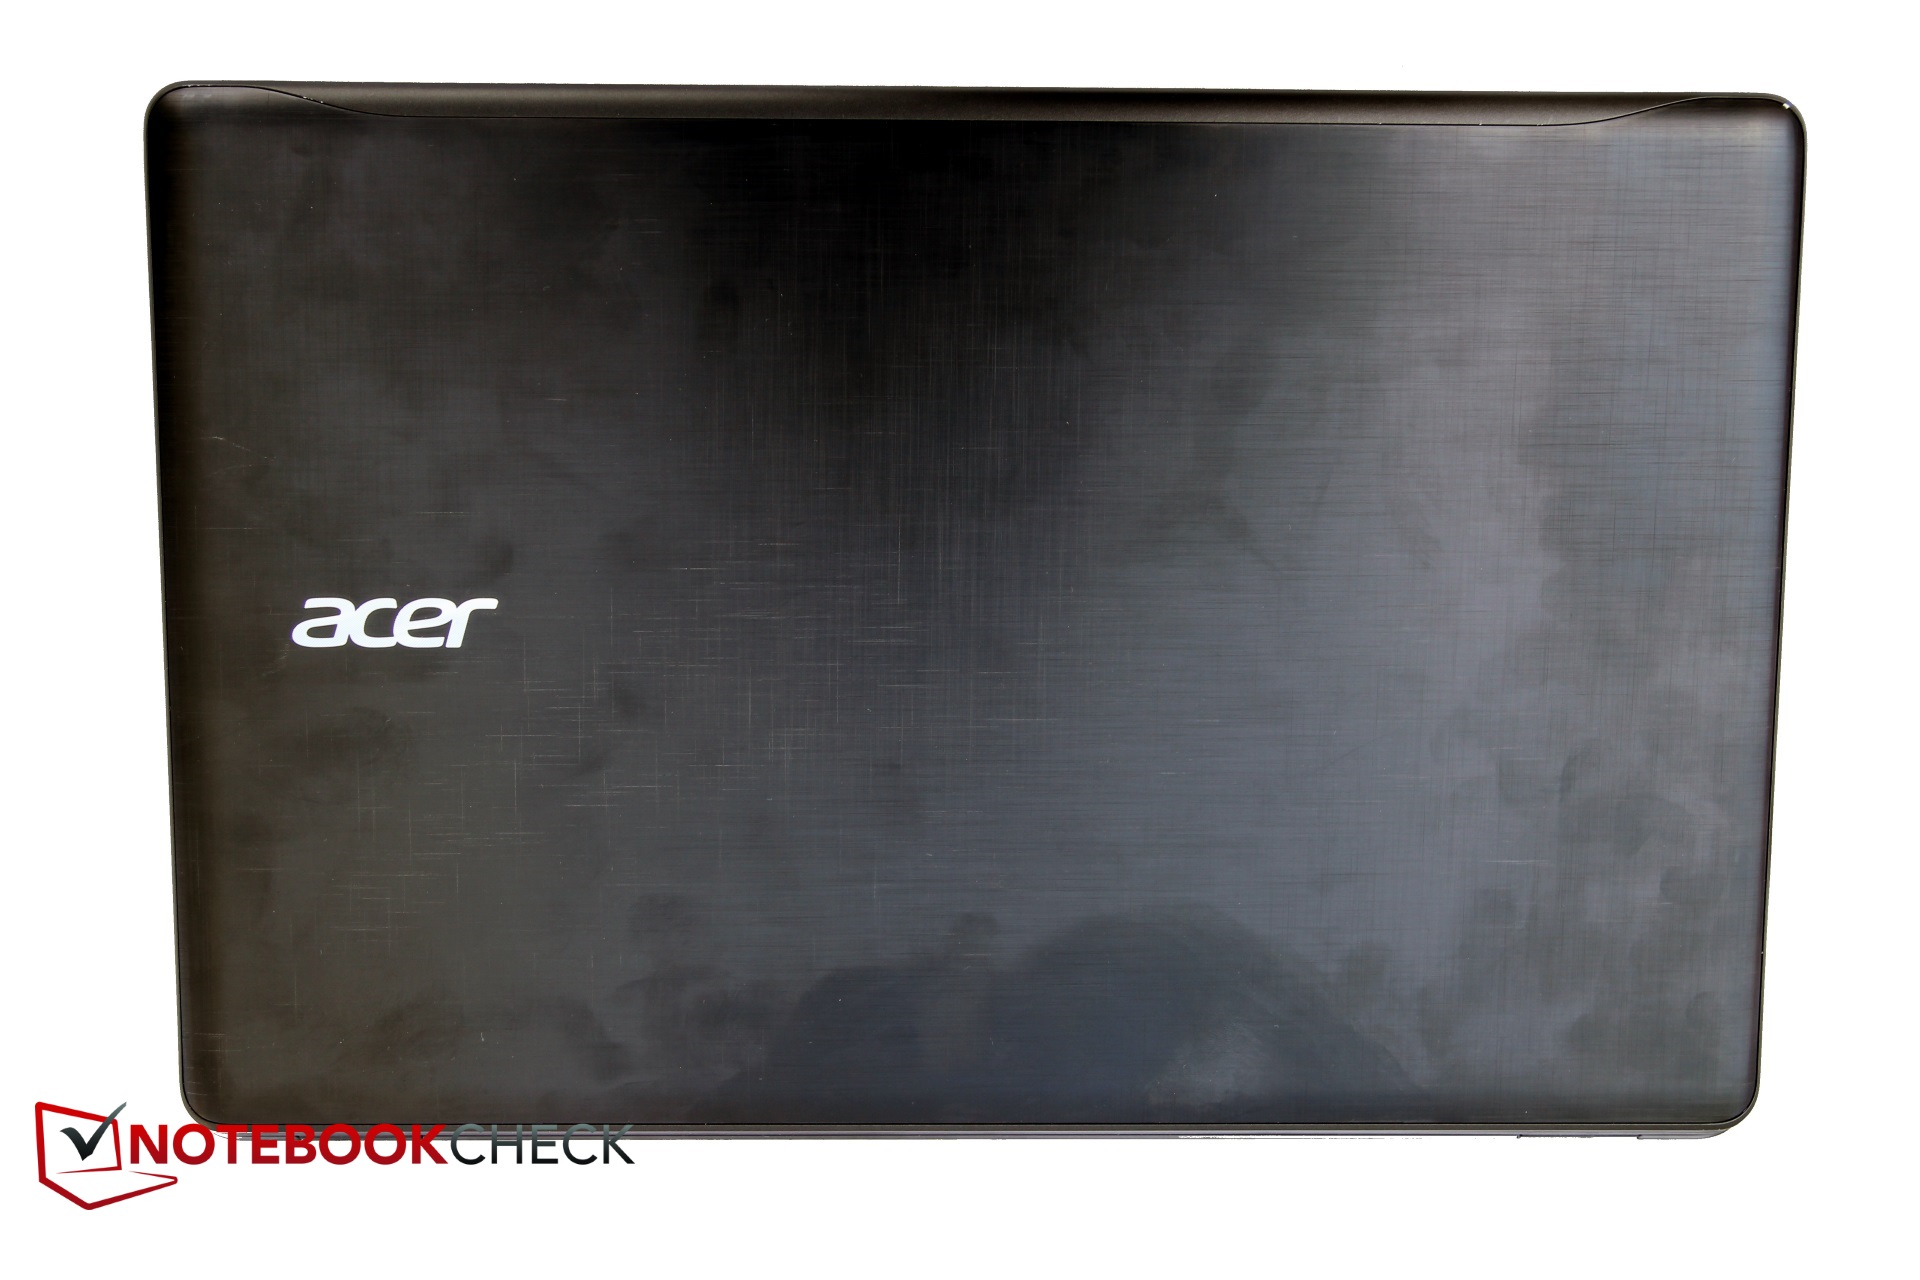
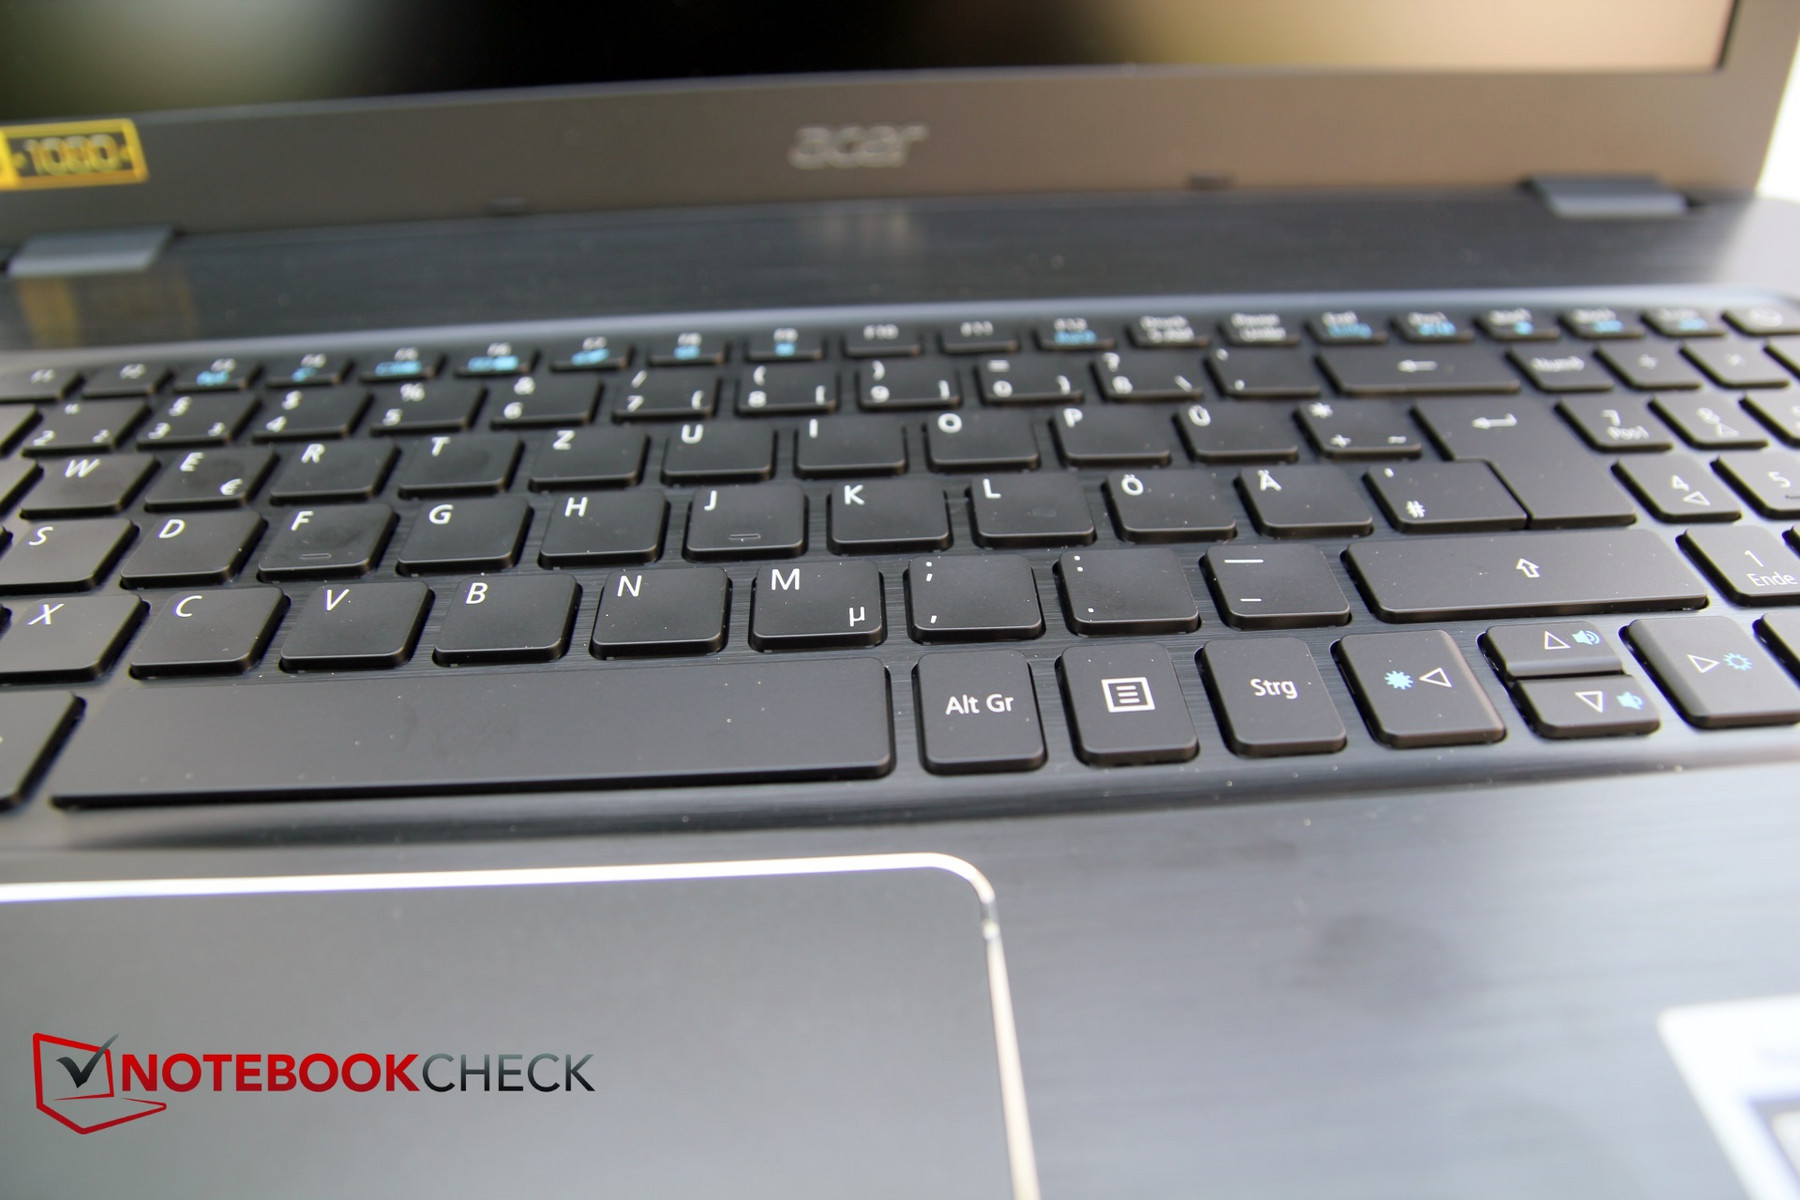
特别是,我们很喜欢它在负载下的安静运行。在性能和同类设备相近的前提下,它相对明显更安静,这对于游戏玩家来说有不小的好处。另外一方面,它的风扇在待机时也会保持运行,显卡也会在负载下降频。铝合金的屏幕上盖和键盘掌托也是不小的优势,其他宏碁的同价位设备都没有采用这样的设计。硬盘和内存的升级维护也十分方便,不过风扇的和电池则相对困难。
宏碁的这台实惠型高品质17寸全能型设备在负载下也可以保持非常安静。
搭配了不错的全面硬件配置,这台大尺寸笔记本电脑十分适合家庭用户,休闲游戏玩家和视频编辑爱好者。尽管它性能全面,但是便携性受到尺寸和重量以及一般电池续航的限制而十分有限。
注:本文是基于完整评测的缩减版本,阅读完整的英文评测,请点击这里。
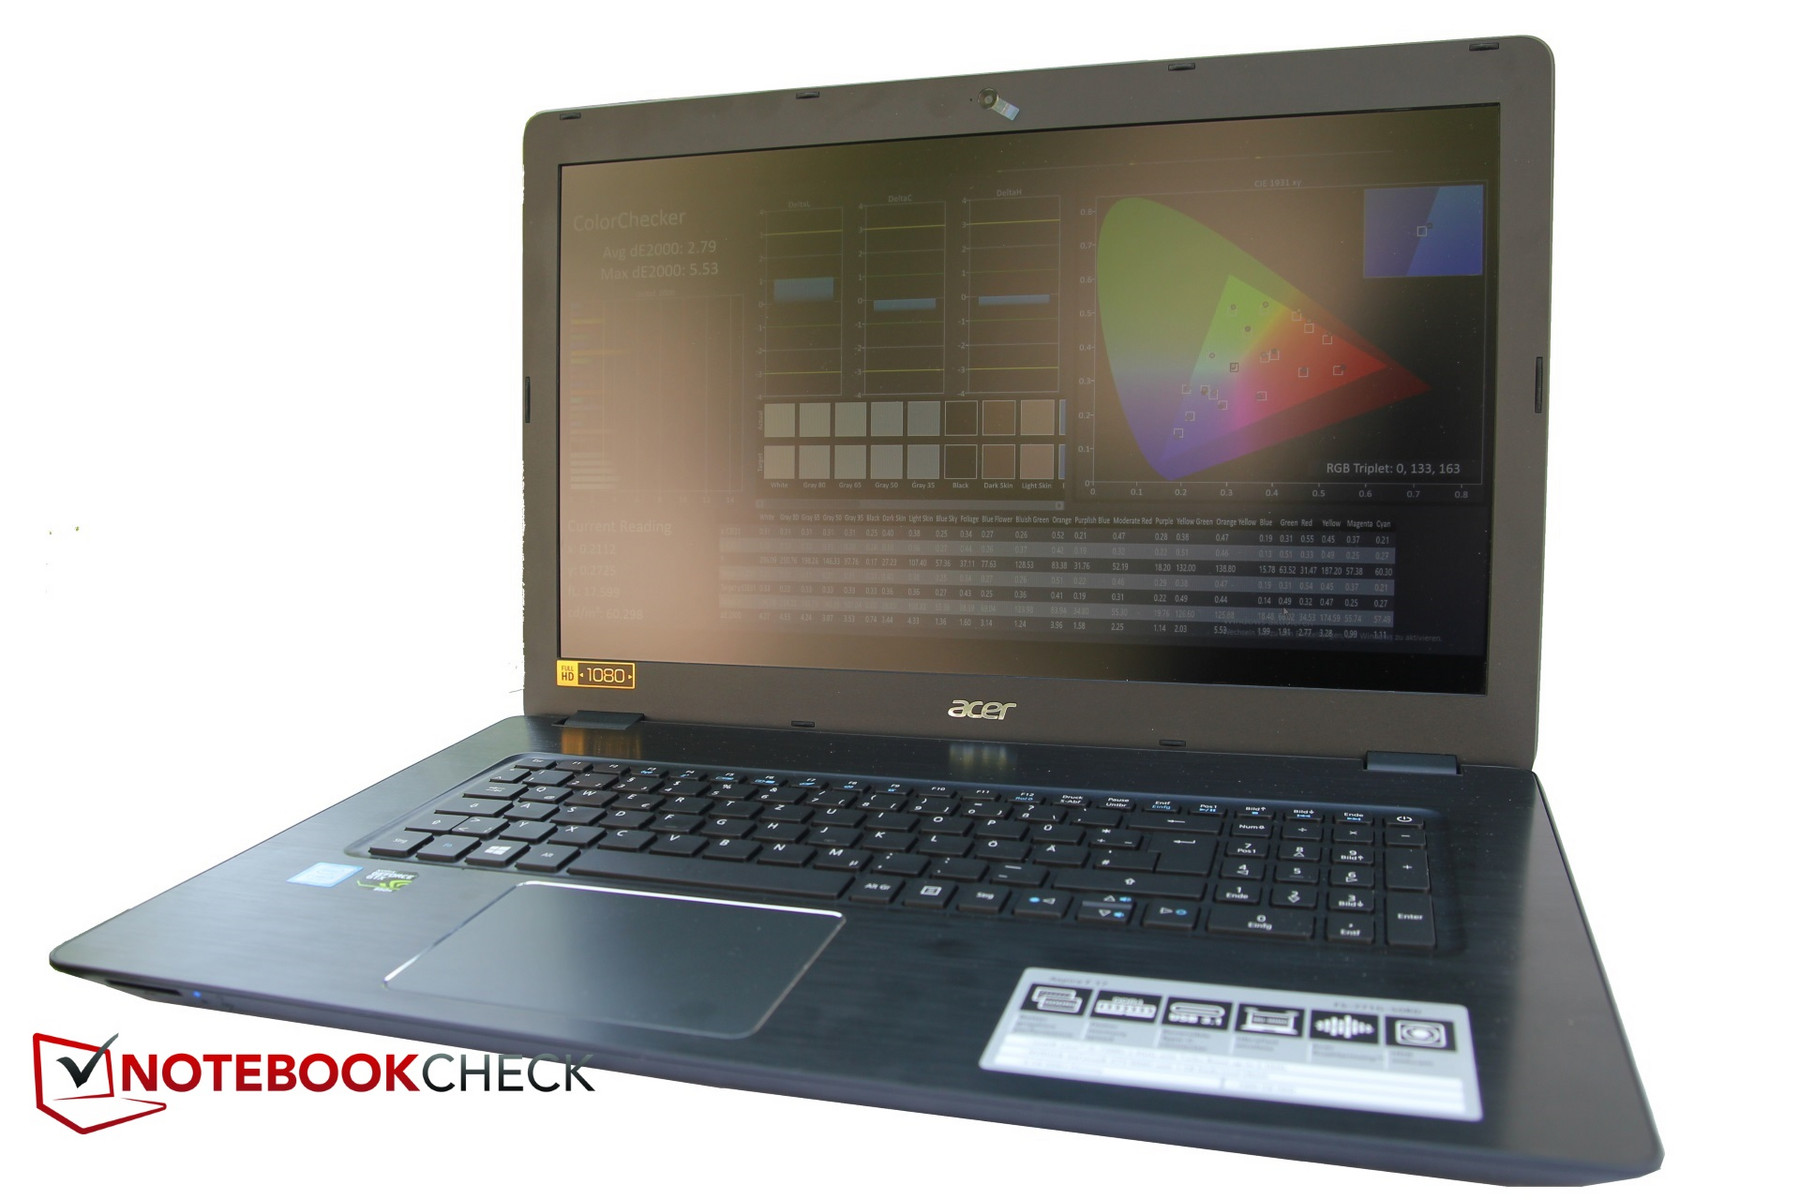
Acer Aspire F5-771G-50RD
-
05/18/2017 v6(old)
Christian Hintze
Pricecompare
